1. Introduction
The Large Hadron Collider beauty experiment (LHCb) is a single arm spectrometer designed to measure the decay properties of heavy hadrons and study CP violation [
1]. The apparatus is made with a vertex locator [
2], ring imaging Cherenkov (RICH) and tracking systems [
3,
4,
5], an electromagnetic and a hadronic calorimeter [
6] and a muon detector [
7]. Data presented in this paper were collected with a muon detector composed by five stations, four placed downstream of the calorimeters (M2–M5) and the first (M1) positioned upstream, with the purpose of quickly providing information to measure muon transverse momentum for the hardware trigger, L0.
A precise measurement of LHC luminosity (
) at the LHCb interaction point is needed for any cross-section measurement. In the first years of data collection (Run 1: 2009–2013 and Run 2: 2015–2018), online luminosity measurement was mainly based on the released transverse energy provided by the calorimeters through the hardware trigger system. This method will not be available in the next data collection campaign (Run 3: 2022–2025), due to the implementation of a software only trigger [
8,
9,
10]. In particular, the first station (M1) has been removed and the muon detector is now composed of four stations (M2–M5), comprising 1104 multi-wire proportional chambers (MWPC). The new software trigger, together with the expected increased occupancies, is also the reason for the upgrading of the muon system [
11].
A luminosity control system was developed to stabilize the data-collection conditions and to maximize the efficiency of the data acquisition. The instantaneous luminosity at LHCb is continuously controlled and tuned to be within of its target value. This process is often referred to as luminosity levelling.
Different studies have demonstrated an efficiency larger than 95% in detecting minimum ionising particles with a single muon multi-wire proportional chamber [
12,
13,
14,
15,
16] remaining essentially stable even in case of small changes in the working conditions.
Therefore, the signal rate recorded by the muon system per time unit is potentially a good tool to estimate the value of the luminosity. The aim of this work is to evaluate the precision that those rates can provide to directly infer luminosity and to quantify linearity lack effects or instabilities due to other contributions such as, for example, radiation not originating from beam–beam interactions or electronics noise and detector inefficiency variations.
A first study in this direction has been carried out by analyzing the data collected during special
runs performed in 2012 at different luminosities. The method, based on previous studies of the performance of MWPC chambers in high luminosity runs [
17], realizes a new approach to online luminosity measurements. Its main results will be discussed in the following.
In the future, the use of the new data readout based on optical links [
18] will allow to collect the information on hit rates from the whole muon system in a few seconds, making this method a useful tool for Run 3 or future Runs at even higher luminosities, to provide a reliable online luminosity monitoring.
These measurements will be of crucial importance to provide even better luminosity levelling for LHCb. The purpose of this research is to show how a precision of the order of 1% in luminosity evaluation can be achieved on-line using the hit rate of the muon system, without any further software analysis.
2. Experimental Setup
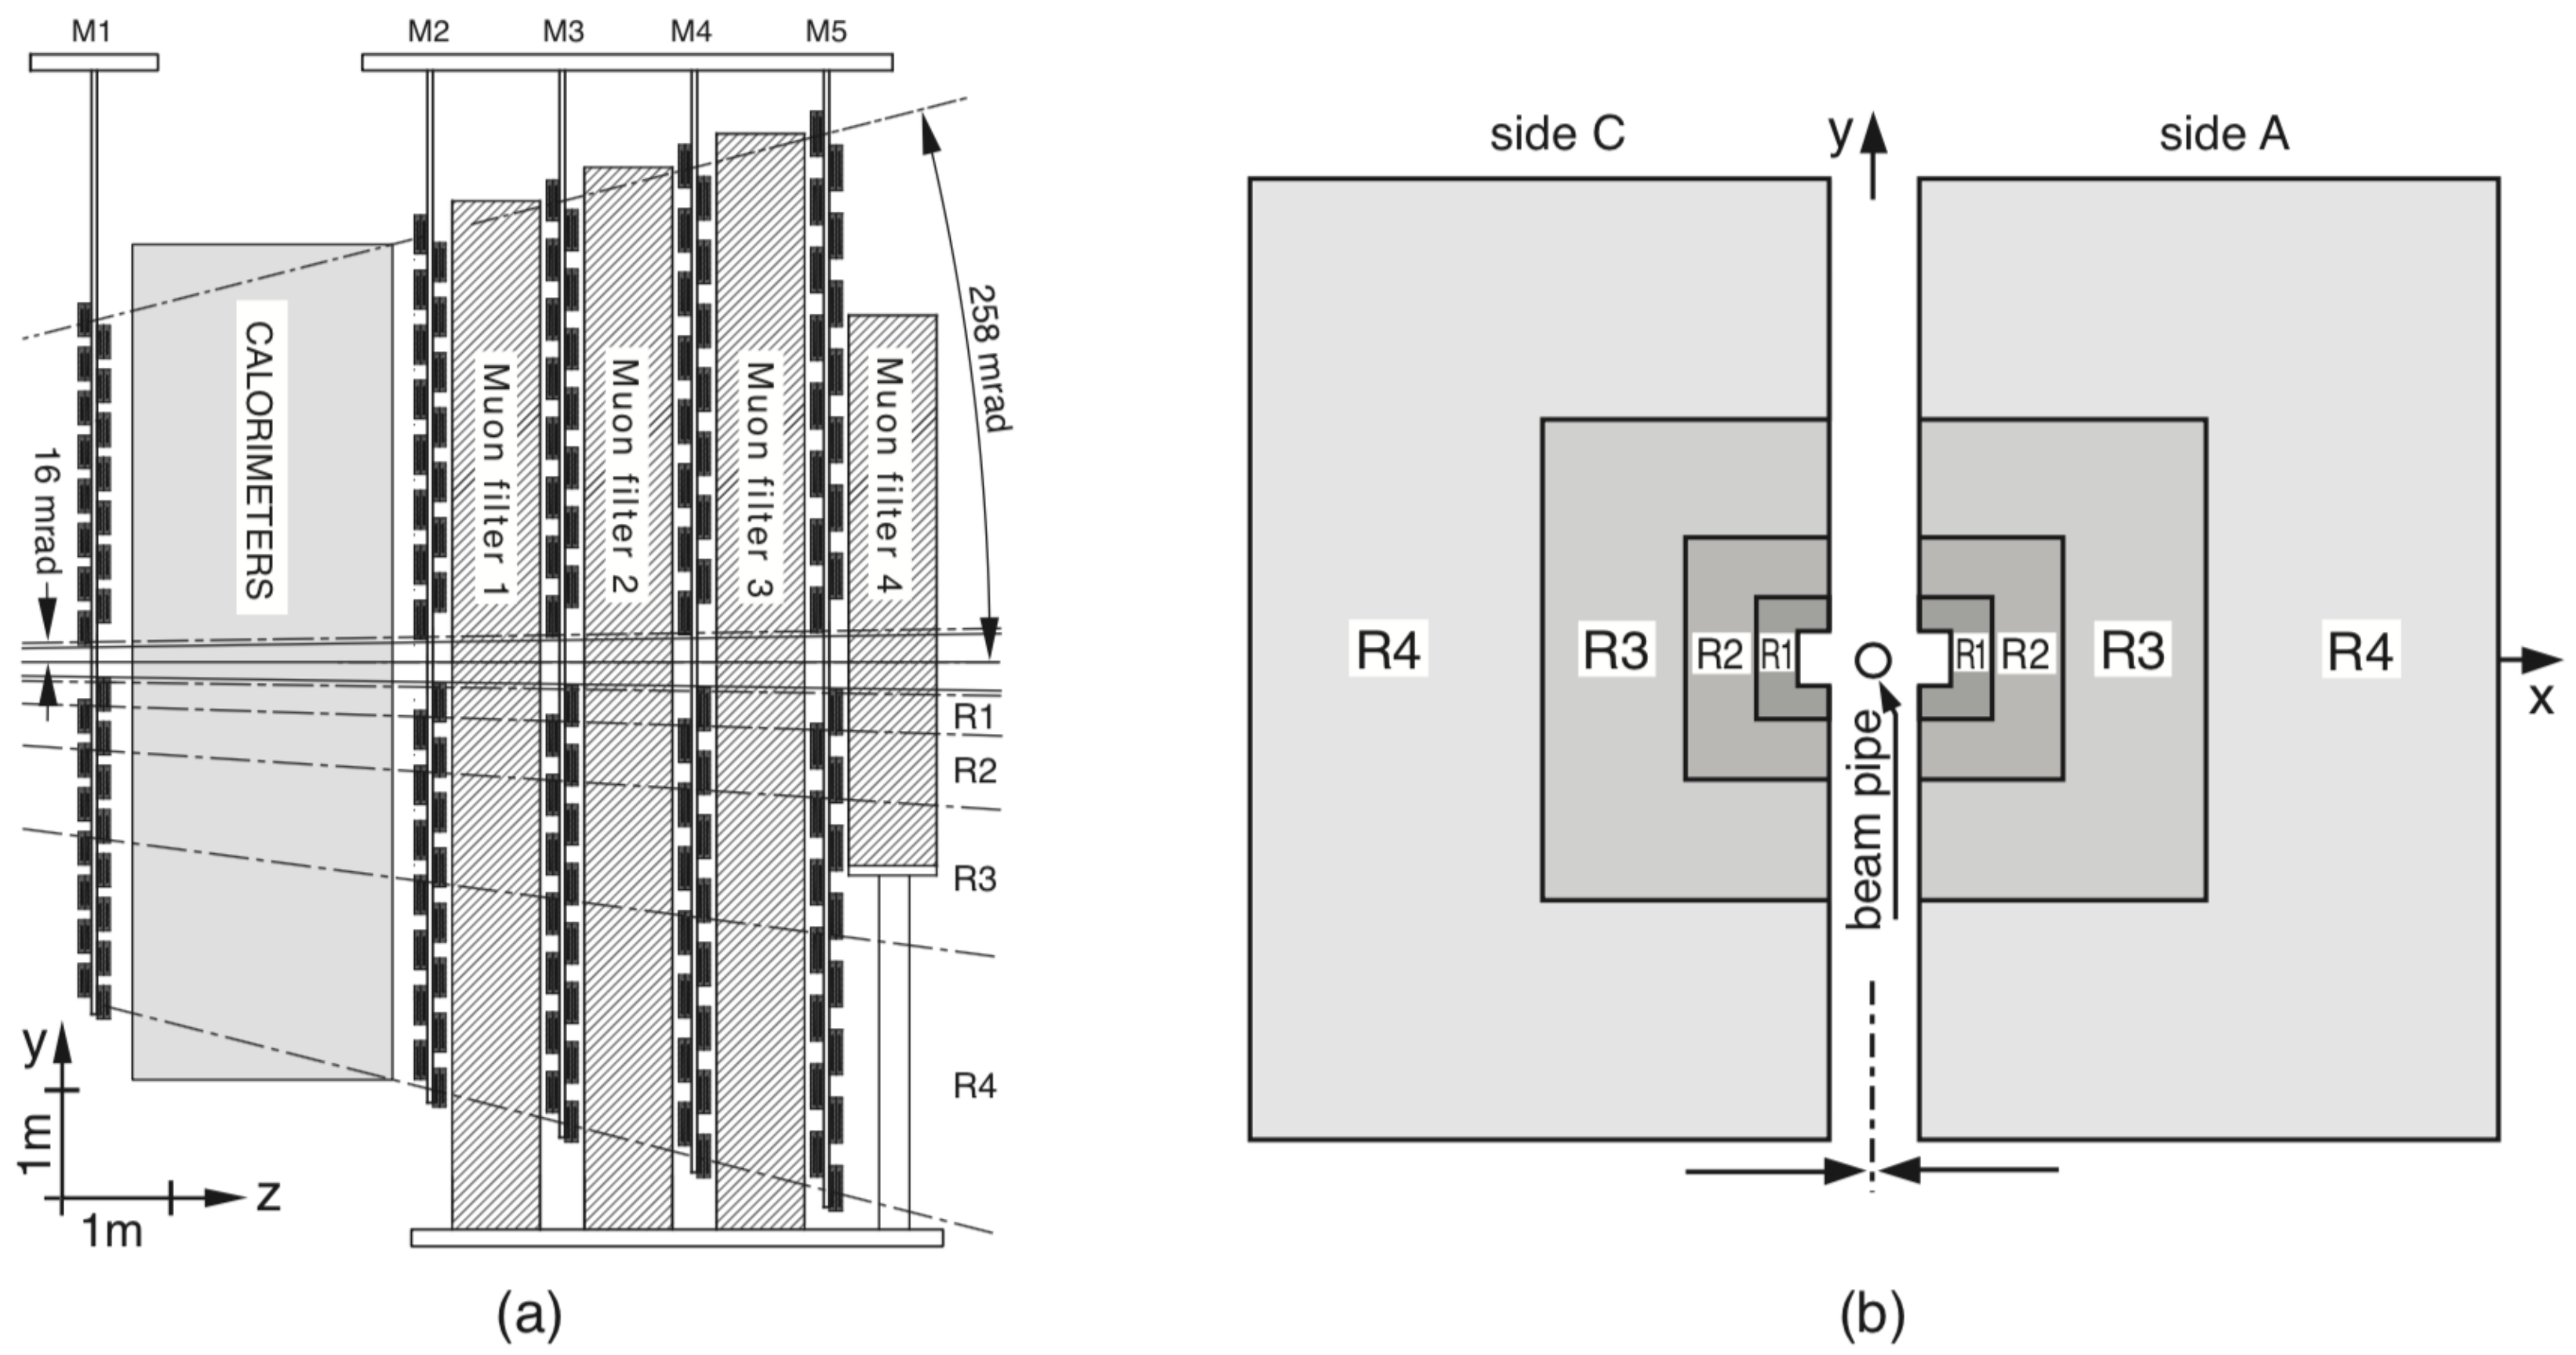
In the LHCb muon detector, each station is divided into 4 regions (R1–R4), at increasing distances from the beam pipe (
Figure 1). During Run 1 and Run 2 of the LHC operation, all regions were instrumented with MWPCs except the most irradiated region, R1 of station M1, where 12 triple-GEM chambers were used. The MWPC chambers in station M1 are composed by only two sensitive gaps, while the chambers in stations M2–M5 have four sensitive gas gaps (
Figure 2). Each chamber gap is segmented into pads whose size is constrained by constructional reasons, or by requirements for their electrical capacitance and rate capability. Pads are made of cathodes segments or grouped anode wires, depending on the readout type. In the four-gap chambers, two gaps are ganged in pairs to form a physical channel [
13]. In M1, every pad forms a single physical channel.
Every chamber is equipped with multiple front-end boards (FEB) to perform the readout. Each FEB has 16 inputs connected to the physical channels, up to 8 outputs (logical channels) and is equipped with two CARIOCA [
19] chips and one DIALOG [
20] chip. CARIOCA (CERN and RIO Current-mode Amplifier) is an 8 channel Amplifier-Shaper-Discriminator (ASD) and DIALOG (Diagnostic, time Adjustment, and LOGics) is a custom integrated circuit that works right after the ASD, and provides thresholds for the CARIOCA discriminators and different logical functions on the input signals to build logical channels of the required granularity. Each one of the ∼10
DIALOG input physical channels is equipped with a 24-bit counter (or scaler) capable of counting the number of times the analog signal crosses a threshold set. These scalers can count in various modes, including the counting in a pre-set time window (
gate in the following). The DIALOG chips are connected in I
C chains (for details about I
C protocol, see [
21]) and can be configured and readout by service boards (SB—[
22]), hosted in custom crates and controlled by the experimental control system (ECS—[
23,
24]).
3. Principle of Operation
Crucial for the results of the LHCb experiment is a measurement of the luminosity with a precision at a 1%, or even better, level. The assessment of absolute luminosity is based on different ingredients, measured in independent ways and discussed in detail in Ref. [
25].
In Runs 1 and 2, the most effective information for on-line luminosity evaluation was provided by the hardware trigger of the calorimeter system at a frequency of about 1 Hz. Those data, stored in the LHCb database every 3 s, are used in this paper and are referred as .
To study the muon hit rate, a dedicated ECS procedure was developed. This procedure allows to:
- 1.
Configure the SB to be ready to send a proper gate to start and stop hit counting;
- 2.
Enable the scaler operation on FEBs;
- 3.
Reset possible previous counts registered in FEBs’ memory;
- 4.
Send a command to SB to provide a gate to the FEBs;
- 5.
Download the counts of all FEBs’ channels and save the values to files.
All data presented in this paper were taken with a gate of 1 s. Due to the different number of chambers and FEBs in the different stations, the time needed to perform the configuration steps (1, 2 and 3) is highly station-dependent. Therefore, step number 4 is issued first on M1, after 2–3 min on M4 and M5 and, after an additional 2–3 min, on M2 and M3. Each acquisition process lasts about 5 min, with the consequence that the rates on the various stations are not simultaneously collected.
As a result of luminosity variation over time, differences of a few percent between the values of are expected when different stations are tested.
The readout of all recorded counts (step number 5) requires the downloading of all data through the slow ECS buses and, therefore, takes about 15 min. In the upgraded version of the experiment, a new, incomparably faster, reading system will be available and all data will be available in a few seconds.
It is worth noting that the described procedure can be performed independently of the LHCb data collection, which is a crucial feature for an on-line LHC luminosity monitor.
4. Dataset
The LHC activity is divided in periods conventionally referred to as fills. In every fill, thousands of bunches, with an order of protons each, enter the accelerator complex, are accelerated and then are kept circulating in the LHC ring and colliding at the interaction points. After some time (1–35 h), the bunch content is significantly depleted and the proton beams are dumped, making the ring ready for another fill.
The data analyzed in this paper belong to a set of special
runs, where a luminosity larger than usual was set, referred as
HL tests in the following. The data were collected in December 2012 during fill 3350 and 3374 with a bunch clock time spacing of 50 ns, 70% of the clocks and with bunches colliding at the LHCb interaction point. The average values of
recorded by M1 and M2–M3 are reported in
Table 1.
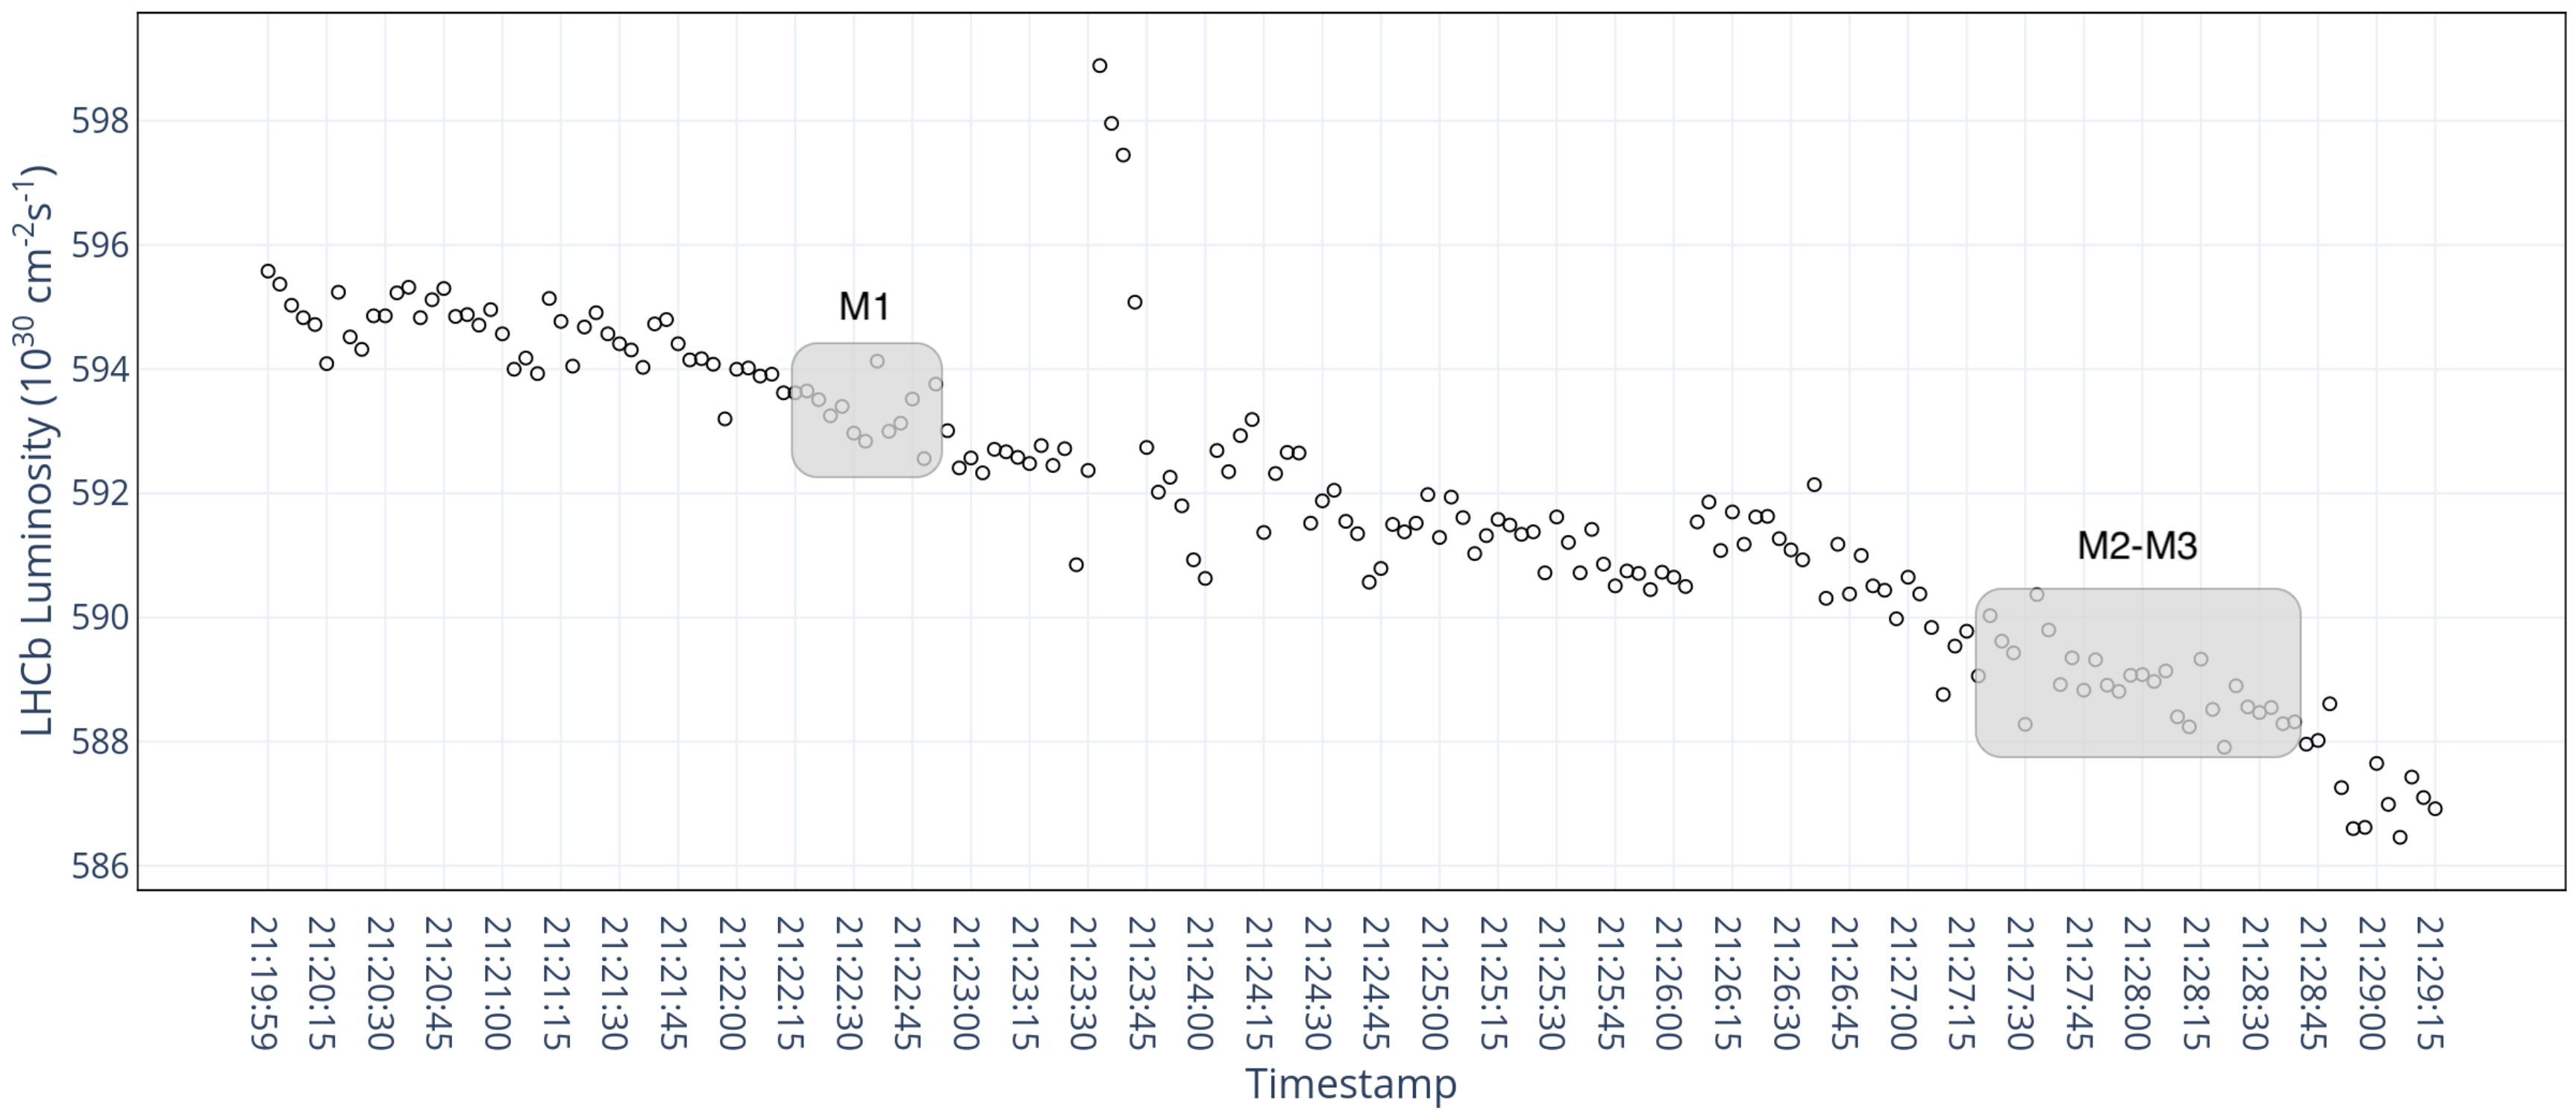
The behavior of
during fill 3374 is shown in
Figure 3.
The plateaus corresponding to different nominal luminosity settings are visible. In each plateau, gradual decreases in luminosity can be observed as the bunch content is depleted, followed by rapid increments when the beam separation at LHCb was changed by the luminosity levelling system.
The zoom of
run 3c period is shown in
Figure 4.
5. Analysis Method
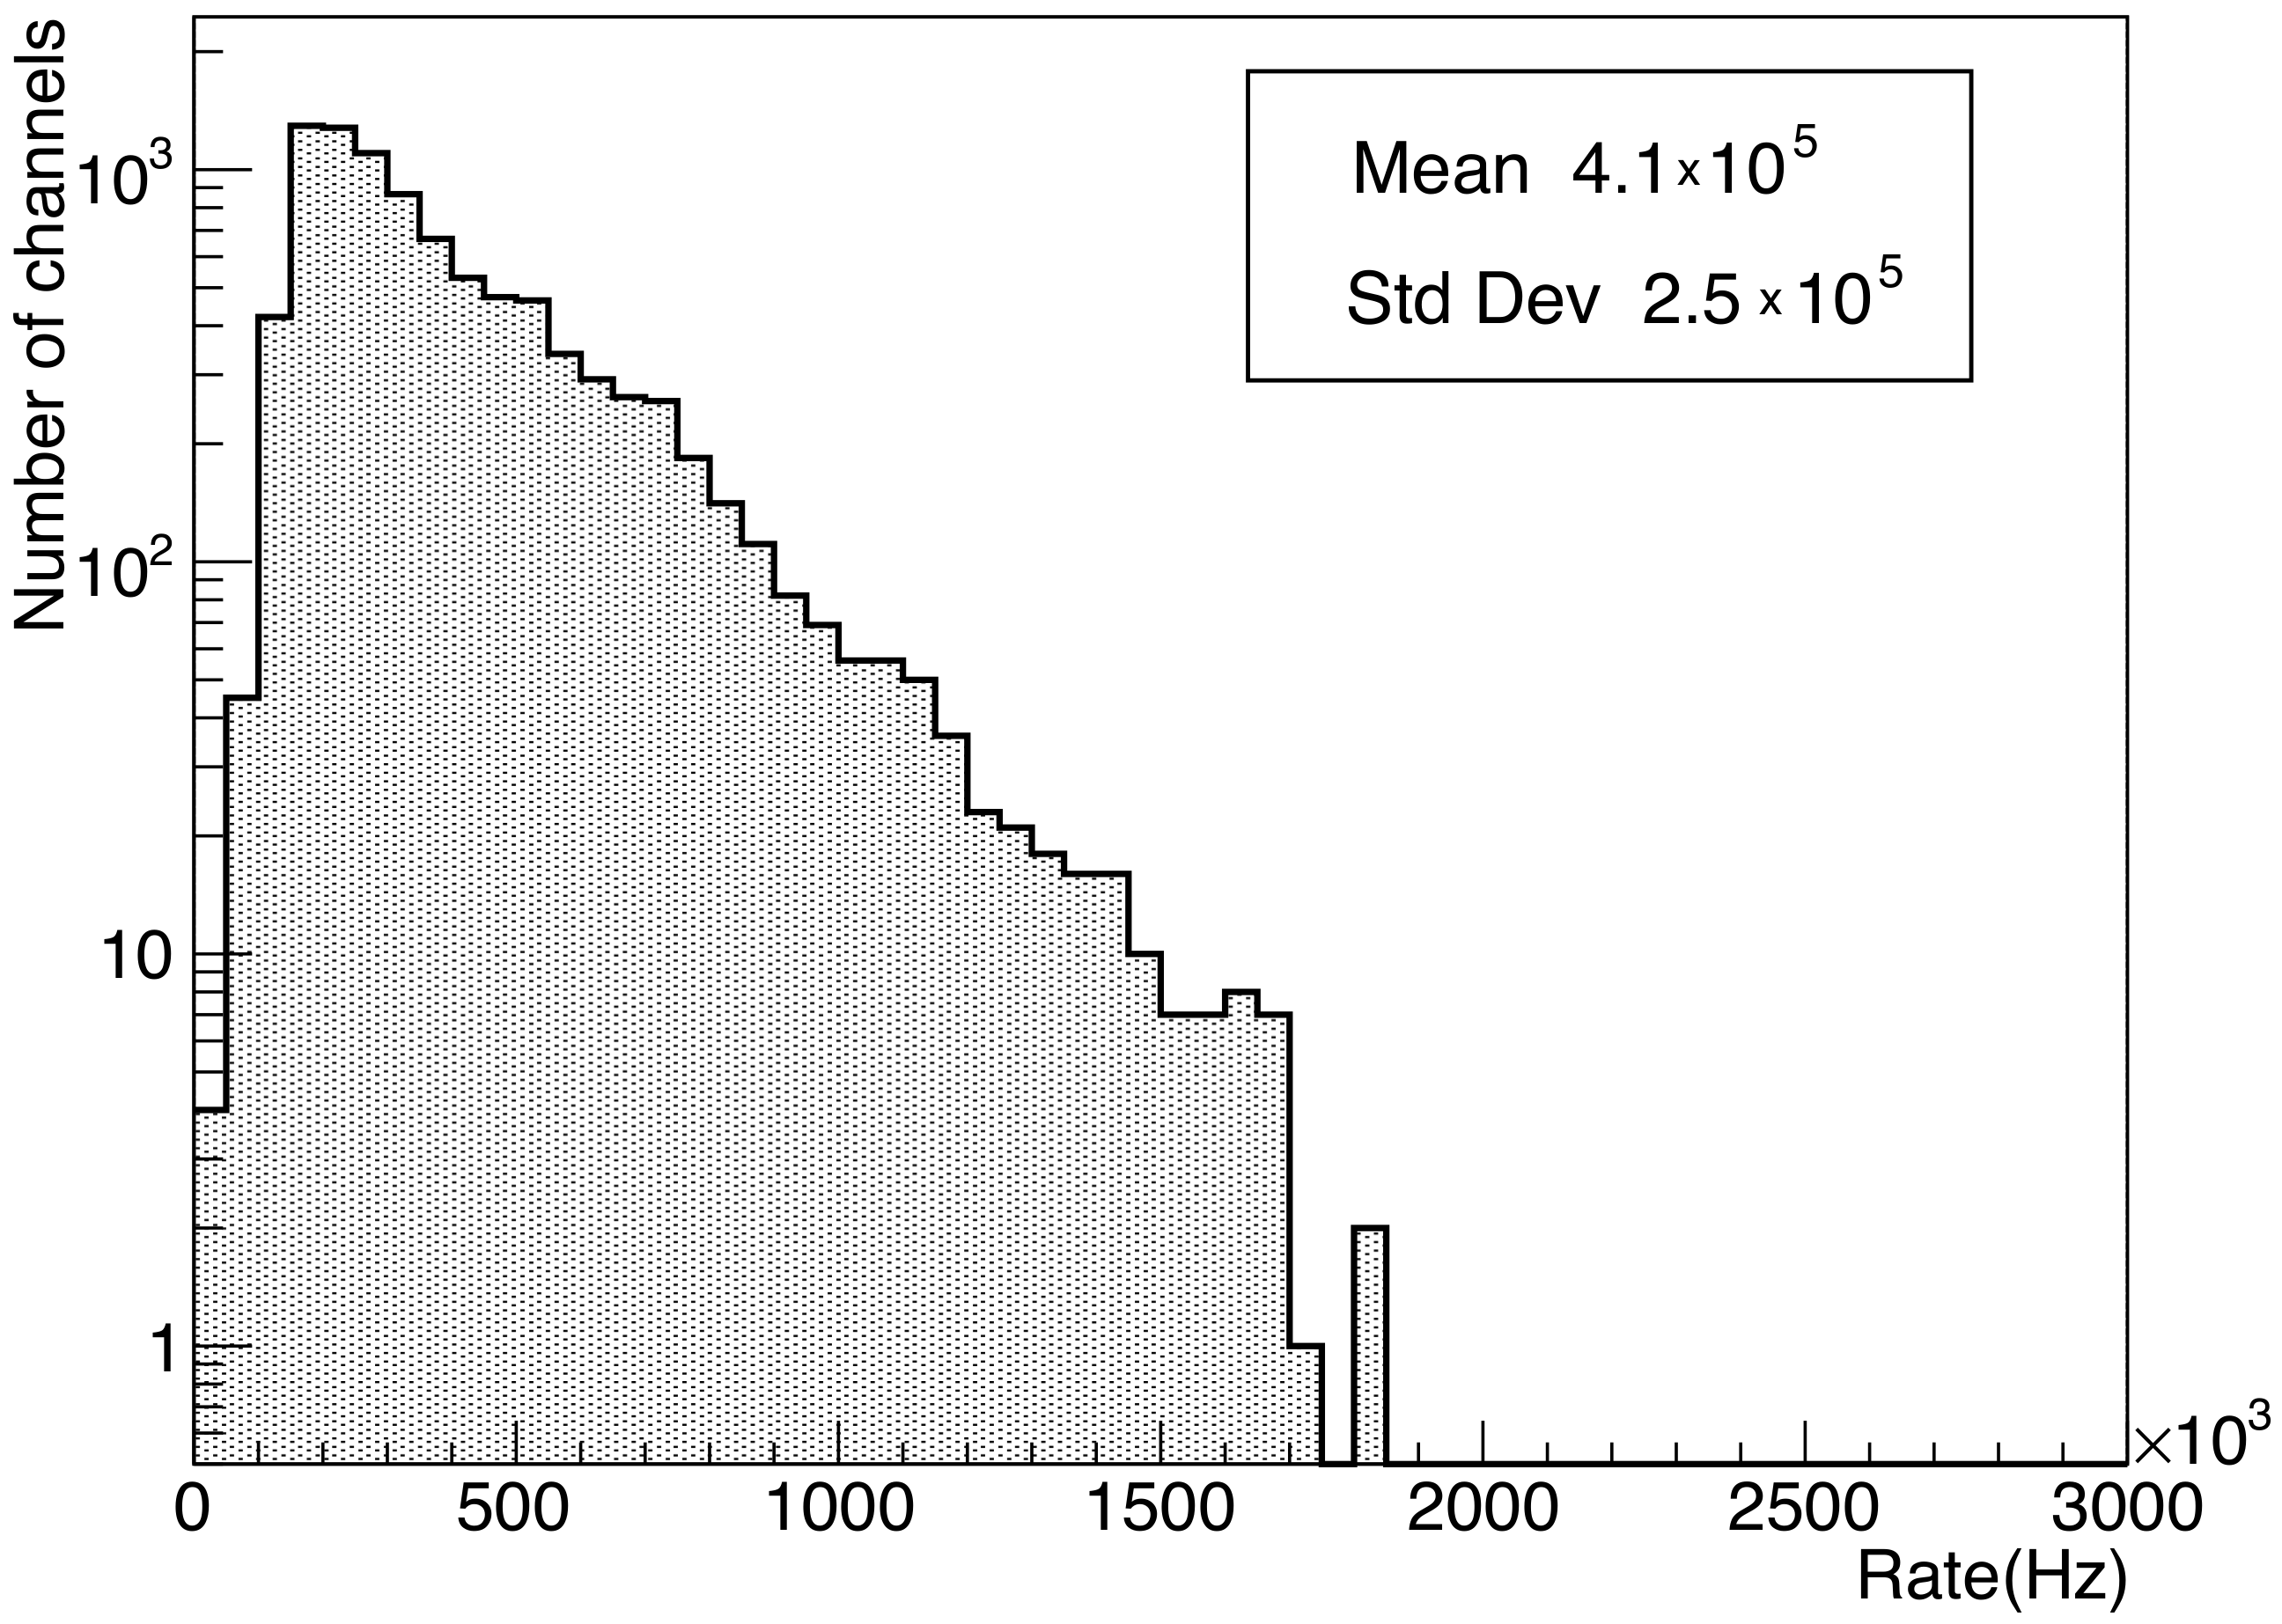
In
Figure 5, the distribution of the number of counts recorded in one second in
run 3a by the physical channels of station M1 region R2 is reported as an example.
While the particular shape of this distribution is due to the different positions of the physical channels relative to the interaction point and, thus, to the different particle fluxes received, the mean value for a given detector region is expected to be directly related to the luminosity.
5.1. Dead-Time Correction
Given the high values of
reached, the effects of possible inefficiencies related to the particle rate should be taken into account. In a previous work [
17], it was demonstrated that, in these
HL tests, the main contribution to inefficiencies was due to the dead time
of the CARIOCA, while other effects (e.g., space charge around the wires) were negligible.
The value of depends on the total charge amplified and changes in the different detector regions, from about 70 ns to 100 ns.
A method, illustrated in [
26], involving the simulation of the beam structure and the chamber response, was developed to evaluate the value of
directly from the rates measured at different luminosities and to perform a channel by channel correction.
In the current analysis, a simplified procedure was used. The instantaneous effective rate
in each channel during the trains of consecutive bunch crossings was estimated by dividing the average rates measured in 1 s gate by 0.7. Two constant values of
(100 ns for M1 and 70 ns for M2 and M3) were assumed to correct the values of the rate (
R) for the dead-time effect:
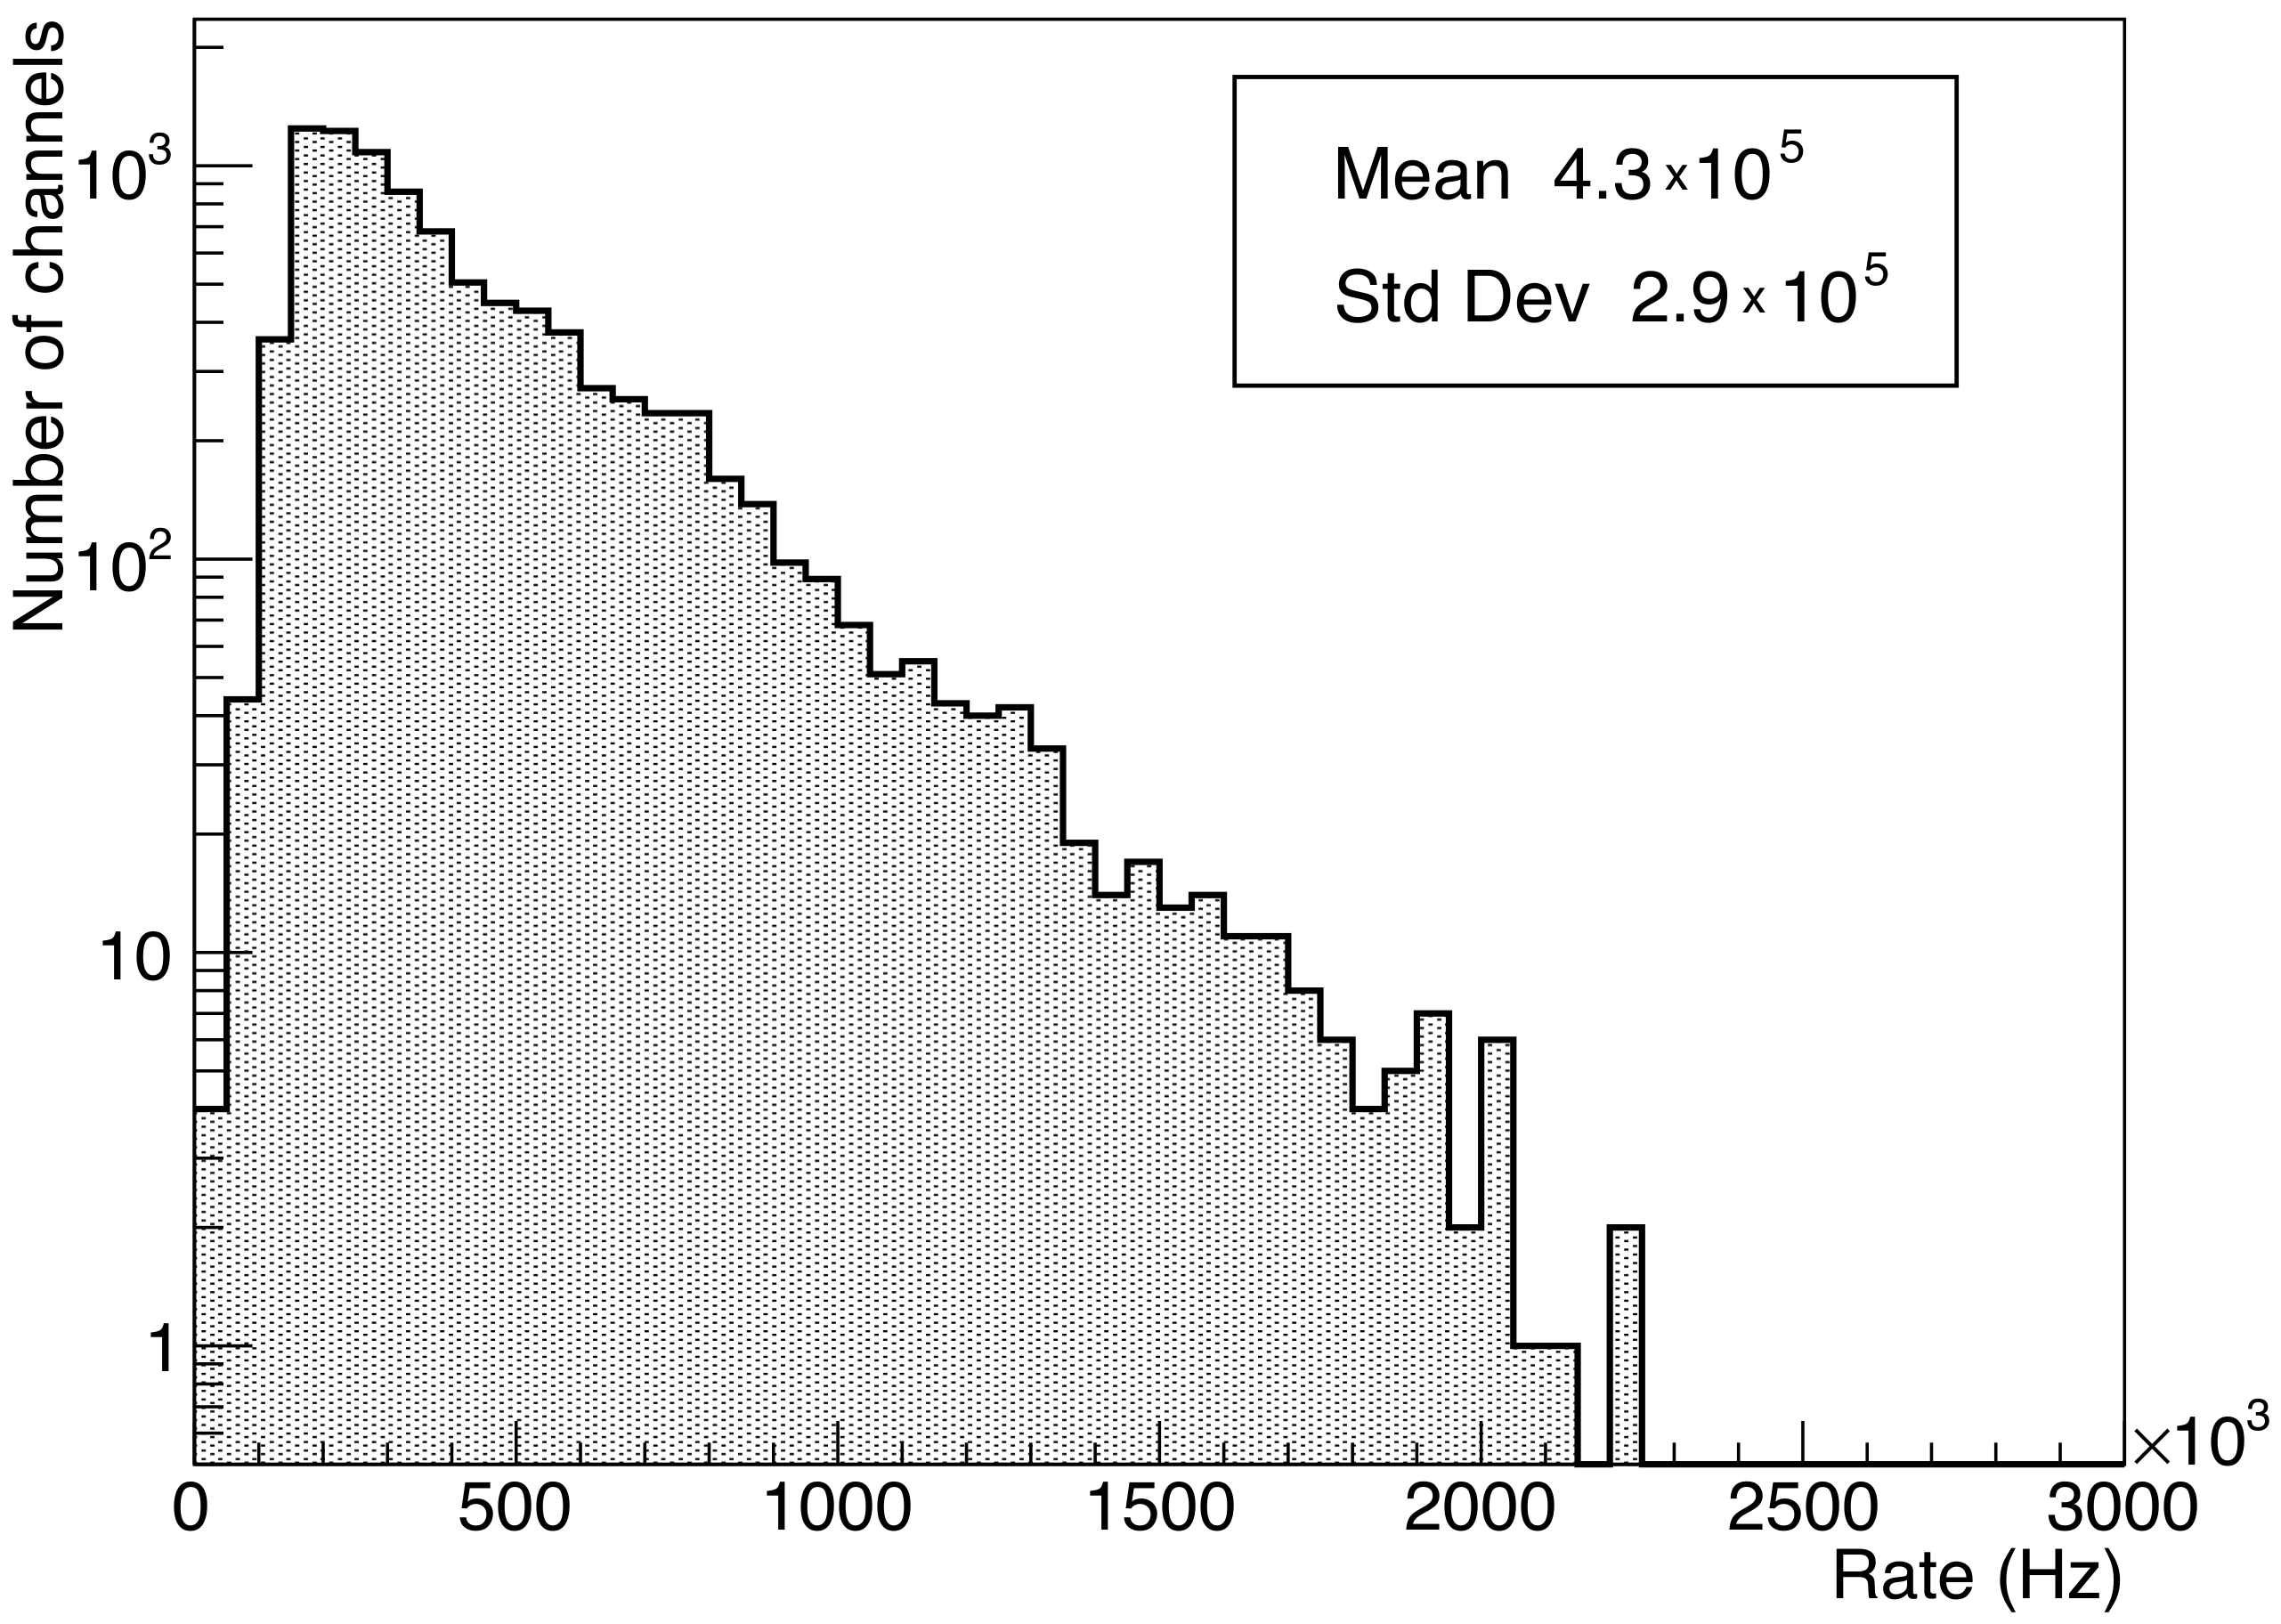
In
Figure 6, the same distribution as
Figure 5 (region R2 of station M1 in
run 3a) is reported after correction for the dead-time effect. The mean value results increased by about 5%.
5.2. Luminosity Evaluation
After evident abnormal counts (due to hot, dead channels) were eliminated, the mean values of the histograms of the corrected rates were evaluated for all regions and used as indicators of the luminosity.
In particular, the ratio between the LHCb luminosity value in a run 0, chosen from the available ones in which the rates of station s were acquired (), and the corresponding mean rate of counts () was used as a calibration factor for the measurements performed on station s and region r.
In this way, the mean values
provide a luminosity value estimated as:
The behavior of as a function of can thus provide an indication of the muon detector’s capability to monitor luminosity.
The first station of the muon system (M1), as explained in the introduction, will not be present in the upgraded version of the LHCb apparatus; nevertheless, it plays an important role in these
HL tests. As reported in
Table 2, the rate of particles in the 10% most irradiated channels of M1 reached, in
run 5, almost 2 MHz per physical channel, allowing to test the performance of the electronics and the accuracy of the proposed method up to the luminosity foreseen for regions R2–R4 in run 3 [
8].
In this study, data acquired in R1 are not used. Chambers in these regions are close to the beam pipe and can be, thus, affected by nonlinear effects due to the radiation emerging from it.
5.3. Accuracy Evaluation
In order to evaluate the intrinsic accuracy of the described method, the ratio between the hit rates recorded by the same channel in two different runs can be exploited. In each channel, the value of is expected to depend only on the ratio between the values of in the two involved runs and, therefore, its fluctuation is a direct indication of the reliability of the measurements.
Two examples of those distributions obtained from data recorded by M2R3 channels in
run 2a and
Run 1 and by M1R4 channels in
run 4 and
run 3c (see
Table 1) are shown in
Figure 7.
As can be seen, the mean values of the distributions reproduce very well the ratio of for the considered run pairs (1.23 and 1.31, respectively). The standard deviations were found to be of the order of 1% of the mean value, in reasonable agreement with the statistical fluctuations expected from counts, of the order of 10.
This result, obtained with a gate of 1 s, demonstrates the high potential and the high sensitivity of this method to monitor luminosity changes.
6. Results
The behavior of
for several regions of stations M1, M2 and M3 evaluated according to Equation (
2) is shown in
Figure 8 as a function of LHCb luminosity
superimposed to the ideal behavior.
The first acquired run was chosen for calibration to better check for possible “drifts” with time or with increasing rate values, as could result from an inadequate correction of dead-time inefficiencies.
Given the measured rates and the high number of channels per station (10
–10
), statistical errors on the points shown in
Figure 8 are less than 1‰ and thus not visible. Moreover, points of measurements in the different regions overlap.
A good correlation between
and
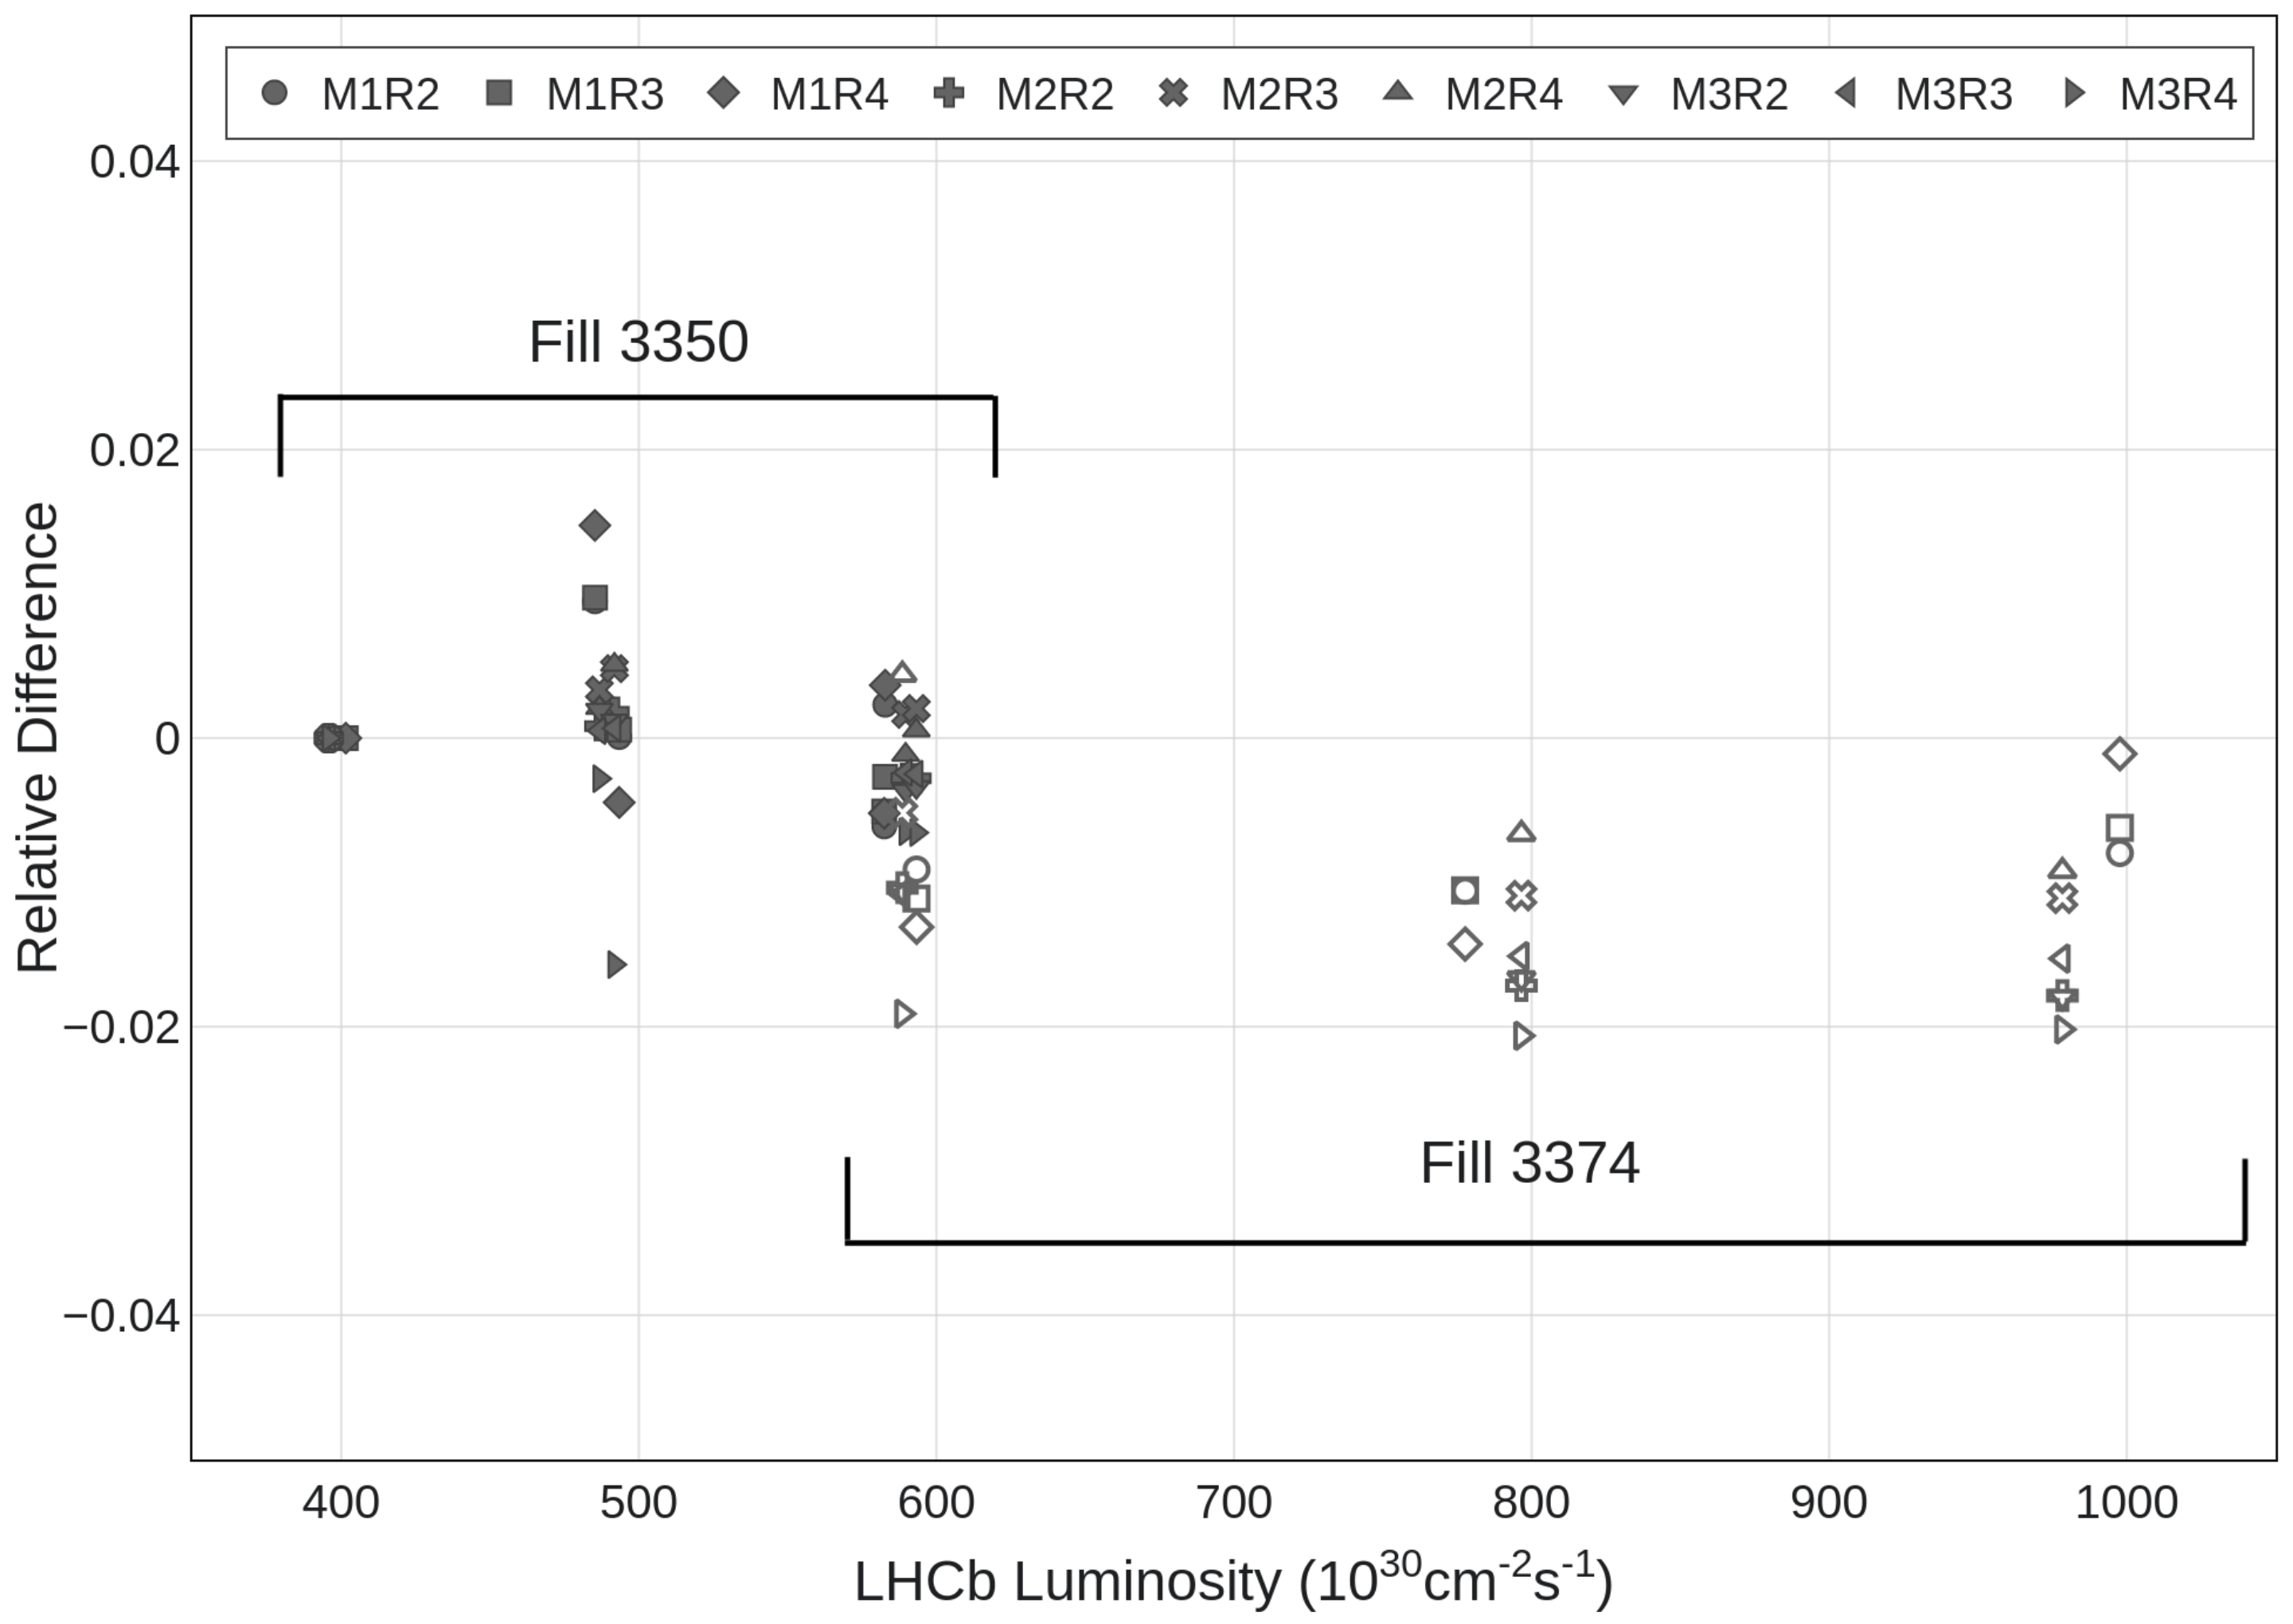
was found. To better visualize the effective accuracy of the proposed method, the relative differences between
and
are reported in
Figure 9.
In the whole explored range, an agreement within ±2% was found.
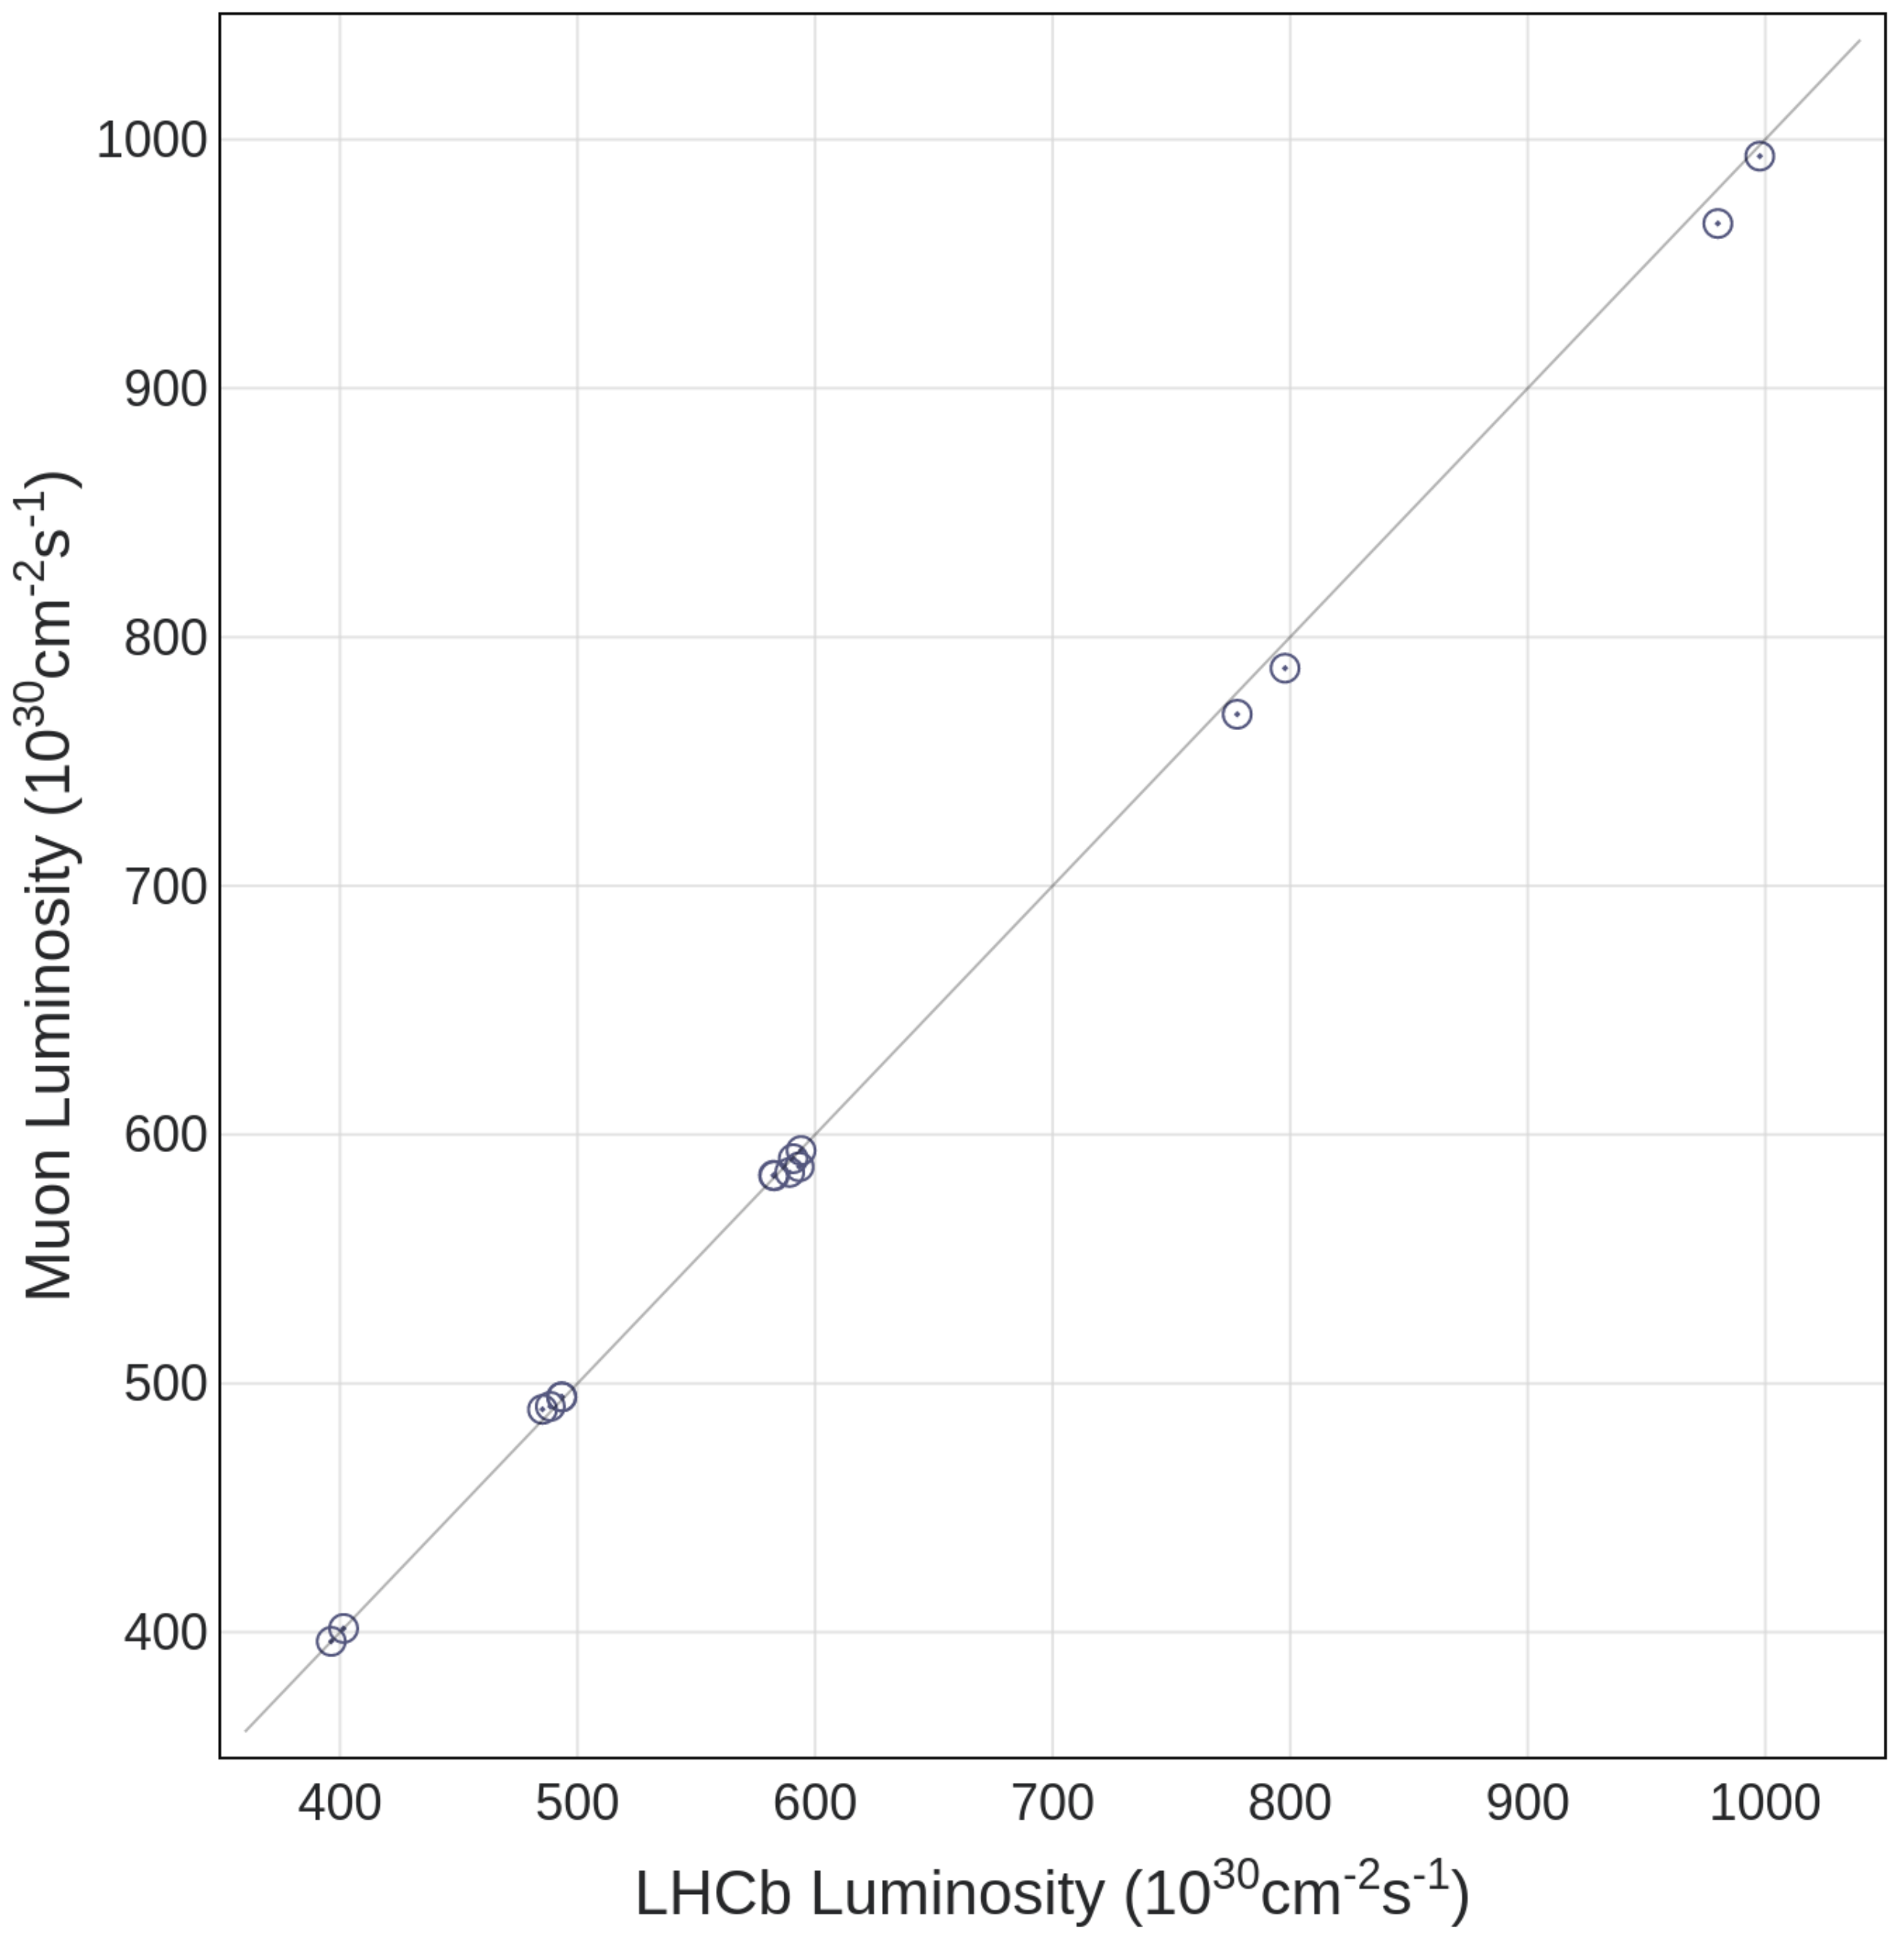
In
Figure 10, the correlation between
obtained from the average rates measured in each station and
is shown.
The residuals with respect to the ideal response are shown in
Figure 11. In the overall range an accuracy better than
was found.
7. Systematic Effects
The relatively high value of the data dispersion shown in
Figure 9 and
Figure 11, requires a careful investigation of the systematic effects, and, eventually, their variation over time.
No indication of a possible instrumental origin was found. The fluctuations between the results of different regions shown in
Figure 9 can be explained in terms of small
variations in the different regions at the acquisition time, as described in
Section 3.
Both in
Figure 9 and
Figure 11, residuals show a two-fold behavior, with an evident dependence on the fill: mostly positive in the first three
runs (fill 3350) and negative in the other
runs (fill 3374).
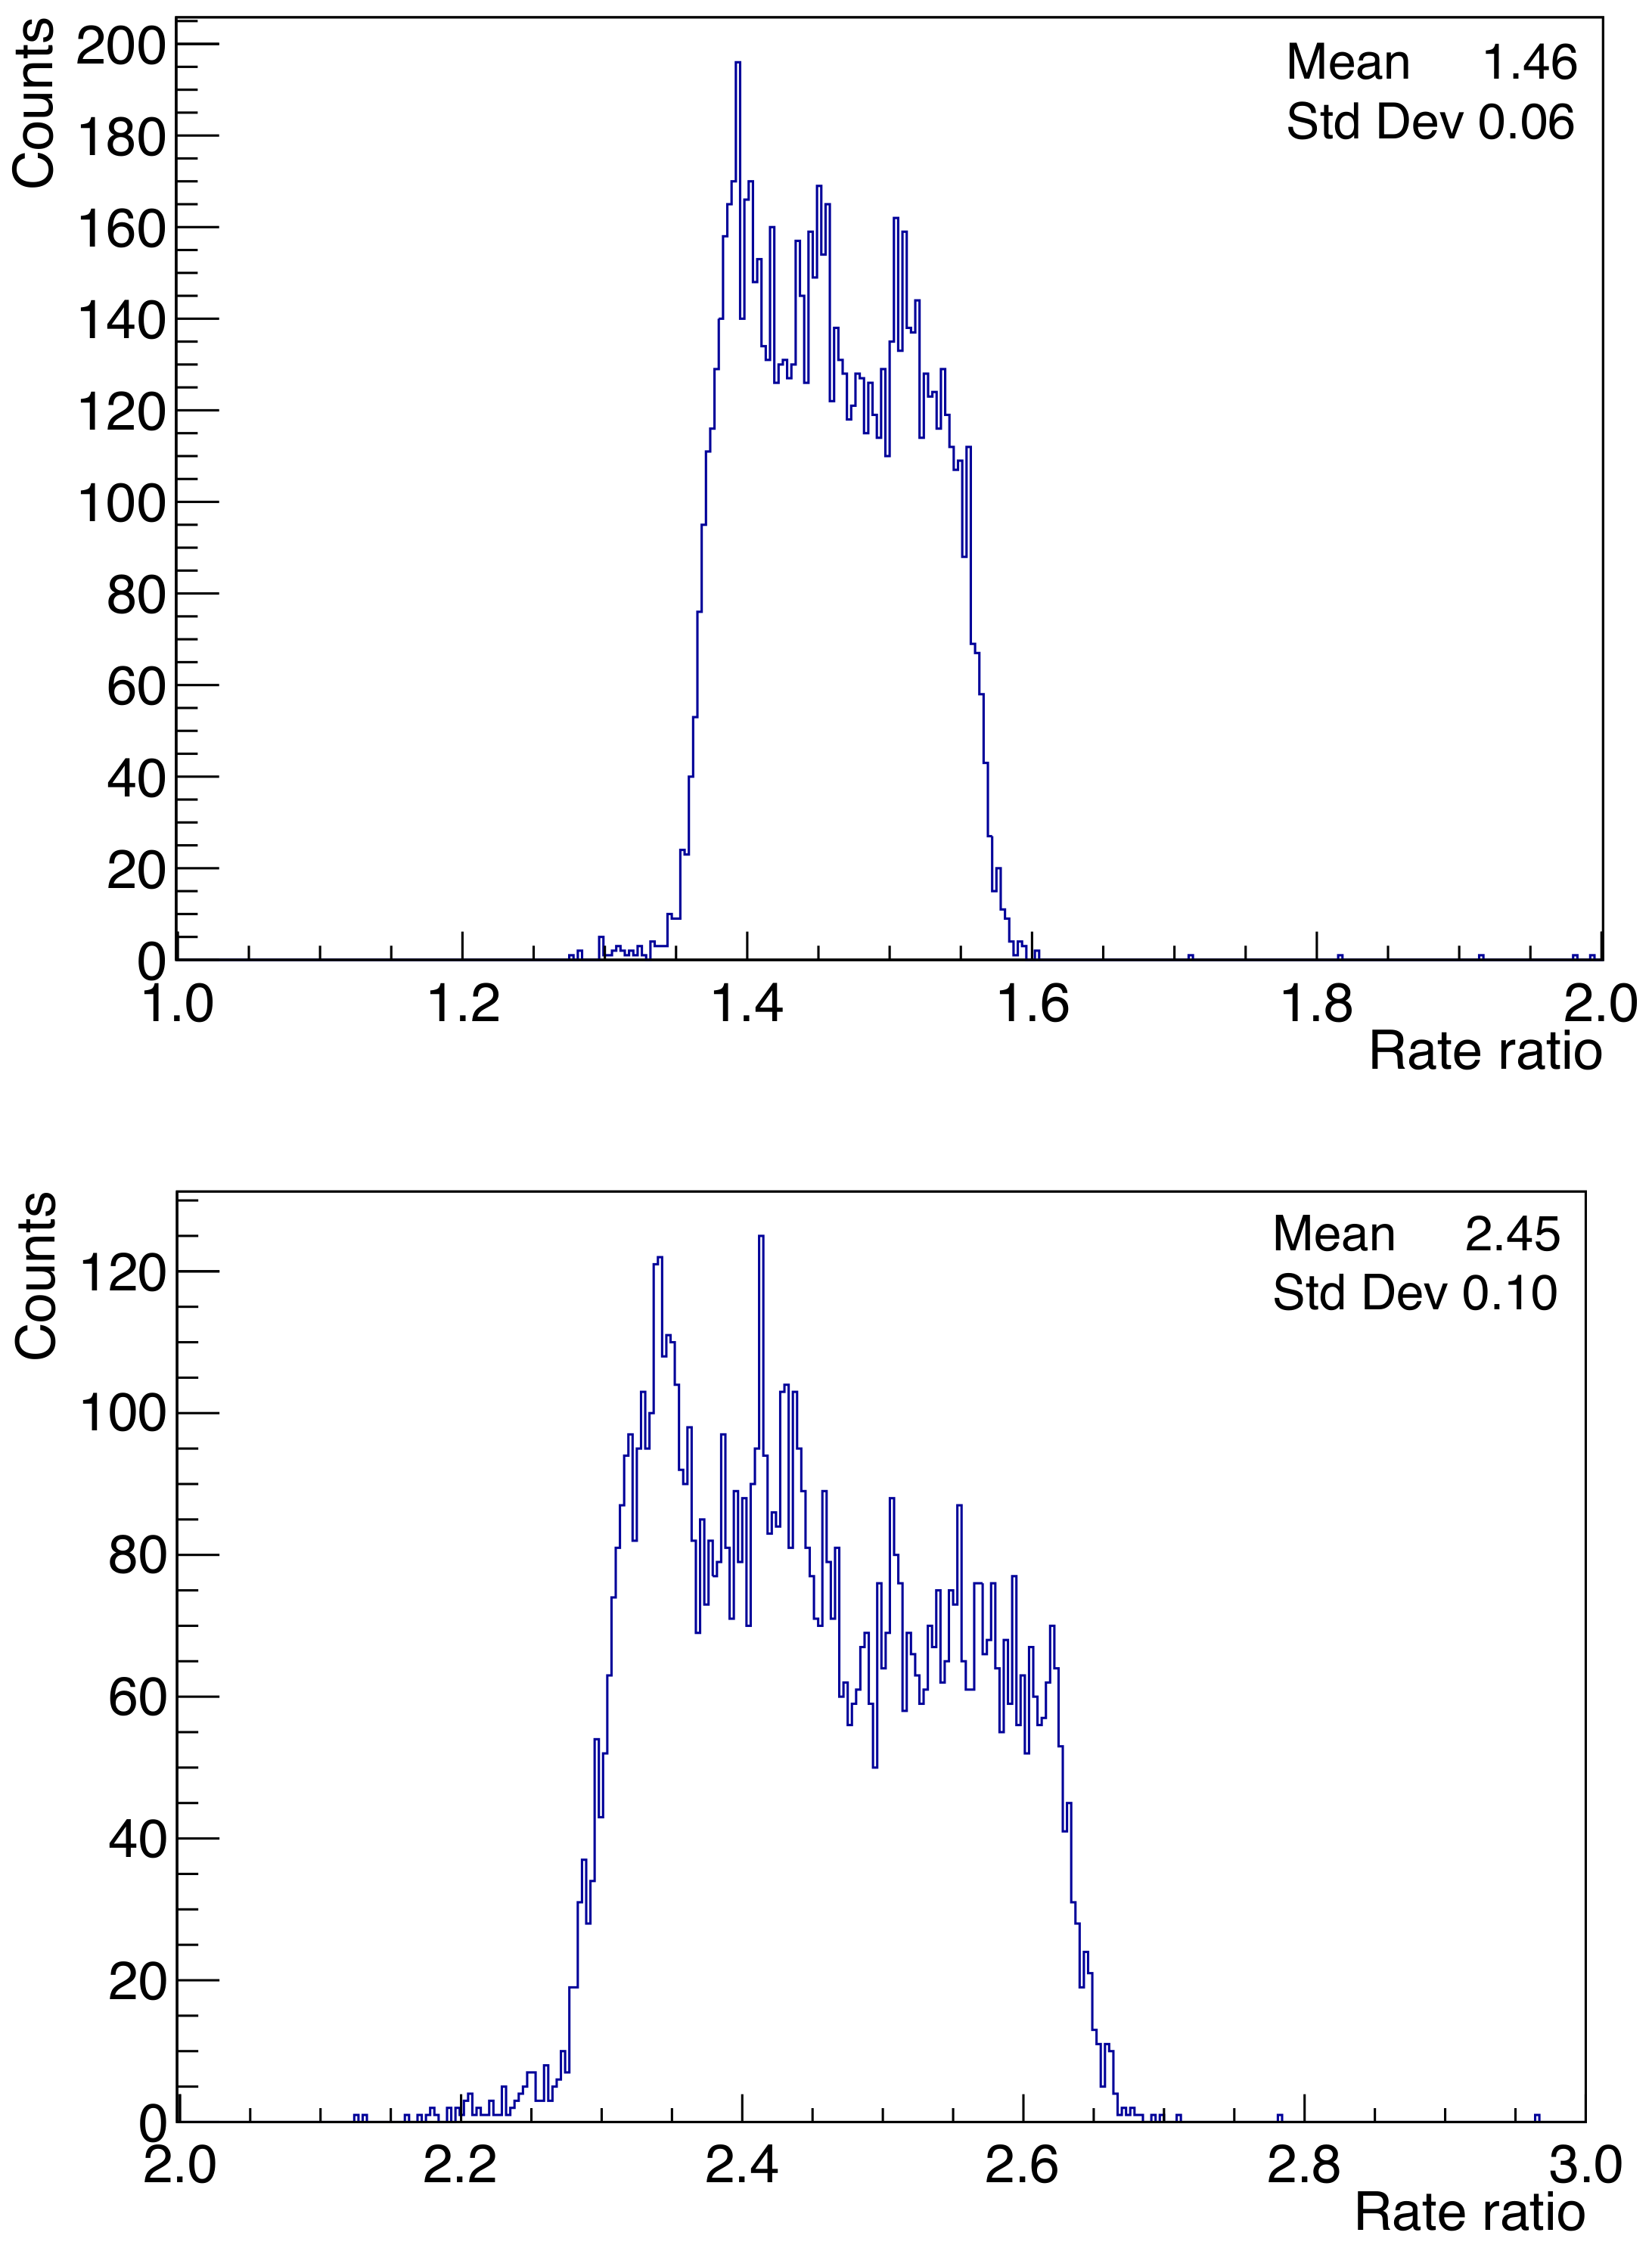
Looking at the distribution of the channel by channel rate ratios obtained for all pairs of
runs belonging to the two different fills, non-Gaussian structures appear. For example,
Figure 12 shows the channel by channel ratio of
run 3c and
run 5 over
run 1 for region M1R4.
These plots suggest the presence of underlying systematic effects related to different beam settings at different fills that change the hits distribution in the muon detector.
A further implementation of a system allowing the counters to measure the rates in coincidence with selected clocks beam–beam interactions (), beam-empty (be) and empty-empty (ee) is under study. This system would not only allow to better measure the hit rate due to beam–beam interactions and make more precise dead-time corrections, but it also would permit an interesting measurement of the level of radiation in the different detector regions. In particular, a flat in time significant contribution is expected from thermalized neutrons capture events.
Further tests are foreseen in Run 3 with the new fast readout system, to assess the validity of the proposed method and further investigate the sources of systematic effects.
8. Conclusions
Luminosity measurement is important for LHCb operation and several independent methods are being developed. For operations in Run 3, a new dedicated luminometer PLUME (Probe for LUminosity MEasurement) [
27] has been designed to perform online measurements of luminosity and the number of visible interactions per bunch crossing. Moreover, several off-line strategies are foreseen: LHCb will continue to use information from different subdetectors, increasing the number of monitored quantities with reference to those used in the past (i.e., velo hits/tracks/vertices in the high level trigger and calorimetric transverse energy deposition, N hits in the scintillator pad detector and number of muons from the level 0 trigger). In Run 3, similar counters from the new VELO (vertex locator), as well as the counters from PLUME, RICH, ECAL (electromagnetic calorimeter), HCAL (hadronic calorimeter), SciFi (scintillating fibres) and muons will be exploited. All these counters (excluding PLUME), though, will use the LHCb software trigger, not available during periods of no global run.
In this paper, a method was proposed for the on-line monitoring of the luminosity regardless of the LHCb data collection. Data from runs taken in 2012 at different luminosities were analyzed and the behavior of the average rates, corrected for the readout dead-time, measured in different regions of the muon detector was studied.
Those rates showed to be a good estimator of the LHCb luminosity with an accuracy better than 1.5% and even better inside one single fill. Systematics are to be further explored. A high speed readout in Run 3 will allow collecting larger statistics to further confirm the capability of the muon system to monitor the luminosity at LHCb. Upgrades in the muon system readout electronics aiming to cope with higher luminosities are currently under study.
Author Contributions
Conceptualization, D.P.; methodology, G.M., D.P. and C.S.; software, P.D.S. and S.K.; formal analysis, R.S.; investigation, D.B., A.C. (Alessandro Cardini), A.K. and O.M.; resources, M.P. and B.S. (Biagio Saitta); data curation, O.M., P.A., W.B., S.B., V.B., N.B., S.C., M.C., G.C., A.C. (Andrea Contu), V.C., P.C., L.C., A.C. (Alexsei Chubykin), F.D., M.A.D., D.D.B., M.G., D.I., A.L. (Adriano Lai), R.L., A.L. (Angelo Loi), O.M., A.P., B.S. (Barbara Sciascia), E.S., A.S. (Alessandro Saputi), A.S. (Alessia Satta), S.S. and S.V.; writing—original draft preparation, G.M., D.P. and C.S.; writing—review and editing, M.D.S., G.M., D.P., M.S., C.S. and B.S. (Barbara Sciascia); visualization, D.P. and C.S.; supervision, M.P. and B.S. (Biagio Saitta); project administration, M.P. and B.S (Biagio Saitta). All authors have read and agreed to the published version of the manuscript.
Funding
This research received no external funding.
Institutional Review Board Statement
Not applicable.
Informed Consent Statement
Not applicable.
Conflicts of Interest
The authors declare no conflict of interest.
References
- The LHCb Collaboration. The LHCb Detector at the LHC. JINST 2008, 3, S08005. [Google Scholar] [CrossRef]
- The LHCb Collaboration. LHCb VELO (VErtex LOcator): Technical Design Report; Technical Design Report, LHCb; CERN: Geneva, Switzerland, 2001. [Google Scholar]
- The LHCb Collaboration. LHCb RICH: Technical Design Report; Technical Design Report, LHCb; CERN: Geneva, Switzerland, 2000. [Google Scholar]
- The LHCb Collaboration. LHCb Outer Tracker: Technical Design Report; Technical Design Report, LHCb; CERN: Geneva, Switzerland, 2001. [Google Scholar]
- The LHCb Collaboration. LHCb Inner Tracker: Technical Design Report; Technical Design Report, LHCb; CERN: Geneva, Switzerland, 2002; revised version number 1 submitted on 2002-11-13 14:14:34. [Google Scholar]
- The LHCb Collaboration. LHCb Calorimeters: Technical Design Report; Technical Design Report, LHCb; CERN: Geneva, Switzerland, 2000. [Google Scholar]
- The LHCb Collaboration. LHCb Muon System Technical Design Report; CERN-LHCC 2001-010; CERN: Geneva, Switzerland, 2001; Available online: http://cds.cern.ch/record/504326 (accessed on 10 April 2022).
- The LHCb Collaboration. LHCb PID Upgrade Technical Design Report; CERN-LHCC-2013-022; CERN: Geneva, Switzerland, 2013; Available online: http://cds.cern.ch/record/1624074 (accessed on 10 April 2022)CERN-LHCC-2013-022.
- Aaij, R.; Albrecht, J.; Belous, M.; Billoir, P.; Boettcher, T.; Brea, R.A.; Vom Bruch, D.; Cámpora Pérez, D.H.; Casais, V.A.; Craik, D.C.; et al. Allen: A High-Level Trigger on GPUs for LHCb. Comput. Softw. Big Sci. 2020, 4, 7. [Google Scholar] [CrossRef] [PubMed]
- The LHCb Collaboration. A Comparison of CPU and GPU Implementations for the LHCb Experiment Run 3 Trigger. Comput. Softw. Big Sci. 2022, 6, 1. [Google Scholar] [CrossRef]
- Anderlini, L.; Archilli, F.; Cardini, A.; Cogoni, V.; Fontana, M.; Graziani, G.; Kazeev, N.; Kuindersma, H.; Oldeman, R.; Palutan, M.; et al. Muon identification for LHCb Run 3. J. Instrum. 2020, 15, T12005. [Google Scholar] [CrossRef]
- Martellotti, G.; Nobrega, R.; Fufaro, E.; Penso, G.; Pinci, D. Study of the Performance of the LHCb MWPC with Cosmic Rays; Technical Design Report, CERN-LHCb-2008-057; CERN: Geneva, Switzerland, 2008; Available online: http://cds.cern.ch/record/1136214 (accessed on 10 April 2022).
- Anelli, M.; Bocci, V.; Chiodi, G.; Ciambrone, P.; Dane, E.; Felici, G.; Forti, C.; Gatta, M.; Iacoangeli, F.; Lanfranchi, G.; et al. High-rate performance of the MWPCs for the LHCb muon system. Nucl. Instrum. Meth. A 2008, 593, 319–323. [Google Scholar] [CrossRef]
- Anelli, M.; Campana, P.; Ciambrone, P.; Felici, G.; Forti, C.; Gatta, M.; Lanfranchi, G.; Pinci, D.; Rosellini, R.; Santoni, M.; et al. Test of MWPC Prototypes for Region 3 of Station 3 of the LHCb Muon System; Technical Design Report, CERN-LHCb-2004-074; CERN: Geneva, Switzerland, 2004; Available online: http://cds.cern.ch/record/793160 (accessed on 10 April 2022).
- Anelli, M.; Campana, P.; Dane, E.; Forti, C.; Martellotti, G.; Penso, G.; Pinci, D.; Rosellini, R.; Santoni, M.; Sarti, A.; et al. Quality tests of the LHCb muon chambers at the LNF production site. IEEE Trans. Nucl. Sci. 2006, 53, 330–335. [Google Scholar] [CrossRef]
- Alves, A.A.; Anderlini, L.; Anelli, M.; Nobrega, R.A.; Auriemma, G.; Baldini, W.; Bencivenni, G.; Berutti, R.; Bizzeti, A.; Bocci, V.; et al. Performance of the LHCb muon system. J. Instrum. 2013, 8, P02022. [Google Scholar] [CrossRef]
- Pinci, D. Performance of the Muon MWPC in High Luminosity Runs; Technical Report; CERN: Geneva, Switzerland, 2013. [Google Scholar]
- Shumkin, O.V.; Normanov, D.D.; Ivanov, P.Y. Development of the protocol of the interface of data exchange with the GBTX chip. J. Phys. Conf. Ser. 2017, 798, 012196. [Google Scholar] [CrossRef]
- Bonivento, W.; Jarron, P.; Moraes, D.; Riegler, W.; dos Santos, F. Development of the CARIOCA front-end chip for the LHCb muon detector. Nucl. Instrum. Meth. A 2002, 491, 233–243. [Google Scholar] [CrossRef]
- Cadeddu, S.; Lai, A.; Deplano, C. The DIALOG chip in the front-end electronics of the LHCb muon detector. IEEE Trans. Nucl. Sci. 2005, 52, 2726–2732. [Google Scholar] [CrossRef] [Green Version]
- Philips Semiconductors. The I2C-BUS Specification Version 2.1. 2000. Available online: https://www.csd.uoc.gr/~hy428/reading/i2c_spec.pdf (accessed on 10 February 2022).
- Bocci, V.; Chiodi, G.; Iacoangeli, F.; Messi, F.; Nobrega, R.A. The Muon Front-End Control Electronics of the LHCb Experiment. IEEE Trans. Nucl. Sci. 2010, 57, 3807–3814. [Google Scholar] [CrossRef]
- Antunes Nobrega, R. Development of the Experiment Control System and Performance Study of the Muon Chambers for the LHCb Experiment; Technical Report; CERN: Geneva, Switzerland, 2010. [Google Scholar]
- Bocci, V.; Cadeddu, S.; Carletti, M.; Deplano, C.; Lai, A.; Messi, F.; Nobrega, R.; Pinci, D. The LHCb muon control system the DAQ domain. In Proceedings of the 2007 IEEE Nuclear Science Symposium Conference Record, Honolulu, HI, USA, 26 October–3 November 2007; Volume 3, pp. 1737–1740. [Google Scholar] [CrossRef]
- The LHCb Collaboration. Precision luminosity measurements at LHCb. J. Instrum. 2014, 9, P12005. [Google Scholar] [CrossRef]
- Anderlini, L.; Anelli, M.; Archilli, F.; Auriemma, G.; Baldini, W.; Bencivenni, G.; Bizzeti, A.; Bocci, V.; Bondar, N.; Bonivento, W.; et al. Measurement of the front-end dead-time of the LHCb muon detector and evaluation of its contribution to the muon detection inefficiency. JINST 2016, 11, P04010. [Google Scholar] [CrossRef] [Green Version]
- The LHCb Collaboration. LHCb PLUME: Probe for Luminosity Measurement; Technical Report; CERN: Geneva, Switzerland, 2021. [Google Scholar] [CrossRef]
| Publisher’s Note: MDPI stays neutral with regard to jurisdictional claims in published maps and institutional affiliations. |
© 2022 by the authors. Licensee MDPI, Basel, Switzerland. This article is an open access article distributed under the terms and conditions of the Creative Commons Attribution (CC BY) license (https://creativecommons.org/licenses/by/4.0/).


 ,
, 


