
Measuring Road Transport Sustainability Using MCDM-Based Entropy Objective Weighting Method


Abstract
:1. Introduction
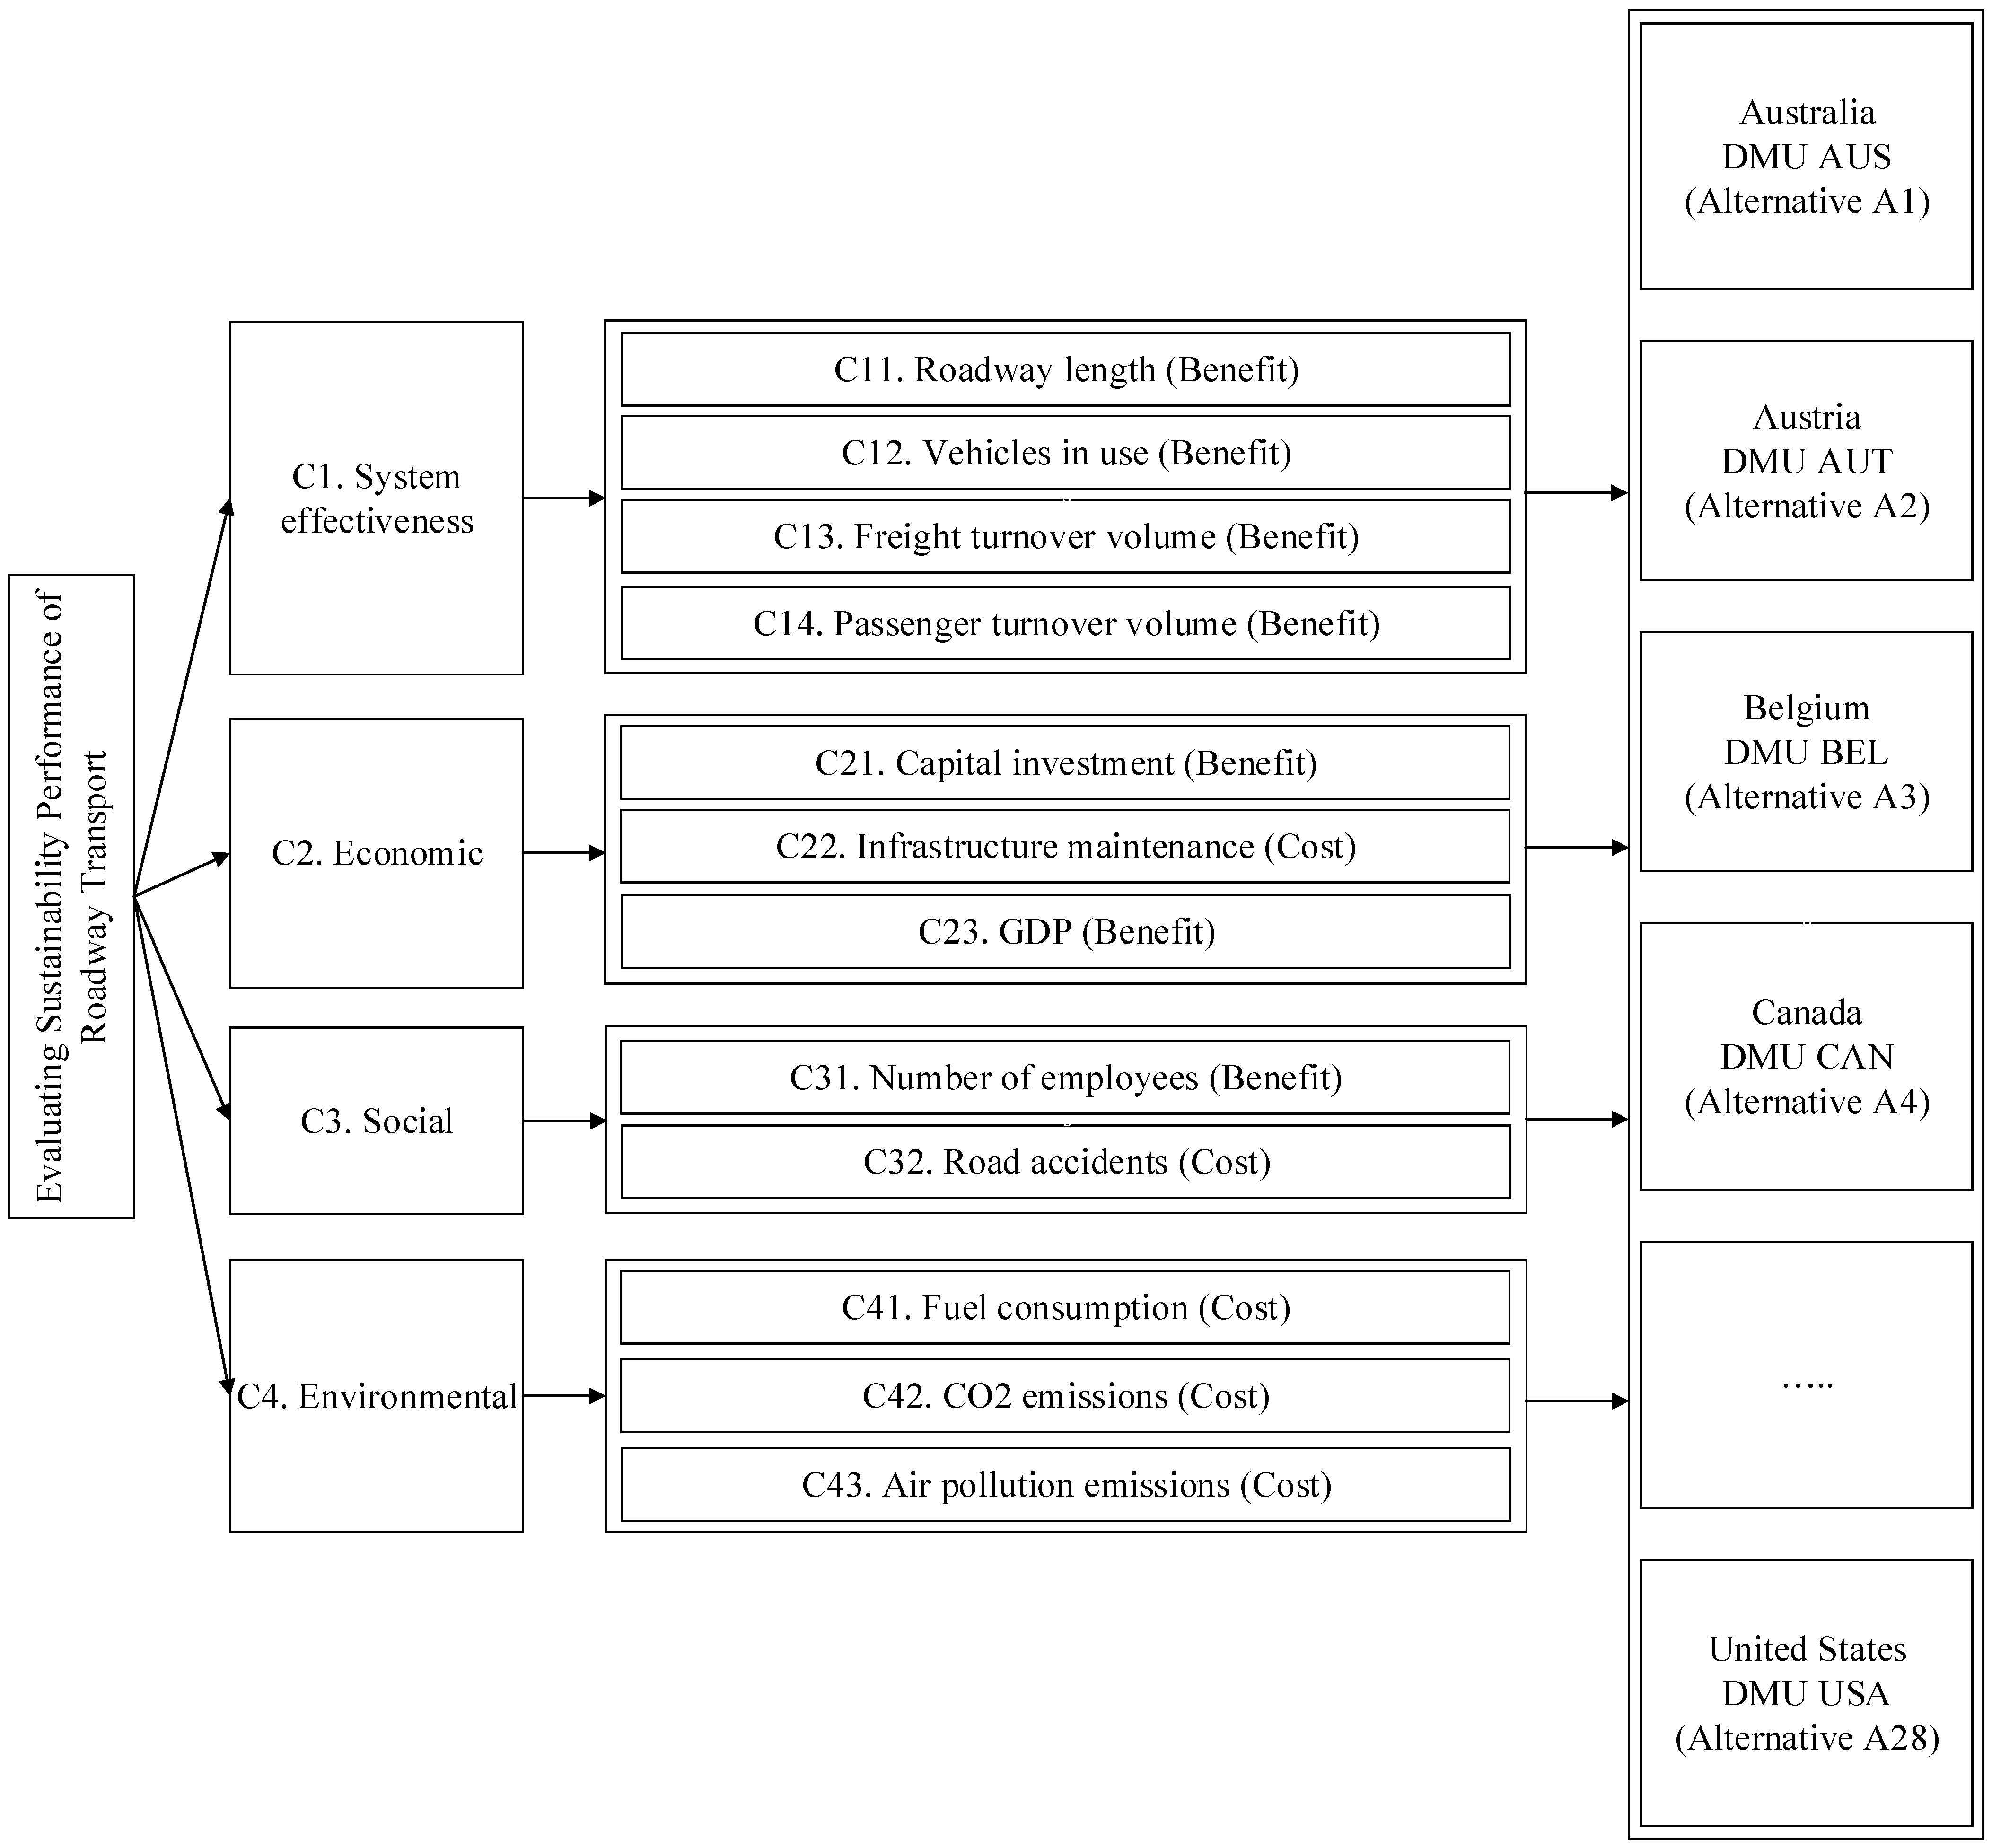
- This work proposed a novel indicator system for measuring the road transport sustainability including systematic effectiveness, economic, social, and environmental aspects, decomposition into 12 sub-criteria with a case study in 28 OECD countries.
- To the best of the author’s knowledge, this paper is the first to combine entropy and CoCoso methodology in the existing road transport evaluation literature. This integrated MCDM model is conducted with the real data.
- For managerial implication, the model’s results can support government or policymakers in dealing with the sustainable development of the national road transportation systems, especially in the post-pandemic period.
2. Related Work
3. Materials and Methods
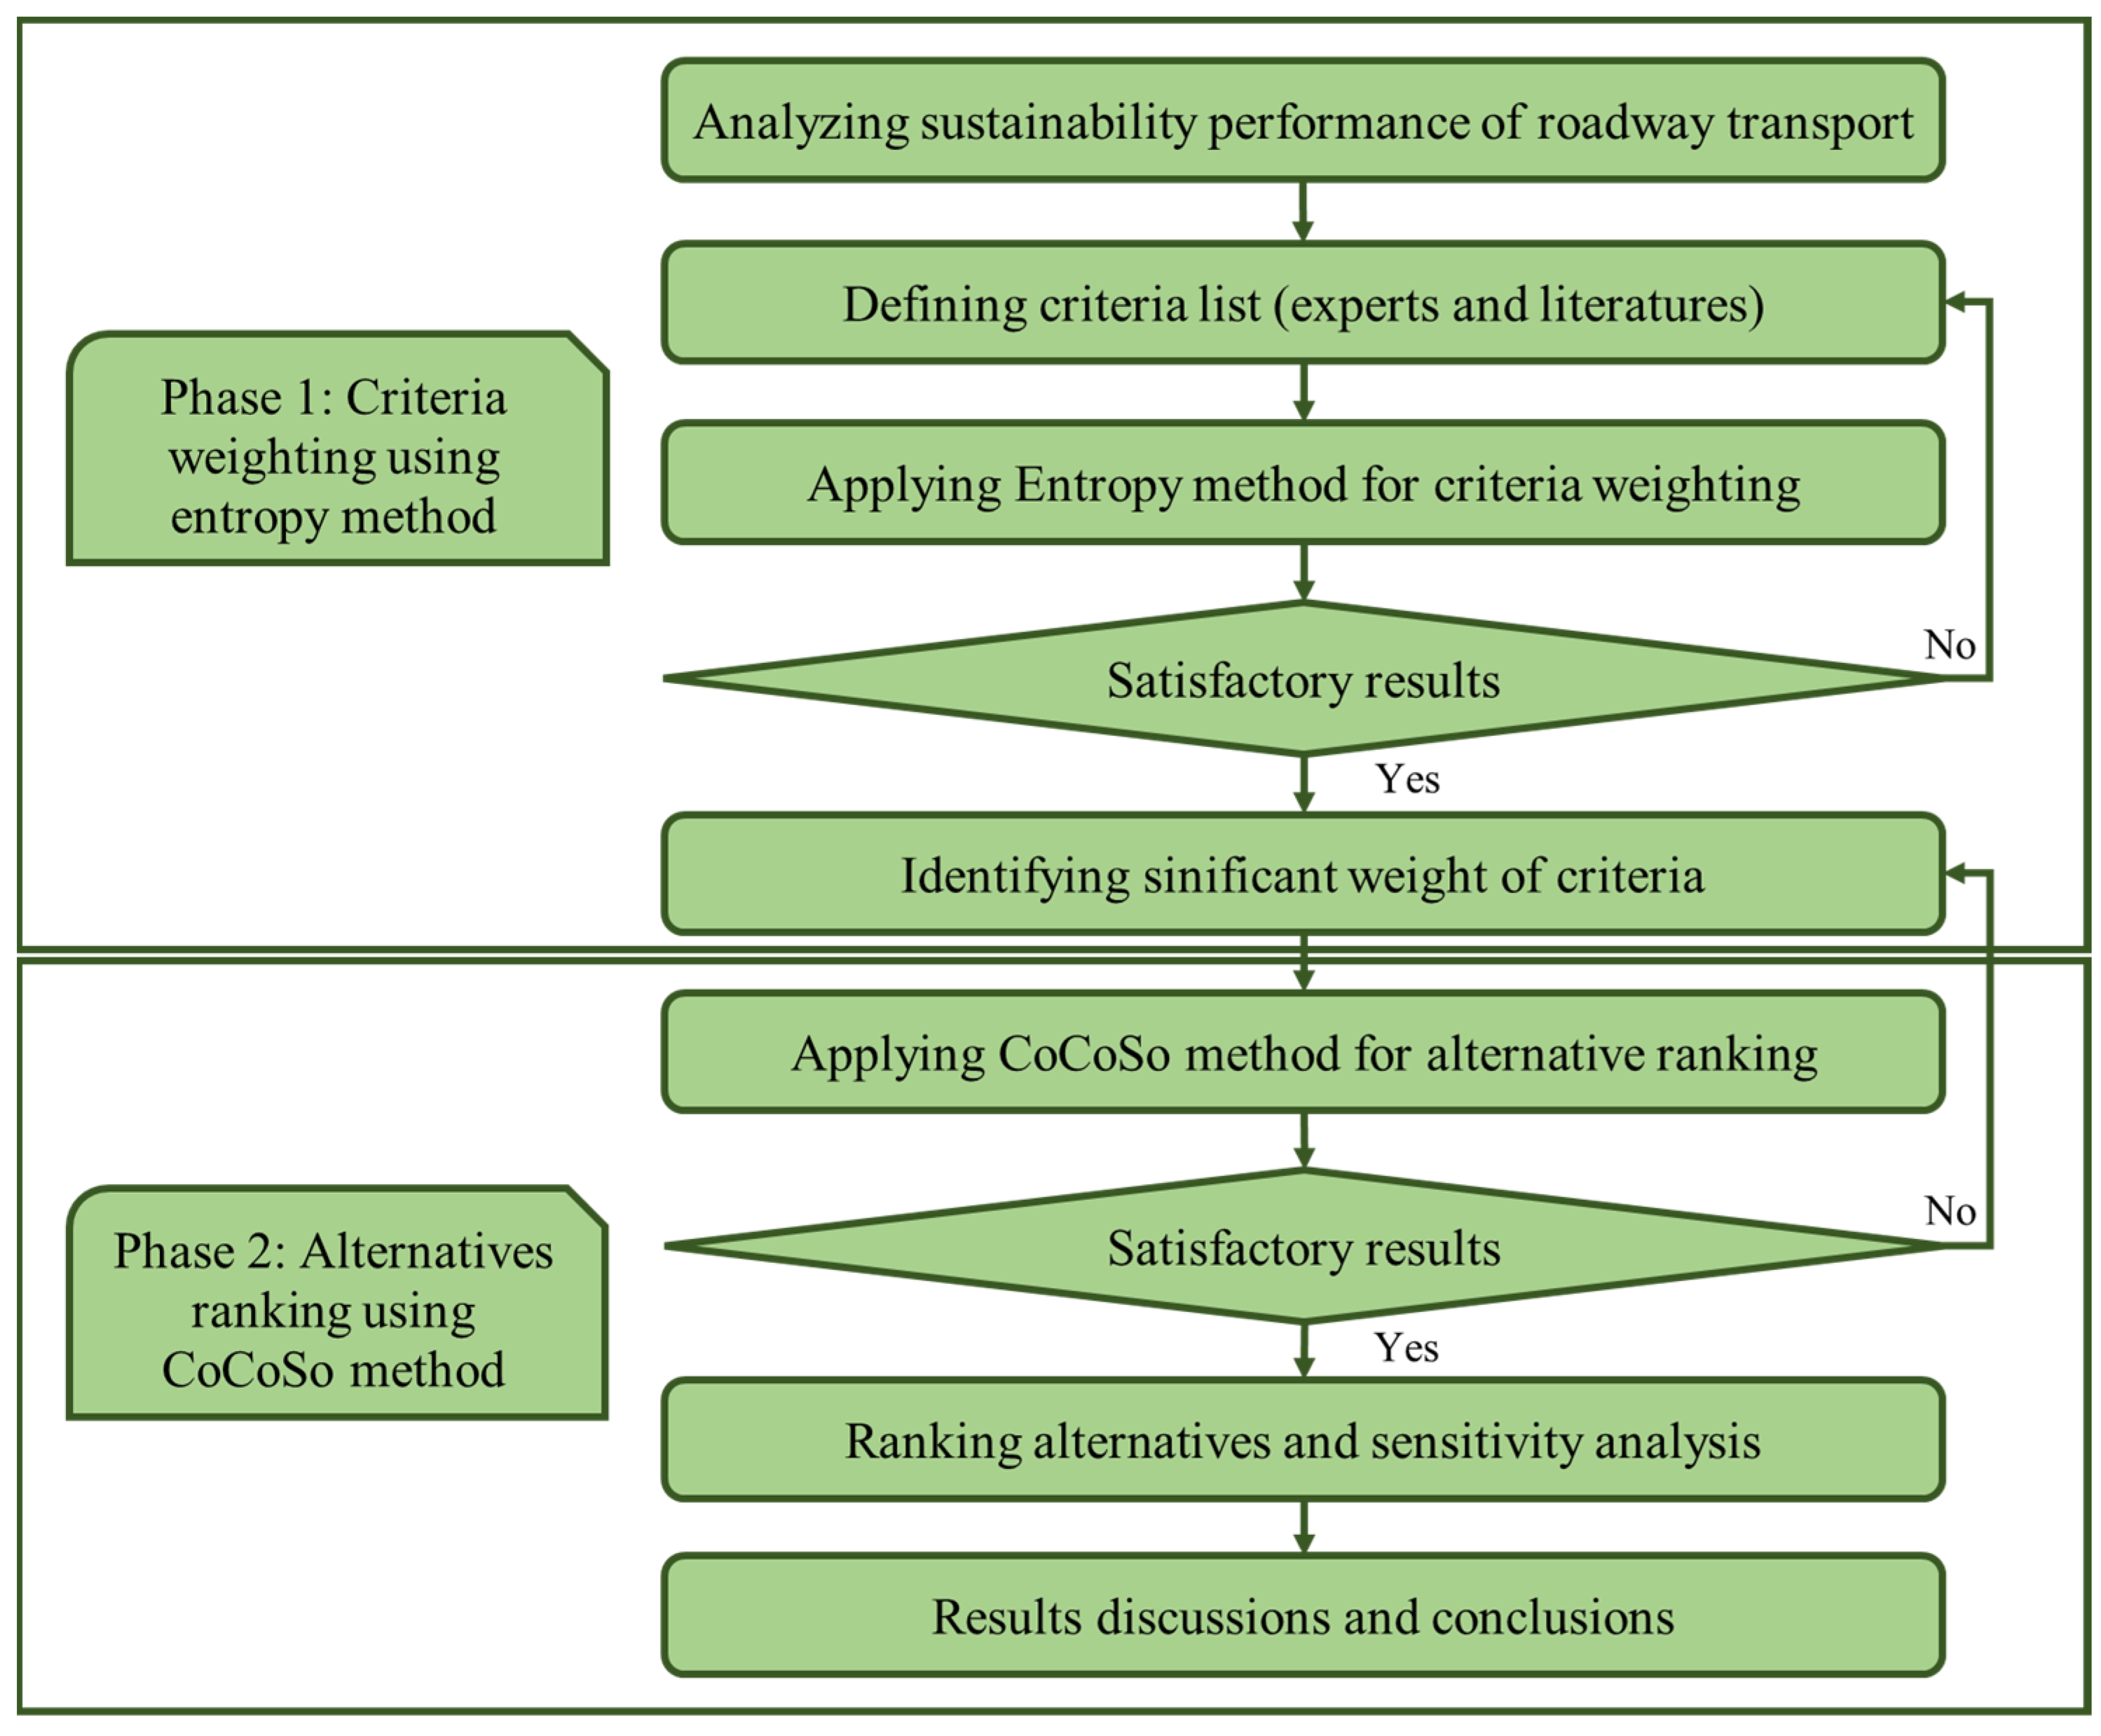
- Phase 1: Identify the criteria list and calculate the weight of criteria by using the entropy method. In the first step, the sustainability criteria are identified from the literature review. In the next step, the entropy approach is applied to determine the importance weight of each criterion.
- Phase 2: Evaluation of the sustainable road transportation systems and determine final ranking by using the CoCoSo approach. In this phase, the CoCoSo method is used to identify the ranking of candidates, and the highest performance is selected as the best choice. After evaluating the importance of alternatives, a sensitivity analysis of the study is presented. In the final stage, the paper’s results and managerial implications are presented.
3.1. Entropy Objective Weighting Method
3.2. Combined Compromise Solution (CoCoSo) Method
4. Results Analysis
4.1. A Case Study in OECD Countries
4.2. Calculation of Criteria Weights with Entropy Model
4.3. Ranking Alternatives with CoCoSo Model
4.4. Sensitivity Analysis
5. Discussion
6. Conclusions
Author Contributions
Funding
Institutional Review Board Statement
Informed Consent Statement
Data Availability Statement
Acknowledgments
Conflicts of Interest
Appendix A

| Alternative | C11 | C12 | C13 | C14 | C21 | C22 | C23 | C31 | C32 | C41 | C42 | C43 |
|---|---|---|---|---|---|---|---|---|---|---|---|---|
| A1 | 0.0106 | 0.0046 | 0.0067 | 0.0040 | 0.0116 | 0.0662 | 0.0050 | 0.0045 | 0.0974 | 0.0985 | 0.0780 | 0.0756 |
| A2 | 0.0015 | 0.0013 | 0.0008 | 0.0010 | 0.0004 | 0.0844 | 0.0015 | 0.0015 | 0.0964 | 0.1033 | 0.0836 | 0.0872 |
| A3 | 0.0018 | 0.0017 | 0.0010 | 0.0015 | 0.0006 | 0.0848 | 0.0019 | 0.0017 | 0.0962 | 0.1033 | 0.0832 | 0.0874 |
| A4 | 0.0127 | 0.0062 | 0.0084 | 0.0074 | 0.0063 | 0.0777 | 0.0063 | 0.0070 | 0.0927 | 0.0946 | 0.0746 | 0.0751 |
| A5 | 0.0007 | 0.0013 | 0.0005 | 0.0013 | 0.0034 | 0.0814 | 0.0026 | 0.0016 | 0.0973 | 0.1035 | 0.0841 | 0.0880 |
| A6 | 0.0014 | 0.0015 | 0.0012 | 0.0011 | 0.0011 | 0.0839 | 0.0008 | 0.0018 | 0.0971 | 0.1036 | 0.0831 | 0.0865 |
| A7 | 0.0076 | 0.0126 | 0.0095 | 0.0130 | 0.0140 | 0.0816 | 0.0140 | 0.0148 | 0.0822 | 0.0964 | 0.0733 | 0.0808 |
| A8 | 0.0007 | 0.0007 | 0.0004 | 0.0008 | 0.0009 | 0.0836 | 0.0012 | 0.0010 | 0.0981 | 0.1040 | 0.0843 | 0.0878 |
| A9 | 0.0018 | 0.0072 | 0.0076 | 0.0047 | 0.0014 | 0.0826 | 0.0050 | 0.0078 | 0.0927 | 0.0998 | 0.0806 | 0.0841 |
| A10 | 0.0011 | 0.0007 | 0.0008 | 0.0009 | 0.0012 | 0.0848 | 0.0009 | 0.0009 | 0.0980 | 0.1040 | 0.0841 | 0.0875 |
| A11 | 0.0131 | 0.0102 | 0.0055 | 0.0108 | 0.0082 | 0.0815 | 0.0098 | 0.0103 | 0.0953 | 0.0980 | 0.0795 | 0.0826 |
| A12 | 0.0049 | 0.0101 | 0.0049 | 0.0089 | 0.0081 | 0.0815 | 0.0102 | 0.0117 | 0.0901 | 0.0985 | 0.0787 | 0.0838 |
| A13 | 0.0025 | 0.0009 | 0.0011 | 0.0011 | 0.0019 | 0.0850 | 0.0005 | 0.0015 | 0.0974 | 0.1038 | 0.0840 | 0.0875 |
| A14 | 0.0000 | 0.0000 | 0.0000 | 0.0001 | 0.0000 | 0.0856 | 0.0000 | 0.0000 | 0.0982 | 0.1045 | 0.0847 | 0.0880 |
| A15 | 0.0028 | 0.0111 | 0.0039 | 0.0107 | 0.0025 | 0.0696 | 0.0072 | 0.0087 | 0.0891 | 0.0994 | 0.0792 | 0.0834 |
| A16 | 0.0151 | 0.0203 | 0.0065 | 0.0114 | 0.0249 | 0.0557 | 0.0183 | 0.0233 | 0.0779 | 0.0990 | 0.0659 | 0.0796 |
| A17 | 0.0012 | 0.0057 | 0.0044 | 0.0050 | 0.0111 | 0.0812 | 0.0059 | 0.0096 | 0.0860 | 0.0982 | 0.0743 | 0.0845 |
| A18 | 0.0009 | 0.0003 | 0.0016 | 0.0004 | 0.0002 | 0.0855 | 0.0001 | 0.0004 | 0.0981 | 0.1043 | 0.0846 | 0.0880 |
| A19 | 0.0006 | 0.0001 | 0.0004 | 0.0000 | 0.0001 | 0.0854 | 0.0000 | 0.0003 | 0.0981 | 0.1044 | 0.0846 | 0.0881 |
| A20 | 0.0015 | 0.0025 | 0.0013 | 0.0025 | 0.0008 | 0.0838 | 0.0032 | 0.0031 | 0.0975 | 0.1030 | 0.0822 | 0.0868 |
| A21 | 0.0010 | 0.0008 | 0.0006 | 0.0009 | 0.0032 | 0.0816 | 0.0014 | 0.0009 | 0.0981 | 0.1039 | 0.0841 | 0.0874 |
| A22 | 0.0010 | 0.0010 | 0.0007 | 0.0000 | 0.0008 | 0.0837 | 0.0007 | 0.0009 | 0.0976 | 0.1038 | 0.0842 | 0.0866 |
| A23 | 0.0049 | 0.0068 | 0.0121 | 0.0035 | 0.0020 | 0.0848 | 0.0021 | 0.0062 | 0.0966 | 0.1013 | 0.0796 | 0.0827 |
| A24 | 0.0004 | 0.0006 | 0.0010 | 0.0004 | 0.0006 | 0.0852 | 0.0003 | 0.0009 | 0.0980 | 0.1042 | 0.0842 | 0.0877 |
| A25 | 0.0003 | 0.0002 | 0.0000 | 0.0001 | 0.0001 | 0.0853 | 0.0001 | 0.0003 | 0.0979 | 0.1043 | 0.0845 | 0.0881 |
| A26 | 0.0024 | 0.0013 | 0.0013 | 0.0016 | 0.0020 | 0.0839 | 0.0018 | 0.0018 | 0.0975 | 0.1036 | 0.0842 | 0.0875 |
| A27 | 0.0028 | 0.0043 | 0.0082 | 0.0043 | 0.0060 | 0.0853 | 0.0027 | 0.0113 | 0.0889 | 0.1004 | 0.0782 | 0.0797 |
| A28 | 0.0814 | 0.0702 | 0.0879 | 0.0852 | 0.0794 | 0.0000 | 0.0779 | 0.0568 | 0.0000 | 0.0000 | 0.0000 | 0.0000 |
| Alternative | C11 | C12 | C13 | C14 | C21 | C22 | C23 | C31 | C32 | C41 | C42 | C43 |
|---|---|---|---|---|---|---|---|---|---|---|---|---|
| A1 | 0.8472 | 0.8265 | 0.7972 | 0.7700 | 0.8586 | 0.9782 | 0.8072 | 0.8660 | 0.9992 | 0.9938 | 0.9930 | 0.9865 |
| A2 | 0.7217 | 0.7572 | 0.6599 | 0.6844 | 0.6559 | 0.9988 | 0.7361 | 0.8134 | 0.9981 | 0.9988 | 0.9989 | 0.9991 |
| A3 | 0.7344 | 0.7690 | 0.6766 | 0.7080 | 0.6758 | 0.9993 | 0.7471 | 0.8185 | 0.9980 | 0.9988 | 0.9984 | 0.9993 |
| A4 | 0.8599 | 0.8439 | 0.8137 | 0.8123 | 0.8178 | 0.9918 | 0.8215 | 0.8877 | 0.9943 | 0.9896 | 0.9892 | 0.9860 |
| A5 | 0.6787 | 0.7542 | 0.6346 | 0.7001 | 0.7786 | 0.9957 | 0.7665 | 0.8169 | 0.9991 | 0.9990 | 0.9994 | 0.9998 |
| A6 | 0.7184 | 0.7649 | 0.6836 | 0.6918 | 0.7113 | 0.9984 | 0.7013 | 0.8213 | 0.9989 | 0.9991 | 0.9983 | 0.9983 |
| A7 | 0.8243 | 0.8866 | 0.8225 | 0.8520 | 0.8713 | 0.9960 | 0.8746 | 0.9266 | 0.9827 | 0.9915 | 0.9877 | 0.9924 |
| A8 | 0.6817 | 0.7230 | 0.6185 | 0.6731 | 0.7010 | 0.9980 | 0.7216 | 0.7928 | 0.9999 | 0.9994 | 0.9995 | 0.9997 |
| A9 | 0.7338 | 0.8522 | 0.8065 | 0.7813 | 0.7246 | 0.9970 | 0.8071 | 0.8935 | 0.9943 | 0.9952 | 0.9958 | 0.9959 |
| A10 | 0.7067 | 0.7201 | 0.6650 | 0.6794 | 0.7171 | 0.9993 | 0.7056 | 0.7882 | 0.9998 | 0.9994 | 0.9993 | 0.9994 |
| A11 | 0.8618 | 0.8732 | 0.7841 | 0.8386 | 0.8352 | 0.9958 | 0.8507 | 0.9073 | 0.9970 | 0.9933 | 0.9946 | 0.9943 |
| A12 | 0.7951 | 0.8728 | 0.7757 | 0.8250 | 0.8340 | 0.9959 | 0.8535 | 0.9142 | 0.9915 | 0.9939 | 0.9937 | 0.9956 |
| A13 | 0.7523 | 0.7376 | 0.6802 | 0.6877 | 0.7421 | 0.9995 | 0.6752 | 0.8147 | 0.9991 | 0.9993 | 0.9992 | 0.9994 |
| A14 | 0.0000 | 0.0000 | 0.0000 | 0.5498 | 0.0000 | 1.0000 | 0.0000 | 0.0000 | 1.0000 | 1.0000 | 1.0000 | 0.9999 |
| A15 | 0.7611 | 0.8788 | 0.7598 | 0.8378 | 0.7589 | 0.9825 | 0.8306 | 0.8988 | 0.9904 | 0.9947 | 0.9943 | 0.9952 |
| A16 | 0.8718 | 0.9167 | 0.7956 | 0.8427 | 0.9122 | 0.9639 | 0.8934 | 0.9507 | 0.9775 | 0.9944 | 0.9789 | 0.9911 |
| A17 | 0.7078 | 0.8387 | 0.7688 | 0.7847 | 0.8553 | 0.9956 | 0.8178 | 0.9041 | 0.9870 | 0.9935 | 0.9889 | 0.9963 |
| A18 | 0.6906 | 0.6749 | 0.7029 | 0.6311 | 0.6252 | 0.9999 | 0.5989 | 0.7574 | 0.9999 | 0.9997 | 0.9998 | 0.9999 |
| A19 | 0.6686 | 0.6390 | 0.6255 | 0.0000 | 0.5907 | 0.9998 | 0.5466 | 0.7366 | 0.9998 | 0.9999 | 0.9999 | 1.0000 |
| A20 | 0.7218 | 0.7904 | 0.6895 | 0.7408 | 0.6942 | 0.9983 | 0.7799 | 0.8479 | 0.9992 | 0.9985 | 0.9974 | 0.9987 |
| A21 | 0.6982 | 0.7306 | 0.6445 | 0.6767 | 0.7755 | 0.9960 | 0.7305 | 0.7896 | 0.9998 | 0.9994 | 0.9994 | 0.9992 |
| A22 | 0.6988 | 0.7408 | 0.6572 | 0.4863 | 0.6940 | 0.9982 | 0.6903 | 0.7889 | 0.9994 | 0.9992 | 0.9994 | 0.9985 |
| A23 | 0.7954 | 0.8489 | 0.8399 | 0.7620 | 0.7454 | 0.9993 | 0.7539 | 0.8814 | 0.9984 | 0.9967 | 0.9947 | 0.9944 |
| A24 | 0.6453 | 0.7160 | 0.6749 | 0.6347 | 0.6813 | 0.9996 | 0.6470 | 0.7882 | 0.9998 | 0.9996 | 0.9995 | 0.9996 |
| A25 | 0.6353 | 0.6728 | 0.5020 | 0.5677 | 0.5829 | 0.9998 | 0.5982 | 0.7389 | 0.9997 | 0.9998 | 0.9998 | 1.0000 |
| A26 | 0.7511 | 0.7578 | 0.6890 | 0.7108 | 0.7476 | 0.9983 | 0.7469 | 0.8214 | 0.9993 | 0.9990 | 0.9994 | 0.9994 |
| A27 | 0.7599 | 0.8226 | 0.8115 | 0.7746 | 0.8145 | 0.9998 | 0.7690 | 0.9121 | 0.9903 | 0.9958 | 0.9932 | 0.9912 |
| A28 | 1.0000 | 1.0000 | 1.0000 | 1.0000 | 1.0000 | 0.0000 | 1.0000 | 1.0000 | 0.0000 | 0.0000 | 0.0000 | 0.0000 |
| Country | Final Performance Score | ||||||||||
|---|---|---|---|---|---|---|---|---|---|---|---|
| λ = 0 | λ = 0.1 | λ = 0.2 | λ = 0.3 | λ = 0.4 | λ = 0.5 | λ = 0.6 | λ = 0.7 | λ = 0.8 | λ = 0.9 | λ = 1 | |
| A1 | 1.7907 | 1.7904 | 1.7901 | 1.7896 | 1.7890 | 1.7882 | 1.7871 | 1.7852 | 1.7819 | 1.7742 | 1.7360 |
| A2 | 1.6997 | 1.6996 | 1.6994 | 1.6992 | 1.6990 | 1.6987 | 1.6982 | 1.6974 | 1.6961 | 1.6929 | 1.6772 |
| A3 | 1.7147 | 1.7146 | 1.7144 | 1.7142 | 1.7139 | 1.7135 | 1.7130 | 1.7122 | 1.7106 | 1.7071 | 1.6896 |
| A4 | 1.8072 | 1.8069 | 1.8066 | 1.8061 | 1.8055 | 1.8048 | 1.8036 | 1.8019 | 1.7987 | 1.7913 | 1.7547 |
| A5 | 1.7151 | 1.7150 | 1.7149 | 1.7147 | 1.7144 | 1.7140 | 1.7135 | 1.7127 | 1.7112 | 1.7077 | 1.6907 |
| A6 | 1.7082 | 1.7081 | 1.7079 | 1.7077 | 1.7074 | 1.7070 | 1.7065 | 1.7057 | 1.7041 | 1.7006 | 1.6831 |
| A7 | 1.8596 | 1.8594 | 1.8592 | 1.8589 | 1.8586 | 1.8581 | 1.8574 | 1.8563 | 1.8543 | 1.8497 | 1.8269 |
| A8 | 1.6854 | 1.6853 | 1.6852 | 1.6850 | 1.6848 | 1.6846 | 1.6842 | 1.6836 | 1.6826 | 1.6803 | 1.6685 |
| A9 | 1.7826 | 1.7824 | 1.7822 | 1.7819 | 1.7815 | 1.7809 | 1.7802 | 1.7790 | 1.7768 | 1.7717 | 1.7466 |
| A10 | 1.6959 | 1.6958 | 1.6957 | 1.6955 | 1.6953 | 1.6950 | 1.6946 | 1.6940 | 1.6929 | 1.6902 | 1.6772 |
| A11 | 1.8532 | 1.8530 | 1.8529 | 1.8527 | 1.8524 | 1.8520 | 1.8515 | 1.8507 | 1.8492 | 1.8458 | 1.8288 |
| A12 | 1.8306 | 1.8304 | 1.8302 | 1.8299 | 1.8296 | 1.8291 | 1.8284 | 1.8273 | 1.8253 | 1.8206 | 1.7976 |
| A13 | 1.7117 | 1.7116 | 1.7115 | 1.7113 | 1.7111 | 1.7107 | 1.7103 | 1.7096 | 1.7083 | 1.7052 | 1.6903 |
| A14 | 1.1145 | 1.1154 | 1.1166 | 1.1182 | 1.1202 | 1.1229 | 1.1268 | 1.1330 | 1.1439 | 1.1690 | 1.2866 |
| A15 | 1.7898 | 1.7895 | 1.7892 | 1.7888 | 1.7883 | 1.7875 | 1.7865 | 1.7849 | 1.7820 | 1.7752 | 1.7416 |
| A16 | 1.8686 | 1.8684 | 1.8681 | 1.8678 | 1.8674 | 1.8669 | 1.8660 | 1.8648 | 1.8625 | 1.8571 | 1.8306 |
| A17 | 1.7836 | 1.7833 | 1.7830 | 1.7826 | 1.7821 | 1.7814 | 1.7804 | 1.7789 | 1.7761 | 1.7695 | 1.7370 |
| A18 | 1.6564 | 1.6564 | 1.6563 | 1.6563 | 1.6562 | 1.6561 | 1.6560 | 1.6558 | 1.6555 | 1.6547 | 1.6507 |
| A19 | 1.5408 | 1.5409 | 1.5411 | 1.5414 | 1.5418 | 1.5422 | 1.5429 | 1.5440 | 1.5459 | 1.5504 | 1.5724 |
| A20 | 1.7347 | 1.7346 | 1.7344 | 1.7341 | 1.7338 | 1.7334 | 1.7328 | 1.7319 | 1.7302 | 1.7262 | 1.7065 |
| A21 | 1.7028 | 1.7027 | 1.7025 | 1.7024 | 1.7021 | 1.7018 | 1.7013 | 1.7005 | 1.6992 | 1.6960 | 1.6805 |
| A22 | 1.6628 | 1.6628 | 1.6627 | 1.6626 | 1.6625 | 1.6623 | 1.6620 | 1.6616 | 1.6609 | 1.6592 | 1.6509 |
| A23 | 1.7931 | 1.7929 | 1.7927 | 1.7924 | 1.7921 | 1.7916 | 1.7910 | 1.7899 | 1.7881 | 1.7837 | 1.7622 |
| A24 | 1.6695 | 1.6694 | 1.6693 | 1.6692 | 1.6691 | 1.6689 | 1.6687 | 1.6683 | 1.6676 | 1.6661 | 1.6583 |
| A25 | 1.6041 | 1.6041 | 1.6042 | 1.6042 | 1.6043 | 1.6045 | 1.6047 | 1.6050 | 1.6055 | 1.6068 | 1.6130 |
| A26 | 1.7306 | 1.7305 | 1.7303 | 1.7301 | 1.7298 | 1.7295 | 1.7289 | 1.7280 | 1.7265 | 1.7228 | 1.7048 |
| A27 | 1.7873 | 1.7871 | 1.7868 | 1.7865 | 1.7860 | 1.7854 | 1.7845 | 1.7831 | 1.7806 | 1.7747 | 1.7456 |
| A28 | 1.3697 | 1.3707 | 1.3720 | 1.3736 | 1.3757 | 1.3785 | 1.3825 | 1.3889 | 1.4002 | 1.4262 | 1.5491 |
References
- Wang, C.; Wood, J.; Wang, Y.; Geng, X.; Long, X. CO2 Emission in Transportation Sector across 51 Countries along the Belt and Road from 2000 to 2014. J. Clean. Prod. 2020, 266, 122000. [Google Scholar] [CrossRef]
- Alias, C.; Broß, H.; zum Felde, J.; Gründer, D. Enabling Decentralized Transshipment in Waterborne Container Transportation. Hambg. Int. Conf. Logist. 2021, 32, 137–166. [Google Scholar]
- Broniewicz, E.; Ogrodnik, K. Multi-Criteria Analysis of Transport Infrastructure Projects. Transp. Res. Part D Transp. Environ. 2020, 83, 102351. [Google Scholar] [CrossRef]
- Marleau Donais, F.; Abi-Zeid, I.; Waygood, E.O.D.; Lavoie, R. Municipal Decision-Making for Sustainable Transportation: Towards Improving Current Practices for Street Rejuvenation in Canada. Transp. Res. Part A Policy Pract. 2022, 156, 152–170. [Google Scholar] [CrossRef]
- Richardson, B.C. Toward a Policy on a Sustainable Transportation System. Transp. Res. Rec. 1999, 1670, 27–34. [Google Scholar] [CrossRef]
- Deakin, M.; Curwell, S.; Lombardi, P. Sustainable Urban Development: The Framework and Directory of Assessment Methods. J. Environ. Assess. Policy Manag. 2002, 04, 171–197. [Google Scholar] [CrossRef]
- Demir, E.; Bektaş, T.; Laporte, G. A Review of Recent Research on Green Road Freight Transportation. Eur. J. Oper. Res. 2014, 237, 775–793. [Google Scholar] [CrossRef] [Green Version]
- Litman, T.; Burwell, D. Issues in Sustainable Transportation. Int. J. Glob. Environ. Issues 2006, 6, 331–347. [Google Scholar] [CrossRef]
- Jeon, C.M. Incorporating Sustainability into Transportation Planning and Decision Making: Definitions, Performance Measures, and Evaluation; Georgia Institute of Technology: 2007. Available online: https://www.proquest.com/docview/304876096?pq-origsite=gscholar&fromopenview=true (accessed on 15 March 2022).
- Shiau, T.-A.; Jhang, J.-S. An Integration Model of DEA and RST for Measuring Transport Sustainability. Int. J. Sustain. Dev. World Ecol. 2010, 17, 76–83. [Google Scholar] [CrossRef]
- Castillo, H.; Pitfield, D.E. ELASTIC—A Methodological Framework for Identifying and Selecting Sustainable Transport Indicators. Transp. Res. Part D Transp. Environ. 2010, 15, 179–188. [Google Scholar] [CrossRef] [Green Version]
- Maheshwari, P.; Kachroo, P.; Paz, A.; Khaddar, R. Development of Control Models for the Planning of Sustainable Transportation Systems. Transp. Res. Part C Emerg. Technol. 2015, 55, 474–485. [Google Scholar] [CrossRef] [Green Version]
- López, E.; Monzón, A. Integration of Sustainability Issues in Strategic Transportation Planning: A Multi-Criteria Model for the Assessment of Transport Infrastructure Plans. Comput.-Aided Civ. Infrastruct. Eng. 2010, 25, 440–451. [Google Scholar] [CrossRef]
- Rivero Gutiérrez, L.; de Vicente Oliva, M.A.; Romero-Ania, A. Managing Sustainable Urban Public Transport Systems: An AHP Multicriteria Decision Model. Sustainability 2021, 13, 4614. [Google Scholar] [CrossRef]
- Sung, M.-S.; Shih, S.-G.; Perng, Y.-H. Multi-Criteria Evaluation of Site Selection for Smart Community Demonstration Projects. Smart Cities 2022, 5, 22–33. [Google Scholar] [CrossRef]
- Colasante, A.; D’Adamo, I.; Morone, P.; Rosa, P. Assessing the Circularity Performance in a European Cross-Country Comparison. Environ. Impact Assess. Rev. 2022, 93, 106730. [Google Scholar] [CrossRef]
- Macharis, C.; Bernardini, A. Reviewing the Use of Multi-Criteria Decision Analysis for the Evaluation of Transport Projects: Time for a Multi-Actor Approach. Transp. Policy 2015, 37, 177–186. [Google Scholar] [CrossRef]
- Kumar, A.; Sah, B.; Singh, A.R.; Deng, Y.; He, X.; Kumar, P.; Bansal, R.C. A Review of Multi Criteria Decision Making (MCDM) towards Sustainable Renewable Energy Development. Renew. Sustain. Energy Rev. 2017, 69, 596–609. [Google Scholar] [CrossRef]
- Yedla, S.; Shrestha, R.M. Multi-Criteria Approach for the Selection of Alternative Options for Environmentally Sustainable Transport System in Delhi. Transp. Res. Part A Policy Pract. 2003, 37, 717–729. [Google Scholar] [CrossRef]
- Bojković, N.; Macura, D.; Pejčić-Tarle, S.; Bojović, N. A Comparative Assessment of Transport-Sustainability in Central and Eastern European Countries with a Brief Reference to the Republic of Serbia. Int. J. Sustain. Transp. 2011, 5, 319–344. [Google Scholar] [CrossRef]
- Jones, S.; Tefe, M.; Appiah-Opoku, S. Proposed Framework for Sustainability Screening of Urban Transport Projects in Developing Countries: A Case Study of Accra, Ghana. Transp. Res. Part A Policy Pract. 2013, 49, 21–34. [Google Scholar] [CrossRef]
- Yang, C.H.; Lee, K.C.; Chen, H.C. Incorporating Carbon Footprint with Activity-Based Costing Constraints into Sustainable Public Transport Infrastructure Project Decisions. J. Clean. Prod. 2016, 133, 1154–1166. [Google Scholar] [CrossRef]
- Pathak, D.K.; Thakur, L.S.; Rahman, S. Performance Evaluation Framework for Sustainable Freight Transportation Systems. Int. J. Prod. Res. 2019, 57, 6202–6222. [Google Scholar] [CrossRef]
- Seker, S.; Aydin, N. Sustainable Public Transportation System Evaluation: A Novel Two-Stage Hybrid Method Based on IVIF-AHP and CODAS. Int. J. Fuzzy Syst. 2020, 22, 257–272. [Google Scholar] [CrossRef]
- Rao, S.H. A Hybrid MCDM Model Based on DEMATEL and ANP for Improving the Measurement of Corporate Sustainability Indicators: A Study of Taiwan High Speed Rail. Res. Transp. Bus. Manag. 2021, 41, 100657. [Google Scholar] [CrossRef]
- Awasthi, A.; Chauhan, S.S.; Omrani, H. Application of Fuzzy TOPSIS in Evaluating Sustainable Transportation Systems. Expert Syst. Appl. 2011, 38, 12270–12280. [Google Scholar] [CrossRef]
- Li, Y.; Zhao, L.; Suo, J. Comprehensive Assessment on Sustainable Development of Highway Transportation Capacity Based on Entropy Weight and TOPSIS. Sustainability 2014, 6, 4685–4693. [Google Scholar] [CrossRef] [Green Version]
- Yazdani, M.; Pamucar, D.; Chatterjee, P.; Chakraborty, S. Development of a Decision Support Framework for Sustainable Freight Transport System Evaluation Using Rough Numbers. Int. J. Prod. Res. 2020, 58, 4325–4351. [Google Scholar] [CrossRef]
- Broniewicz, E.; Ogrodnik, K. A Comparative Evaluation of Multi-Criteria Analysis Methods for Sustainable Transport. Energies 2021, 14, 5100. [Google Scholar] [CrossRef]
- Tian, N.; Tang, S.; Che, A.; Wu, P. Measuring Regional Transport Sustainability Using Super-Efficiency SBM-DEA with Weighting Preference. J. Clean. Prod. 2020, 242, 118474. [Google Scholar] [CrossRef]
- Wang, C.-N.; Le, T.Q.; Yu, C.-H.; Ling, H.-C.; Dang, T.-T. Strategic Environmental Assessment of Land Transportation: An Application of DEA with Undesirable Output Approach. Sustainability 2022, 14, 972. [Google Scholar] [CrossRef]
- Bojković, N.; Anić, I.; Pejčić-Tarle, S. One Solution for Cross-Country Transport-Sustainability Evaluation Using a Modified ELECTRE Method. Ecol. Econ. 2010, 69, 1176–1186. [Google Scholar] [CrossRef]
- Mavi, R.K.; Goh, M.; Zarbakhshnia, N. Sustainable Third-Party Reverse Logistic Provider Selection with Fuzzy SWARA and Fuzzy MOORA in Plastic Industry. Int. J. Adv. Manuf. Technol. 2017, 91, 2401–2418. [Google Scholar] [CrossRef]
- Oses, U.; Rojí, E.; Cuadrado, J.; Larrauri, M. Multiple-Criteria Decision-Making Tool for Local Governments to Evaluate the Global and Local Sustainability of Transportation Systems in Urban Areas: Case Study. J. Urban Plan. Dev. 2018, 144, 04017019. [Google Scholar] [CrossRef]
- Ecer, F.; Pamucar, D.; Hashemkhani Zolfani, S.; Keshavarz Eshkalag, M. Sustainability Assessment of OPEC Countries: Application of a Multiple Attribute Decision Making Tool. J. Clean. Prod. 2019, 241, 118324. [Google Scholar] [CrossRef]
- Wang, C.-N.; Nguyen, N.-A.-T.; Dang, T.-T.; Hsu, H.-P. Evaluating Sustainable Last-Mile Delivery (LMD) in B2C E-Commerce Using Two-Stage Fuzzy MCDM Approach: A Case Study from Vietnam. IEEE Access 2021, 9, 146050–146067. [Google Scholar] [CrossRef]
- Wang, C.-N.; Nguyen, N.-A.-T.; Dang, T.-T.; Lu, C.-M. A Compromised Decision-Making Approach to Third-Party Logistics Selection in Sustainable Supply Chain Using Fuzzy Ahp and Fuzzy Vikor Methods. Mathematics 2021, 9, 886. [Google Scholar] [CrossRef]
- Wang, J.J.; Jing, Y.Y.; Zhang, C.F.; Zhao, J.H. Review on Multi-Criteria Decision Analysis Aid in Sustainable Energy Decision-Making. Renew. Sustain. Energy Rev. 2009, 13, 2263–2278. [Google Scholar] [CrossRef]
- Odu, G.O. Weighting Methods for Multi-Criteria Decision Making Technique. J. Appl. Sci. Environ. Manag. 2019, 23, 1449. [Google Scholar] [CrossRef] [Green Version]
- Deng, H.; Yeh, C.H.; Willis, R.J. Inter-Company Comparison Using Modified TOPSIS with Objective Weights. Comput. Oper. Res. 2000, 27, 963–973. [Google Scholar] [CrossRef]
- Wang, Y.M.; Luo, Y. Integration of Correlations with Standard Deviations for Determining Attribute Weights in Multiple Attribute Decision Making. Math. Comput. Model. 2010, 51, 1–12. [Google Scholar] [CrossRef]
- Rao, R.V.; Patel, B.K. A Subjective and Objective Integrated Multiple Attribute Decision Making Method for Material Selection. Mater. Des. 2010, 31, 4738–4747. [Google Scholar] [CrossRef]
- Aggarwal, M. Attitude-based entropy function and applications in decision-making. Eng. Appl. Artif. Intell. 2021, 104, 104290. [Google Scholar] [CrossRef]
- Diakoulaki, D.; Mavrotas, G.; Papayannakis, L. Determining Objective Weights in Multiple Criteria Problems: The Critic Method. Comput. Oper. Res. 1995, 22, 763–770. [Google Scholar] [CrossRef]
- Fu, Y.; Li, M.; Luo, H.; Huang, G.Q. Industrial Robot Selection Using Stochastic Multicriteria Acceptability Analysis for Group Decision Making. Robot. Auton. Syst. 2019, 122, 103304. [Google Scholar] [CrossRef]
- Kumar, R.; Singh, S.; Bilga, P.S.; Singh, J.; Singh, S.; Scutaru, M.L.; Pruncu, C.I. Revealing the Benefits of Entropy Weights Method for Multi-Objective Optimization in Machining Operations: A Critical Review. J. Mater. Res. Technol. 2021, 10, 1471–1492. [Google Scholar] [CrossRef]
- Hafezalkotob, A.; Hafezalkotob, A. Extended MULTIMOORA Method Based on Shannon Entropy Weight for Materials Selection. J. Ind. Eng. Int. 2016, 12, 1–13. [Google Scholar] [CrossRef] [Green Version]
- Wang, Q.; Liu, Y.; Zhang, X.; Fu, H.; Lin, S.; Song, S.; Niu, C. Study on an AHP-Entropy-ANFIS Model for the Prediction of the Unfrozen Water Content of Sodium-Bicarbonate-Type Salinization Frozen Soil. Mathematics 2020, 8, 1209. [Google Scholar] [CrossRef]
- Şengül, Ü.; Eren, M.; Eslamian Shiraz, S.; Gezder, V.; Sengül, A.B. Fuzzy TOPSIS Method for Ranking Renewable Energy Supply Systems in Turkey. Renew. Energy 2015, 75, 617–625. [Google Scholar] [CrossRef]
- Stanković, J.J.; Marjanović, I.; Papathanasiou, J.; Drezgić, S. Social, Economic and Environmental Sustainability of Port Regions: MCDM Approach in Composite Index Creation. J. Mar. Sci. Eng. 2021, 9, 74. [Google Scholar] [CrossRef]
- Shannon, C.E. A Mathematical Theory of Communication. Bell Syst. Tech. J. 1948, 27, 379–423. [Google Scholar] [CrossRef] [Green Version]
- Li, H.; Wang, W.; Fan, L.; Li, Q.; Chen, X. A Novel Hybrid MCDM Model for Machine Tool Selection Using Fuzzy DEMATEL, Entropy Weighting and Later Defuzzification VIKOR. Appl. Soft Comput. 2020, 91, 106207. [Google Scholar] [CrossRef]
- Yazdani, M.; Zarate, P.; Zavadskas, E.K.; Turskis, Z. A Combined Compromise Solution (CoCoSo) Method for Multi-Criteria Decision-Making Problems. Manag. Decis. 2019, 57, 2501–2519. [Google Scholar] [CrossRef]
- Haghshenas, H.; Vaziri, M. Urban Sustainable Transportation Indicators for Global Comparison. Ecol. Indic. 2012, 15, 115–121. [Google Scholar] [CrossRef]
- Tirkolaee, E.B.; Aydin, N.S. Integrated design of sustainable supply chain and transportation network using a fuzzy bi-level decision support system for perishable products. Expert Syst. Appl. 2022, 195, 116628. [Google Scholar] [CrossRef]
- OECD Annual Statistics. Available online: https://stats.oecd.org/index.aspx?r=779737 (accessed on 15 March 2022).
- UNECE Transport Statistics Database. Available online: https://w3.unece.org/PXWeb/en/TableDomains/?fbclid=IwAR19yIHpHWTQwcqO1o2HhoBosZceXJmetZj0dtgqwCOt8wvbxEcRDL1A0Ys (accessed on 15 March 2022).
- Workbank Database. Available online: https://databank.worldbank.org/indicator/NY.GDP.PCAP.CD/1ff4a498/Popular-Indicators?fbclid=IwAR0vlTUVT71cyydfr2ktI86KhNSZ_nJcWi0h5vPL0VoqXTOGmZAwMVcwDU4 (accessed on 15 March 2022).
- European Statistics. Available online: https://ec.europa.eu/eurostat/web/main/data/database?fbclid=IwAR0RnZWbkyF0YdaL6WkZAOMTiUcbecOaKqzFv1uuL29d-YtCJwY9ommeHLo (accessed on 15 March 2022).
- Naganathan, H.; Chong, W.K. Evaluation of State Sustainable Transportation Performances (SSTP) Using Sustainable Indicators. Sustain. Cities Soc. 2017, 35, 799–815. [Google Scholar] [CrossRef]
- Sayyadi, R.; Awasthi, A. An Integrated Approach Based on System Dynamics and ANP for Evaluating Sustainable Transportation Policies. Int. J. Syst. Sci. Oper. Logist. 2020, 7, 182–191. [Google Scholar] [CrossRef]
- Camargo Pérez, J.; Carrillo, M.H.; Montoya-Torres, J.R. Multi-Criteria Approaches for Urban Passenger Transport Systems: A Literature Review. Ann. Oper. Res. 2015, 226, 69–87. [Google Scholar] [CrossRef]
- Rao, S.H. Transportation Synthetic Sustainability Indices: A Case of Taiwan Intercity Railway Transport. Ecol. Indic. 2021, 127, 107753. [Google Scholar] [CrossRef]
- Miller, P.; de Barros, A.G.; Kattan, L.; Wirasinghe, S.C. Public Transportation and Sustainability: A Review. KSCE J. Civ. Eng. 2016, 20, 1076–1083. [Google Scholar] [CrossRef]
- Osorio-Tejada, J.L.; Llera-Sastresa, E.; Scarpellini, S. A Multi-Criteria Sustainability Assessment for Biodiesel and Liquefied Natural Gas as Alternative Fuels in Transport Systems. J. Nat. Gas Sci. Eng. 2017, 42, 169–186. [Google Scholar] [CrossRef] [Green Version]
- Shiau, T.-A.; Huang, M.-W.; Lin, W.-Y. Developing an Indicator System for Measuring Taiwan’s Transport Sustainability. Int. J. Sustain. Transp. 2015, 9, 81–92. [Google Scholar] [CrossRef]
- Rajak, S.; Parthiban, P.; Dhanalakshmi, R. Sustainable Transportation Systems Performance Evaluation Using Fuzzy Logic. Ecol. Indic. 2016, 71, 503–513. [Google Scholar] [CrossRef]

| No. | Authors | Year | Multi-Criteria Decision-Making Method | Sensitivity Analysis | ||||||||||||
|---|---|---|---|---|---|---|---|---|---|---|---|---|---|---|---|---|
| AHP/ANP | TOPSIS | CODAS | VIKOR | DEA | DEMATEL | Delphi | MABAC | SWARA | MOORA | MIVES | ELECTRE | REMBRANDT | ||||
| 1 | Yedla and Shresth [20] | 2003 | x | |||||||||||||
| 2 | Bojković et al. [33] | 2010 | x | |||||||||||||
| 3 | Bojković et al. [21] | 2011 | x | |||||||||||||
| 4 | Awasthi et al. [27] | 2011 | x | x | ||||||||||||
| 5 | Jones et al. [22] | 2013 | x | |||||||||||||
| 6 | Li et al. [28] | 2014 | x | |||||||||||||
| 7 | Yang et al. [23] | 2016 | x | x | ||||||||||||
| 8 | Mavi et al. [34] | 2017 | x | x | ||||||||||||
| 9 | Oses et al. [35] | 2018 | x | |||||||||||||
| 10 | Pathak et al. [24] | 2019 | x | x | ||||||||||||
| 11 | Tian et al. [31] | 2020 | x | |||||||||||||
| 12 | Seker and Aydin [25] | 2020 | x | x | x | |||||||||||
| 13 | Yazdani et al. [29] | 2020 | x | x | x | |||||||||||
| 14 | Rao [26] | 2021 | x | x | ||||||||||||
| 15 | Broniewicz et al. [30] | 2021 | x | x | x | |||||||||||
| 16 | Wang et al. [32] | 2022 | x | |||||||||||||
| Alternative | Country | DMU | Alternative | Country | DMU |
|---|---|---|---|---|---|
| A1 | Australia | AUS | A15 | Italy | ITA |
| A2 | Austria | AUT | A16 | Japan | JPN |
| A3 | Belgium | BEL | A17 | Korea | KOR |
| A4 | Canada | CAN | A18 | Lithuania | LTU |
| A5 | Switzerland | CHE | A19 | Latvia | LVA |
| A6 | Czech Republic | CZE | A20 | The Netherlands | NLD |
| A7 | Germany | DEU | A21 | Norway | NOR |
| A8 | Denmark | DNK | A22 | New Zealand | NZL |
| A9 | Spain | ESP | A23 | Poland | POL |
| A10 | Finland | FIN | A24 | Slovak Republic | SVK |
| A11 | France | FRA | A25 | Slovenia | SVN |
| A12 | United Kingdom | GBR | A26 | Sweden | SWE |
| A13 | Hungary | HUN | A27 | Turkey | TUR |
| A14 | Iceland | ISL | A28 | United States | USA |
| Sustainability Dimension | Criteria | Definition | References |
|---|---|---|---|
| C1. System effectiveness | C11. Roadway length | The total length of transport routes available for the use of roadway vehicles | [31,61,62] |
| C12. Vehicles in use | The number of vehicles registered to the authorities | [31,35,61,62,63] | |
| C13. Freight turnover volume | The total movement of goods by using road transportation mode on the national network | [31] | |
| C14. Passenger turnover volume | The total movement of passengers by using road transportation mode on the national network | [31,64] | |
| C2. Economic | C21. Capital investment | The total spending on new road transport construction and the improvement of the existing road network | [31,63,65,66] |
| C22. Infrastructure maintenance | The total spending on the preservation of the existing road transportation network. It only covers maintenance expenditures financed by public administrations | [63,65,66] | |
| C23. GDP | The total monetary value of all goods and services produced in a country during a specific time | [62] | |
| C3. Social | C31. Number of employees | The number of people of working age who have a contract of employment and receive compensation at the organization, the place of business in a country or area | [31,61,66] |
| C32. Road accidents | The number of traffic accidents, which is defined as a collision involving one or more vehicles on the road | [31,35,63,64,65] | |
| C4. Environmental | C41. Fuel consumption | The amount of fuel consumed by road transport modes | [31,35,61,62,63,64] |
| C42. CO2 emissions | The gross direct emissions stemming from the combustion of fuels | [31,35,61,63,64] | |
| C43. Air pollution emissions | The amount of air pollutants emitted into the atmosphere including emissions of sulfur oxides (SOx) and nitrogen oxides (NOx), emissions of carbon monoxide (CO) | [31,61,62,63,65,66] |
| Criteria | Unit | Max | Min | Average | SD |
|---|---|---|---|---|---|
| Roadway length | Km | 6,853,024 | 13,000 | 543,212 | 1,264,278 |
| Vehicles in use | Thousands of vehicles | 268,521 | 269 | 25,425 | 50,272 |
| Freight turnover volume | Million ton–kilometer | 2,871,321 | 1178 | 209,013 | 524,043 |
| Passenger turnover volume | Million passenger–kilometer | 6,758,274 | 2142 | 519,152 | 1,239,966 |
| Capital investment | Millions USD | 108,996 | 115 | 9553 | 20,584 |
| Infrastructure maintenance | Millions USD | 54,749 | 97 | 4660 | 10,527 |
| GDP | Millions USD | 21,433,225 | 24,837 | 1,804,107 | 3,970,529 |
| Number of employees | Thousands of persons | 167,329,067 | 215,408 | 20,217,316 | 32,571,282 |
| Road accidents | Number of accidents | 1,839,311 | 770 | 134,298 | 342,284 |
| Fuel consumption | Thousand tons of oil equivalent | 718,375 | 360 | 44,831 | 131,040 |
| CO2 emissions | Million tons | 4744 | 2 | 376 | 877 |
| Air pollution emissions | Thousand tons | 50,135 | 130 | 3684 | 9182 |
| Country | C11 | C12 | C13 | C14 | C21 | C22 | C23 | C31 | C32 | C41 | C42 | C43 |
|---|---|---|---|---|---|---|---|---|---|---|---|---|
| Australia | 904,927 | 18,008 | 218,903 | 317,158 | 16,070 | 12,495 | 1,396,567 | 13,500,080 | 16,145 | 41,760 | 381 | 7265 |
| Austria | 137,492 | 5357 | 26,502 | 81,118 | 652 | 872 | 445,075 | 4,622,075 | 35,736 | 8895 | 63 | 650 |
| Belgium | 167,205 | 6614 | 34,829 | 119,774 | 897 | 563 | 533,255 | 5,137,174 | 37,699 | 8841 | 90 | 553 |
| Canada | 1,083,239 | 24,144 | 275,821 | 592,038 | 8750 | 5109 | 1,741,576 | 20,743,970 | 104,829 | 68,544 | 571 | 7510 |
| Switzerland | 71,545 | 5081 | 17,426 | 105,245 | 4765 | 2784 | 731,474 | 4,965,077 | 17,761 | 7211 | 36 | 224 |
| Czech Republic | 130,585 | 6149 | 39,059 | 91,726 | 1604 | 1140 | 250,686 | 5,441,332 | 20,806 | 6778 | 94 | 1070 |
| Germany | 650,000 | 48,529 | 311,869 | 1,033,501 | 19,314 | 2626 | 3,861,124 | 43,871,267 | 300,143 | 56,351 | 644 | 4278 |
| Denmark | 74,801 | 2905 | 13,298 | 67,196 | 1355 | 1345 | 350,104 | 3,023,904 | 2808 | 4293 | 28 | 316 |
| Spain | 165,683 | 27,711 | 249,555 | 375,891 | 1998 | 1998 | 1,393,491 | 23,227,683 | 104,077 | 32,940 | 231 | 2398 |
| Finland | 109,080 | 2756 | 28,847 | 74,700 | 1766 | 573 | 268,966 | 2,748,960 | 3984 | 4178 | 40 | 488 |
| France | 1,114,011 | 39,124 | 181,400 | 859,367 | 11,387 | 2697 | 2,715,518 | 30,385,859 | 56,016 | 45,208 | 294 | 3254 |
| United Kingdom | 422,134 | 38,879 | 160,550 | 709,254 | 11,185 | 2682 | 2,830,814 | 34,639,274 | 153,158 | 41,463 | 342 | 2578 |
| Hungary | 220,402 | 3772 | 36,951 | 85,756 | 2655 | 436 | 163,504 | 4,750,636 | 16,627 | 5068 | 45 | 485 |
| Iceland | 13,000 | 269 | 1178 | 8200 | 115 | 97 | 24,837 | 215,408 | 770 | 360 | 2 | 196 |
| Italy | 252,003 | 42,799 | 127,225 | 849,198 | 3485 | 10,273 | 2,004,913 | 25,787,158 | 172,183 | 35,861 | 309 | 2795 |
| Japan | 1,281,000 | 77,889 | 213,836 | 909,598 | 34,307 | 19,172 | 5,064,873 | 68,838,956 | 381,237 | 38,215 | 1056 | 4962 |
| Korea | 111,079 | 22,144 | 145,225 | 394,954 | 15,318 | 2868 | 1,646,739 | 28,541,664 | 229,600 | 43,819 | 586 | 2166 |
| Lithuania | 85,429 | 1257 | 53,117 | 32,669 | 408 | 171 | 54,640 | 1,469,927 | 3289 | 2151 | 11 | 178 |
| Latvia | 61,695 | 722 | 14,965 | 2142 | 259 | 208 | 34,055 | 983,777 | 3724 | 1102 | 7 | 156 |
| The Netherlands | 137,603 | 9651 | 42,905 | 202,105 | 1211 | 1197 | 907,051 | 9,374,012 | 14,829 | 10,933 | 146 | 862 |
| Norway | 95,946 | 3329 | 20,526 | 71,342 | 4537 | 2624 | 405,510 | 2,829,759 | 3579 | 4457 | 35 | 570 |
| New Zealand | 96,817 | 3994 | 25,372 | 3578 | 1208 | 1266 | 209,127 | 2,787,494 | 11,737 | 5565 | 33 | 986 |
| Poland | 423,997 | 26,241 | 395,311 | 280,716 | 2802 | 558 | 595,862 | 18,318,734 | 30,288 | 22,782 | 287 | 3223 |
| Slovak Republic | 44,499 | 2563 | 33,888 | 34,803 | 981 | 335 | 105,119 | 2,749,141 | 5410 | 2790 | 30 | 355 |
| Slovenia | 38,985 | 1213 | 2306 | 10,955 | 237 | 239 | 54,174 | 1,028,117 | 6025 | 1927 | 13 | 130 |
| Sweden | 216,180 | 5415 | 42,601 | 125,406 | 2904 | 1160 | 531,283 | 5,455,406 | 13,684 | 7016 | 34 | 481 |
| Turkey | 247,563 | 16,856 | 267,579 | 339,601 | 8332 | 249 | 761,428 | 33,318,941 | 174,896 | 28,389 | 366 | 4895 |
| United States | 6,853,024 | 268,521 | 2,871,321 | 6,758,274 | 108,996 | 54,749 | 21,433,225 | 167,329,067 | 1,839,311 | 718,375 | 4744 | 50,135 |
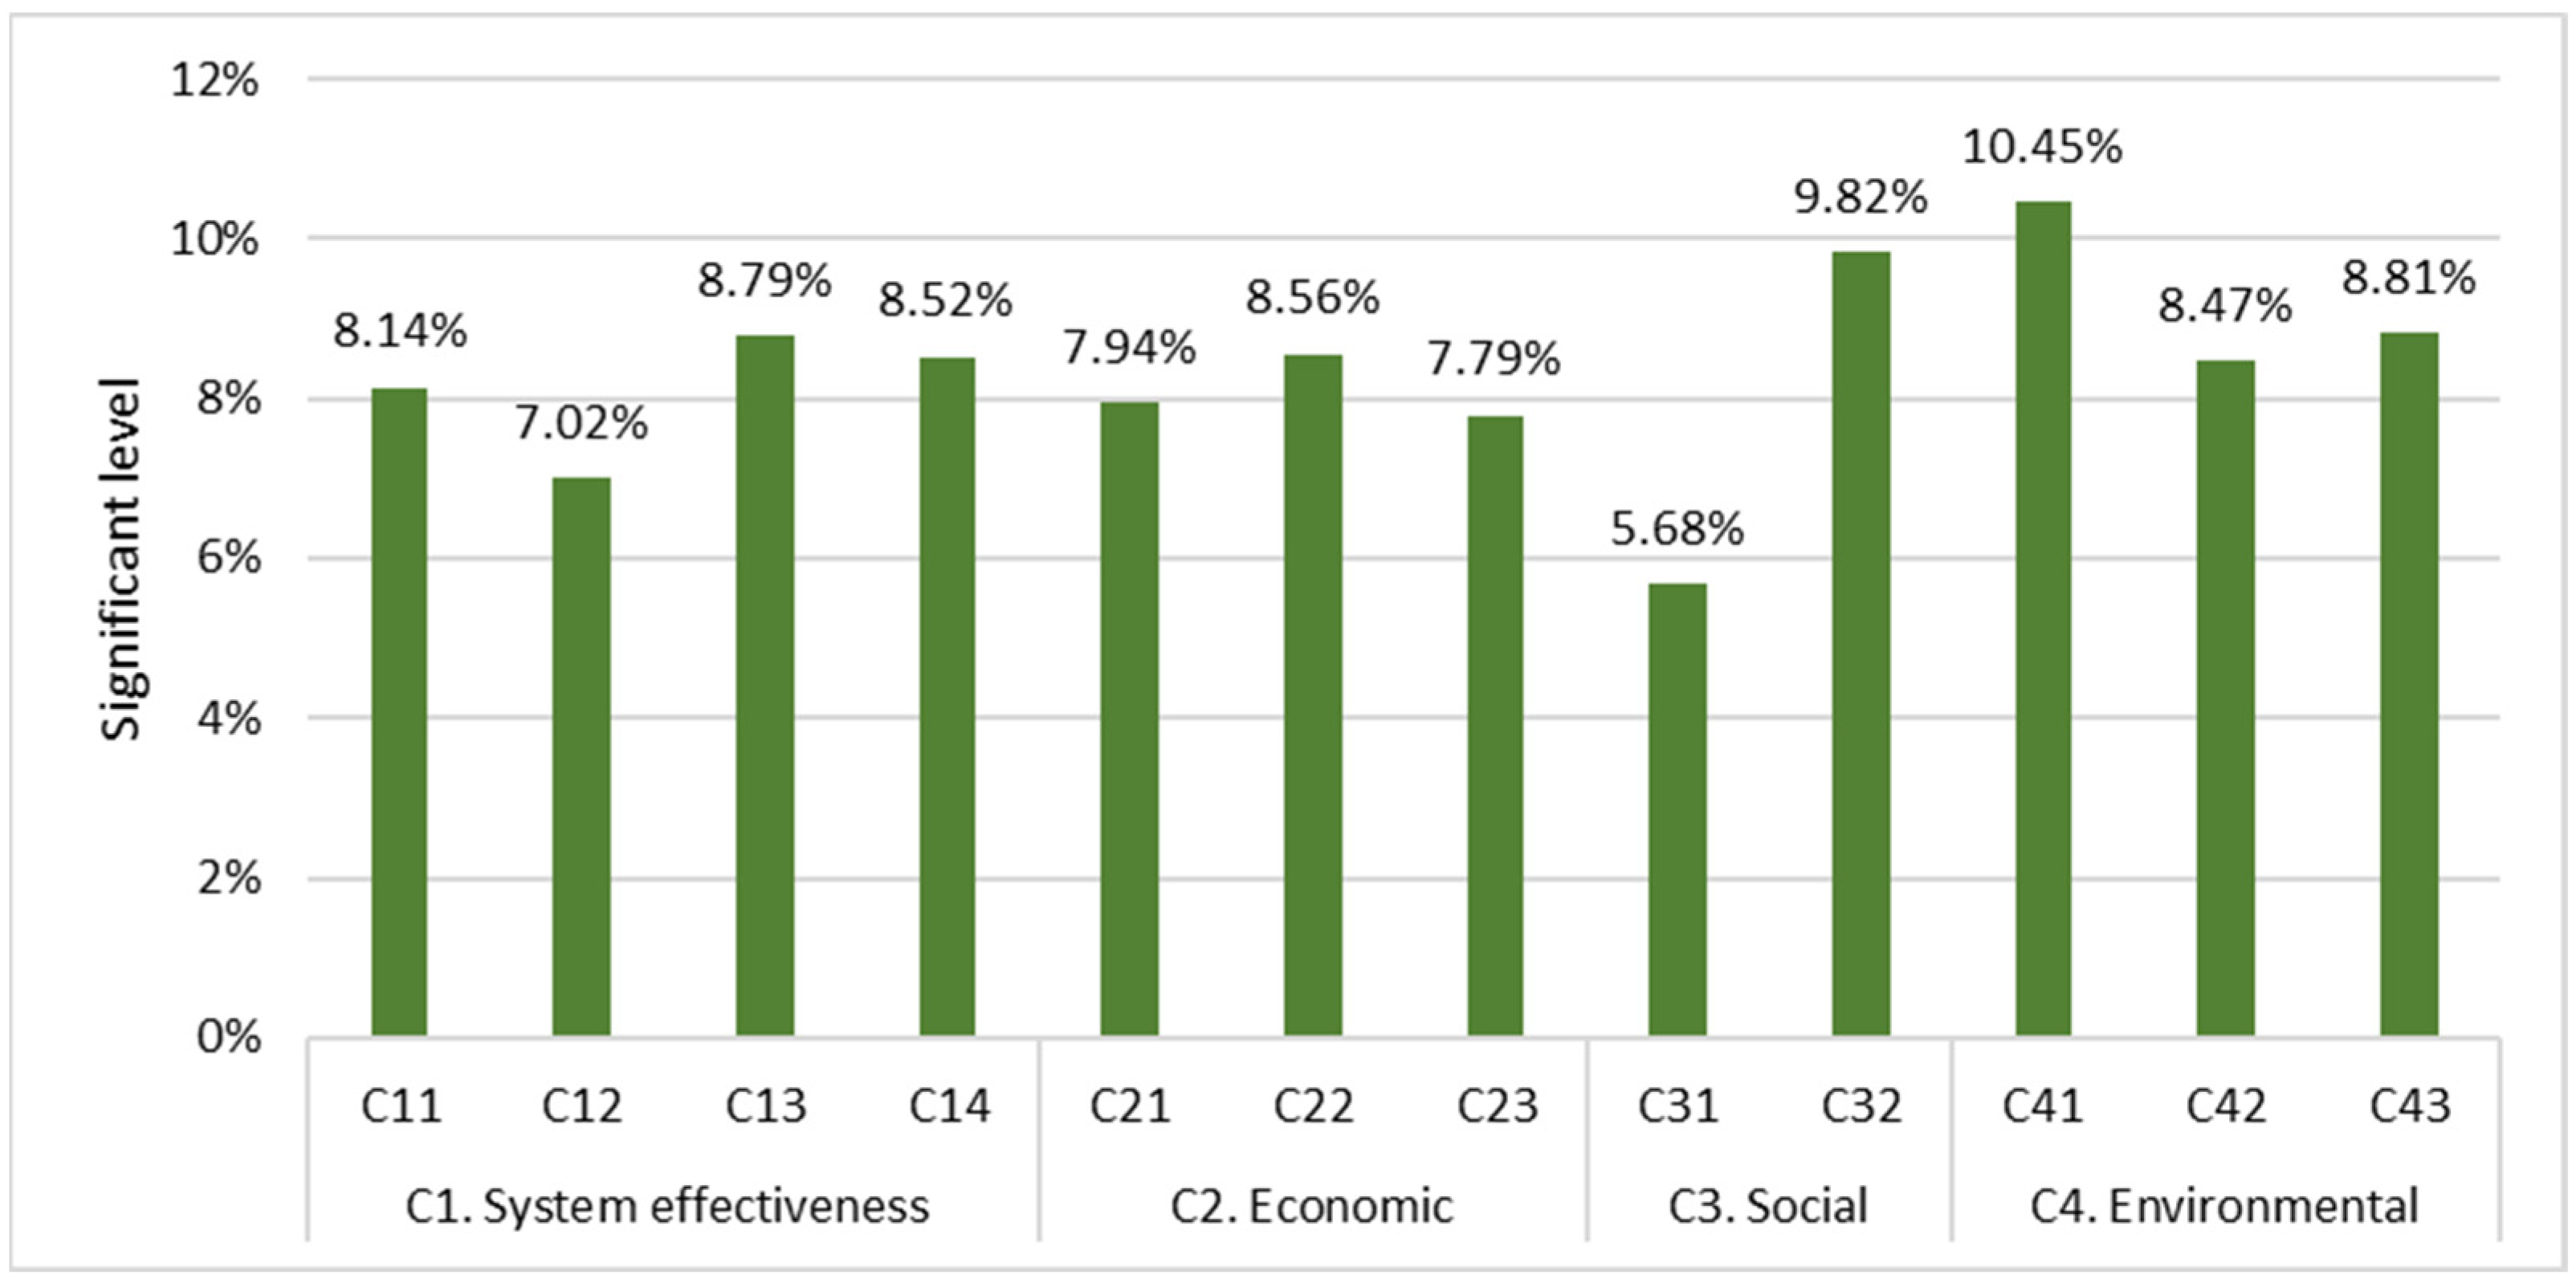
| Criteria | C11 | C12 | C13 | C14 | C21 | C22 | C23 | C31 | C32 | C41 | C42 | C43 | |
|---|---|---|---|---|---|---|---|---|---|---|---|---|---|
| 0.0814 | 0.0702 | 0.0879 | 0.0852 | 0.0794 | 0.0856 | 0.0779 | 0.0568 | 0.0982 | 0.1045 | 0.0847 | 0.0881 | 1 |
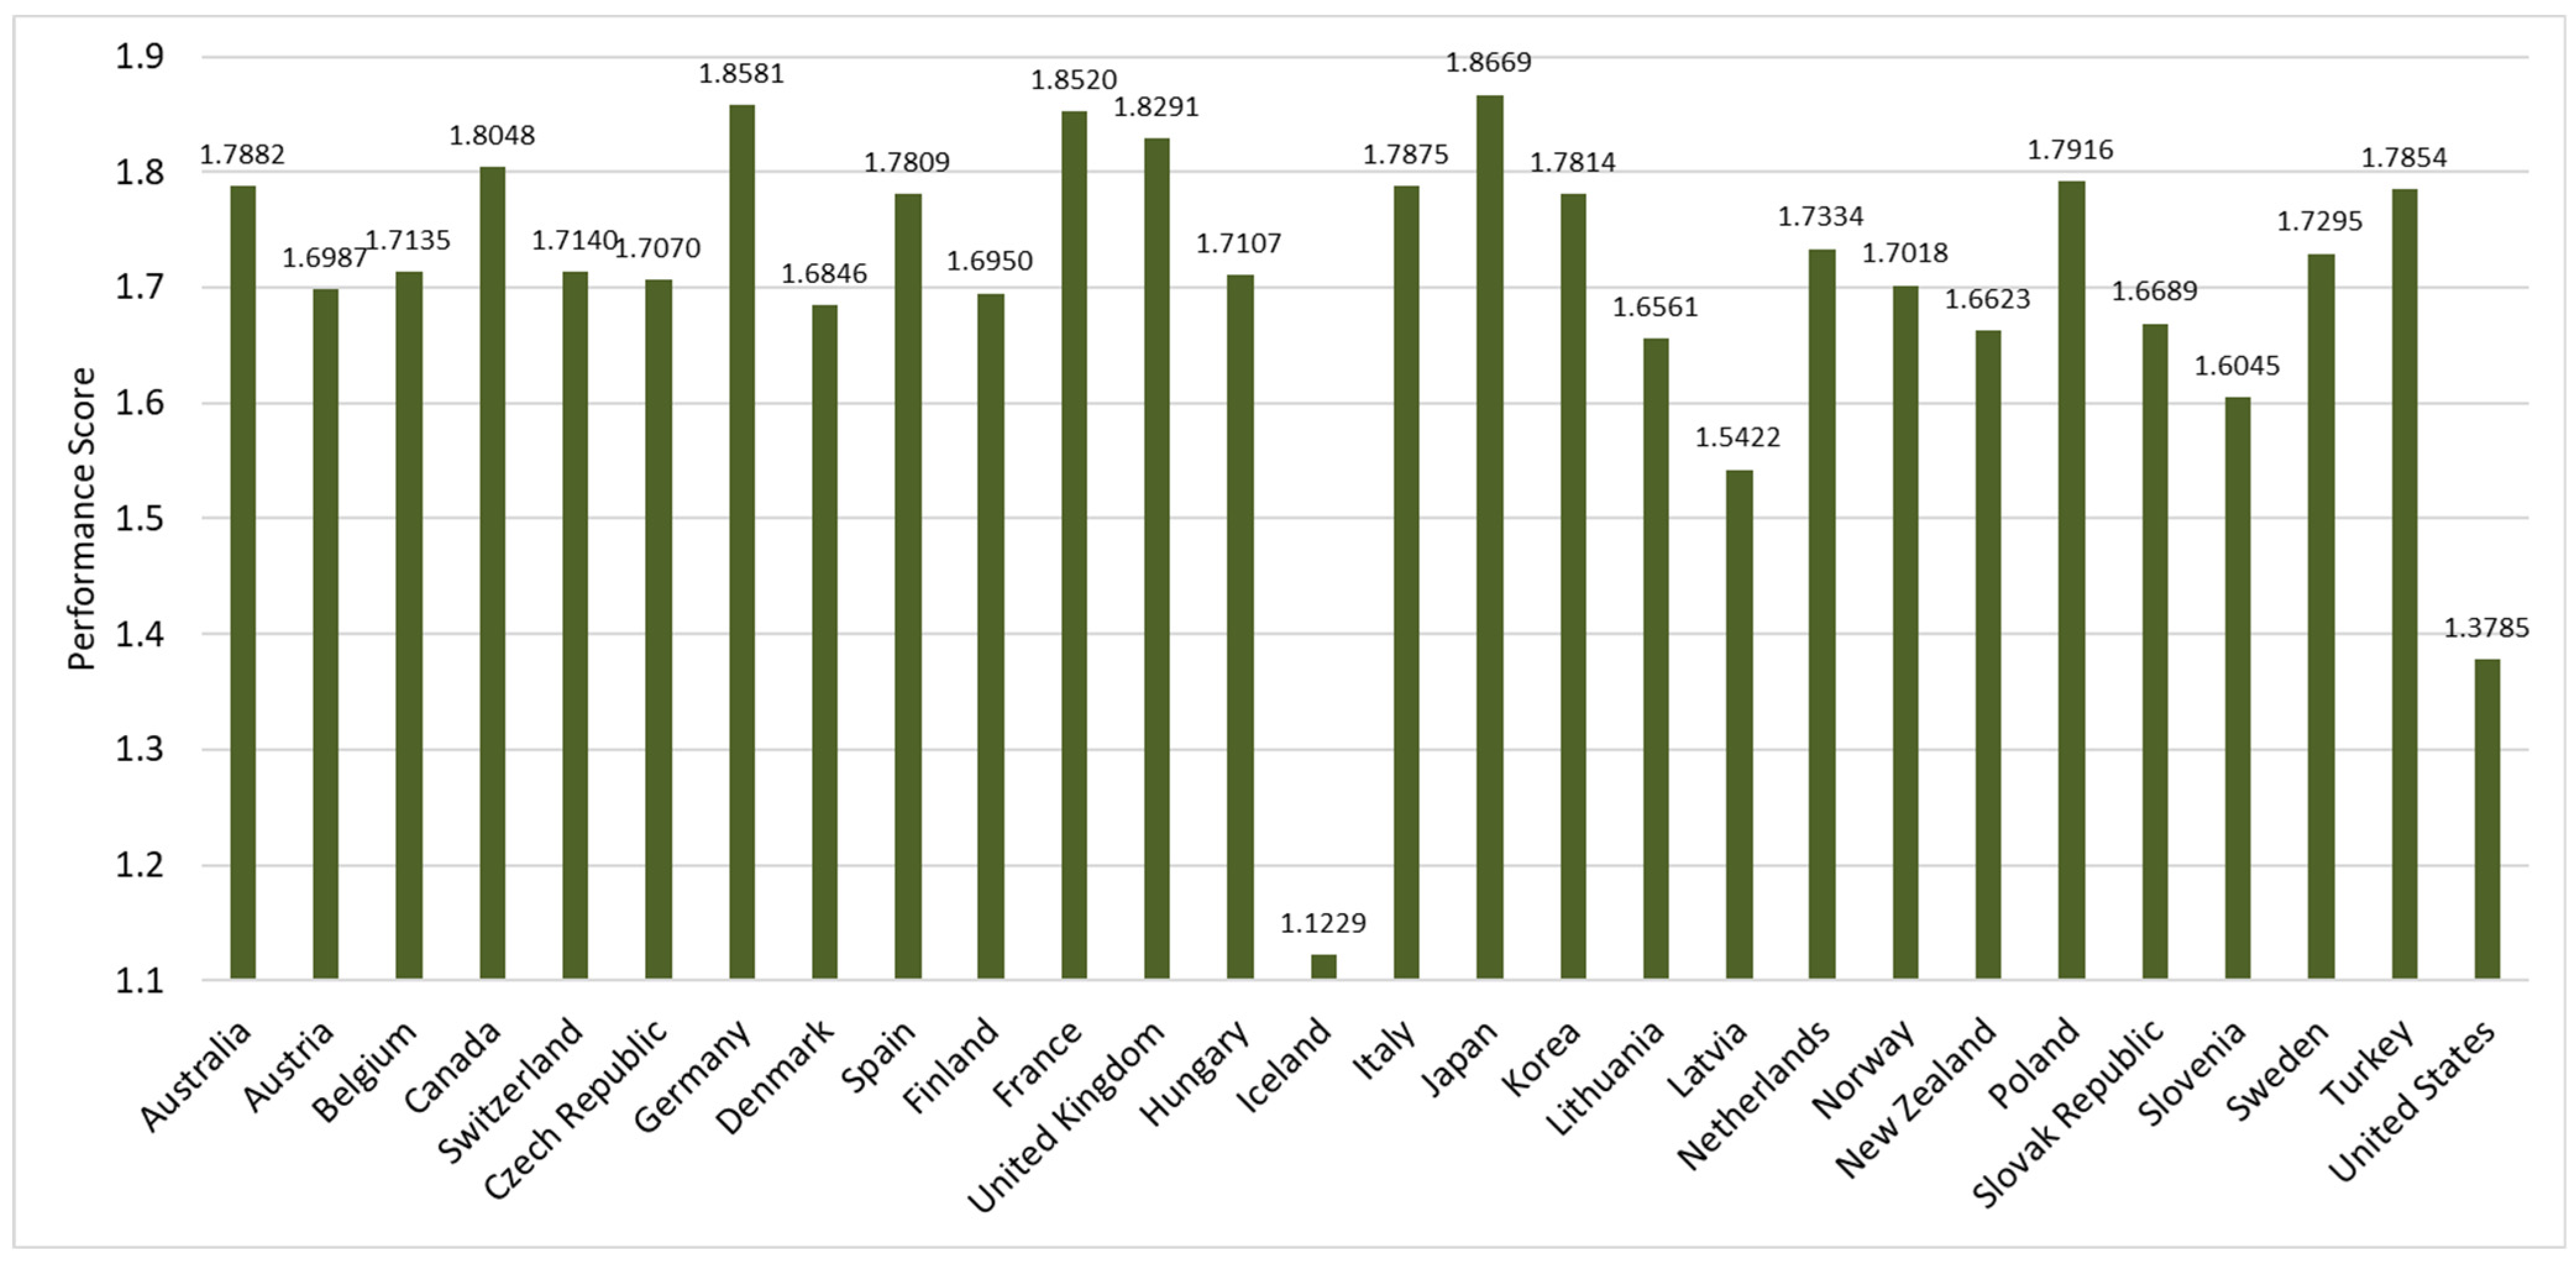
| Alternative | Country | Ka | Ranking | Kb | Ranking | Kc | Ranking | K | Final Ranking |
|---|---|---|---|---|---|---|---|---|---|
| A1 | Australia | 0.0382 | 6 | 2.9357 | 10 | 0.9620 | 6 | 1.7882 | 7 |
| A2 | Austria | 0.0358 | 19 | 2.8099 | 19 | 0.9017 | 19 | 1.6987 | 19 |
| A3 | Belgium | 0.0362 | 15 | 2.8328 | 15 | 0.9106 | 15 | 1.7135 | 15 |
| A4 | Canada | 0.0386 | 5 | 2.9648 | 5 | 0.9698 | 5 | 1.8048 | 5 |
| A5 | Switzerland | 0.0362 | 14 | 2.8340 | 14 | 0.9106 | 14 | 1.7140 | 14 |
| A6 | Czech Republic | 0.0361 | 17 | 2.8220 | 17 | 0.9072 | 17 | 1.7070 | 17 |
| A7 | Germany | 0.0393 | 2 | 3.0678 | 2 | 0.9897 | 2 | 1.8581 | 2 |
| A8 | Denmark | 0.0355 | 21 | 2.7906 | 21 | 0.8920 | 21 | 1.6846 | 21 |
| A9 | Spain | 0.0378 | 11 | 2.9370 | 9 | 0.9505 | 11 | 1.7809 | 11 |
| A10 | Finland | 0.0357 | 20 | 2.8066 | 20 | 0.8982 | 20 | 1.6950 | 20 |
| A11 | France | 0.0391 | 3 | 3.0637 | 3 | 0.9831 | 3 | 1.8520 | 3 |
| A12 | United Kingdom | 0.0387 | 4 | 3.0193 | 4 | 0.9746 | 4 | 1.8291 | 4 |
| A13 | Hungary | 0.0361 | 16 | 2.8308 | 16 | 0.9076 | 16 | 1.7107 | 16 |
| A14 | Iceland | 0.0205 | 28 | 2.0003 | 28 | 0.5169 | 28 | 1.1229 | 28 |
| A15 | Italy | 0.0381 | 7 | 2.9393 | 8 | 0.9590 | 7 | 1.7875 | 8 |
| A16 | Japan | 0.0396 | 1 | 3.0785 | 1 | 0.9965 | 1 | 1.8669 | 1 |
| A17 | Korea | 0.0380 | 9 | 2.9303 | 11 | 0.9551 | 9 | 1.7814 | 10 |
| A18 | Lithuania | 0.0347 | 24 | 2.7513 | 24 | 0.8724 | 24 | 1.6561 | 24 |
| A19 | Latvia | 0.0317 | 26 | 2.5892 | 26 | 0.7971 | 26 | 1.5422 | 26 |
| A20 | The Netherlands | 0.0367 | 12 | 2.8636 | 12 | 0.9223 | 12 | 1.7334 | 12 |
| A21 | Norway | 0.0359 | 18 | 2.8152 | 18 | 0.9033 | 18 | 1.7018 | 18 |
| A22 | New Zealand | 0.0349 | 23 | 2.7570 | 23 | 0.8783 | 23 | 1.6623 | 23 |
| A23 | Poland | 0.0379 | 10 | 2.9586 | 6 | 0.9540 | 10 | 1.7916 | 6 |
| A24 | Slovak Republic | 0.0350 | 22 | 2.7686 | 22 | 0.8814 | 22 | 1.6689 | 22 |
| A25 | Slovenia | 0.0334 | 25 | 2.6761 | 25 | 0.8392 | 25 | 1.6045 | 25 |
| A26 | Sweden | 0.0365 | 13 | 2.8587 | 13 | 0.9193 | 13 | 1.7295 | 13 |
| A27 | Turkey | 0.0380 | 8 | 2.9403 | 7 | 0.9552 | 8 | 1.7854 | 9 |
| A28 | United States | 0.0258 | 27 | 2.4301 | 27 | 0.6484 | 27 | 1.3785 | 27 |
Publisher’s Note: MDPI stays neutral with regard to jurisdictional claims in published maps and institutional affiliations. |
© 2022 by the authors. Licensee MDPI, Basel, Switzerland. This article is an open access article distributed under the terms and conditions of the Creative Commons Attribution (CC BY) license (https://creativecommons.org/licenses/by/4.0/).
Share and Cite
Wang, C.-N.; Le, T.Q.; Chang, K.-H.; Dang, T.-T. Measuring Road Transport Sustainability Using MCDM-Based Entropy Objective Weighting Method. Symmetry 2022, 14, 1033. https://doi.org/10.3390/sym14051033
Wang C-N, Le TQ, Chang K-H, Dang T-T. Measuring Road Transport Sustainability Using MCDM-Based Entropy Objective Weighting Method. Symmetry. 2022; 14(5):1033. https://doi.org/10.3390/sym14051033
Chicago/Turabian StyleWang, Chia-Nan, Tran Quynh Le, Kuei-Hu Chang, and Thanh-Tuan Dang. 2022. "Measuring Road Transport Sustainability Using MCDM-Based Entropy Objective Weighting Method" Symmetry 14, no. 5: 1033. https://doi.org/10.3390/sym14051033
APA StyleWang, C.-N., Le, T. Q., Chang, K.-H., & Dang, T.-T. (2022). Measuring Road Transport Sustainability Using MCDM-Based Entropy Objective Weighting Method. Symmetry, 14(5), 1033. https://doi.org/10.3390/sym14051033