1. Introduction
The driving strategy of an electric traction vehicle has significant influence on energy consumption. In the era of vehicle control via varying resistances, the maximum acceleration and maximum track speed control strategies were widely used. This technique enabled reaching the track speed limit in the shortest amount of time and, at the same time, eliminating energy dissipation in resistors. The efficiency of such control was very low, and during the acceleration mode, nearly 50% of consumed energy was dissipated in resistors.
Substantial steps ahead brought the implementation of semiconductor converters and the construction of traction vehicles with a.c. motors (induction and synchronous). In this stage, the maximum acceleration and speed control strategies were implemented, and it was also the starting point of the development of energy-efficient train control (EETC), which can significantly reduce consumed energy and, in this way, contribute to the improvement of our environment and to the reduction of operating costs.
Nowadays, increased environmental concerns and rising energy prices require energy-efficient performance also in transportation systems with the improvement of railway [
1] and road [
2] vehicle control. This paper presents two different EETC strategies, which respect traction motor (TM) electrical and mechanical loss minimization for track without and with speed limit. The first strategy, “energy optimal control” (EOC), is based strictly on the mathematical Euler–Lagrange approach [
3], while the second one, “energy near-optimal” (ENOC), is based on the precise prediction of TM losses and their minimization [
4]. The ENOC approach is characterized by a symmetrical trapezoidal speed profile with a truly finite settling time. The total consumed energy of both strategies is evaluated twice via a sum of individual energy components and via the time integral of the input power and compared mutually to verify energy savings. For control of induction, TM principles of field-oriented control (FOC) are exploited due to a fast dynamical response and the possibility to control torque and field components of the stator current separately [
5]. The FOC technique also has a large potential for reducing drive losses significantly.
The individual approaches to energy-efficient train movement differ significantly. Work [
6] offers an extensive review (more than 90 references) on EETC and the related train timetabling from the first simple models to the advanced models and algorithms of the last decade, which take into account regenerative braking, track parameters, and speed limits. The optimal train control strategy is usually extended to the seven driving regimes: maximum acceleration, cruising, coasting, and maximum braking completed with (partial or full) regenerative braking during cruising or braking. Pontryagin’s maximum principle (PMP) is frequently used to determine optimal driving regimes, resulting in the optimal EETC under different conditions. The main problem here is to determine the optimal sequence of switching points between the driving regimes. Several models and numerical algorithms were developed to adjust these points for the design of the complete optimal train trajectories between two stops.
A multi-objective model for automatic train operation (ATO) of an urban railway is proposed in [
7] by unifying dimensions of different objectives. The proposed model is built on multi-objective decisions with the penalty function based on the analysis of train performance and its operation environment. A genetic algorithm is then used to solve the model and to obtain the optimal speed profile corresponding to energy optimal control. A fuzzy logic controller is implemented to force the drive to follow recommended speed profiles. The proposed model was verified by simulations respecting train operation conditions and environments. Simulations confirmed 16% lower energy expenditures if compared with a real run and the robustness of the designed model against disturbances.
A new, more complex and robust model for finding the power and speed profiles that minimize the consumed energy of short railway journeys, which takes into account nonlinearity emerging in a real setting, is introduced in [
8]. Discretization and reformulation of the designed model within the framework of dynamic programming allow for obtaining the optimal action for arbitrary initial points. In the end, the solution was implemented into a train simulator in order to estimate the energy reduction for several real examples of the metro trips. The presented study has shown that the proposed method could be implemented in a real system immediately, whereas more research is required in order to solve various real-life problems. The simulations confirm reduced energy consumption in the range of 8–25%.
The minimization of consumed traction energy based on PMP offers [
9]. For a simplified train model, which has no speed limit, gradient, and regenerative braking, five subsequent control modes are supposed: maximum traction, partial traction, coasting, partial braking, and maximum braking. To form a complete speed trajectory the independent sections and costate variables are linked together using linking principles. As a next step, the development of a generally valid algorithm for solving differential equations of costate variables and complete speed trajectory is anticipated.
An online energy-saving driving strategy for a single metro train is proposed in [
10]. For this purpose, a switched-mode dynamical model was developed with the capability of regenerative braking. The optimal train operation regime has fixed four operation modes: maximum traction, speed holding, coasting, and maximum braking. The determination of the optimal switching points is critical, as previously mentioned; therefore, a problem with switching points as the optimization variables has been formulated by exploiting the model predictive control (MPC) utilizing the exterior point penalty function. The proposed online algorithm with the switching times can respond to the disturbances during train operation, as well as to improve the computational efficiency. The feasibility and advantages of the proposed algorithm were verified in several case studies. The online multitrain energy-saving operation based on the switched-mode dynamical systems is considered as future work.
There are various approaches to energy-efficient train speed trajectories: the nonlinear continuous-time model and the continuous-space model of train operations are analyzed in [
11], offering an integrated survey in this field (37 references). This work finds that analytical methods struggle to identify solutions under more realistic conditions, but numerical optimization methods do not always guarantee the optimal solution either. There are some available efficient optimal control software packages exploiting nonlinear programming to solve problems with optimal trajectory. Regardless of these solvers, some approximations are always required to formulate an efficient nonlinear train operation model. Therefore, any efficient approach has to compromise between computational accuracy and model efficiency.
The contribution of this paper is the direct application of EOC and ENOC strategies to the movement of a suburban train unit between two stops in a prescribed travel time and a comparison of their energy demands. The design of both control strategies requires knowledge of passive resistances to the train movement (constant, viscous, and quadratic drag component) as well as the average gradient of the route, which is added to the constant train resistance component to avoid necessary switching points. To ensure the same conditions for the comparison of the two control strategies, the regenerative braking is assumed.
An overall math description of the control system for optimization then consists of four differential equations respecting vehicle dynamic, induction motor position, speed, and current dynamic [
12]. Resulting speed profiles for routes without speed limits then consist of acceleration, cruising, and braking modes. The applications of the derived speed profiles to the routes with speed limits are also shown. The designed control structure for verification shown in
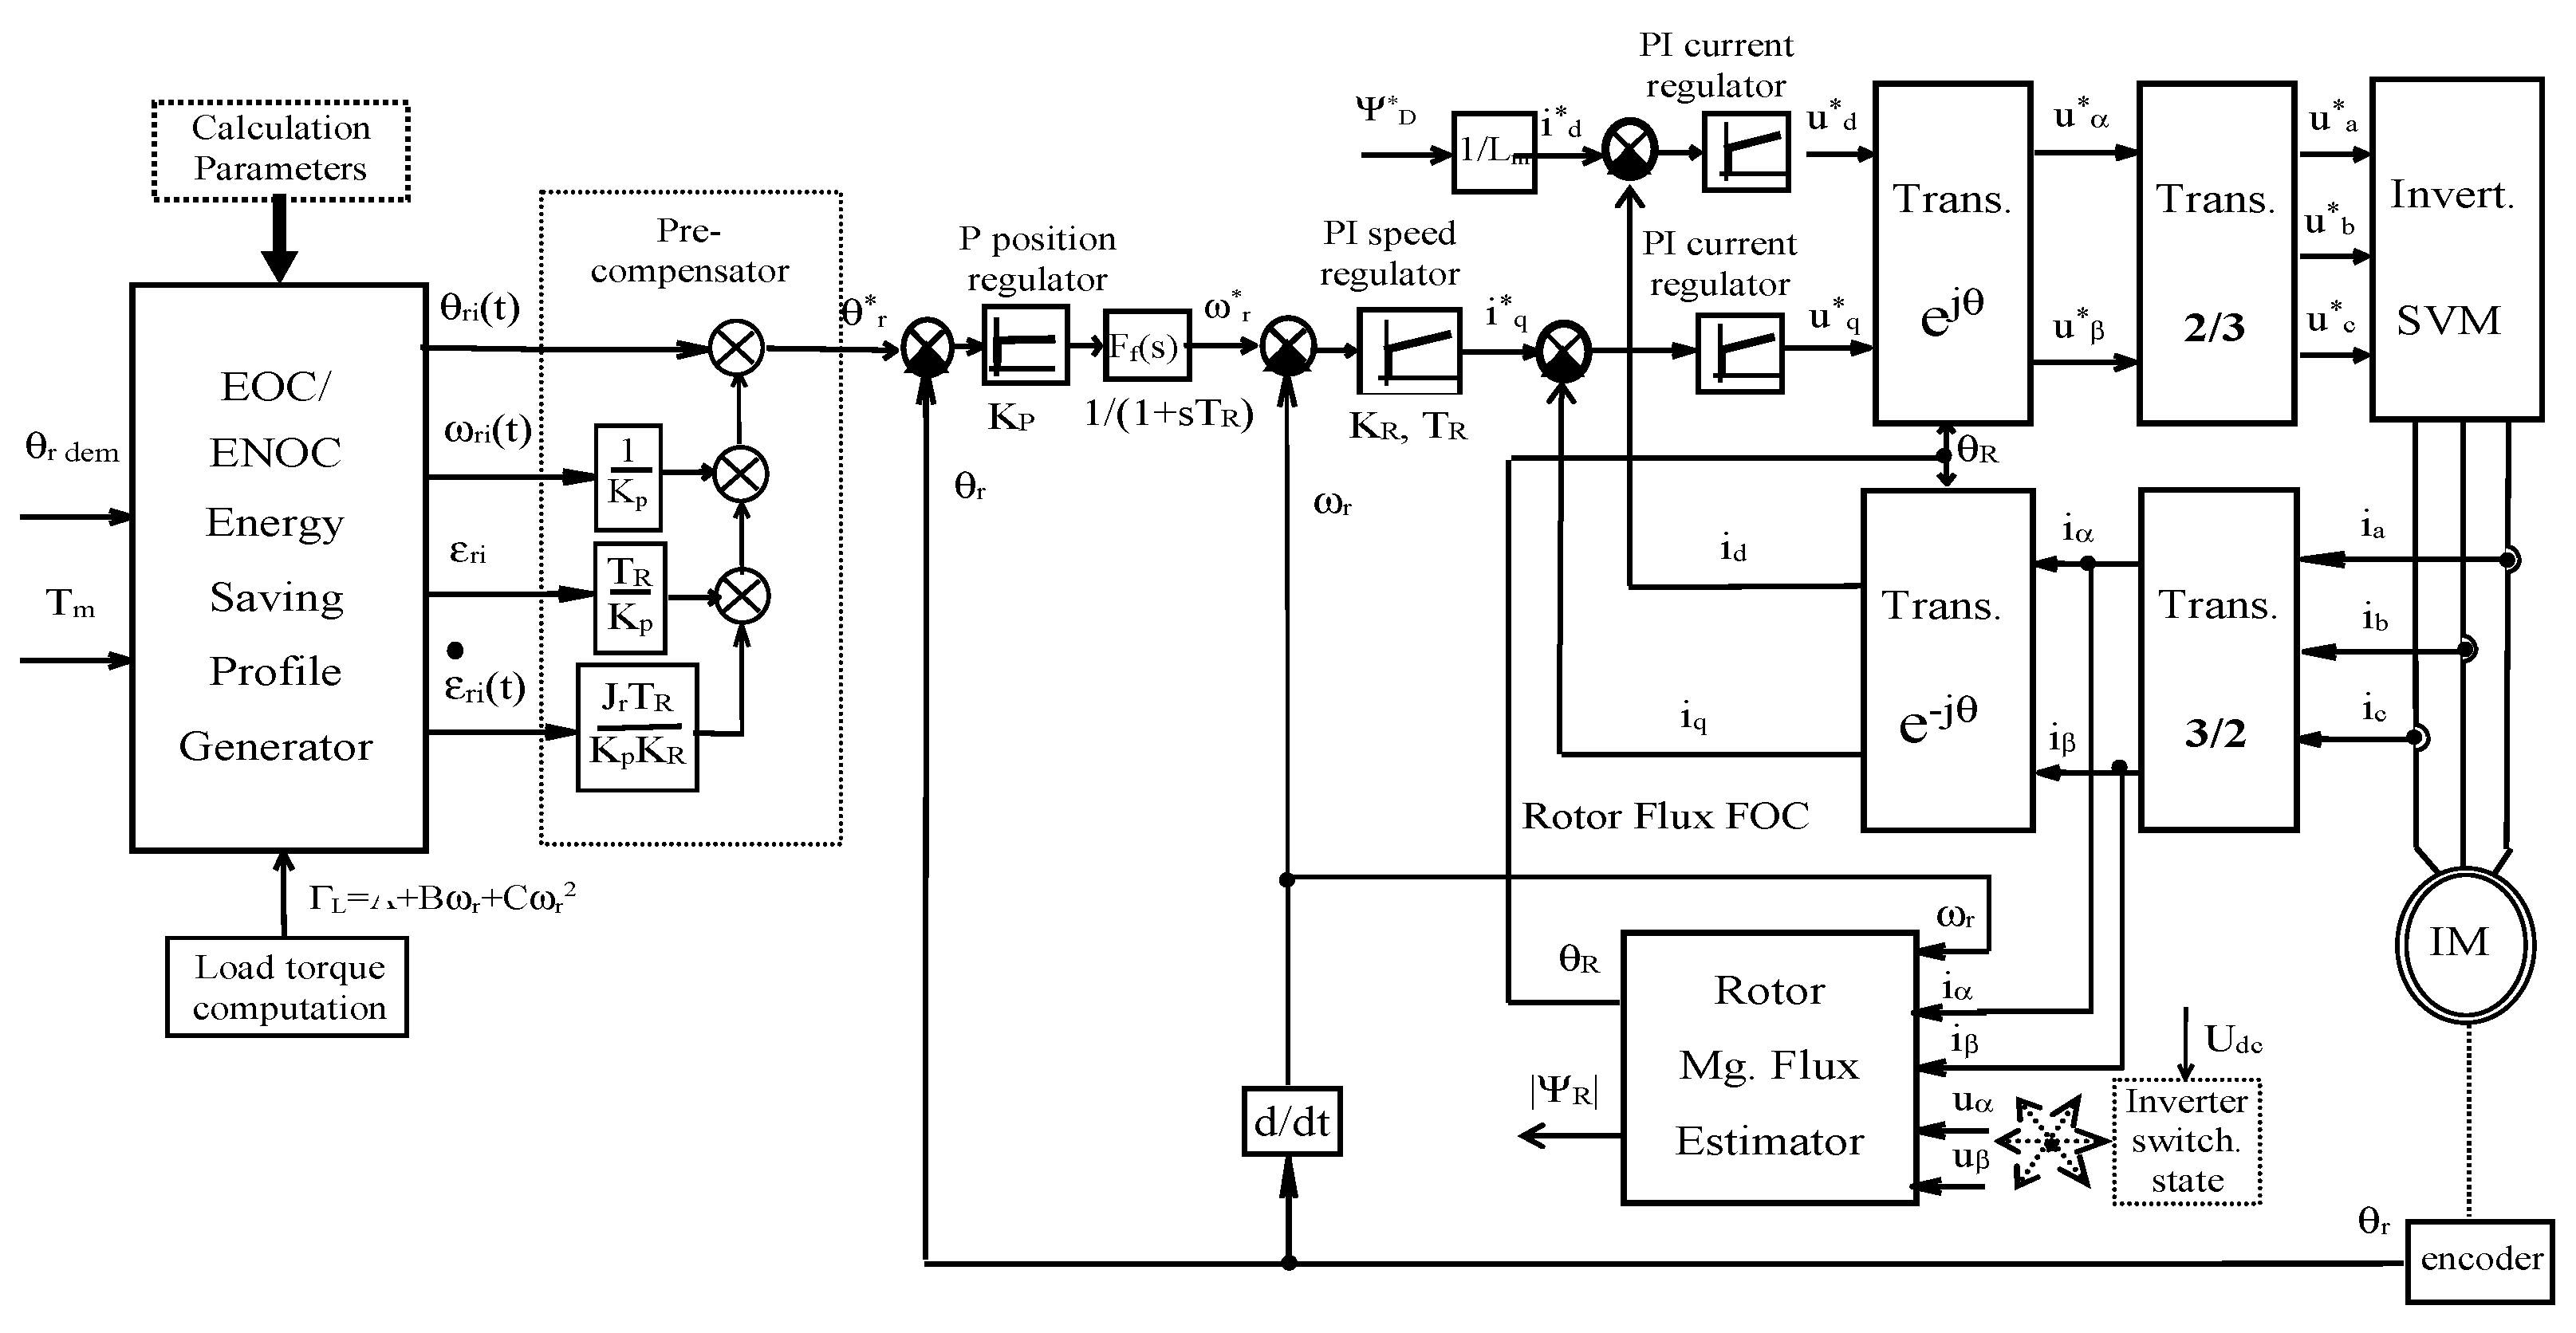
Figure 1 consists of an EOC or ENOC energy-saving profile generator (position, speed, acceleration, and jerk) accomplished with pre-compensator and position controlled induction TM capable of precise tracking of generated state variables.
3. Verification of Energy Near-Optimal Control Strategies
The described train control strategies for the minimization of energy expenditures were verified by simulation for travel distance, S
TD = 5000 m, without and with speed limit when, for the route section between 1500 and 2000 m (S
lim = 500 m), the track speed was limited to 50 km/h. The strategies were implemented for a suburban traction unit with the maximum speed V
max = 100 km/h and two induction TMs with the total nominal power P
T = 1440 kW parameters, which are listed in
Appendix A. The position control system shown in
Figure 1 was used, including the FOC of TM.
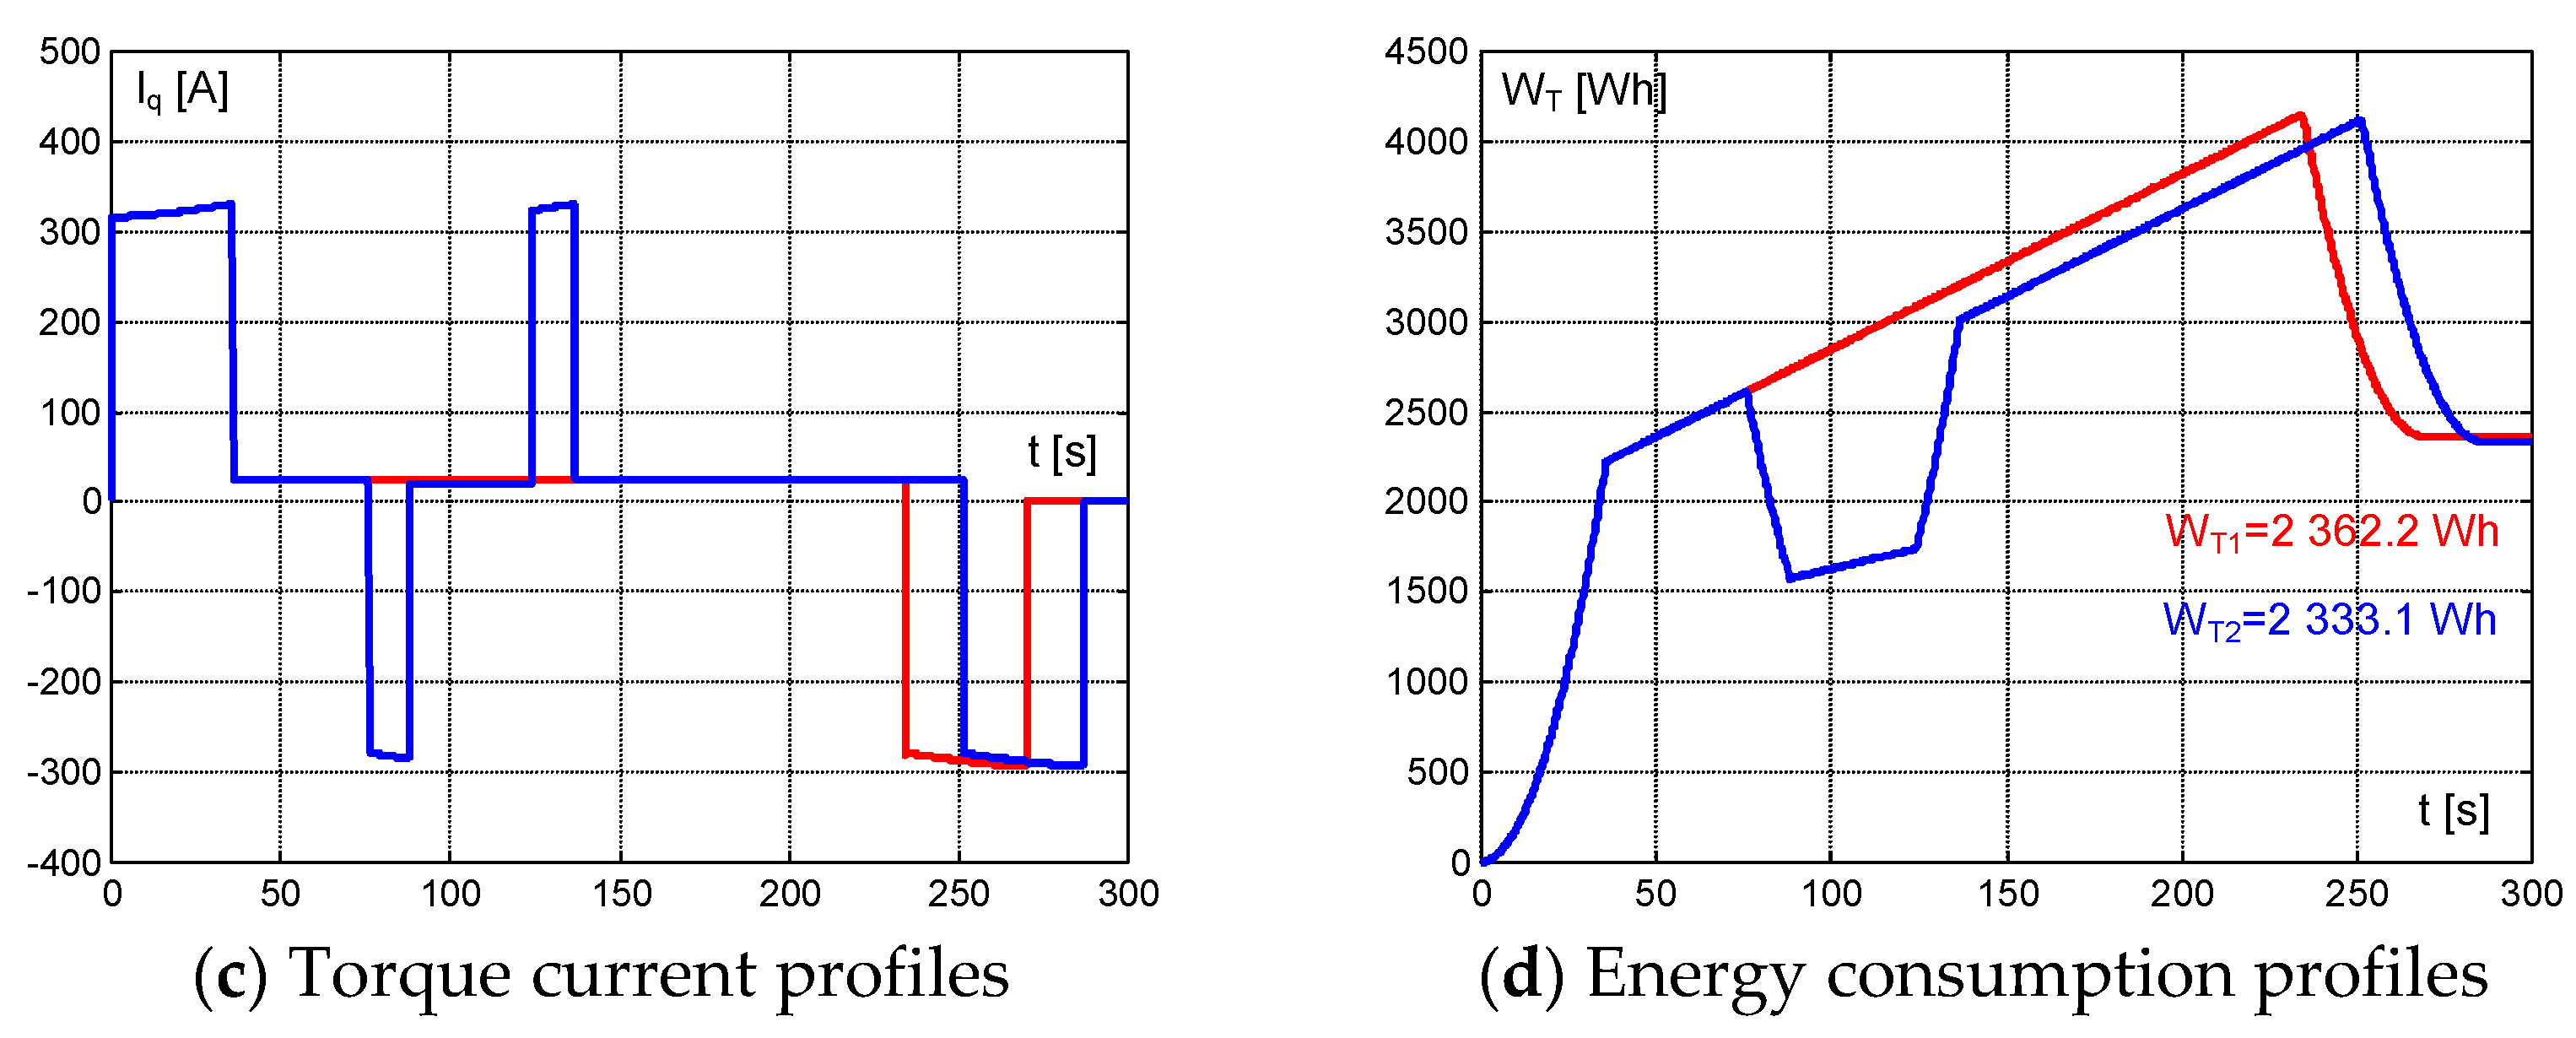
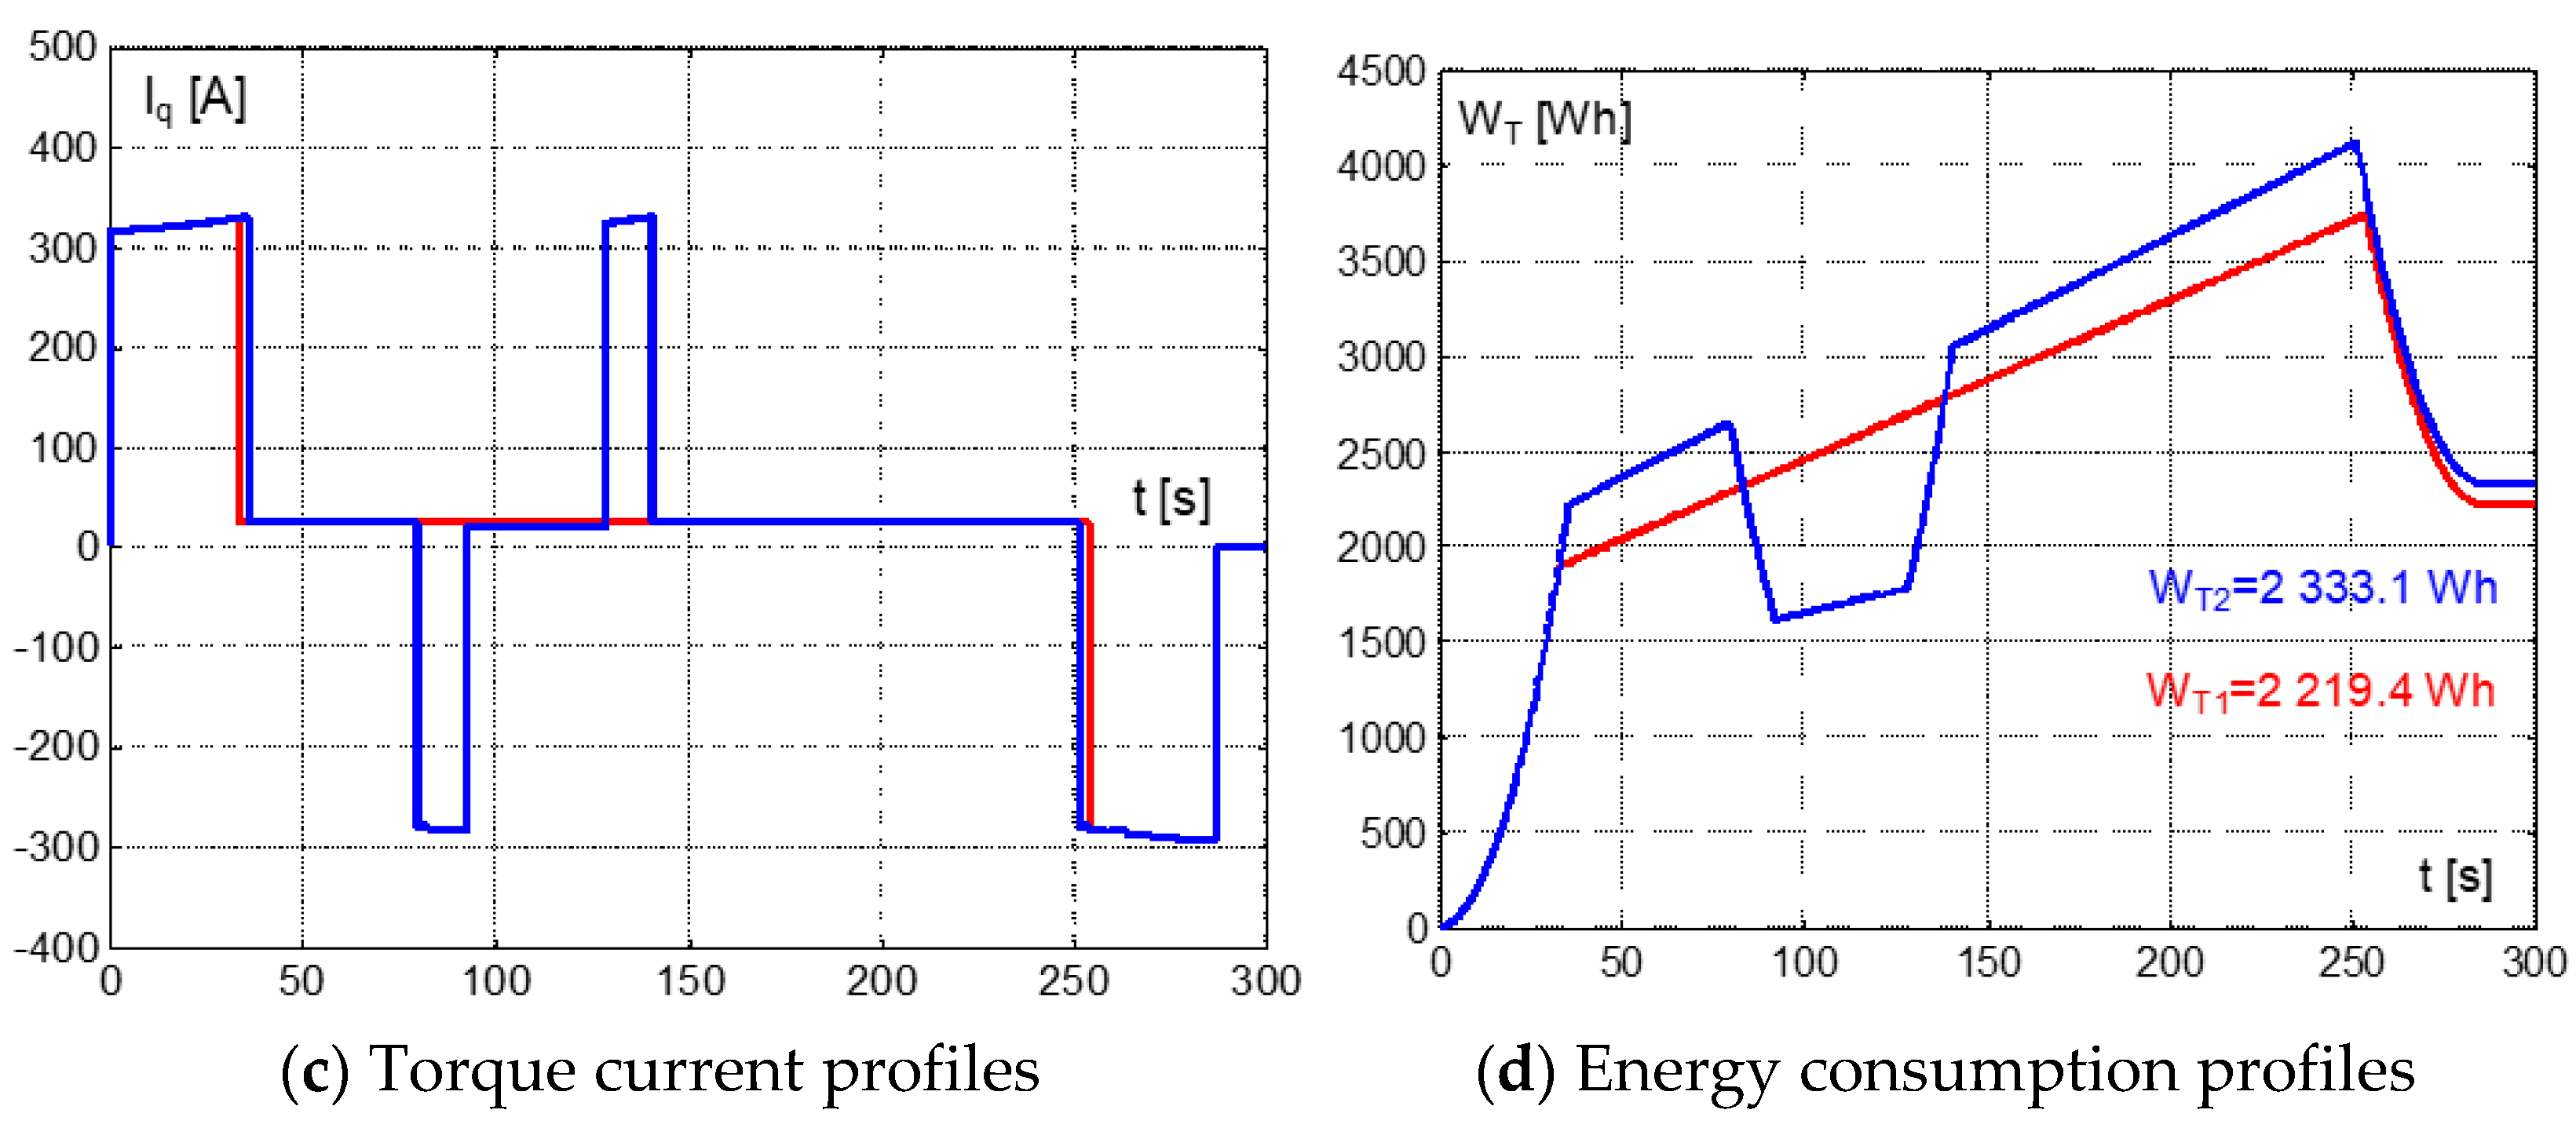
The time functions of control variables (position, speed, current torque component, and energy consumption) during the run of a train unit without speed limit (in red) and with speed limit (in blue) for EOC and ENOC are shown in
Figure 3,
Figure 4,
Figure 5,
Figure 6,
Figure 7 and
Figure 8 for two various maneuver times, T
m. The profiles of the torque component and energy consumption are related to a single TM.
The train unit and TM control variables for an EOC run of a travel distance, S
TD = 5000 m, prescribed in a travel time, T
m = 270 s, are shown in
Figure 3.
Figure 3a confirms that a required travel distance, S
TD, was reached by both EOC runs at a prescribed maneuver time, T
m = 270 s. The maximum speed for a journey without speed limit was V
max1 = 86.06 km/h, while a run with speed limit requires a higher maximum speed, V
max2 = 91.84 km/h, to keep the prescribed travel time.
Peaks of TM currents were Iq1 = 371.73 A and Iq2 = 648.64 A in motoring mode and Iq1 = 352.33 A and Iq2 = 403.09 A in braking mode. It means that the peak of a current for the run with speed limit was 1.74 higher in motoring mode and 1.14 higher in braking mode.
The measured energy consumptions of TM for an EOC run without speed limit were Wt1 = 2358.1 Wh and Wt2 = 2485.3 Wh for EOC with speed limit. It means that speed limit and the following acceleration to a new maximum speed, Vmax2, is demanding 5.39% more energy (127.22 Wh).
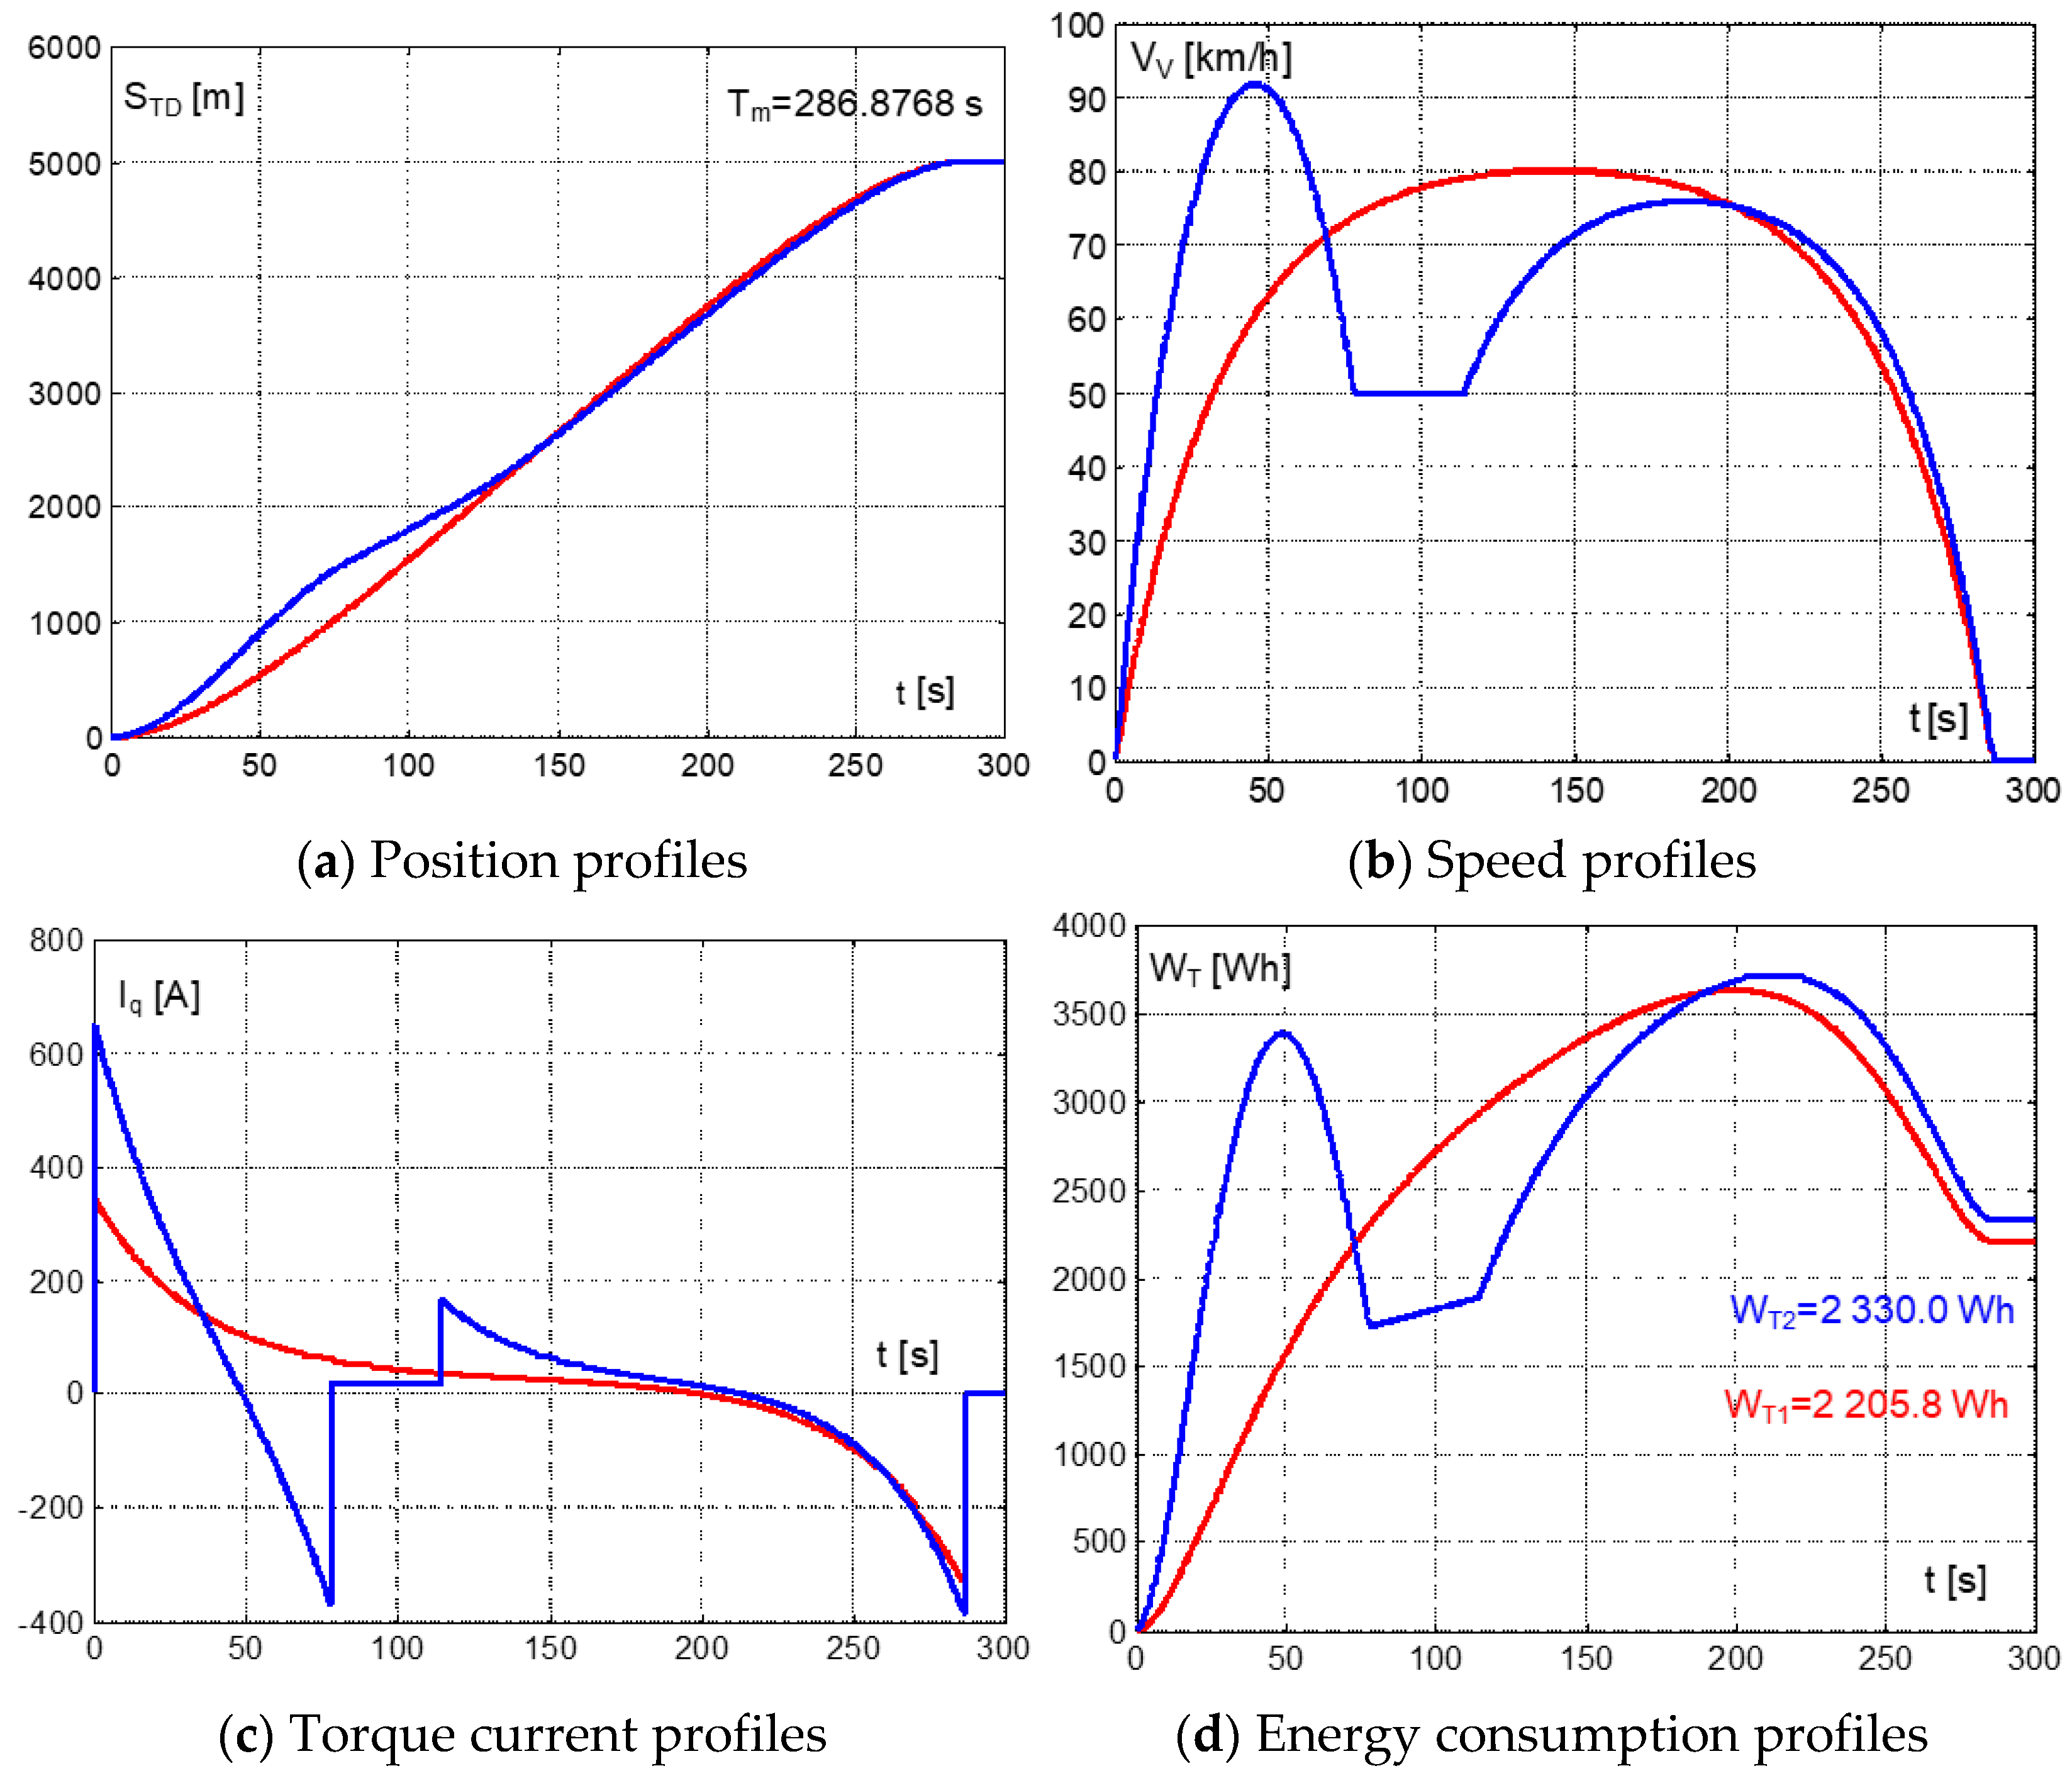
To compare results, the EOC and ENOC (related to
Figure 7) travel time of EOC with speed limit was extended from the original T
m1 = 270 s to T
m2 = 286.876 s. Time profiles of this run are shown in
Figure 4.
Figure 4a confirms that a required travel distance, S
TD = 5000 m, was reached at the prescribed maneuver times T
m1 and T
m2 by both runs. Without changes in boundary conditions, the maximums of speed for a journey without limit stood the same, V
max1 = 86.06 km/h and V
max2 = 91.84 km/h. There are no differences in motoring and braking currents for a run without speed limits (I
q1 = 371.73 A and I
q2 = 648.64 A), while for a run with speed limit, the peak of motoring current has the same value, I
q2 = 371.73 A, and braking current dropped to I
q2 = 386.85 A.
Interesting is energy consumption because there is no reason for its change during a run without speed limit (W
t1 = 2358.1 Wh), while the consumption of a run with speed limit dropped to W
t2 = 2330.0 Wh and is 1.19% lower (28.1 Wh) as compared with a run without speed limit. This difference in energy consumption can be explained with the lower average speed of the run with speed limit. To verify such influence of the prescribed travel time T
m, one more simulation for common travel time, T
m = 286.8768 s, was run and is shown in
Figure 5.
As shown in
Figure 5a, both position time profiles confirmed reaching the demanded travel distance 5000 m in the prescribed T
m.
Figure 5b shows that there is a change in the time functions of speed, when the maximum speed without speed limit dropped now to V
max1 = 80.12 km/h, while there is no reason for a change of the maximum of speed with speed limit (V
max2 = 91.84 km/h) shown in
Figure 4b.
The maximum of the torque current in motoring mode without speed limit dropped to Iq1 = 343.89 A (previously Iq1 = 371.73 A), and in a similar way, the braking torque current in this mode dropped to Iq1 = −334.21 A, while for the run with speed limit, the maximum speed stood the same.
These two runs confirmed that the consumed energy of TM with speed limit stood the same, W
t2 = 2330.0 Wh, while the consumption of a run without speed limit dropped to W
t1 = 2205.8 Wh, which is now 5.33% lower (124.2 Wh) if compared with a speed limit run. A comparison of energy consumptions in
Figure 3 and
Figure 5 reveals that the extension of travel time for 16.8768 s brought for a run without speed limit 6.46% energy savings (152.3 Wh), and the same is valid also for a run with speed limit with 6.25% energy savings (155.3 Wh).
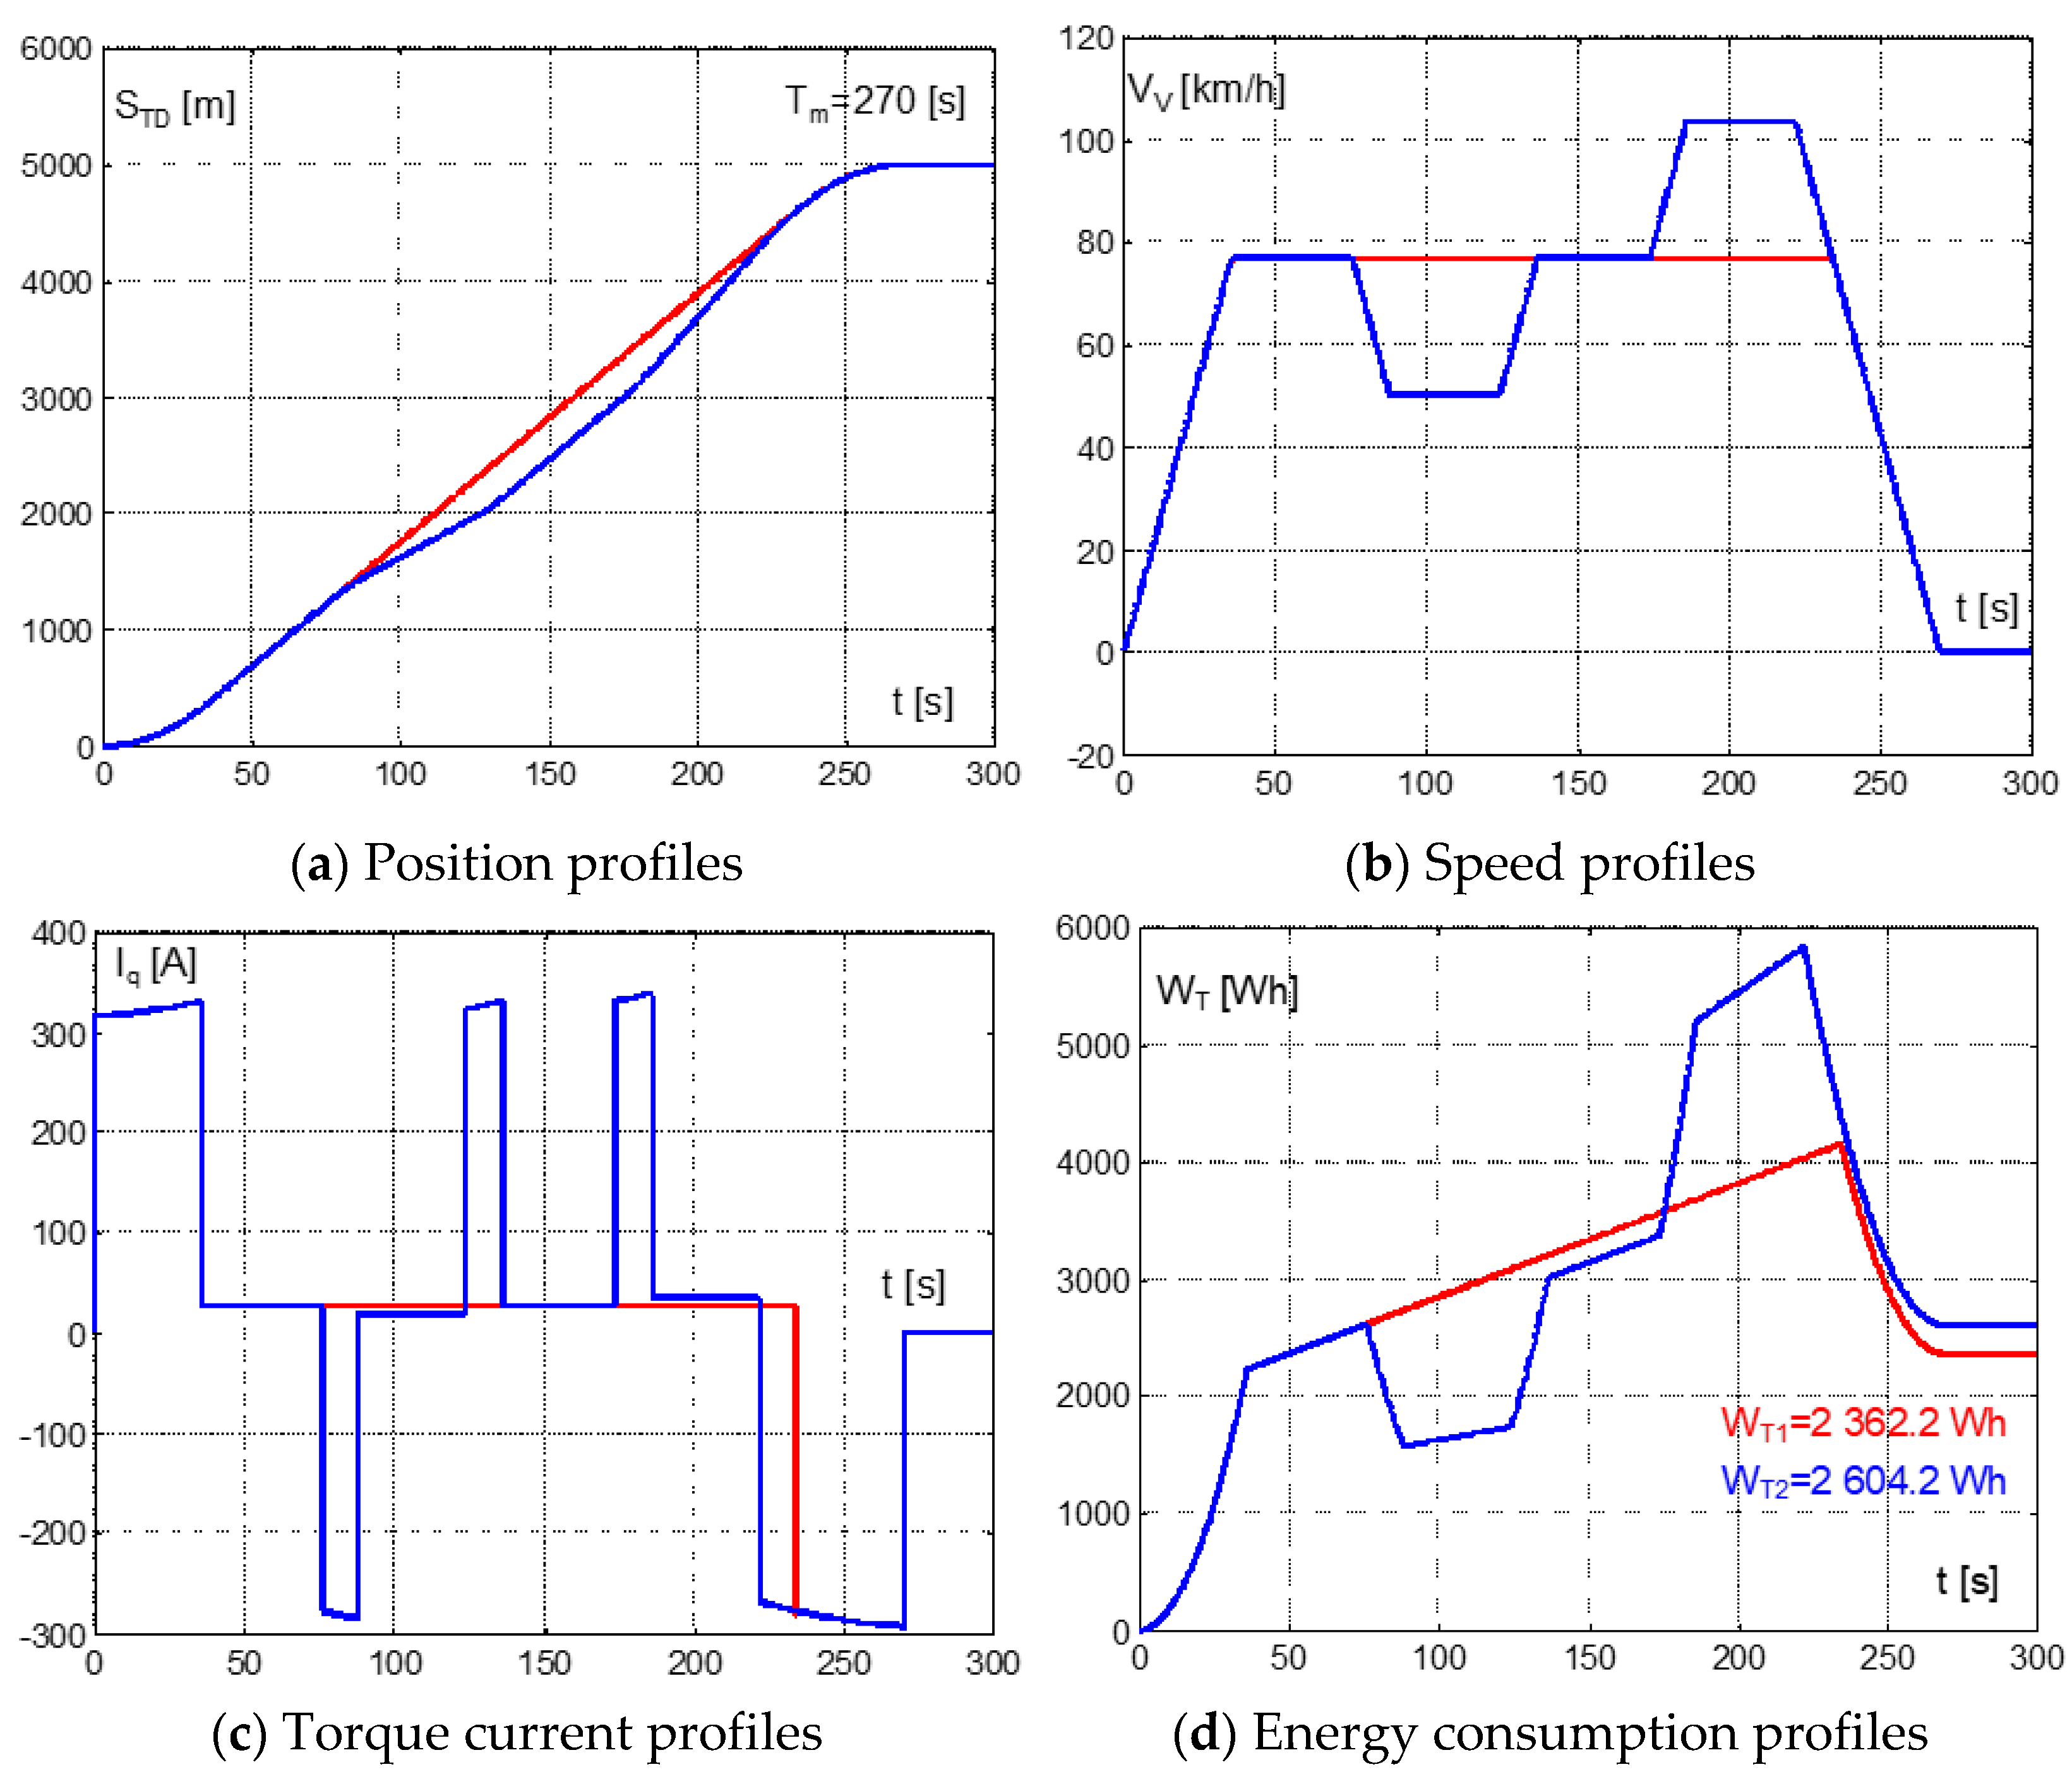
In a similar way and under the same conditions (without and with speed limit), investigation of ENOC with symmetrical trapezoidal speed profile continued. Results of investigation are summarized in
Figure 6,
Figure 7 and
Figure 8 for two prescribed maneuver times, T
m1 = 270 s and T
m2 = 286.8768 s.
Figure 6a confirms that the required travel distance, S
TD, was reached at the prescribed maneuver time, T
m = 270 s, by both runs. The maximum speed for a journey without speed limit was V
max1 = 76.79 km/h, while the section S
lim = 500 m with the speed limit V
lim = 50 km/h requires a higher maximum speed, V
max2 = 103.55 km/h, to keep the prescribed travel time, T
m.
For motoring mode peaks of TM torque current, components were Iq1 = 330.39 A and Iq2 = 339.41 A, which is 2.75% higher for a run with speed limit. In braking mode, both currents’ minimums reached the same value. Iq1 = Iq2 = 292.9 A. The measured total energy consumptions of TM without speed limit were Wt1 = 2362.2 Wh and Wt2 = 2604.2 Wh with speed limit, which means that the speed limit, and following acceleration to a new speed maximum, Vmax2, is 10.24% more energy demanding (242 Wh).
As it is derived in
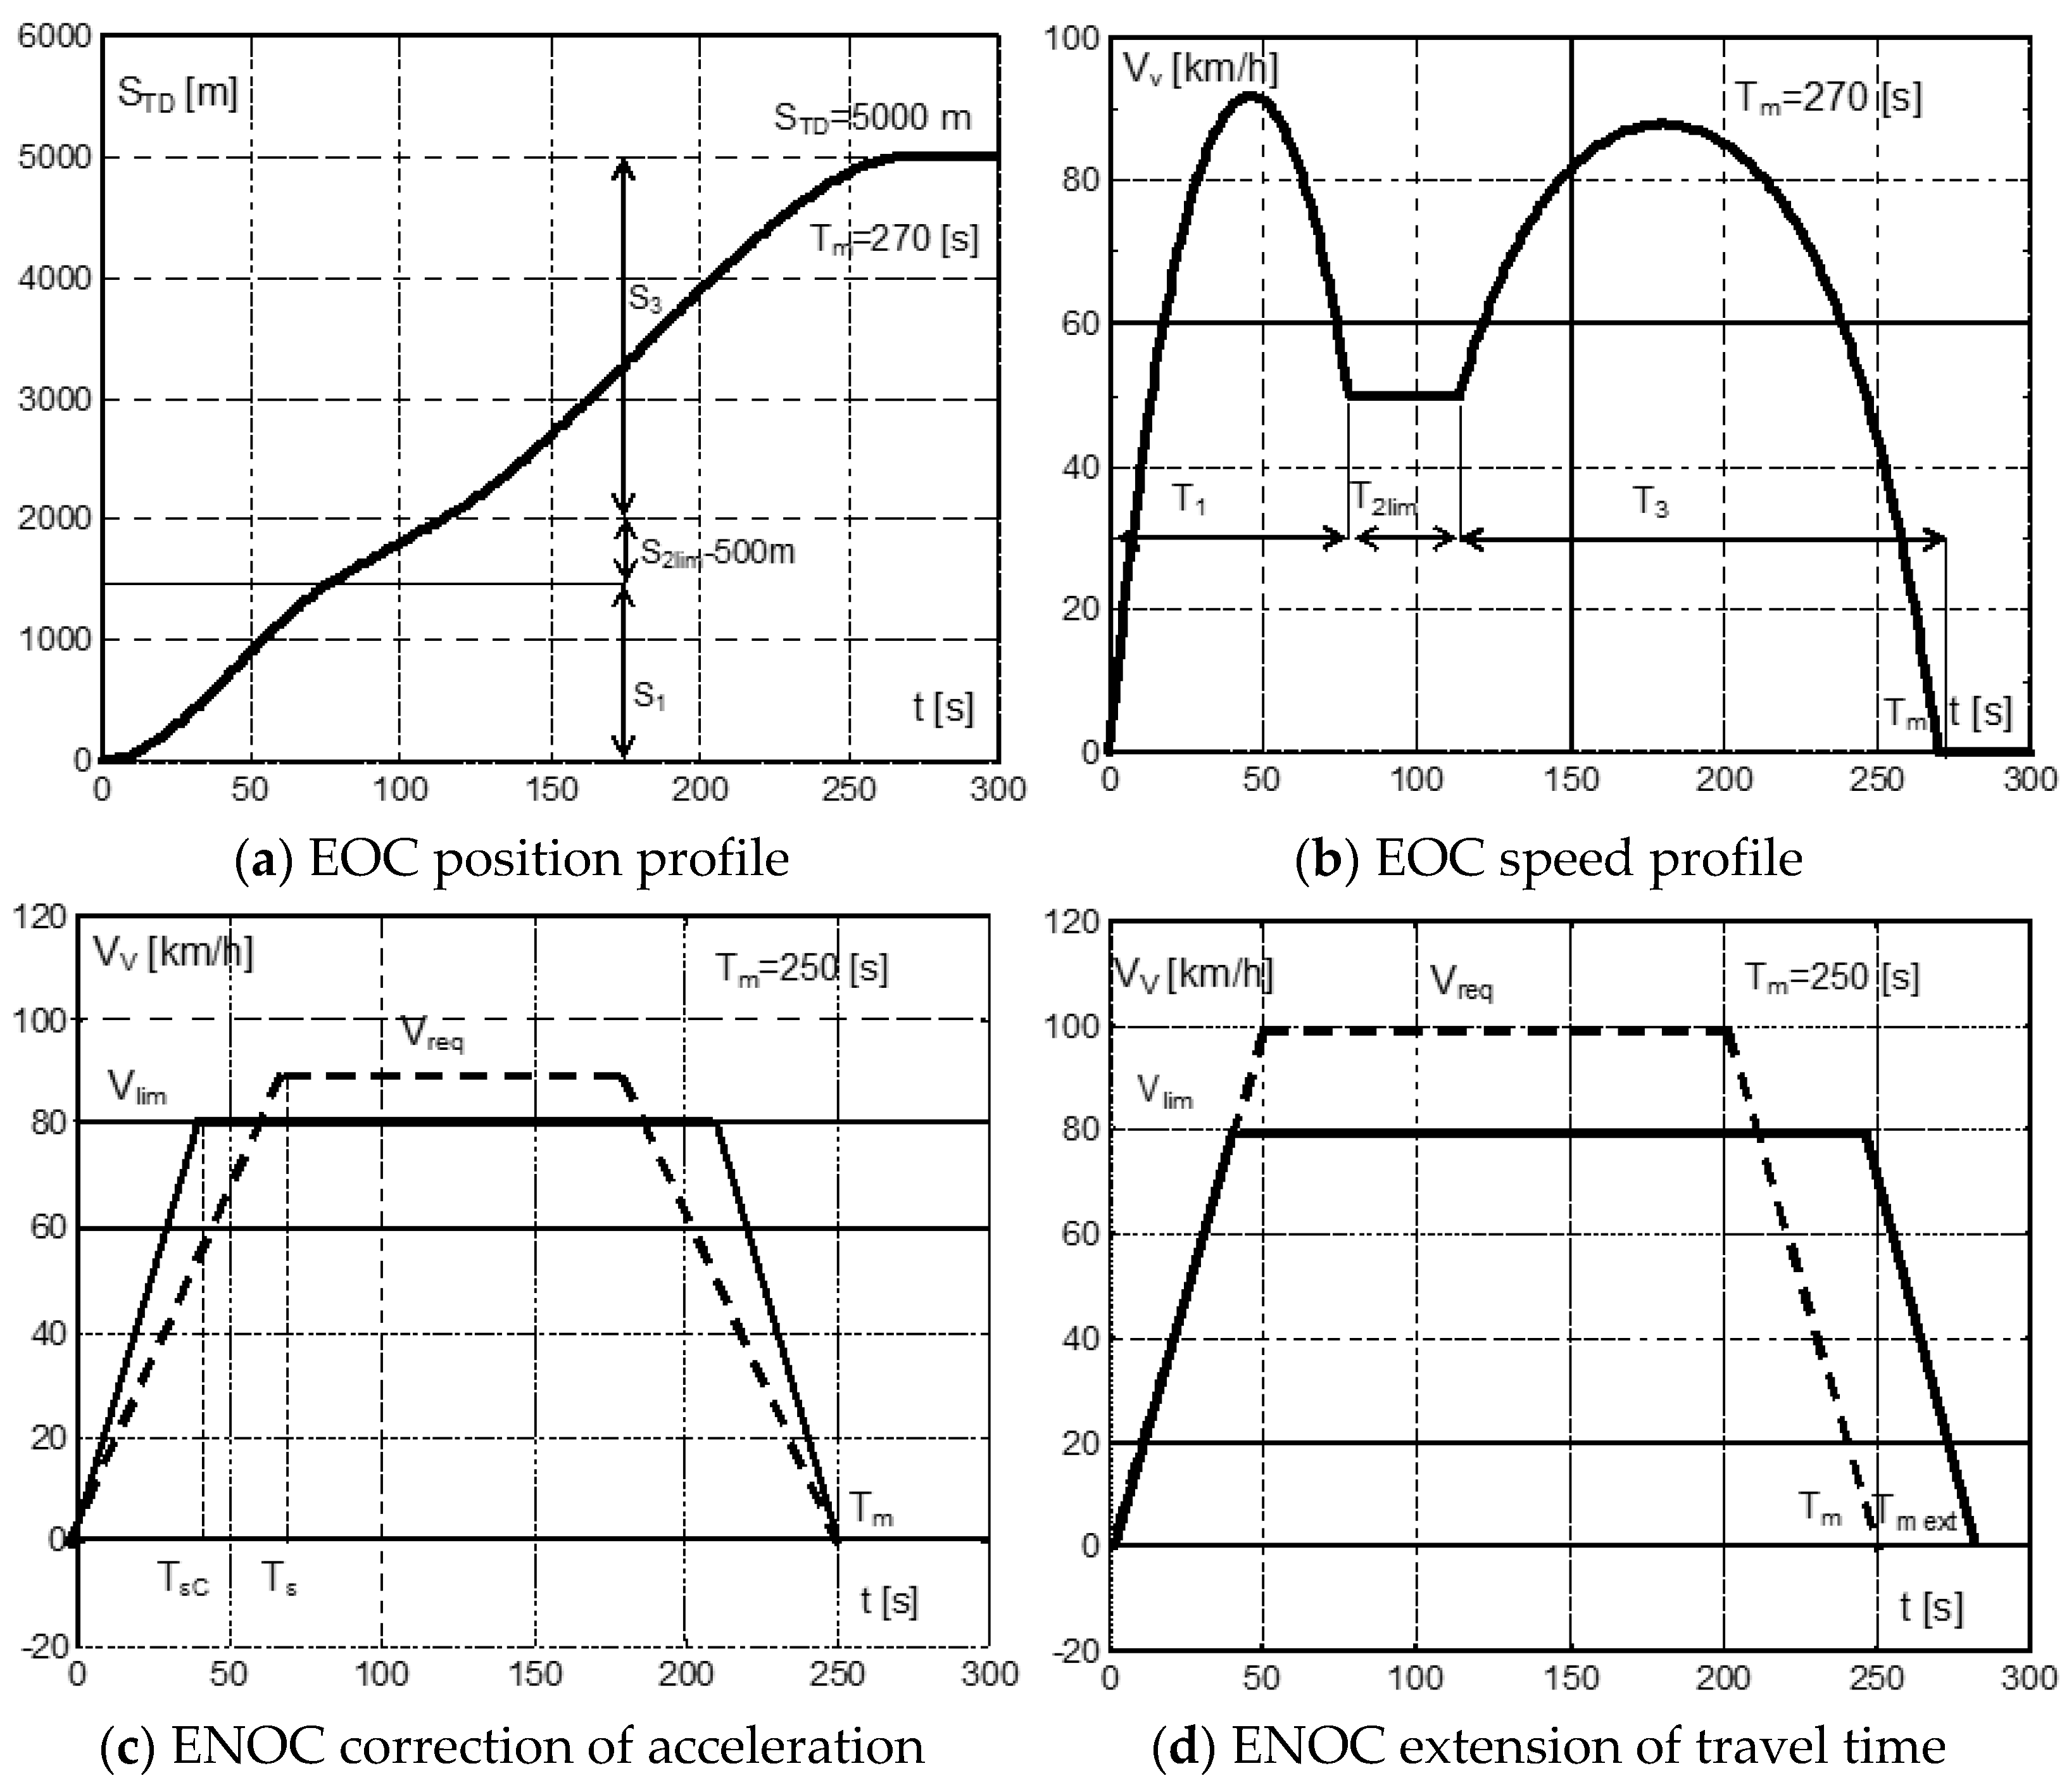
Section 2.3, there is a possibility for ENOC to keep the same acceleration together with the maximum of the cruising speed of both runs (without and with speed limit) under the assumption of travel time extension. Using (11), the required extension is T
ext = 16.8768 s, and a new prescribed travel time for a run with speed limit has the value T
mext = 286.8768 s. ENOC time profiles for an extended travel time of a run with speed limit are shown in
Figure 7 for comparison together with results without speed limits of a previous run.
Figure 7a confirms that the required travel distance, S
TD, was reached at the prescribed maneuver times T
m1 = 270 s and T
m2 = 286.8768 s by both runs (without and with speed limit). The cruising speeds, V
max = 76.79 km/h, of both runs are now the same as well as the acceleration times, T
ε = 35.543 s.
The peaks of TM currents were Iq1 = Iq2 = 330.39 A in motoring mode and nearly the same at Iq1 = 293.05 A and Iq2 = 292.95 A in braking mode. The differences between motoring and braking currents are 37.49 and 37.44 A, respectively. There is no change in measured energy consumptions of the run without speed limit, Wt1 = 2362.2 Wh, and the consumption of the run with speed limit dropped to Wt2 = 2333.1 Wh, which is now 1.23% (29.1 Wh) lower than the run without speed limit with the travel time Tm = 270 s. This difference is explained again by the lower average speed of the run with speed limit.
The influence of average speed was verified with a new run (with and without speed limit) for an extended maneuver time, T
m = 269.859 s, the results of which are shown in
Figure 8. The simulations confirmed that TM energy consumptions of a run without speed limit dropped to the lowest value, W
t1 = 2219.4 Wh, while the consumption with speed limit stood the same at W
t2 = 2333.1 Wh. This consumption is now 1.31% (113.61 Wh) lower if compared with the speed limit run. Additionally, time functions of speed support the idea of a proportionality of energy consumption to average speed because the cruising speed for the run without speed limit dropped to V
max1 = 70.86 km/h, while the run with speed limit has the same value, V
max2 = 76.79 km/h.
The comparison of energy consumptions in
Figure 6 and
Figure 8 reveals that the extension of travel time for T
ext = 16.8768 s brought for a run without speed limit energy savings of 6.459% (152.3 Wh). The same is valid also for a run with speed limit when these energy savings are 6.056% (142.8 Wh), both related to the consumption for the travel time T
m = 270 s without speed limit.
From the results presented, it is evident that if EOC and ENOC strategies are compared mutually for an equal maneuver time, T
m, EOC is more efficient in all presented runs. For runs without speed limit and a travel time of T
m = 270 s, EOC brought energy savings of 0.17% (4.1 Wh), and for an extended travel time, T
m = 286.8768 s, due to speed limit, these savings are 0.13% (3.1 Wh). A comparison with a less suitable control strategy (triangular speed profile between two stops) was published in [
13], where for a 3000 m run of the same unit, the differences in consumptions were higher (4.4% and 4.2% EOC and ENOC, respectively).
Possible energy savings by the extension of travel time were investigated in a previous work [
14]. It is evident that halving a drive’s speed with a viscous torque component directly proportional to angular speed, ω
r, can bring 50% in energy savings due to power proportional to
. In a similar way, by halving a drive’s speed with a quadratic torque component directly proportional to the square of angular speed,
can bring 75% of energy savings due to power proportional to
.
Mutual coupling between travel time, T
m; acceleration time, T
ε; and their influence on TM total energy consumption for ENOC is shown in
Figure 9. As can be seen, the extension of travel time results in lower energy consumption. An example of travel time extension from T
m1 = 600 s to T
m2 = 900 s with T
ε1 = 66.46 s and T
ε = 75.56 s (green and yellow points, red point is valid for T
m = 270 s) can bring energy savings of 192.9 Wh (W
T1 = 1415.7 Wh, W
T2 = 1222.8 Wh). Real energy optimal consumption, W
Tmin = 1052.4 Wh, can be achieved for the travel time T
m = 4100.2 s, which is hardly acceptable for travelers on board as well as a timetable of railway service. Therefore, in general, the maximum speed of the unit should be kept to the minimum practicable values to satisfy passenger demands on the availability, precision, and density of railway service.
