Article

Adversarial Malicious Encrypted Traffic Detection Based on Refined Session Analysis

1
School of Cyberspace, Hangzhou Dianzi University, Hangzhou 310000, China
2
School of Electronic Information, Hangzhou Dianzi University, Hangzhou 310000, China
3
College of Control Science and Engineering, Zhejiang University, Hangzhou 310000, China
*
Author to whom correspondence should be addressed.
Symmetry 2022, 14(11), 2329; https://doi.org/10.3390/sym14112329
Submission received: 11 October 2022 / Revised: 1 November 2022 / Accepted: 4 November 2022 / Published: 6 November 2022

Abstract

:
The detection of malicious encrypted traffic is an important part of modern network security research. The producers of the current malware do not pay attention to the fact that malicious encrypted traffic can also be detected; they do not construct further adversarial malicious encrypted traffic to deceive existing malicious encrypted traffic detection methods. However, with the increasing confrontation between attack and defense, adversarial malicious encrypted traffic samples will appear gradually, which will make the existing malicious encrypted traffic detection methods obsolete. In this paper, an adversarial malicious encrypted traffic detection method based on refined session analysis (ADRSA) is proposed. The key ideas of this method are: (1) interpretability analysis is used to extract malicious traffic features that are not easily affected by encryption, (2) restoration technology is used to further improve traffic separability, and (3) a deep neural network is used to identify adversarial malicious encrypted traffic. In experimental tests, the ADRSA method could accurately detect malicious encrypted traffic, particularly adversarial malicious encrypted traffic, and the detection rate is more than 95%. However, the detection rate of other malicious encrypted traffic detection methods is almost zero when facing adversarial malicious encrypted traffic. The detection performance of ADRSA exceeds that of the most popular detection methods.

1. Introduction

The detection of malicious encrypted traffic is an important component of modern network security research. To detect malicious encrypted traffic, one must compare the features of malicious encrypted traffic to those of normal encrypted traffic. A simple feature representing this concept is port numbers. However, malicious encryption software can circumvent these detection methods by using non-standard port numbers. There are also traditional traffic classification methods that are based on deep packet inspection. If one does not know the key to an encryption algorithm, it is impossible to understand the specific content in packet transmission. Another method is to focus on the payloads-features of encrypted packets, rather than the payload contents. However, the internal information in encrypted payloads is chaotic, and whether it can be used for traffic detection is highly controversial. At present, the most effective method to detect malicious encrypted traffic is based on the statistical features of encrypted traffic. These methods can overcome many technical limitations [1,2]. Statistics on encrypted traffic can be classified into static statistics and time statistics [3]. By collecting a large number of flows, statistical features, such as flow duration and packet length, can be calculated. Deep learning can analyze the relationships between features that cannot be identified through manual methods or machine learning. Additionally, deep learning models can also automatically learn features from original data. ElSayed et al. [4] proposed a deep-learning method to classify traffic as normal or as an attack. Saharkhizan et al. [5] proposed an advanced deep learning method to detect cyberattacks against Internet of Things systems.
Research into malicious encryption traffic detection is very important; the research methods discussed above may provide good accuracy for the detection of general malicious encrypted traffic, but they cannot detect adversarial samples. At present, there are only detection methods for malicious encryption traffic, and no detection methods work for adversarial malicious encryption traffic. The existing methods do not work well against adversarial malicious encryption traffic detection [6,7]. For most malicious encryption software, attackers believe that it is difficult to detect malware when using encrypted communication, so there is no adversarial treatment against mainstream detection methods. When an attacker discovers that malicious encrypted traffic can also be detected, they may create additional malicious encrypted traffic. With the upgrading of attacks and defense confrontation, more and more attackers will generate adversarial samples to bypass the current mainstream detection methods [8]. Even some minor changes will seriously affect the accuracy of the detection method [9]. However, at present, most research on malicious encryption traffic detection does not consider adversarial samples or propose adversarial sample detection ideas. This will increasingly affect the detection accuracy regarding malicious encrypted traffic. Thus, it is time to study adversarial malicious encryption traffic.
This paper mainly studies the detection of adversarial malicious encryption traffic. An adversarial malicious encrypted traffic detection method based on refined session analysis (ADRSA) is proposed in the current work. The single-feature recovery phase and overall feature generation phase-processing features are used to better detect adversarial malicious encryption traffic. Compared with the previous work, ADRSA not only extracts the statistical features of encrypted traffic but also proposes that the statistical features of encrypted traffic should be considered as a whole. Simultaneously, it can also detect adversarial malicious encryption traffic. The main contributions of this study can be summarized as follows.
1.
After a thorough literature review, first, a method to detect adversarial malicious encrypted traffic is proposed in this study.
2.
Based on the research of adversarial malicious encrypted traffic generation technology, this paper proposes several feasible adversarial sample generation methods for malicious encrypted traffic. The malicious encrypted traffic generated for this purpose is able to deceive the current malicious encrypted traffic detection methods, with a probability of more than 99%.
3.
By analyzing the adversarial sample generation method of malicious encrypted traffic, an improved session analysis method is proposed to better detect adversarial encrypted traffic. The key idea of this method is to extract and compute malicious traffic features that are not easily affected by encryption, reduce the impact of malicious encrypted traffic forgery, and improve the accuracy of adversarial malicious encrypted traffic detection. In the existing adversarial malicious encryption traffic samples, the detection accuracy is more than 95%.
The structure of this paper is as follows. In Section 2, related encrypted traffic classification research and adversarial research are reviewed. Section 3 presents an adversarial malicious encrypted traffic detection method, based on refined session analysis. Section 4 presents and discusses the experimental results. Section 5 summarizes the findings of this study and discusses future work.

2. Related Work

In the early stages of encrypted traffic research, the main goal is to identify the applications of encrypted traffic (e.g., online chat, email, file transfer, and streaming media). Previous researchers first proposed the identification of encrypted traffic based on port numbers and deep packet inspection and then proposed methods for leveraging images and statistical features.

2.1. Research on the Classification of Encrypted Traffic

2.1.1. Research on Traditional Encrypted Traffic Classification

Port-number-based classification refers to the well-known TCP/UDP port number system and is easy to implement. However, in modern applications using dynamic port numbers, the accuracy of port-based classification is reduced significantly. Although port-based classification is not very accurate, it is still widely used.
Deep packet inspection considers the payload contents of packets, but the encrypted traffic typically uses asymmetric encryption. If the encryption key is not known, it is difficult to decrypt traffic packets. Therefore, methods based on deep packet inspection are not applicable to the classification of encrypted traffic.

2.1.2. Current Research on Encrypted Traffic Classification

In the image-based encrypted traffic classification methods, original non-decrypted traffic data are initially processed and directly segmented according to their required size for processing. The resulting segments are then converted into images of the same size. Because machine learning and deep learning technologies are very mature in the field of image recognition, classification methods based on machine learning and deep learning are adopted for classifying converted images. The payload features of encrypted packets, rather than the payload content, are used for classification. In 2019, Yao et al. [10] proposed deleting the Ethernet header and keeping the IP header and the first 1500 bytes of each IP packet and applying zero padding at the end of packets with IP payloads of less than 1500 bytes in size. They then used a long short-term memory (LSTM) model for network traffic classification. Experimental results revealed a detection accuracy of 91.2%. In the same year, Rezaei et al. [11] proposed a deep-learning model for mobile application recognition that is suitable for encrypted traffic. The header and payload information from the first six packets in a flow are used for classification. The experiments yielded accuracy values of between 84% and 98%. In 2020, Lotfollahi et al. [12] proposed a method based on deleting Ethernet headers. In the transport layer segment, a zero was injected at the end of the UDP segment header, to make it equal in length to the TCP header. The packets are then converted from bits to bytes, while keeping the IP header and the first 1480 bytes of each IP packet and applying zero padding at the end of packets with IP payloads of less than 1480 bytes in length. A convolutional neural network (CNN) was then used to classify the encrypted traffic. The experimental results revealed an accuracy of 94%.
Some methods have attempted to classify encrypted traffic based on its statistical features. Although the statistical features of unencrypted traffic and encrypted traffic are not exactly the same, these features do not depend on the payload of a packet, so they are available for both encrypted and unencrypted traffic. Traffic packets are divided into several flows, based on their quintuples (source IP address, destination IP address, source port, destination port, and protocol). Others have considered the features of a bidirectional flow, which are primarily time-dependent. In 2016, Draper-Gil et al. [13] first studied the effectiveness of Virtual Private Network (VPN) traffic detection based on the time features of the flow that is being studied, where the encrypted traffic is classified by the different types of traffic. C4.5 and k-Nearest Neighbor (KNN) were used for verification The experimental results revealed a recognition accuracy for VPN traffic of nearly 90%. In 2017, Hodo et al. [14] proposed extracting the statistical features of encrypted traffic and classifying them into different groups, using an artificial neural network and Support Vector Machine (SVM). The experimental results revealed an accuracy of 99%. In 2020, Shen et al. [15] proposed a fine-grained web page fingerprint identification method, called FineWP. It is a fine-grained web page fingerprint method that only uses packet-length information. The experiment shows that the highest classification accuracy is 92%.
With the continued development of malicious encryption software, detecting malicious encrypted traffic is becoming increasingly important. Detection methods for malicious encrypted traffic represent a subset of methods for encrypted traffic classification.

2.2. Detection of Malicious Encrypted Traffic

2.2.1. Traditional Malicious Encrypted Traffic Detection Methods

Methods based on port numbers are the simplest and fastest methods for detecting malicious encrypted traffic. In the early days of detecting malicious encrypted traffic, detection based on port numbers was effective at handling well-known types of malicious encrypted traffic. However, with the development of port obfuscation, Network Address Translation (NAT), port forwarding, and other technologies in recent years, the detection accuracy of malicious encrypted traffic based on port numbers has been significantly reduced.
Additionally, methods based on deep packet inspection are not suitable for malicious encrypted traffic detection.

2.2.2. Current Research on Malicious Encrypted Traffic Detection

Recently, flexible encryption technology has developed rapidly [16,17], and the corresponding malicious encryption traffic detection technology has also developed. The current research on malicious encrypted traffic detection is primarily divided into two categories: the image-based malicious encrypted traffic detection method and the statistical feature-based malicious encrypted traffic detection method.
At present, image-based malicious encrypted traffic detection methods generally use the technique of converting the fragments into an image format for deep learning model training and classification. In 2019, Zeng et al. [18] proposed trimming the original traffic data files that were larger than 900 bytes down to 900 bytes, then adding zero padding to the ends of files smaller than 900 bytes to increase their length to 900 bytes. These uniform-length packet capture (PCAP) files were then converted into 30 × 30-byte two-dimensional (2D) IDX files. In their proposed framework, a method called a “deep-full-range” (DFR) process is applied, based on three deep learning models, namely, the CNN, LSTM, and sparse autoencoder models. In 2021, Yang et al. [19] proposed a malicious traffic detection model for encrypted networks that is based on ResNet. They deleted irrelevant data information from data packets, as well as any duplicate or empty data packets. The packet length was unified to 784 bytes. Their experimental results indicated an accuracy of 99.4%. In 2022, Chen et al. [20] proposed extracting five tuples information from undecrypted network traffic. Each byte was then processed in the form of two hexadecimal codes of alpha-layer data in the standard RGB color model, then converted to decimal values [0, 255], and finally converted into color values. The resulting images, with pixel dimensions of 170 × 170, were then fed into a CNN for prediction to obtain a classification of malicious traffic. The experimental results indicated an accuracy of 99%.
The statistical features of malicious encrypted traffic are different from those of normal encrypted traffic. Based on these features, information on encrypted traffic can be inferred to detect malicious encrypted traffic. In contrast to the identification stage of encrypted traffic applications, statistical features extracted in the early stages are relatively simple, with relatively few features. A large number of different statistical features can be extracted, including both static statistical features and time statistical features, which can describe encrypted traffic information. In 2017, Cuzzocrea et al. [21] proposed the technique of using time statistical features to identify Tor-related traffic. A machine learning algorithm was used to evaluate the effectiveness of the proposed feature when set in a real environment. The experimental results indicated an accuracy of 99%. In the same year, Taylor et al. [1] proposed that smartphone applications can be identified by means of fingerprint identification of the network traffic sent by smartphone applications. Although secure sockets layer (SSL) and transport layer security (TLS) hide the payload of the data packet, side-channel data, such as the size and direction of the data packet, will still be leaked from the encrypted connection. It is possible to use machine learning technology to identify smartphone applications from these data. The experiment shows that the accuracy is 96%. In 2019, Niu et al. [22] proposed a heuristic statistical testing method that combines statistics and machine learning. Four randomness tests were manually implemented to extract low-load features for machine learning, to improve real-time performance. The experimental results indicated an accuracy of 98.1%. Wang et al. [23] proposed a device-level lightweight malware identification and classification framework. It uses network traffic to detect mobile malware, using TCP statistics. The framework includes four steps: traffic collection, feature extraction, learning-based detection, and result interpretation. The experiment shows that the accuracy is 99.3% under the best conditions. In 2020, Saharkhizan et al. [5] proposed the use of statistical features in LSTM modules, integrated into a set of detectors. The modules were merged using a decision tree to obtain the aggregated outputs in the final stage. The experimental results indicated an accuracy of 99%. Rabbani et al. [24] proposed a method to improve the ability of cloud service providers to model user behavior. First, the user’s behavior is converted into an understandable format, then the malicious behavior is classified and identified using a multi-layer neural network. The static statistical features and partial time statistical features of the encrypted stream are used. The experiment shows that the average accuracy is 99%. Ullah et al. [25] proposed a two-level abnormal activity detection model for an Internet of Things intrusion detection system, using statistical features. The first-level model used decision trees to classify network flows as normal or abnormal flows, while the second-level model used random forests (RF) to classify the categories or subcategories of detected malicious activities. The experimental results indicated an accuracy of 99.99%. The authors did not consider the possible influence of adversarial samples on their detection model, which may not be effective when faced with adversarial samples. Montazeri et al. [26] proposed a two-layer method to detect and characterize DNS over HTTPS (DoH) traffic by using time statistical feature classifiers to identify tunnel activities. In the first layer, DoH traffic was separated from non-DOH traffic. In the second layer, the DoH traffic was characterized. The authors discussed multiple model effects; the experimental results indicated an accuracy of 98%. The statistical features proposed by the authors are relatively simple and are few in number. Ma et al. [27] proposed a model-training training method based on the KNN algorithm, which only requires a small amount of data. Based on the features of encrypted traffic, the concept of feature weights was introduced and a weighted-feature KNN algorithm was proposed. The experimental results indicated an accuracy of 99.3%. Samy et al. [28] proposed a distributed and robust comprehensive attack-detecting framework using a deep-learning LSTM to detect multiple Internet of Things network attacks. The method consists of four phases: deep learning model training and testing, framework deployment, traffic analysis, and attack detection, and performance monitoring and updates. The experimental results indicated an accuracy of 99.97%. Zheng et al. [29] proposed using statistical features to train the clustering models. In 2021, ElSayed et al. [4] proposed a hybrid deep learning method based on a CNN, which combines the CNN algorithm with several machine learning algorithms, including RF, KNN, and SVM. These are used to classify traffic as normal or an attack. The experiment in this paper shows that the accuracy rate exceeds 99% when at its best. In 2022, Zebin et al. [30] proposed a balanced stacked random forest classifier to detect and classify DOH attacks. The author directly uses the statistical features of streams. Hajimaghsoodi et al. [31] proposed a three-stage distributed denial of service attack (DDoS) attack countermeasure based on a statistical model, called RAD, which is used to score users as a way to detect DDoS attacks. In the first stage, the user’s traffic behavior is divided into either suspicious or benign behaviors, which are represented by the amount of traffic, packets, concurrent connections, and user-generated traffic. In the second stage, the drop, jitter, and delay processing parameters are used to identify the potential attack states. In the third stage, the relevant policies are implemented for suspicious users, and their impact as a way to reduce false alarms is continuously assessed.
Most of the studies based on statistical features that are mentioned above differ in terms of the deep learning models used. In the preprocessing of encrypted traffic, the extracted statistical features are used directly for training the machine learning and deep learning models to perform classification. Each line in an original flow statistics file represents a flow. Directly inputting an original file for model training represents only one portion of a session, which offers a method for splitting a session into multiple flows to be considered separately. However, the overall features of a session are not considered, so it is difficult to represent the features of the encrypted traffic accurately. Additionally, the studies discussed above did not consider the detection of adversarial samples, wherein an attacker may counterfeit specific statistical features, which significantly reduces the accuracy of the detection methods discussed above for detecting adversarial samples.

2.3. Adversarial Malicious Encrypted Traffic Research

There are relatively few existing studies on adversarial attacks for the detection of malicious encrypted traffic. In 2019, Usama et al. [9] proposed a black-box adversarial attack on a Tor traffic classification machine learning model. The article provides an adversarial analysis of models that distinguish Tor traffic, but the authors’ approach is similar to image adversarial methods and is not applicable to adversarial malicious encrypted traffic. In 2021, Maarouf et al. [32] focused on the effectiveness of different evasion attacks and on understanding the flexibility of machine and deep learning algorithms. The test C4.5 decision tree, KNN, artificial neural network, CNN, recursive neural network, and other algorithms evaluate the elasticity of the densified traffic classification under the conditions of zero-order optimization, projection gradient descent, and DeepFool of adversarial attacks. However, the authors assumed that the counterattack is a white box avoidance attack. In fact, it is difficult for attackers to obtain detection algorithms for white-box attacks. In 2022, Sharon et al. [8] proposed TANTRA, an adversarial network traffic remolding attack that is based on end-to-end timing. An LSTM deep neural network is used, which is trained to learn the time difference between the benign packets of the target network. The trained LSTM is used to set the time difference between malicious traffic packets (attacks). The method proposed by the author can only modify the timestamp of malicious attacks. In fact, many features can be modified. Liu et al. [6] generated adversarial network traffic by modifying the destination ports and inserting junk data and other methods to evaluate the accuracy of several machine learning detection algorithms in detecting adversarial malicious encryption traffic. The experiments show that most of the methods proposed by the authors reduce the accuracy of machine learning detection to about 50%. However, the authors directly modified data packets, which are only conducive to low-level feature modification. Additionally, the authors did not propose a specific detection method for adversarial samples.
Adversarial malicious encryption traffic detection is challenging. In the above research on adversarial malicious encryption traffic, it is clear that analysts need complex training to obtain detection models and generate adversarial samples for detection models or modify only a few features. Our work considers the above factors; the proposed method does not require complex training to obtain the detection model and can modify more features. The corresponding detection methods are discussed in the following section.

3. ADRSA

The ADRSA algorithm consists of three parts, namely, interpretability analysis to obtain effective features, the preprocessing procedure stage, and the deep learning stage. The preprocessing procedure stage includes the single-feature recovery phase and the overall feature generation phase. The overall structure is shown in Figure 1. First, we collect data, extract the effective features through the interpretability analysis of encrypted traffic, enter the preprocessing procedure, and group all flows through five tuples (source IP, destination IP, source port, destination port, and protocol). Then, in the single-feature recovery phase, each flow subtracts the minimum value of the corresponding feature of the flow in the group. Then in the overall feature generation phase, we average the group features in the previous step and add the average value of the corresponding features to each flow. The output is the new features, which are put into the deep learning model for study. Section 3.1 discusses the interpretability analysis of malicious encrypted traffic. Section 3.2 discusses the generation of adversarial malicious encryption traffic. Section 3.3 discusses adversarial malicious encryption traffic detection.

3.1. Analysis of Encrypted Traffic Features and Refined Session Analysis

Statistics on encrypted traffic can be classified into static statistics and time statistics. Currently, encrypted communication in a large number of networks uses symmetric keys and the size of the data flow, generally, does not change significantly. Therefore, the time and static statistics of encrypted traffic can reflect the features of that traffic. Information flow travels in both directions. The first handshake in a TCP handshake packet determines the forward (from the source IP address to the destination IP address) and reverse (from the destination IP address to the source IP address) directions of the flow. The static statistics of the flow include the number of forward flow packets and the size of the forward flow packets. The statistical features of a time series include the time interval for the arrival of the forward packets and the duration of the flow. The statistical features of unencrypted traffic and encrypted traffic are not exactly the same; however, either these features do not change dramatically with encryption, or the transformation of these features is similar, whether they represent normal traffic or malicious traffic. Thus, whether or not traffic is encrypted does not affect the use of these features. However, when traffic is encrypted, one cannot look at the payload contents of packets to determine whether the traffic is normal or malicious.
H X = i = 1 n p i logp i
Entropy is derived from thermodynamic concepts and represents the confusion degree of information, as shown in Equation (1). Therefore, entropy is a measure of the degree to which a system can be ordered. Data compression and data encryption can improve the value of information entropy. Therefore, information entropy can be used to distinguish encrypted traffic from unencrypted traffic. According to traditional information theory, the information entropy of every 8-bit letter in English is approximately 1.3 bits. However, based on the particularity of encrypted traffic, the internal information in encrypted packets is chaotic, and the information entropy is high. This leads to an approximation of the probability of each letter, resulting in the information entropy approaching 4.7 bits, so the packet content cannot be identified. Therefore, the detection of malicious encrypted traffic cannot be performed directly, based on packet payload content. However, one can infer information on traffic, based on statistical features. In the following discussion, statistical features that can help distinguish traffic are analyzed and possible explanations are provided.
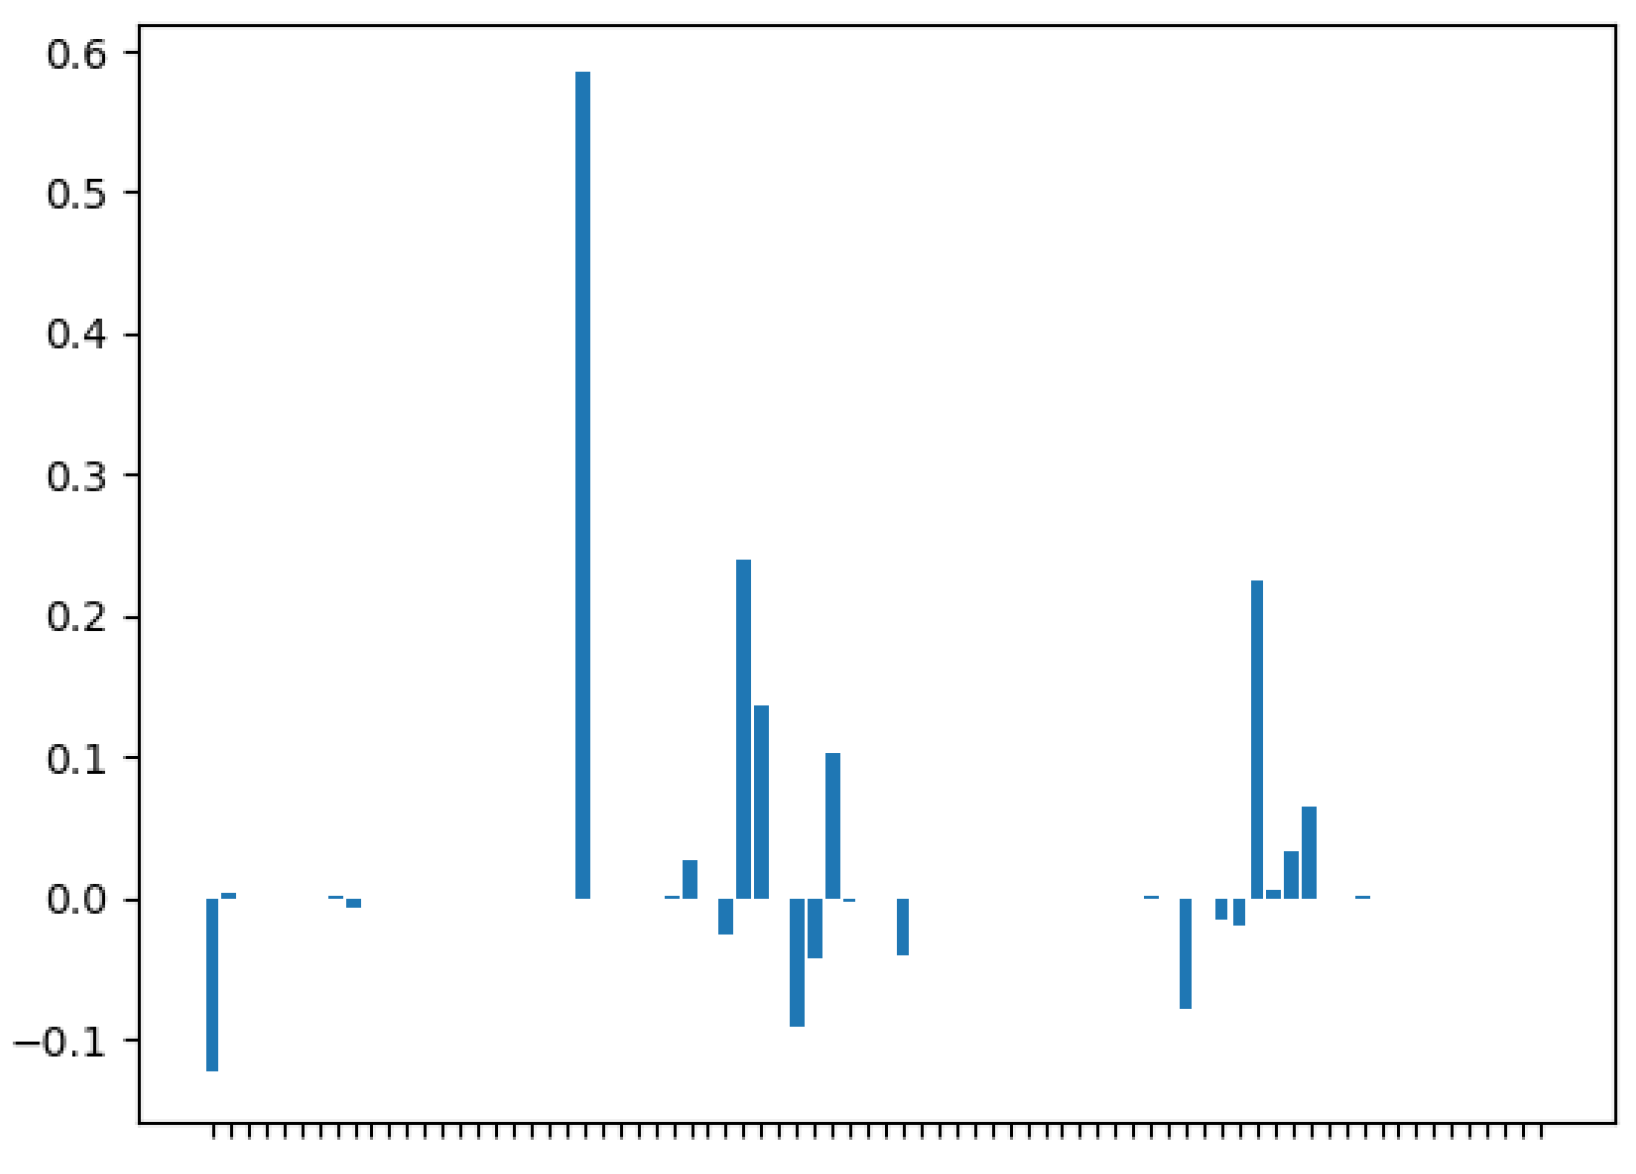
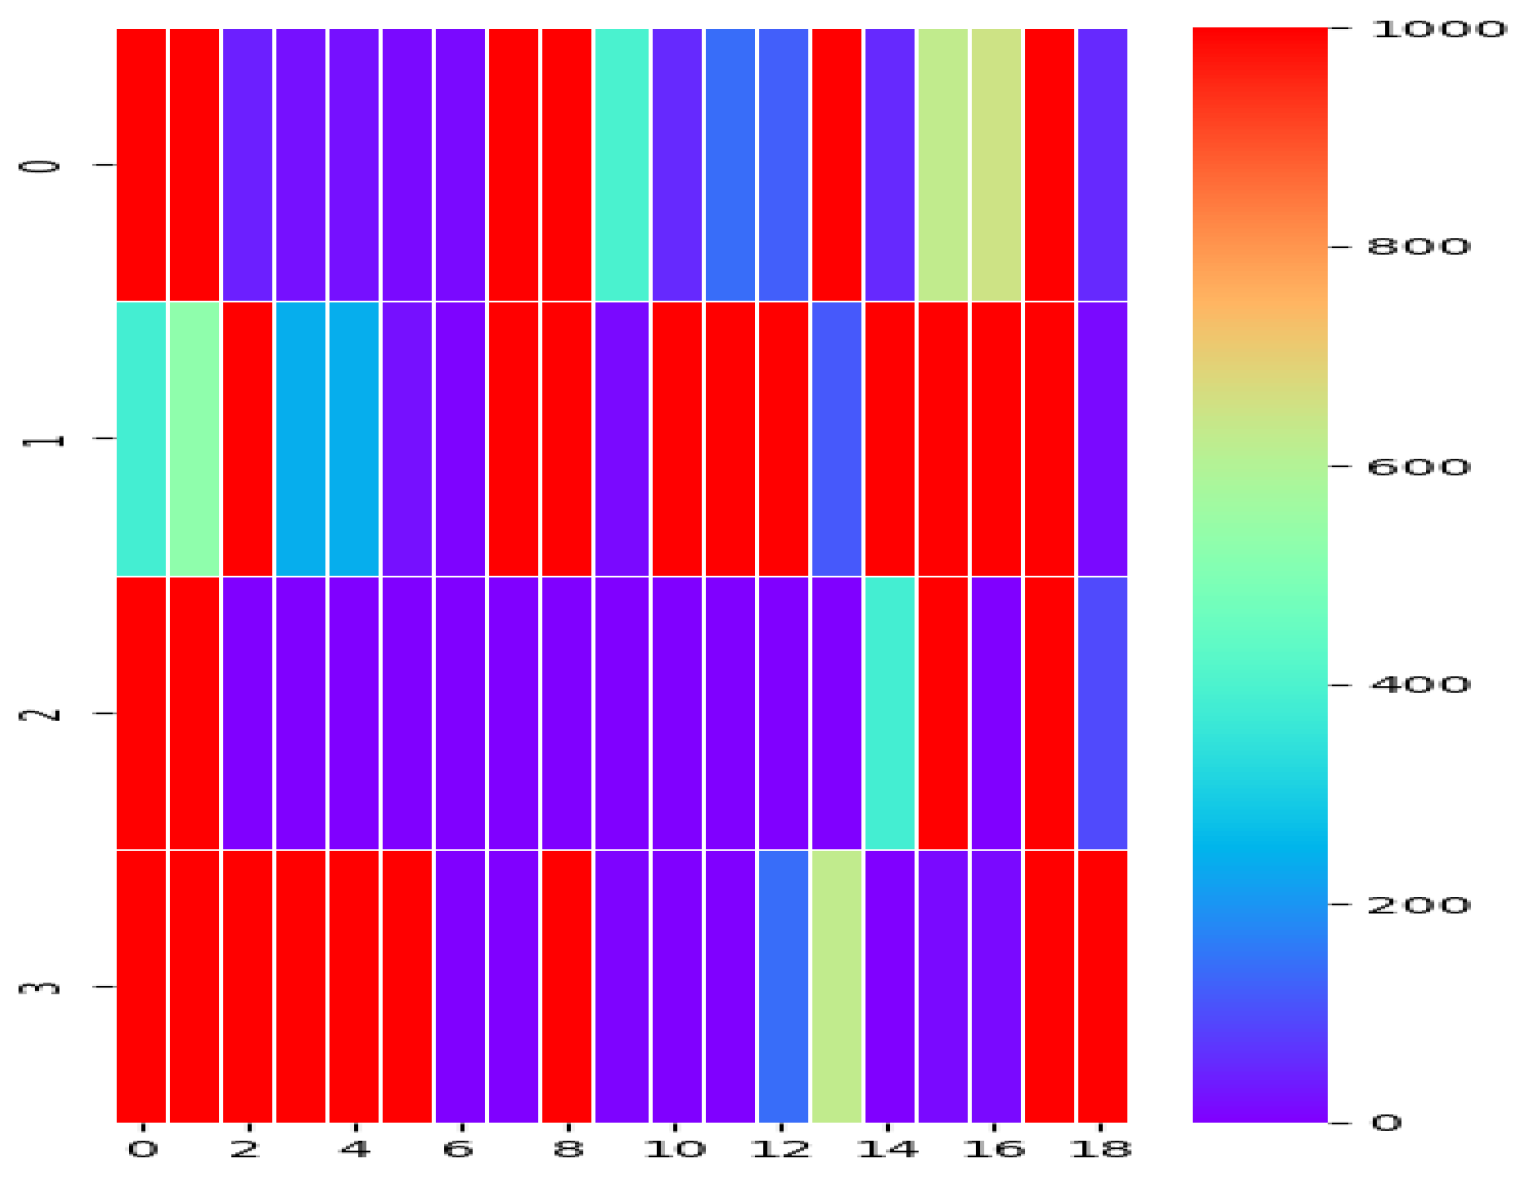
Malicious encrypted traffic was compared to normal encrypted traffic, based on 76 features, using a 1D CNN model. After training and testing, it was determined that the model had a specific ability to distinguish malicious encrypted traffic from normal encrypted traffic. Figure 2 and Figure 3 present the results of our explanatory analysis. Figure 2 presents the results of the interpretability analysis, based on a gradient algorithm, and Figure 3 presents the results of the interpretability analysis, based on the confusion assessment method (CAM) algorithm.
Based on the gradient algorithm analysis, one can see that there are a number of features, among the 76 features tested, that account for a large proportion of the weight. As shown in Figure 3, the CAM heat map shows 76 features. The greater the weight of each feature, the greater the value, and the more red it tends to be. By considering these features in combination with the CAM algorithm heat map, only features above a specific weight threshold are retained to continue testing while maintaining high accuracy.
Therefore, a group of 30 features and a group of 12 features among the 76 original features were selected for further testing. These features accounted for a large proportion of the weight in the original model, and we wished to determine their impact.
Our experimental results indicate that some features are more beneficial for distinguishing normal encrypted traffic from malicious encrypted traffic than other features. The time series features of the current type of malicious encrypted traffic are different from those of normal encrypted traffic. Each feature is called a detection point. Existing malicious encrypted traffic detection schemes based on time statistics also utilize detection points.
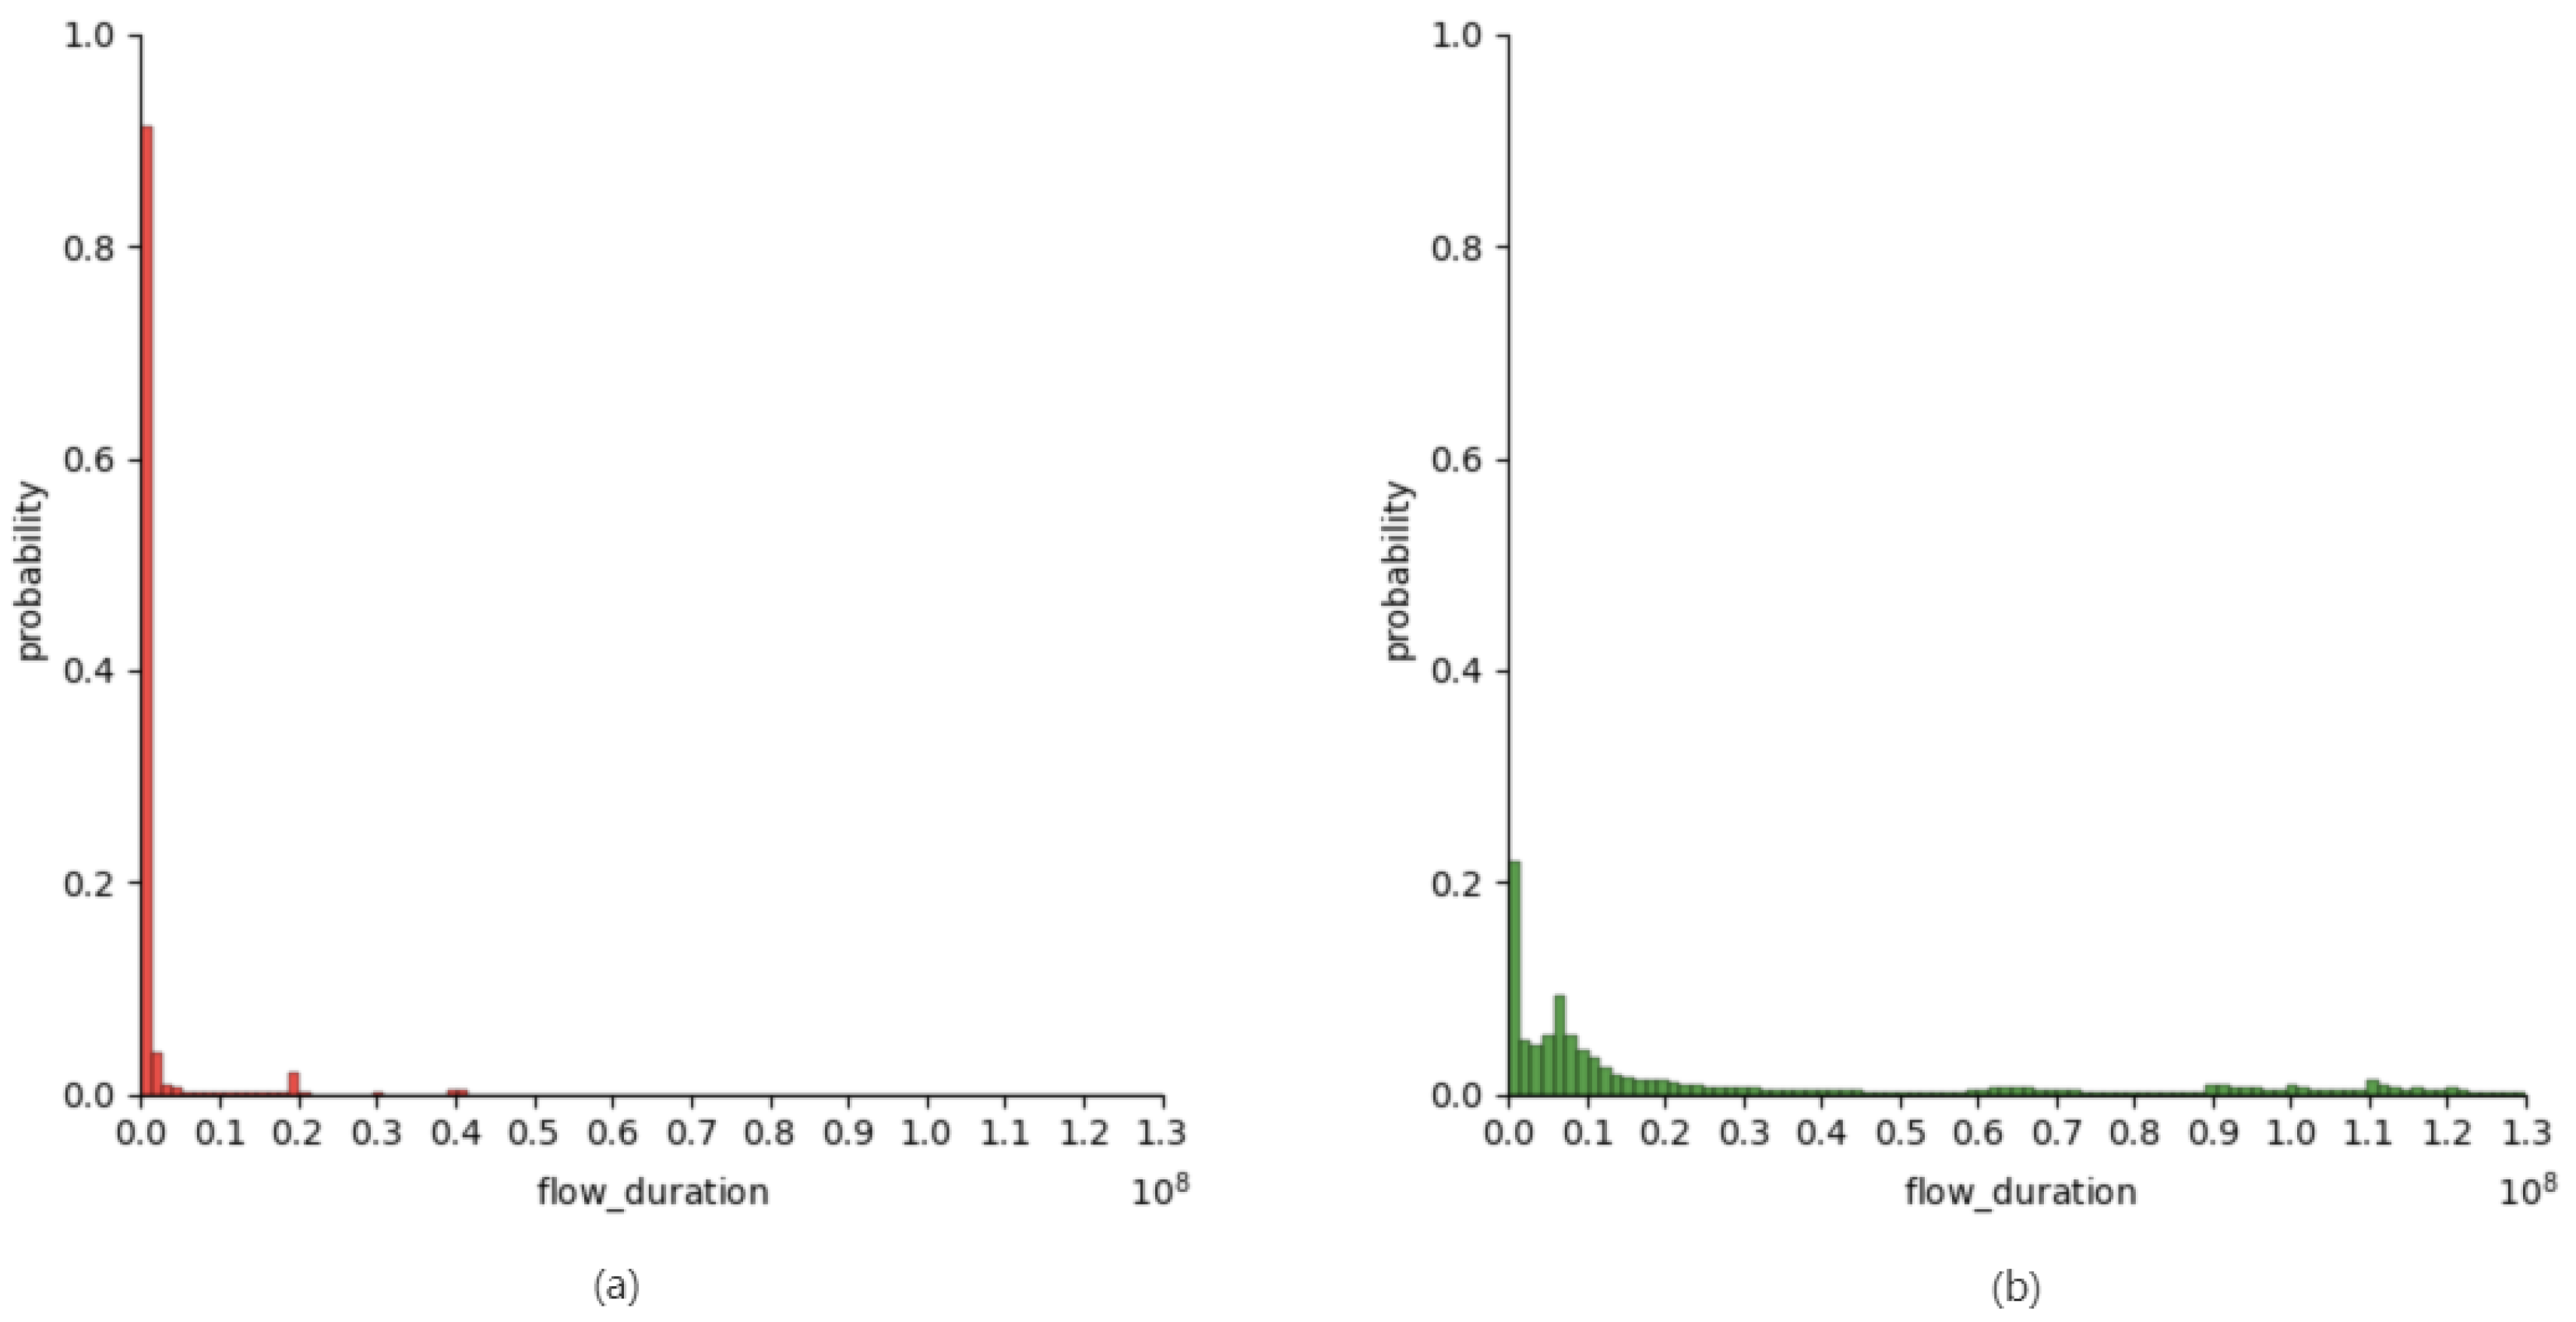
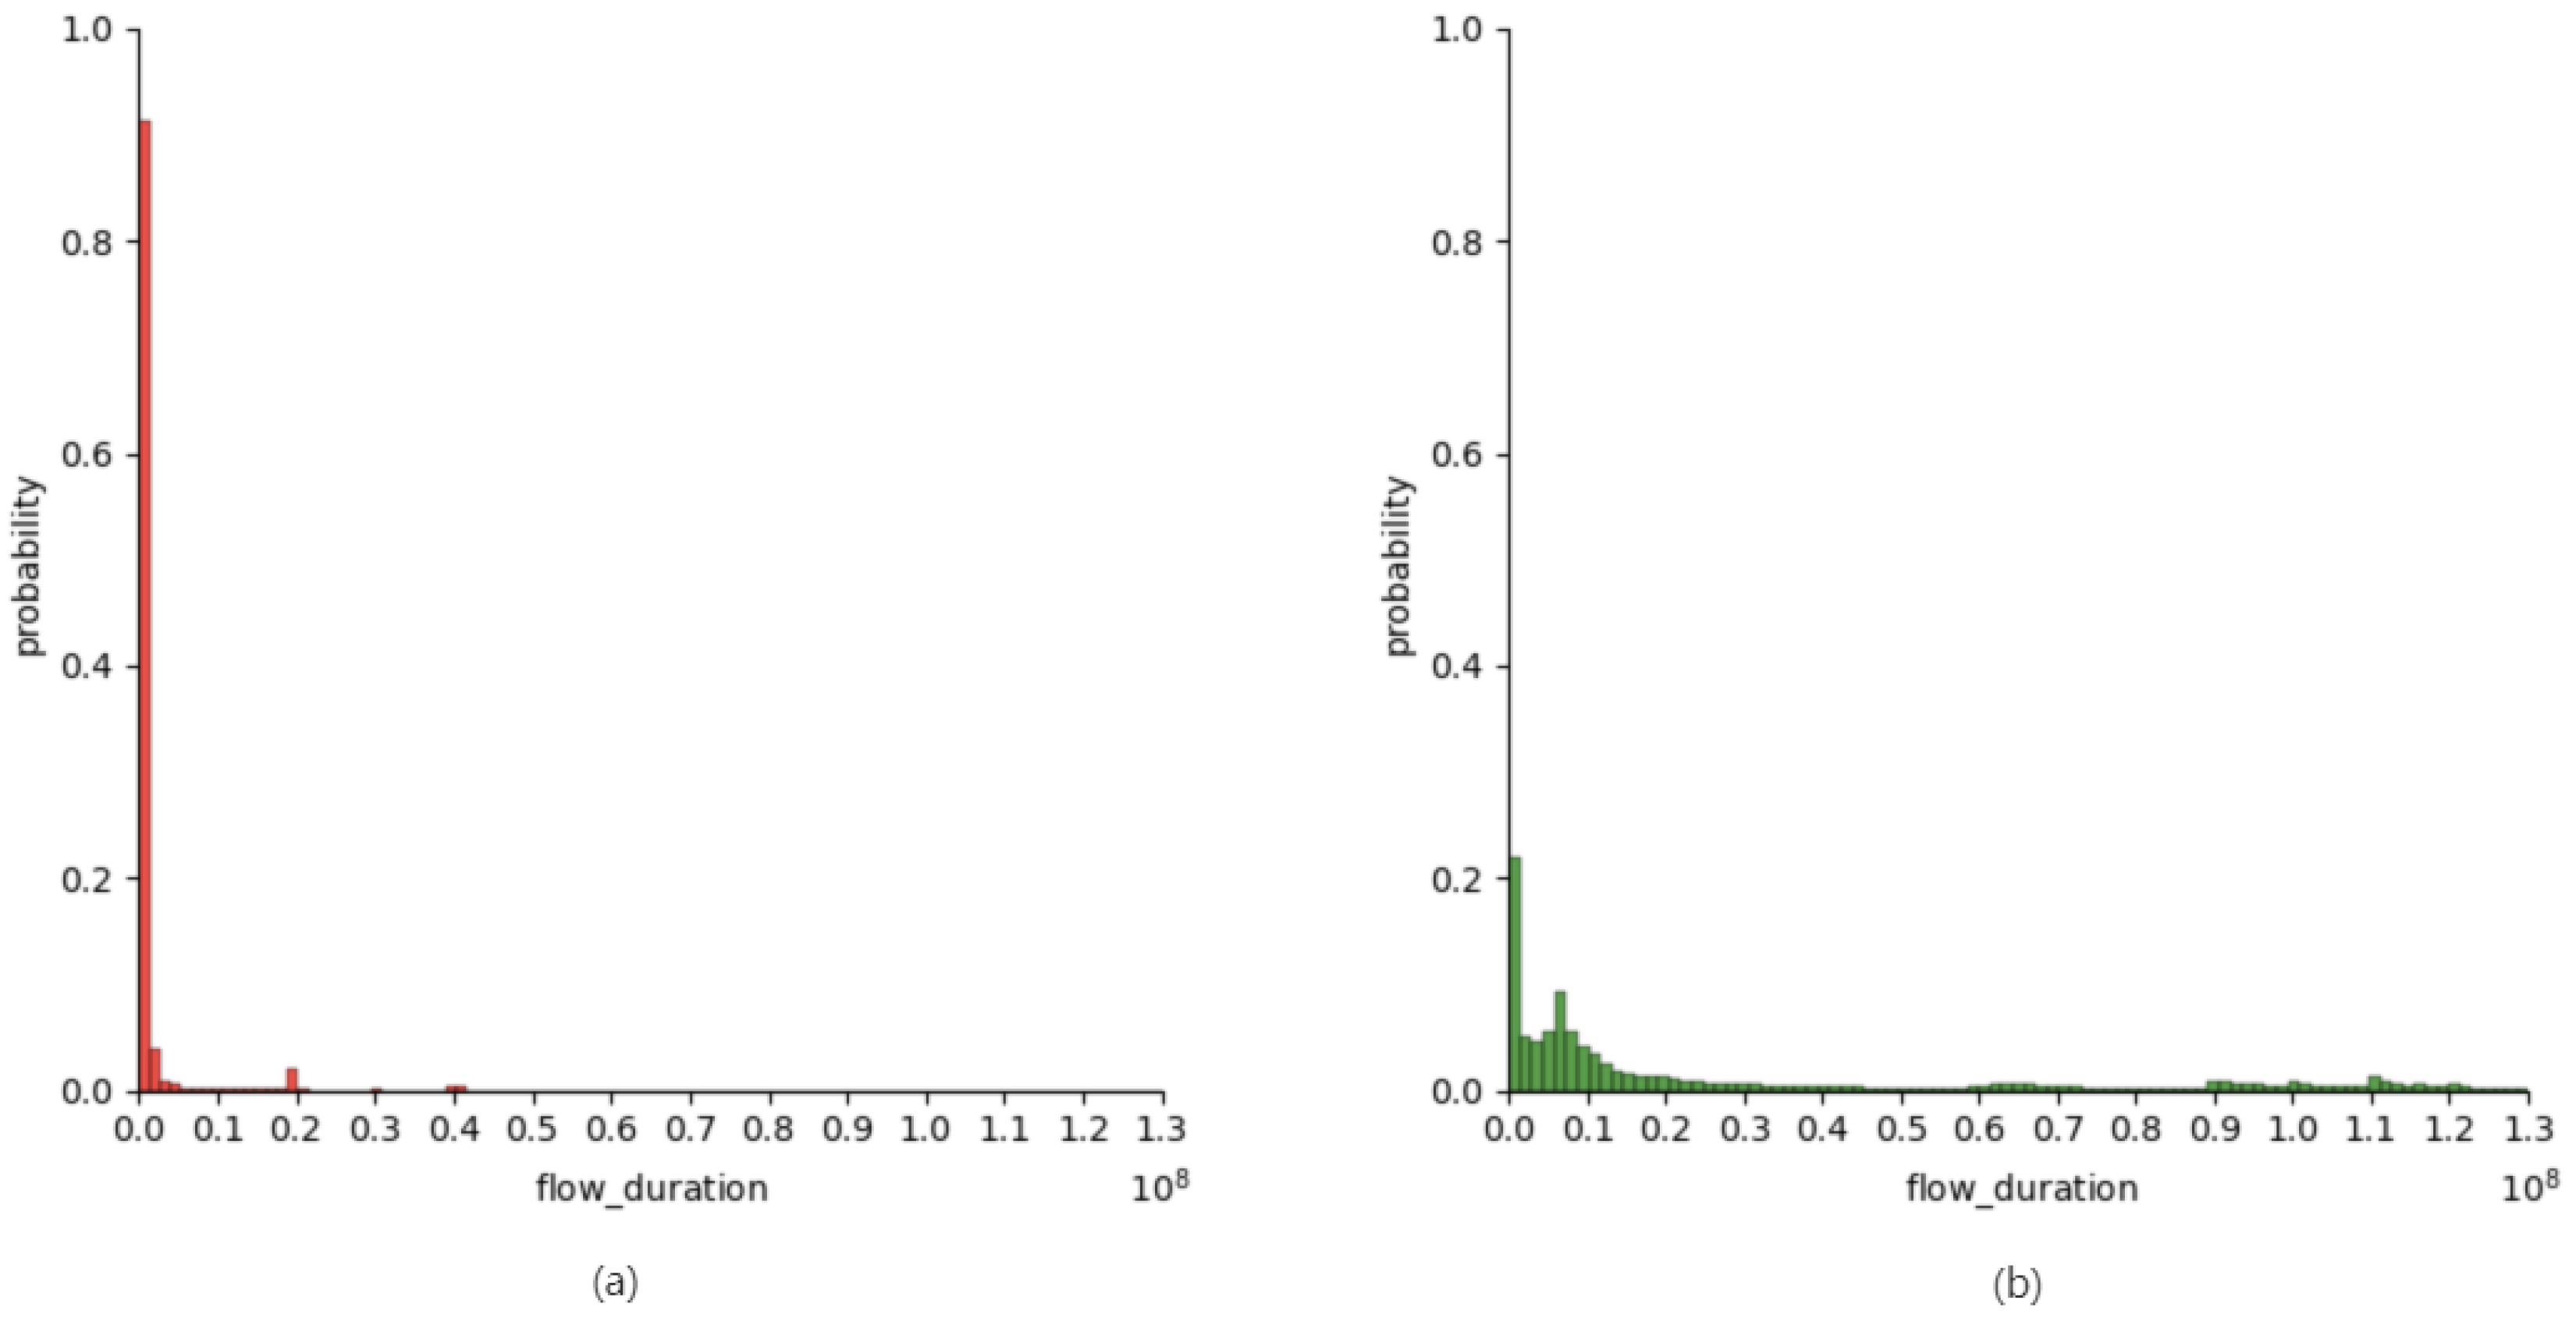
Our work collected statistics on all the malicious and normal encrypted traffic samples. Figure 4 presents the detection point of flow duration as an example; “flow_duration” represents the duration of the entire flow.
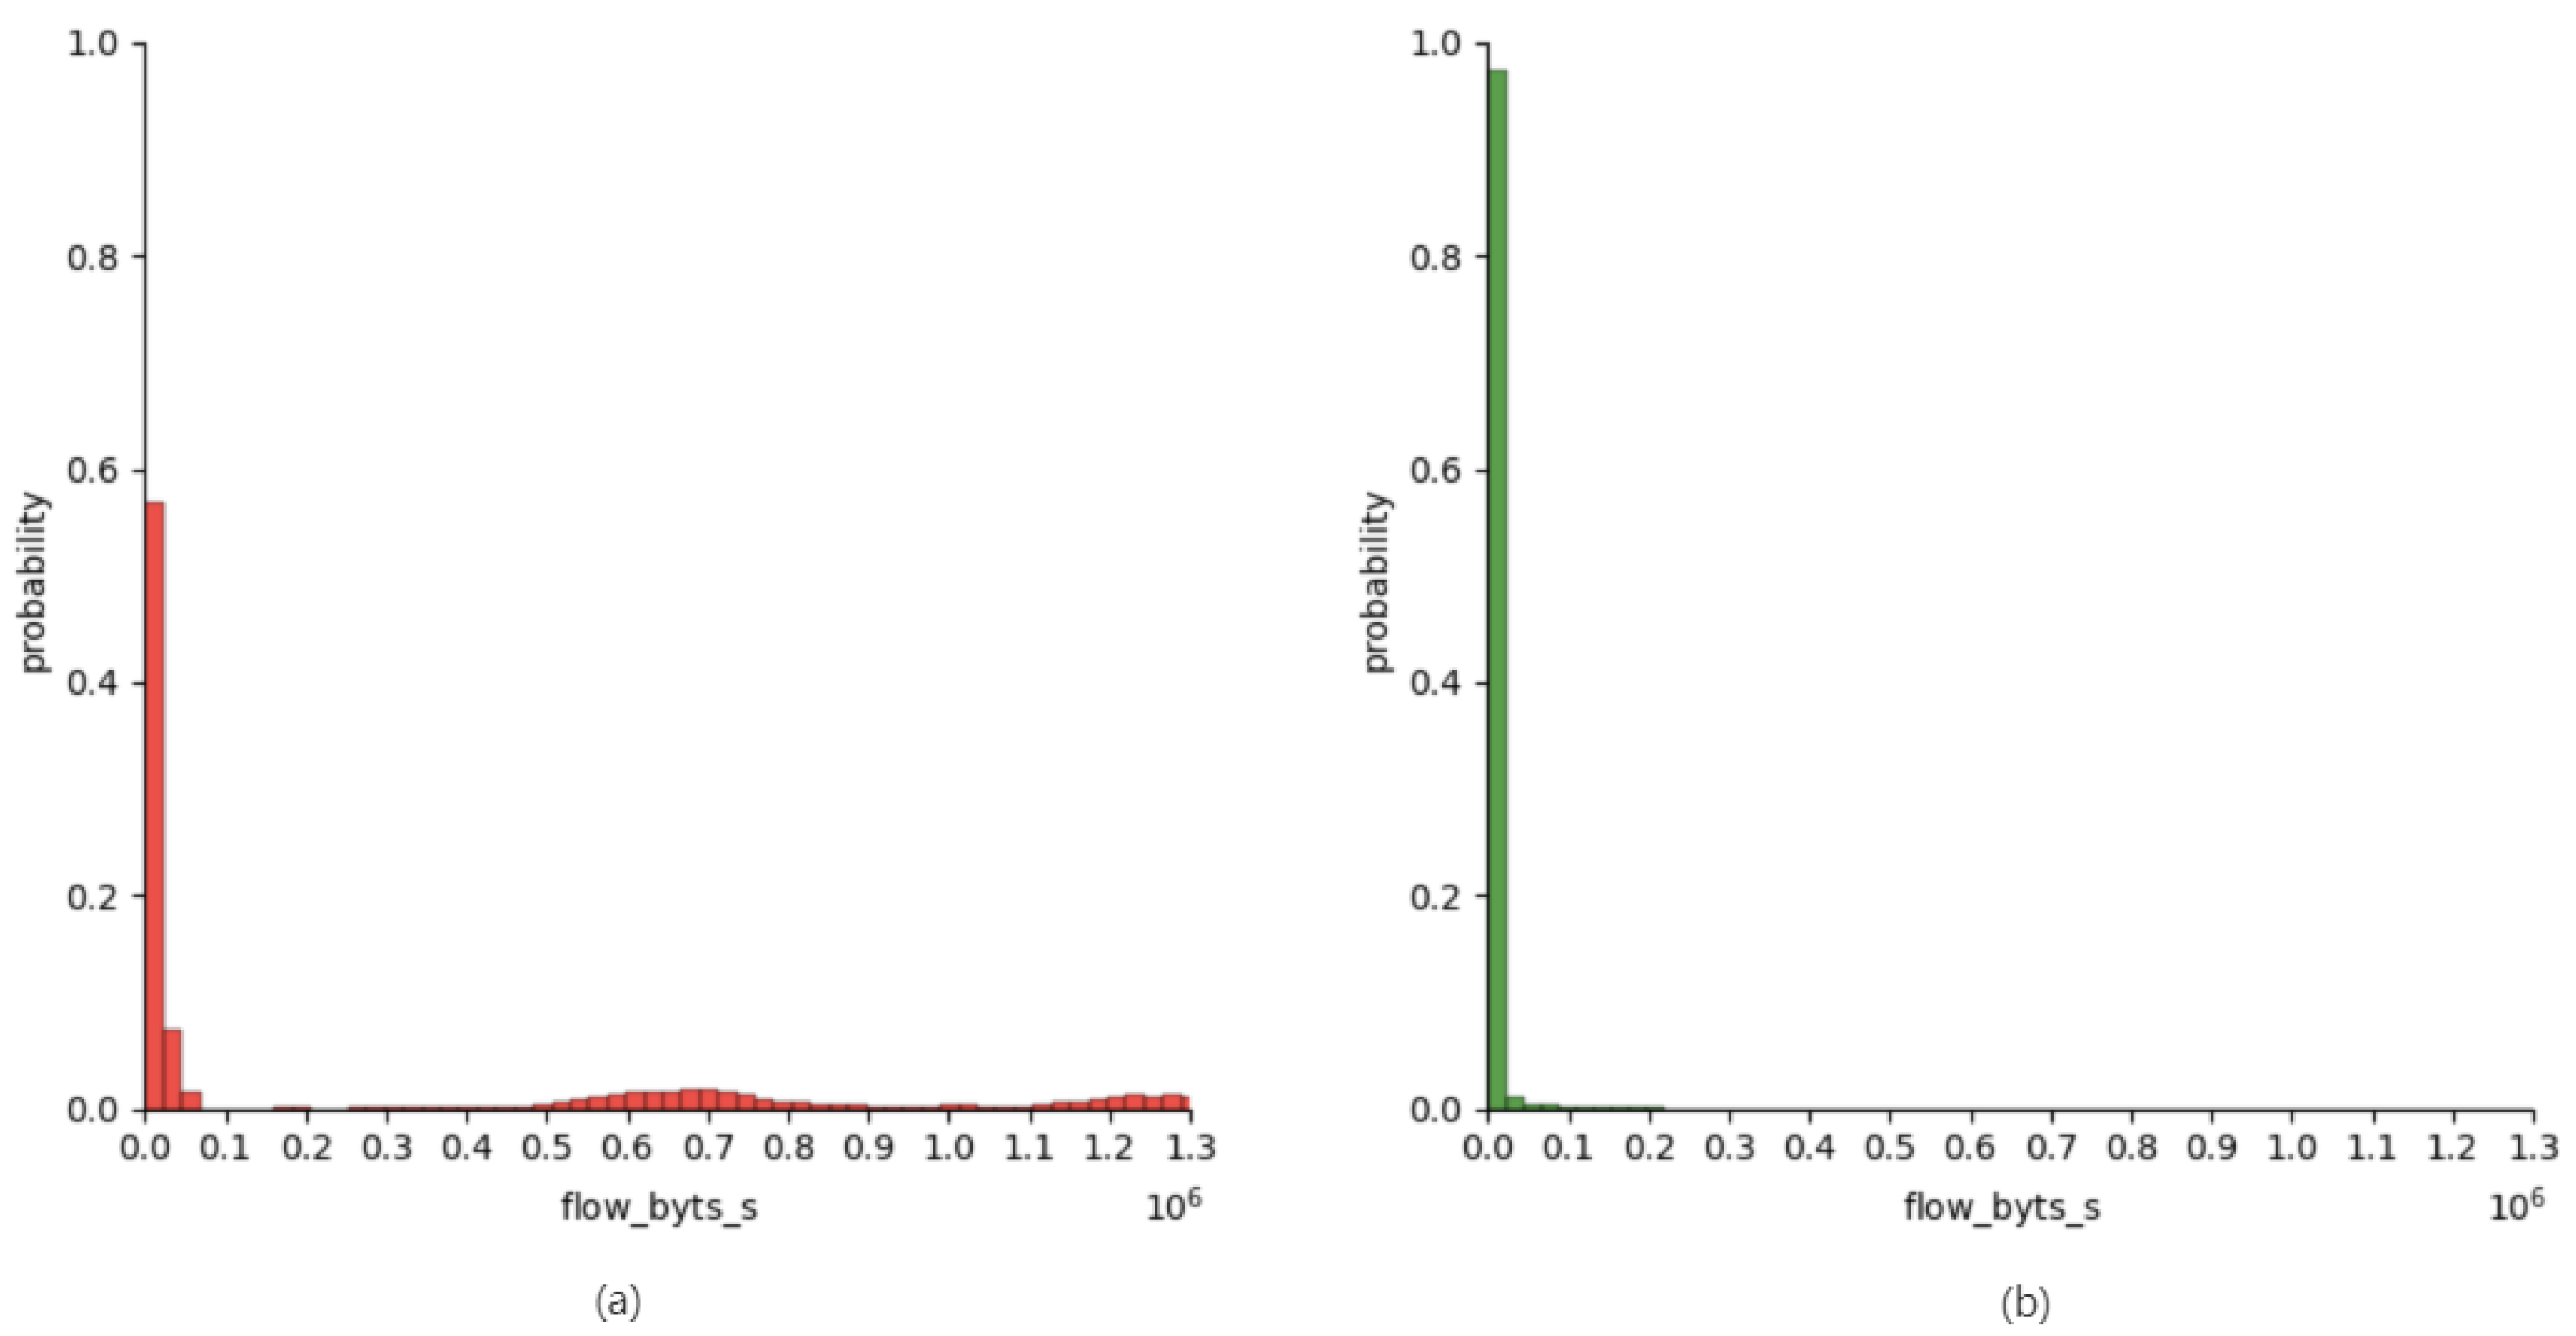
One can see that the vast majority of malicious encrypted traffic lasts for less than 107 microseconds, whereas only approximately half of the normal encrypted traffic lasts for less than 107 microseconds. Therefore, there are differences between the duration distributions of malicious encrypted traffic and normal encrypted traffic. For flows with similar duration distributions, all flows with a duration of less than 107 microseconds are extracted for further analysis. Figure 5 presents the detection point of “flow_byts_s” as an example; “flow_byts_s” is the ratio of the total size of the stream to the duration of the flow.
One can see that there are also differences in the flow_byts_s features between normal encrypted traffic and malicious encrypted traffic. Because there are dozens of features available for classification methods that are based on statistical features, even if the malicious encrypted traffic cannot be clearly distinguished from normal encrypted traffic based on one feature, other features will be different. By taking these features into consideration, malicious encrypted traffic and normal encrypted traffic can be accurately classified.
Based on a comprehensive investigation of the existing features and combined with the above interpretability analysis of malicious encryption traffic feature detection, the features that can effectively distinguish malicious encryption traffic are analyzed, as presented in Table 1. At the same time, the feature space is expanded through a nonlinear combination of features, which increases the detection ability of malicious encryption traffic and improves the anti-forgery ability of the model.
The behaviors of normal communication and malicious communication were also analyzed. Considering the thermal maps derived from the observed statistical features, potential explanations for features that effectively distinguish malicious encrypted traffic are discussed below. For normal encrypted traffic, the flow duration is typically longer than that of malicious encrypted traffic. This may be because malicious encrypted traffic communication is often disconnected directly after a command is executed, whereas normal communication is often only disconnected after a connection is established and all operations have been completed. Therefore, the duration of each flow is longer. This is because most malware controls how often it communicates with a server to minimize the attention that it receives from the detection software. In contrast, normal communication users often browse information first and then make requests according to their needs. Malware is typically targeted or automated to send packets rapidly, to acquire the required information quickly. Additionally, malware tends to behave abruptly in a manner that normal communications do not. Therefore, for normal encrypted traffic, the values of “flow_iat” (the interval between the arrival of two packets in a flow), “fwd_iat” (the interval between the arrival of two packets in a forward flow), and “bwd_iat” (the interval between the arrival of two packets in a backward flow) are typically larger than those of malicious encrypted traffic. Generally speaking, normal encrypted traffic issues a large number of requests to a server to obtain text, images, and other resource files, and the server returns the requested resource files. Therefore, the resulting “totlen_fwd_pkts” (the total forward data size) is greater than the resulting “totlen_bwd_pkts” (the total reverse data size). Malicious encrypted traffic is used to obtain significant data from a target server. Malware is used to download files, monitor screens, etc.; therefore, the resulting totlen_fwd_pkts file is smaller than the resulting totlen_bwd_pkts.
Based on the interpretability analysis of the encrypted traffic features presented above, it can be concluded that the features of encrypted traffic are all features of a single traffic flow, but the features of a single traffic flow cannot represent the overall features of traffic. The features of a single traffic flow directly represent only one part of a session and the features of the entire session are not considered. Therefore, this paper proposes a method to consider the entire flow of a session and a refined detection algorithm, based on the session analysis, which is presented in Algorithm 1.
Algorithm 1 Refined detection of session analysis
INPUT: A feature file F containing statistical features obtained from traffic files
OUTPUT: Refined feature file O
Prepare a queue Q to store each group
//Step 1. Gets groups with IP as the key to Q
Group feature file F by IP
Put each group into queue Q
//Step 2. Each group is processed
while Q is not empty do
  Take Q out of the queue and assign it to Qi
  Purify flow by removing extraneous features (IP address, port, protocol, timestamp)
  Get the average value MEANi of each grouping
  //Step 3. Each flow in the grouping gets the overall features
  while Qi is not empty do
    //Processing of each data group
    Take Qi out of the queue and assign it to V
    while Vi is not empty do
      //Each field of each data is processed
      Vi plus the average MEANi of the corresponding field
end while
end while
  //Step 4. Save as a new feature file O
  Write the result to file O
end while
Algorithm 1 receives a feature file and then groups the feature content of the feature file, based on the source IP address and the destination IP address. The feature content of the feature file is then explored in each feature group. First, features unrelated to classification, such as the IP address and port, are deleted, then the intra-group average of the other features is calculated.
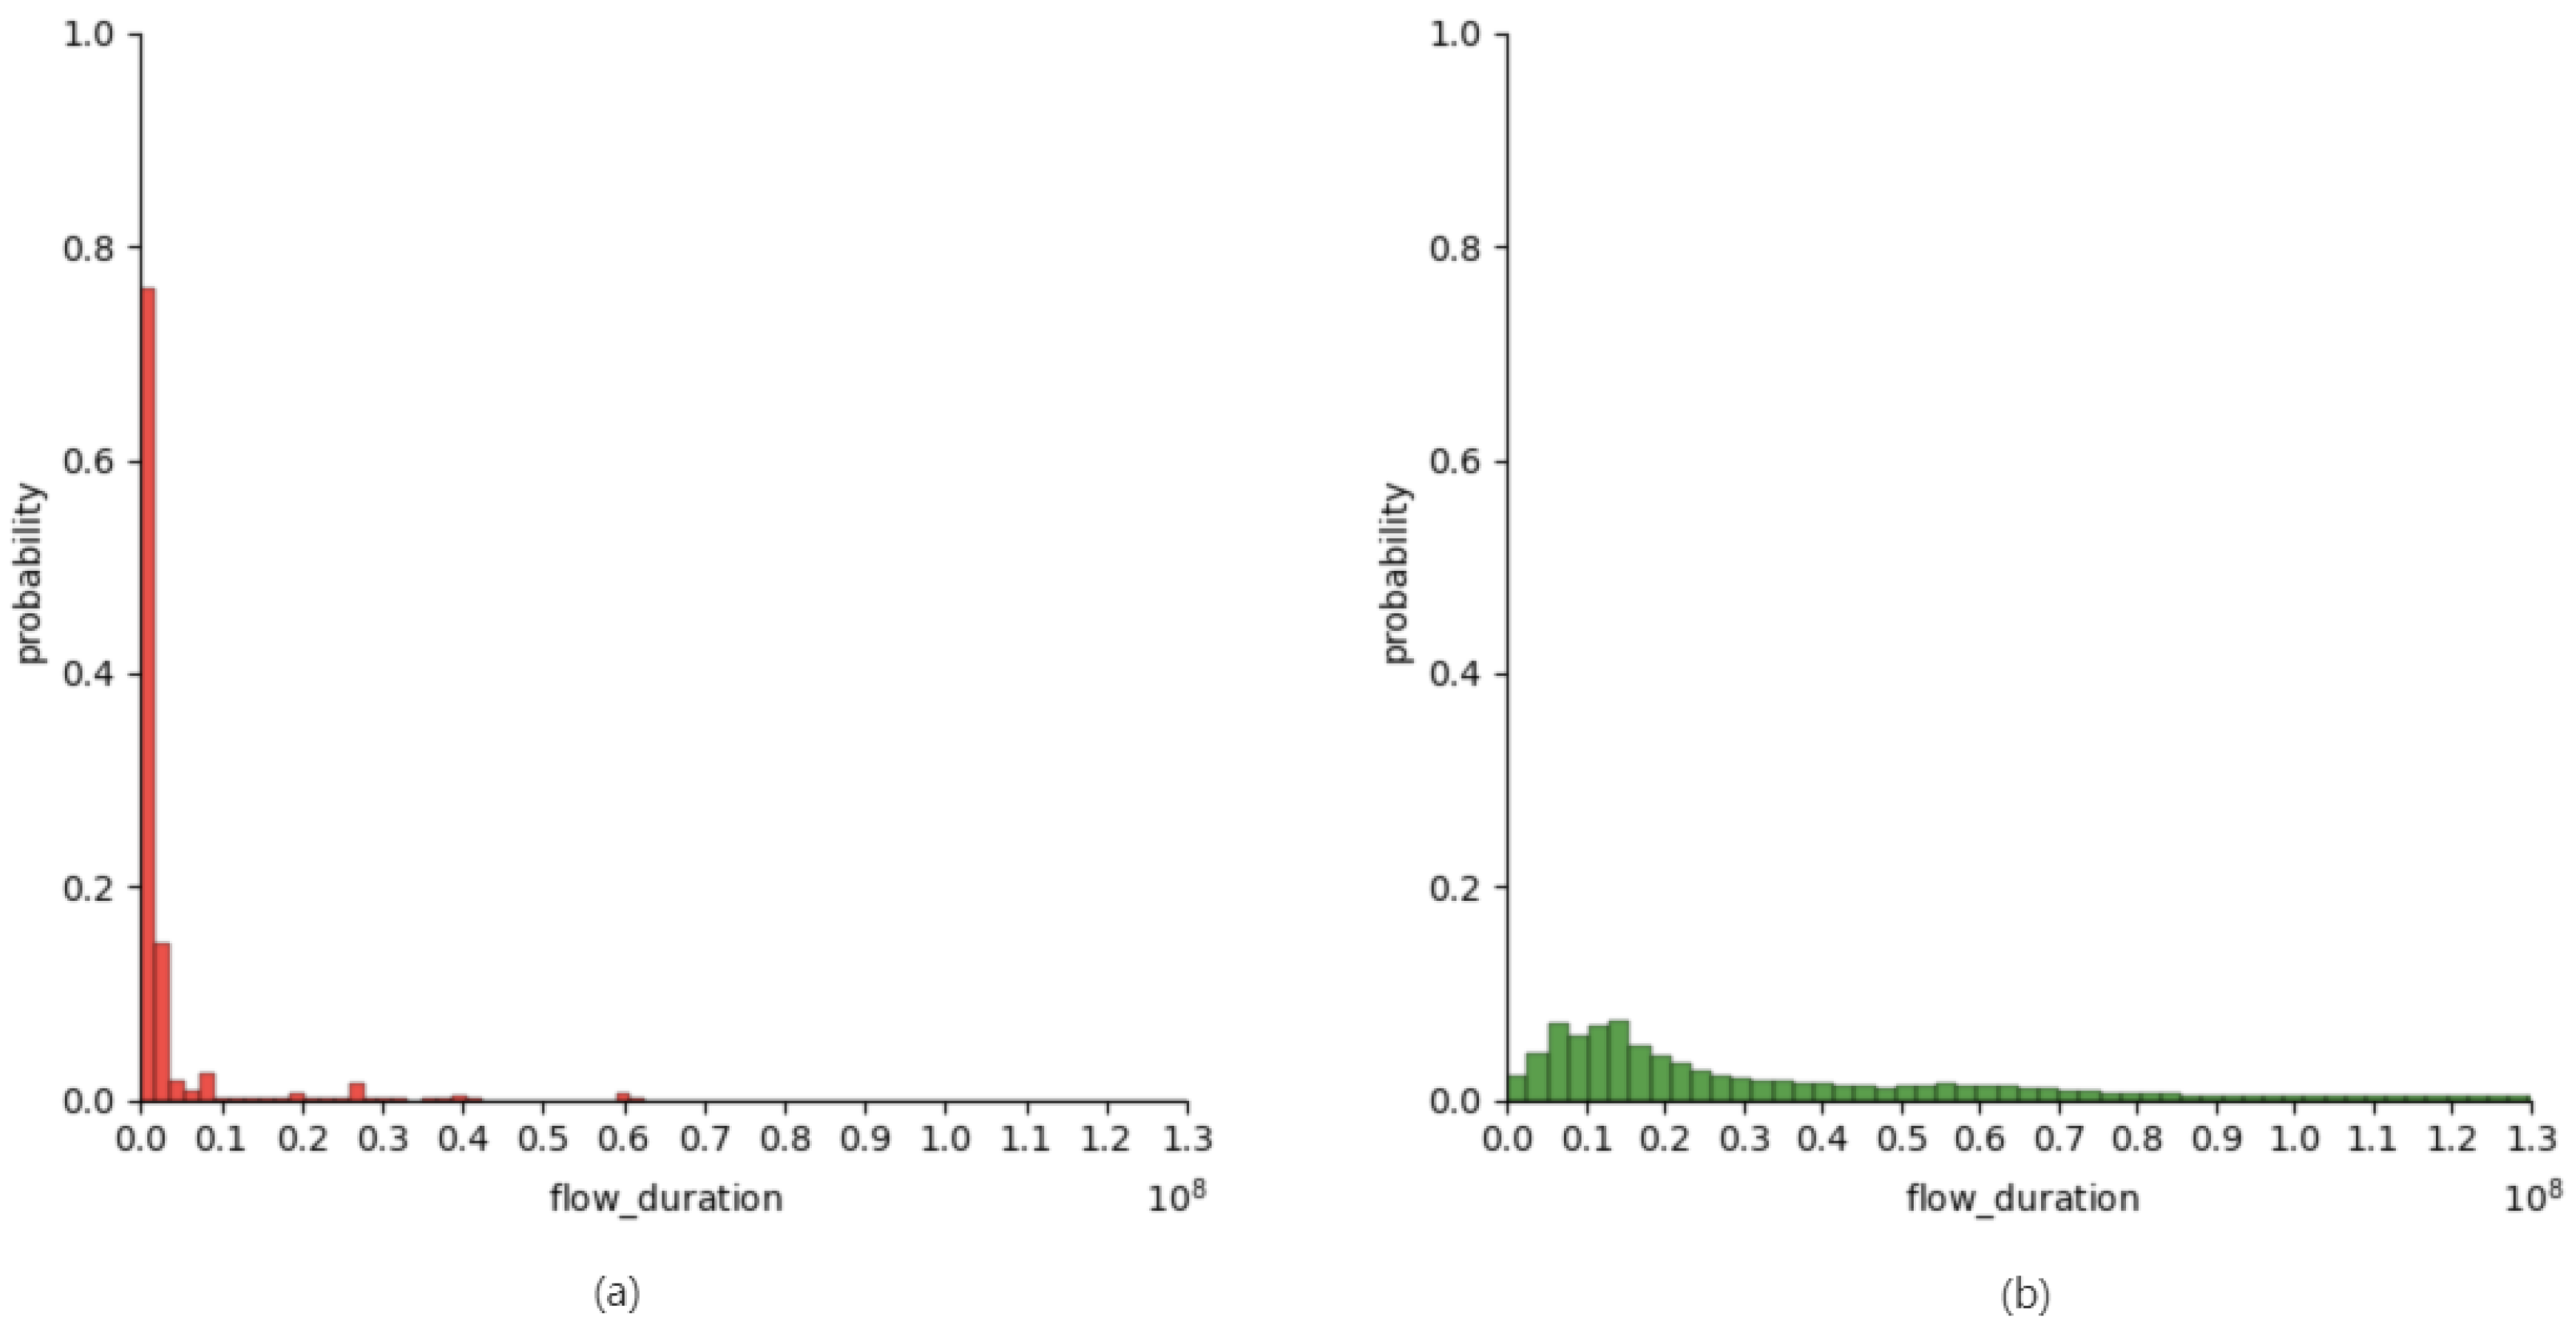
According to Figure 6 and Figure 7, at least half of the flow duration feature detection points of malicious encrypted traffic and normal encrypted traffic are distributed within a 107-microsecond range before refinement processing, making the difference between the two feature distributions small. After refinement processing, the distribution of malicious encrypted traffic is still concentrated at around 107 microseconds, whereas the distribution of normal encrypted traffic is mostly concentrated at above 107 microseconds. Therefore, the gap between the two types of traffic becomes apparent.
To represent an attack or piece of malware, in Algorithm 1, the source IP address and destination IP address of the original feature file are grouped as a tuple. This study only considered traffic that was encrypted with SSL. Therefore, the encrypted flows all use port 443, while ADRSA does not consider ports and protocols. Under these conditions, flows with the same source IP address and destination IP address can be considered to form a session. Considering the flow duration as an example, we denote the duration of malicious encrypted traffic flow as ET, the average duration of malicious encrypted traffic flow as EMEAN, and the duration of processed malicious encrypted traffic flow as ET + EMEAN. In this manner, the overall features of the session can be introduced, while the individual features are preserved. Because the overall features are considered, it is easier to distinguish the encrypted traffic in different packets. Additionally, there may be data within a single session that are significantly different from the overall features of the session, which are called extreme data. These data are likely to be classified incorrectly if only a single network data flow is considered. In the proposed method, these extreme data can also be classified accurately after considering the overall session features.

3.2. Generation of a Malicious Encrypted Traffic Adversarial Sample

Almost any detection point can be simulated; this is why the features of malicious encrypted traffic can be counterfeited by attackers. The features of time statistics and static statistics are independent of each other. Changing the time statistics features does not affect the static statistics feature. For example, changing the flow duration does not affect the size of packets in the forward flow. In addition to features that can be modified directly, there are some features that depend on other features. For example, the flow byte rate is the sum of the total forward flow size and the total reverse flow size, divided by the flow duration. These features are calculated from features that can be modified directly. These features change in the same manner in both the positive and negative samples and are positively (negatively) associated with a trait. It is difficult for malware writers to fake all the features so that all the features resemble normal encrypted traffic. However, if the independent feature is changed to make an independent feature similar to the normal encrypted traffic, the current detection method of malicious encrypted traffic may be greatly affected.
The Pearson product moment correlation coefficient is the most widely used correlation analysis technique established by Pearson. It accurately reflects the degree of linear correlation between the two variables, in the form of a correlation coefficient. Generally speaking, the data used to calculate correlation coefficients, based on product difference correlation, should meet the following conditions.
(1)
Both variables are of continuous data, obtained by measurement.
(2)
The overall distribution of the two variables is a normal distribution, close to a normal distribution, or at least a unimodal symmetric distribution.
(3)
The data must be paired, and the two variables should come from the same population or sample measurement.
(4)
There is a linear relationship between the two samples.
(5)
A large sample size (≥30) is required.
Covariance is the basis of product difference correlation coefficients. Covariance indicates the extent to which two random variables exhibit the same variance. It is defined as the quotient of the product of the deviations of two variables, divided by n. When there is a strict linear relationship between X and Y, the covariance of the data will be maximized. When there is no relationship between X and Y, or their relationship cannot be described by a straight line, the covariance is equal to zero. Covariance itself has no real meaning. The covariance can be calculated as the correlation coefficient, R. S X denotes the standard deviation of the variable X and   S Y denotes the standard deviation of variable Y.
Cov   = i = 1 n X i X ¯ Y i Y ¯ n  
r   = i = 1 n X i X ¯ Y i Y ¯ nS X S Y = Z X Z Y n
The large number theorem means that for a random event, with an increase in testing iterations, the frequency of events tends to reach a stable value. The central limit theorem defines the conditions under which a large number of random variables obey an approximately normal distribution. Hypothesis testing inferences the populations from samples, based on particular assumptions. The confidence level indicates the degree of confidence in the interval estimation.
Figure 8 presents the correlations of certain features. The greater the absolute value, the stronger the correlation. According to the large-number theorem and the central limit theorem of statistics, this group of data has a large number of samples; it approximately follows a normal distribution and meets the relevant conditions for the Pearson correlation test. Additionally, the confidence level is at 90%. Moreover, features with an absolute value of correlation coefficient of less than 0.1 can be considered independent features.
Therefore, Algorithm 2 was designed to generate adversarial samples. In addition to the flow duration, one can also modify other features of malware, such as the total number of packets.
Algorithm 2 Generation of malicious encrypted traffic adversarial sample
INPUT: Configure information (CI), Adversarial modes (MOD)
CI includes IP port certificate, etc.
MOD =0 modify time features, =1 modify static features
OUTPUT: Generate a large number of adversarial samples
//Step 1. Initialize connection parameters.
Establish encrypted connection
//Step 2. Send data
while is not break do
  Read data from the buffer
  If MOD = 0 then
    //Extend time
    The sleep time is calculated according to the normal traffic time and malicious traffic time
    Sleep for a specified period of time
    Send read buffer data
    Close encrypted connection
  else
    //Send redundant packets
    Construct redundant packets
    Send redundant packets
    Send read buffer data
    Close encrypted connections
end if
end while
Algorithm 2 establishes an encrypted connection, reads data from the buffer, and changes the time and static statistics features of encrypted traffic, as required. For example, the interval time between packets in the flow can be changed among the time statistics features, or the algorithm can sleep before sending packets. The total packet size among the static statistics features can be modified to send redundant information before and after sending the data content.
Regarding the detection points for the flow duration, Algorithm 2 is used to extend the flow duration, such that the flow duration of the extended malicious encrypted communication is more similar to that of normal encrypted communication. Most detection methods focus on time series features to identify malicious encrypted traffic, so normal encrypted traffic can be simulated and forged. Therefore, Algorithm 2 can significantly reduce the detection accuracy of traditional methods without changing code semantics and by changing only the session time.
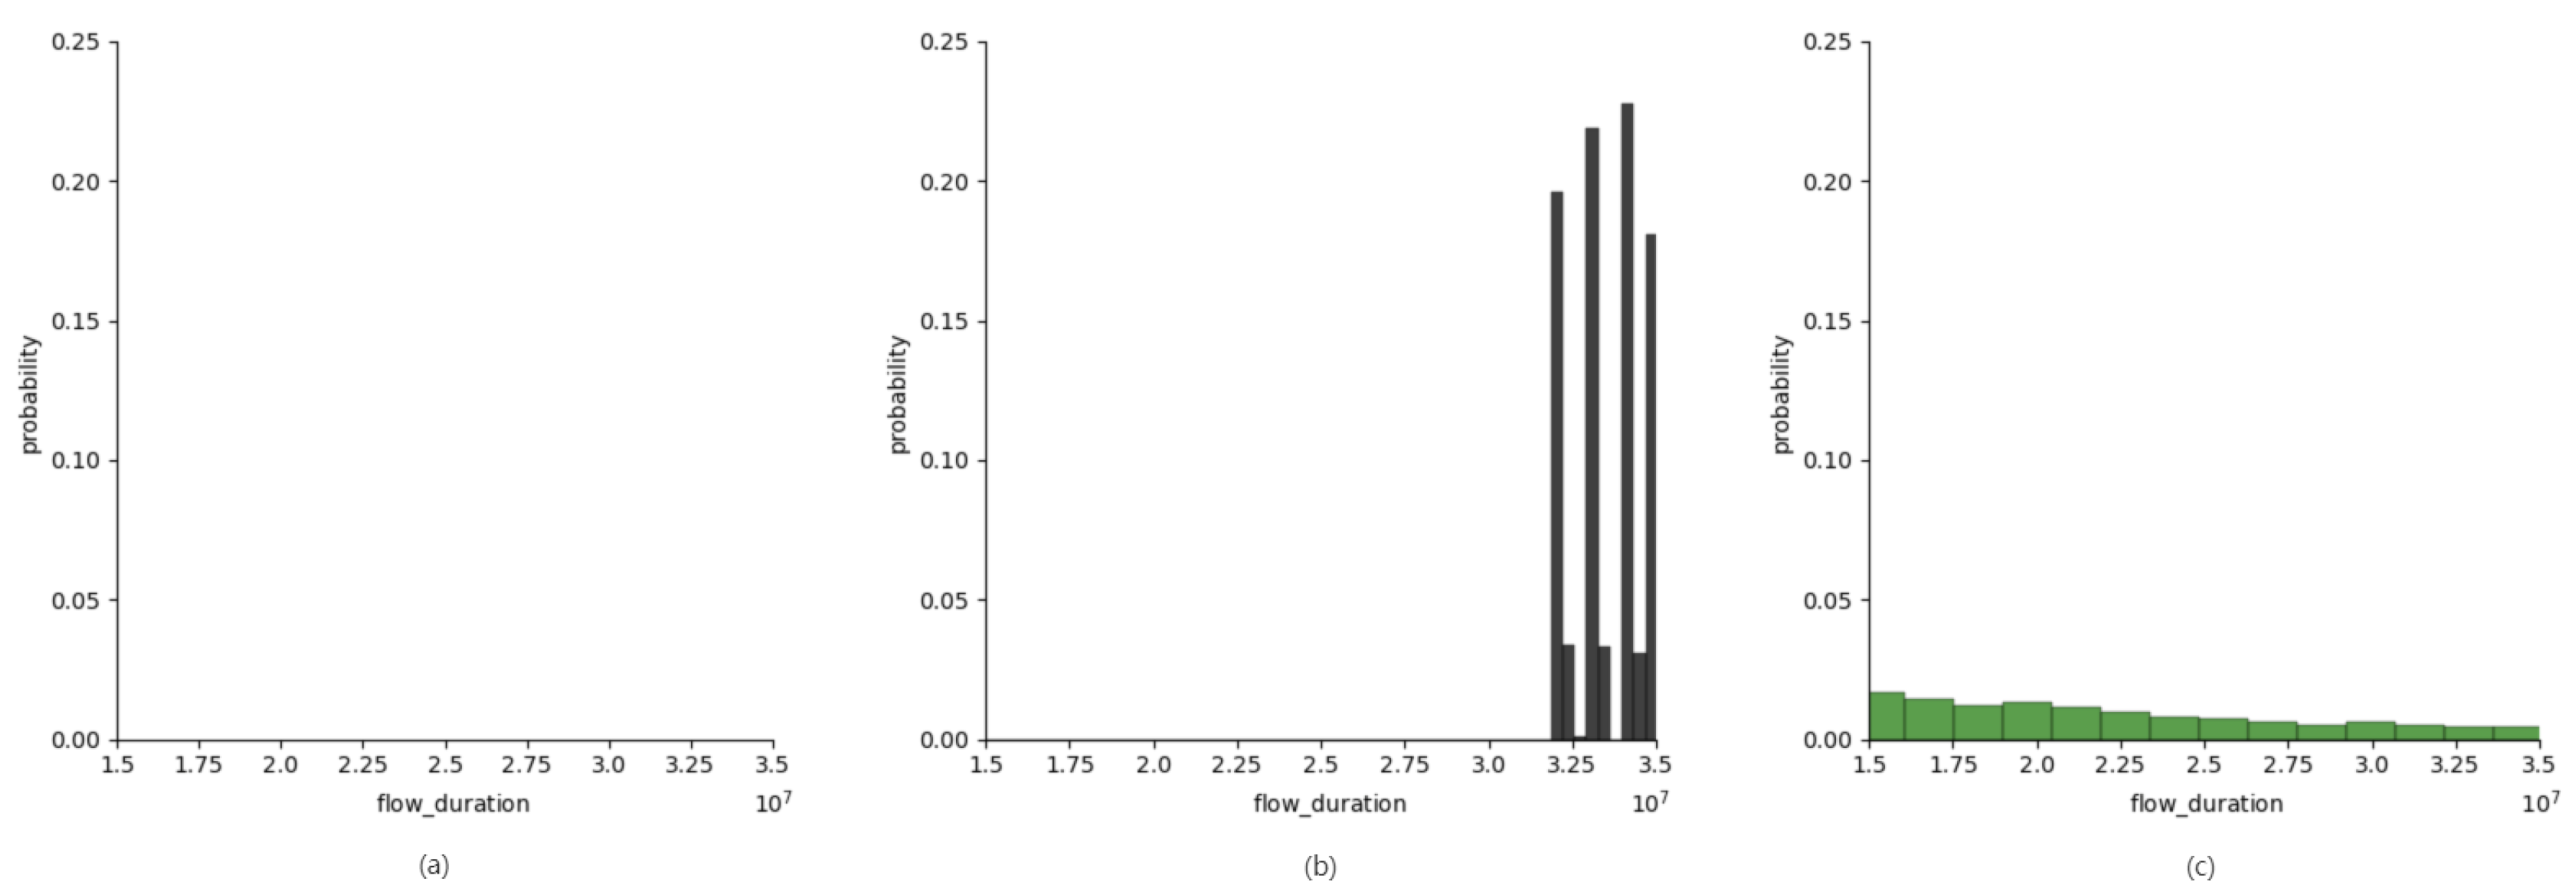
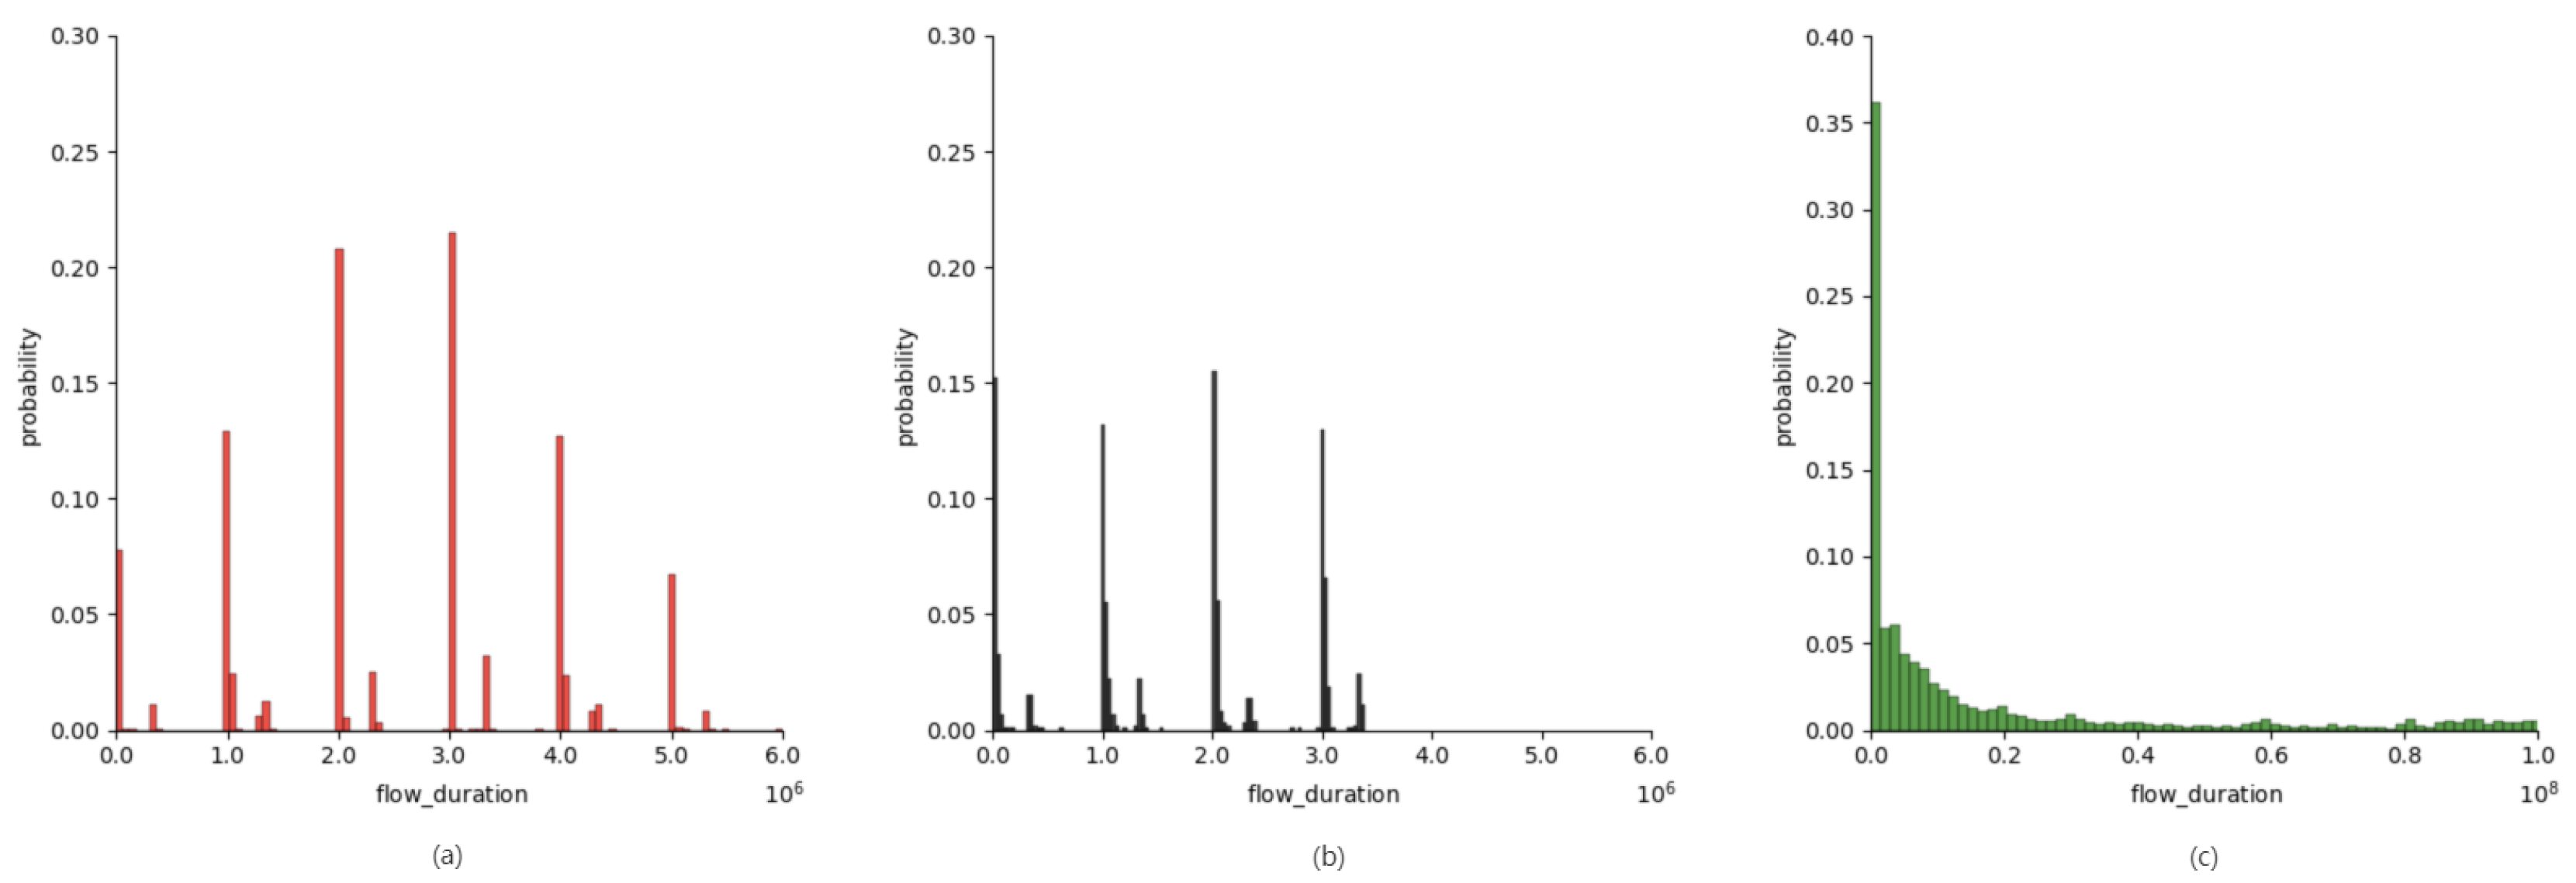
As shown in Figure 9, by comparing the malicious encrypted traffic with an extended flow duration and normal traffic to the original malicious traffic, it can be seen that malicious encrypted traffic with an extended flow duration is more similar to normal traffic, compared to the original malicious traffic.

3.3. Detection of Malicious Encrypted Traffic Adversarial Samples

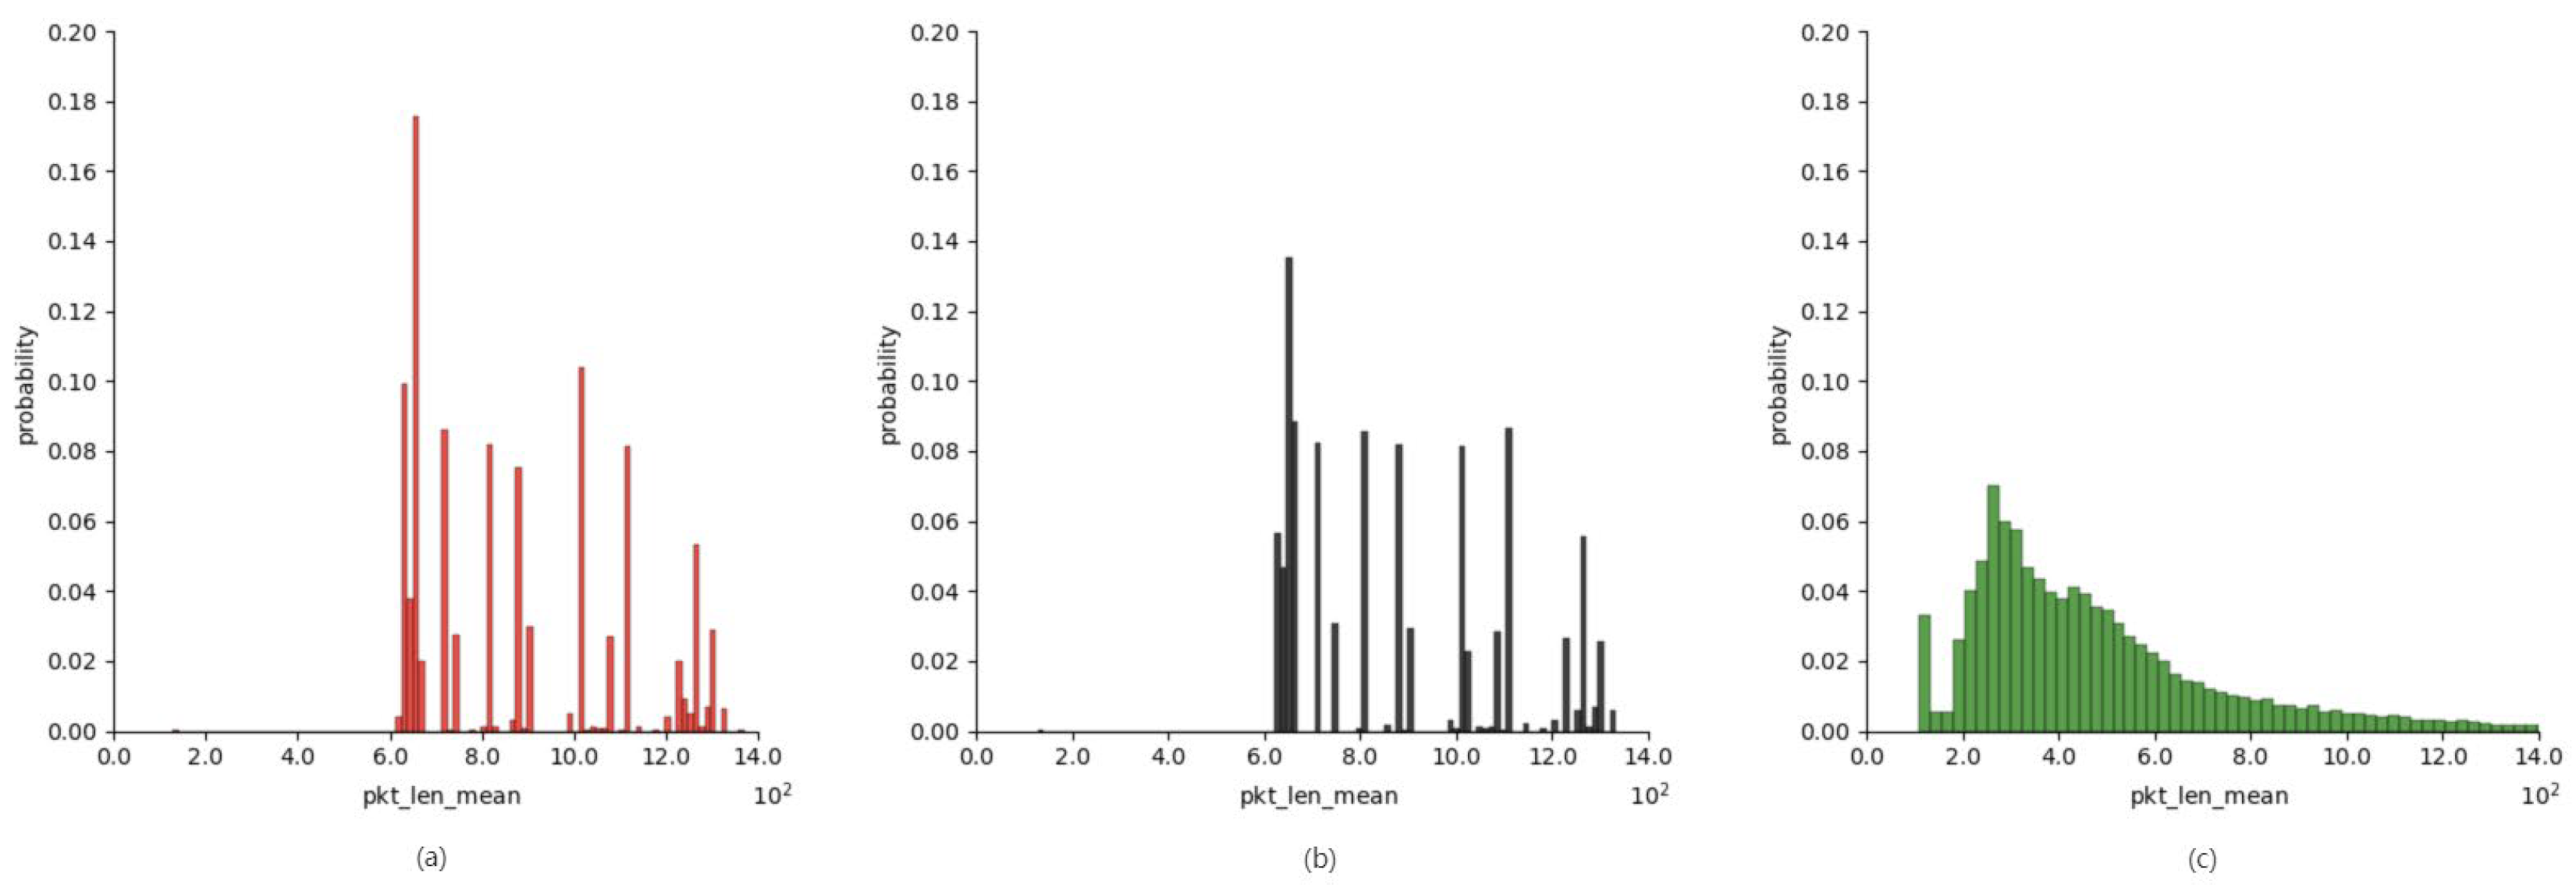
According to the analysis in Section 3.2., malicious encrypted traffic can be correctly identified, whereas adversarial malicious encrypted traffic is difficult to detect. Here, we hypothesize that if we delete the time features among the 76 features and only retain the non-time features, we can distinguish the adversarial samples from the original samples. Therefore, we statistically analyze the other monitoring points of the original malicious encrypted traffic and adversarial malicious encrypted traffic. Figure 10 presents the “pkt_len_mean” (average packet size) feature as an example.
One can see that the other features before and after a time series forgery are largely unaffected. Therefore, we speculate that by removing the forged features, we can accurately identify the adversarial malicious encrypted traffic. This demonstrates that although the current malicious encrypted traffic detection methods can be countered, if only the time features are changed, the other features of the software can still be used for detection. These features include specific functions of the software, the size of the data packets sent, and the number of data packets. If we remove the time features and retain the non-time features using our refined detection method based on session analysis, according to the other features of malicious encrypted traffic, it is still possible to detect malicious encrypted traffic accurately.
Malicious encrypted traffic, based on time series feature forgery, will automatically implement time series feature forgery by writing the waiting times into the corresponding code. Therefore, there is a strong regularity across a large number of flows. In contrast, normal encrypted traffic is generated from human operations, so its time series features will not exhibit the general regularity seen with automation. This feature can also be used to detect time series forgery in malicious encrypted traffic, as shown in Algorithm 3.
Algorithm 3 Detection of malicious encrypted traffic adversarial samples
INPUT: A feature file F containing statistical features obtained from traffic files
OUTPUT: The restored feature file O
Prepare a queue Q to store each group
//Step 1. Gets groups with IP as the key to Q
Group feature file F by IP
Put each group into queue Q
//Step 2. Each group is processed
while Q is not empty do
  Take Q out of the queue and assign it to Qi
  Purify flow by removing extraneous features (IP address, port, protocol, timestamp)
  Get the minimum flow duration MIN for each group, MIN = EMIN + S. EX is the duration of X. X is malicious encrypted traffic without forgery; S is the extended time to forgery.
  //Step 3. Restore the forged features
  //The minimum flow duration of each flow is calculated, and the minimum value is subtracted from each flow. Other features are calculated according to the flow duration
  while Qi is not empty do
    //Processing of each data group
    Take Qi out of the queue and assign it to T, T = ET + S
    if T is flow duration then
      //After restoration
      T = T—MIN = (ET + S) − (EMIN + S), The effect of extended time S is eliminated.
    else
      Additional features are calculated based on flow duration
    end if
  end while
  //Step 4. Save as a new feature file O
  Write the result to file O
end while
Algorithm 3 receives a feature file and then groups the feature content in the feature file, according to source IP and destination IP, before traversing each feature group. First, it deletes those features that are not related to classification, such as the IP and port, and then calculates the intra-group minimum for other features. The intra-group minimum is subtracted for each item to obtain a restored feature file.
Because malicious encrypted traffic deliberately extends the duration of a flow, it will write the waiting time into the malicious code. If we restore the original time features of malicious encrypted traffic, we can also distinguish the adversarial malicious encrypted traffic. For the sake of illustration, we can consider the flow duration as an example. The features of flow_byts_s, flow_pkts_s, fwd_pkts_s, and bwd_pkts_s can be calculated from the flow duration. In Algorithm 3, we group flows with the same source IP and destination IP. Then, we subtract the minimum duration of each flow from the packet so that the adversarial malicious encrypted traffic can be restored because the adversarial malicious encrypted traffic has regularity, whereas the normal encrypted traffic does not exhibit this feature. For each flow, we then calculate the relevant features, based on the flow duration, and modify the feature file. In this manner, the encrypted traffic can be restored. Let the duration of an initial malicious encrypted traffic flow be ET and the sleep time be S. The duration of the adversarial malicious encrypted traffic is ET + S. Let the duration of a normal encrypted traffic flow be ZT. ZT can then be compared to ET + S. Similarly, the minimum duration of a malicious encrypted traffic flow is EMIN with a sleep time of S. The duration of an adversarial traffic flow is EMIN + S. The minimum duration of a normal encrypted traffic flow is ZMIN. After restoration, the duration of the malicious encrypted traffic flow is (ET + S) − (EMIN + S) = ET − EMIN. The normal encrypted traffic duration is ZT − ZMIN. This method eliminates the interference of sleep time, such that even adversarial samples can be identified. Additionally, it does not affect the detection of ordinary samples. Figure 11 presents example results for this type of analysis.

4. Experimental Results and Analysis

The implementation of each component is described in detail. The experimental model was executed in an X64 computing environment with an AMD Ryzen 7 5800H CPU, 16 GB of RAM, and an RTX 3070 GPU. The experiments were divided into three stages: the detection of malicious encrypted traffic, the validity of adversarial sample generation, and the detection of malicious encrypted traffic adversarial samples. The experimental measurements were primarily carried out in four datasets, which are explained as follows.
Dataset 1 is the public encrypted dataset. The NORMAL encrypted traffic dataset and the MALWARE encrypted traffic dataset were downloaded from the Czech University of Technology (CTU) database. The data volume is 100,000 in total, and for matching the following experimental data, 40,000 pieces of data were randomly selected.
Dataset 2 is the encrypted data that we collected. The dataset included both the NORMAL dataset and the MALWARE datasets. To obtain representative data, we included many types of traffic for both normal encrypted traffic (e.g., web browsing, file transfer, video streaming, and background traffic) and malicious encrypted traffic (e.g., ransomware and Trojan horses). The data volume is 40,000 units in total.
Dataset 3 is the detectability verification of the malicious encrypted traffic that we generated. The NORMAL encrypted traffic dataset was downloaded from the CTU. The malicious encryption traffic dataset was created by our malicious encryption software. The data volume is 10,000 units in total.
Dataset 4 is the effectiveness verification of adversarial malicious encrypted traffic. The NORMAL encrypted traffic dataset was downloaded from the CTU. The malicious encryption traffic dataset was from our malicious encryption software, which has been processed by Algorithm 2. The data volume is 10,000 units in total.
In Section 4.1, in the detection of the malicious encrypted traffic stage, Dataset 1 and Dataset 2 were used. The proposed method was used to process the traffic data. Before performing the detection on the data, Algorithm 3 and Algorithm 1 were used to preprocess the data. After preprocessing the data, the data were inputted into the deep learning model for training. In Section 4.2, in the validity of the adversarial sample generation stage, Dataset 3 and Dataset 4 were used to verify the effectiveness of the adversarial encrypted traffic that was generated. In Section 4.3, in the stage of detection of malicious encrypted traffic adversarial samples, Dataset 4 was used to verify the effectiveness of the ADRSA algorithm in detecting adversarial malicious encrypted traffic.
Our experimental process is illustrated in Figure 12.
In the preprocessing procedure, as shown in Figure 13, the first step purifies the PCAP files to remove unencrypted traffic. The next step uses the CICFLOWMETER software, written by Draper-Gil et al. [13], to extract 82 relevant features using the PCPANG package and then generate CSV files. The traffic refiner removes the duplicate files and empty files because they affect our training results. Finally, Algorithm 3 and Algorithm 1 were used to process the obtained feature data, and 76 features were obtained.
In a 1D-CNN, as shown in Figure 14, 76 features are input, with a structure of 1*1*76, which first goes through the first convolution layer and maximum pooling layer, then goes through the second convolution layer and average pooling layer, and finally, is output with a structure of 1*50 through the fully connected layer.

4.1. Detection of Malicious Encrypted Traffic

Using the proposed model, malicious encrypted traffic and normal encrypted traffic in the different parts of a particular dataset were tested. During this test, we retained the amount of malicious encrypted traffic equal to the amount of normal encrypted traffic. The results of comparing the proposed model to CICFLOWMETER [13] and DOHLYZER [26] are presented below. The training sets from top to bottom in dataset 1 and dataset 2 are 6000, 12,000, and 24,000, respectively. The validation sets from top to bottom in dataset 1 and dataset 2 are 2000, 4000, and 8000, respectively. The test sets from top to bottom in dataset 1 and dataset 2 are 2000, 4000, and 8000, respectively. Additionally, the samples of the training set, verification set, and test set are different. It should be noted that the accuracy varies with the different training and testing sets, and the data in the following tables only indicate whether a model has high accuracy for traffic dichotomization.
In the following experiments, we used four basic concepts: True Positive (TP), False Positive (FP), True Negative (TN), and False Negative (FN). Precision = TP/(TP + FP), and Accuracy = (TP + TN)/(TP + TN + FP + FN). Recall = TP/(TP + FN), and F1-score = (2 * Precision * Recall)/(Precision + Recall).
The test results based on 1D-CNN are presented in Table 2 and Table 3.
The test results based on 2D-CNN are presented in Table 4 and Table 5. According to the results, there is little difference between the detection effects of 1D-CNN and 2D-CNN.
In terms of experimental results, it can be seen that ADRSA is slightly better than the other two methods in detecting malicious encrypted traffic. One reason is that our method fully considers the statistical features of a single flow of encrypted traffic. The features of normal encrypted traffic are different from those of malicious encrypted traffic. The features of a single flow are helpful to distinguish normal encrypted traffic from malicious encrypted traffic. Another reason is that ADRSA adopts a holistic approach, considering not only the features of each flow but also the features of the entire session. Different sessions and software have different overall features, and some similar flows may be significantly different if the overall features of their sessions are considered at the same time. Considering the features of a single stream and the overall features of its session is helpful to classify malicious encrypted traffic.

4.2. Adversarial Malicious Encrypted Traffic Generation

A malicious encryption software application using the SSL protocol has been written. First, it collects traffic for the malicious encryption software, which is used to verify that the traffic of the malicious encryption software is detectable. The results are presented in Table 6 and Table 7. In dataset 3, the training set is 6000. The validation set is 2000, and the test set is 2000.
Table 6 and Table 7 confirm that the malicious encryption software we wrote can be detected by the current malicious encryption traffic detection method. Next, we use Algorithm 2 to rewrite the malicious encryption software, so that the malicious encryption software can remain dormant for a period of time after each request without changing its function. This makes the time features of the malicious encryption traffic generated by the rewritten malicious encryption software similar to those of the normal encryption traffic; we can then collect the malicious encryption traffic generated by the rewritten malicious encryption software. During the collection process, the operation and command of the malicious encryption software are consistent. Then, the collected data are put directly into the model trained before rewriting without training for testing. The results are listed in Table 8 and Table 9.
One can see that the time series-forged malicious encrypted traffic significantly reduces the detection accuracy. This proves that existing methods based on the features of time series can distinguish between normal encrypted traffic and malicious encrypted traffic. However, if malicious encryption software performs deliberate forgery, the detection accuracy will be significantly reduced.

4.3. Detection of Adversarial Malicious Encrypted Traffic

ADRSA is used to test the same adversarial malicious encrypted traffic method (Dataset 4) compared with the two other methods, and the results are presented in Table 10 and Table 11.
As shown in the table, the detection results are relatively promising. One reason for the high accuracy of the proposed method ADRSA may be that, unlike other approaches, first, it restores the adversarial malicious encrypted traffic to reduce the influence of the adversarial algorithm on the detection effect. Second, it considers each flow separately and considers all traffic in terms of sessions. Third, during an attack, there are some extreme cases in which the values of particular features are too far from the average values, which are not effective for analysis. These values are called deviations. Deviations from the average values typically result in measurement errors. Because the proposed method uses a method where the features of a single flow are considered at the same time as the features of all traffic in a session, even extreme cases can be accurately classified.
Discussion: When there are flows showing small differences between the flows in different sessions, ADRSA not only considers the features of a single flow but also the overall features of the flow, which can better distinguish similar flows. However, when the number of data flows in each session is small, the overall features of ADRSA are not very obvious, resulting in a lower accuracy rate, compared with a situation where there is a large number of flows in the session. During the restore process, you can adjust the parameters by controlling the percentage by which the minimum value in the session is subtracted. When the percentage is zero, the restore operation is not performed. At the same time, ADRSA introduces multi-step processing, which increases the system overheads.

5. Conclusions

It is very effective to detect malicious encrypted traffic by using the high-order traffic features of malicious encrypted traffic and normal encrypted traffic. Based on the comprehensive analysis of an interpretability analysis of the high-order traffic features of malicious encrypted traffic and the generation of adversarial malicious encrypted traffic samples, this paper proposes the ADRSA method to improve the accuracy of adversarial malicious encrypted traffic detection. Because ADRSA considers the features of the whole flow, the extracted statistical features can better represent the corresponding flow. This ensures that malicious encrypted traffic can be accurately detected. Moreover, the restoration method is used to detect forged malicious encryption traffic, based on statistical features. The experimental results show that although malicious encrypted traffic features can be forged, they can still be accurately detected by implementing appropriate countermeasures. Our study also has limitations. Adding multi-step processing slows down the system speed and increases the overhead. Moreover, using ADRSA requires collecting a large sample of traffic. If there is no large sample of data for statistical analysis, the results may be biased. Additionally, ADRSA extracts the statistical features and performs fine processing in an offline state. Real-time processing requires further fine-grained design. In the future, real-time detection can be performed while optimizing the speed of processing.

Author Contributions

Conceptualization, Z.W.; methodology, Z.W.; software, M.L.; validation, M.L., Z.W. and K.C.; formal analysis, W.W.; investigation, W.W.; data curation, M.L., Z.W.; writing—original draft preparation, M.L., Z.W.; writing—review and editing, Z.W. and W.W.; visualization, M.L. and K.C.; supervision, K.C. and W.W. All authors have read and agreed to the published version of the manuscript.

Funding

This research was funded by National Key Research and Development Program of China (No. 2018YFB0804102).

Data Availability Statement

Due to the nature of this research, participants of this study did not agree for their data to be shared publicly, so supporting data is not available.

Acknowledgments

This study is supported by the National Key Research and Development Program of China (No. 2018YFB0804102), Open Research Project of the State Key Laboratory of Industrial Control Technology, Zhejiang University, China (No. ICT2022B41), Key Projects of NSFC Joint Fund of China (No. U1866209), National Natural Science Foundation of China (No. 61772162).

Conflicts of Interest

The authors declare no conflict of interest.

References

  1. Taylor, V.F.; Spolaor, R.; Conti, M.; Martinovic, I. Robust smartphone app identification via encrypted network traffic analysis. IEEE Trans. Inf. Forensics Secur. 2017, 13, 63–78. [Google Scholar] [CrossRef] [Green Version]
  2. Kundu, P.P.; Truong-Huu, T.; Chen, L.; Zhou, L.; Teo, S.G. Detection and classification of botnet traffic using deep learning with model explanation. IEEE Trans. Dependable Secur. Comput. 2022, 19, 1–15. [Google Scholar] [CrossRef]
  3. Rezaei, S.; Liu, X. Deep learning for encrypted traffic classification: An overview. IEEE Commun. Mag. 2019, 57, 76–81. [Google Scholar] [CrossRef] [Green Version]
  4. ElSayed, M.S.; Le-Khac, N.A.; Albahar, M.A.; Jurcut, A. A novel hybrid model for intrusion detection systems in SDNs based on CNN and a new regularization technique. J. Netw. Comput. Appl. 2021, 191, 103160. [Google Scholar] [CrossRef]
  5. Saharkhizan, M.; Azmoodeh, A.; Dehghantanha, A.; Choo, K.K.R.; Parizi, R.M. An ensemble of deep recurrent neural networks for detecting IoT cyber attacks using network traffic. IEEE Internet Things J. 2020, 7, 8852–8859. [Google Scholar] [CrossRef]
  6. Liu, J.; Xiao, Q.; Jiang, Z.; Yao, Y.; Wang, Q. Effectiveness Evaluation of Evasion Attack on Encrypted Malicious Traffic Detection. In Proceedings of the 2022 IEEE Wireless Communications and Networking Conference (WCNC), Austin, TX, USA, 10–13 April 2022; IEEE: Piscataway, NJ, USA; pp. 1158–1163. [Google Scholar]
  7. Pierazzi, F.; Pendlebury, F.; Cortellazzi, J.; Cavallaro, L. Intriguing properties of adversarial ml attacks in the problem space. In Proceedings of the 2020 IEEE Symposium on Security and Privacy (S&P), San Francisco, CA, USA, 17–21 May 2020; IEEE: Piscataway, NJ, USA; pp. 1332–1349. [Google Scholar]
  8. Sharon, Y.; Berend, D.; Liu, Y.; Shabtai, A.; Elovici, Y. Tantra: Timing-based adversarial network traffic reshaping attack. IEEE Trans. Inf. Forensics Secur. 2022, 17, 3225–3237. [Google Scholar] [CrossRef]
  9. Usama, M.; Qayyum, A.; Qadir, J.; Al-Fuqaha, A. Black-box Adversarial Machine Learning Attack on Network Traffic Classification. In Proceedings of the 2019 15th International Wireless Communications and Mobile Computing Conference (IWCMC), Tangier, Morocco, 24–28 June 2019. [Google Scholar]
  10. Yao, H.; Liu, C.; Zhang, P.; Wu, S.; Jiang, C.; Yu, S. Identification of encrypted traffic through attention mechanism based long short term memory. IEEE Trans. Big Data 2019, 8, 241–252. [Google Scholar] [CrossRef]
  11. Rezaei, S.; Kroencke, B.; Liu, X. Large-scale mobile app identification using deep learning. IEEE Access 2019, 8, 348–362. [Google Scholar] [CrossRef]
  12. Lotfollahi, M.; Jafari Siavoshani, M.; Shirali Hossein Zade, R.; Saberian, M. Deep packet: A novel approach for encrypted traffic classification using deep learning. Soft Comput. 2020, 24, 1999–2012. [Google Scholar] [CrossRef] [Green Version]
  13. Draper-Gil, G.; Lashkari, A.H.; Mamun, M.S.I.; Ghorbani, A.A. Characterization of encrypted and vpn traffic using time-related. In Proceedings of the 2nd International Conference on Information Systems Security and Privacy (ICISSP), Rome, Italy, 19–21 February 2016; pp. 407–414. [Google Scholar]
  14. Hodo, E.; Bellekens, X.; Iorkyase, E.; Hamilton, A.; Tachtatzis, C.; Atkinson, R. Machine learning approach for detection of nontor traffic. In Proceedings of the 12th International Conference on Availability, Reliability and Security, Reggio Calabria, Italy, 29 August–1 September 2017; pp. 1–6. [Google Scholar]
  15. Shen, M.; Liu, Y.; Zhu, L.; Du, X.; Hu, J. Fine-grained webpage fingerprinting using only packet length information of encrypted traffic. IEEE Trans. Inf. Forensics Secur. 2020, 16, 2046–2059. [Google Scholar] [CrossRef]
  16. Wu, Z.; Kang, J.; Jiang, Q. Semantic key generation based on natural language. Int. J. Intell. Syst. 2022, 37, 4041–4064. [Google Scholar] [CrossRef]
  17. Wu, Z.; Lv, Z.; Kang, J.; Ding, W.; Zhang, J. Fingerprint bio-key generation based on a deep neural network. Int. J. Intell. Syst. 2022, 37, 4329–4358. [Google Scholar] [CrossRef]
  18. Zeng, Y.; Gu, H.; Wei, W.; Guo, Y. Deep-full-range: A deep learning based network encrypted traffic classification and intrusion detection framework. IEEE Access 2019, 7, 45182–45190. [Google Scholar] [CrossRef]
  19. Yang, J.; Liang, G.; Li, B.; Wen, G.; Gao, T. A deep-learning-and reinforcement-learning-based system for encrypted network malicious traffic detection. Electron. Lett. 2021, 57, 363–365. [Google Scholar] [CrossRef]
  20. Chen, J.; Huang, J.; Lu, X. Convolutional neural network-based identification of malicious traffic for TLS encryption. In Proceedings of the 2022 7th International Conference on Intelligent Computing and Signal Processing (ICSP), Bucharest, Romania, 29–30 September 2022; IEEE: Piscataway, NJ, USA; pp. 1544–1549. [Google Scholar]
  21. Cuzzocrea, A.; Martinelli, F.; Mercaldo, F.; Vercelli, G. Tor traffic analysis and detection via machine learning techniques. In Proceedings of the 2017 IEEE International Conference on Big Data (Big Data), Boston, MA, USA, 11–14 December 2017; IEEE: Piscataway, NJ, USA; pp. 4474–4480. [Google Scholar]
  22. Niu, W.; Zhuo, Z.; Zhang, X.; Du, X.; Yang, G.; Guizani, M. A heuristic statistical testing based approach for encrypted network traffic identification. IEEE Trans. Veh. Technol. 2019, 68, 3843–3853. [Google Scholar] [CrossRef]
  23. Wang, S.; Chen, Z.; Yan, Q.; Yang, B.; Peng, L.; Jia, Z. A mobile malware detection method using behavior features in network traffic. J. Netw. Comput. Appl. 2019, 133, 15–25. [Google Scholar] [CrossRef]
  24. Rabbani, M.; Wang, Y.L.; Khoshkangini, R.; Jelodar, H.; Zhao, R.; Hu, P. A hybrid machine learning approach for malicious behaviour detection and recognition in cloud computing. J. Netw. Comput. Appl. 2020, 151, 102507. [Google Scholar] [CrossRef]
  25. Ullah, I.; Mahmoud, Q.H. A two-level flow-based anomalous activity detection system for IoT networks. Electronics 2020, 9, 530. [Google Scholar] [CrossRef] [Green Version]
  26. MontazeriShatoori, M.; Davidson, L.; Kaur, G.; Lashkari, A.H. Detection of doh tunnels using time-series classification of encrypted traffic. In Proceedings of the 2020 IEEE International Conference on Dependable, Autonomic and Secure Computing, International Conference on Pervasive Intelligence and Computing, International Conference on Cloud and Big Data Computing, International Conference on Cyber Science and Technology Congress (DASC/PiCom/CBDCom/CyberSciTech), Calgary, AB, Canada, 17–22 August 2020; IEEE: Piscataway, NJ, USA; pp. 63–70. [Google Scholar]
  27. Ma, C.; Du, X.; Cao, L. Improved KNN Algorithm for Fine-Grained Classification of Encrypted Network Flow. Electronics 2020, 9, 324. [Google Scholar] [CrossRef] [Green Version]
  28. Samy, A.; Yu, H.; Zhang, H. Fog-based attack detection framework for internet of things using deep learning. IEEE Access 2020, 8, 74571–74585. [Google Scholar] [CrossRef]
  29. Zheng, R.; Liu, J.; Niu, W.; Liu, L.; Li, K.; Liao, S. Preprocessing Method for Encrypted Traffic Based on Semisupervised Clustering. Secur. Commun. Netw. 2020, 2020, 8824659. [Google Scholar] [CrossRef]
  30. Zebin, T.; Rezvy, S.; Luo, Y. An explainable AI-based intrusion detection system for DNS over HTTPS (DoH) Attacks. IEEE Trans. Inf. Forensics Secur. 2022. [Google Scholar] [CrossRef]
  31. Hajimaghsoodi, M.; Jalili, R. RAD: A Statistical Mechanism Based on Behavioral Analysis for DDoS Attack Countermeasure. IEEE Trans. Inf. Forensics Secur. 2022, 17, 2732–2745. [Google Scholar] [CrossRef]
  32. Maarouf, R.; Sattar, D.; Matrawy, A. Evaluating resilience of encrypted traffic classification against adversarial evasion attacks. In Proceedings of the 2021 IEEE Symposium on Computers and Communications (ISCC), Athens, Greece, 5–8 September 2021; IEEE: Piscataway, NJ, USA, 2021; pp. 1–6. [Google Scholar]
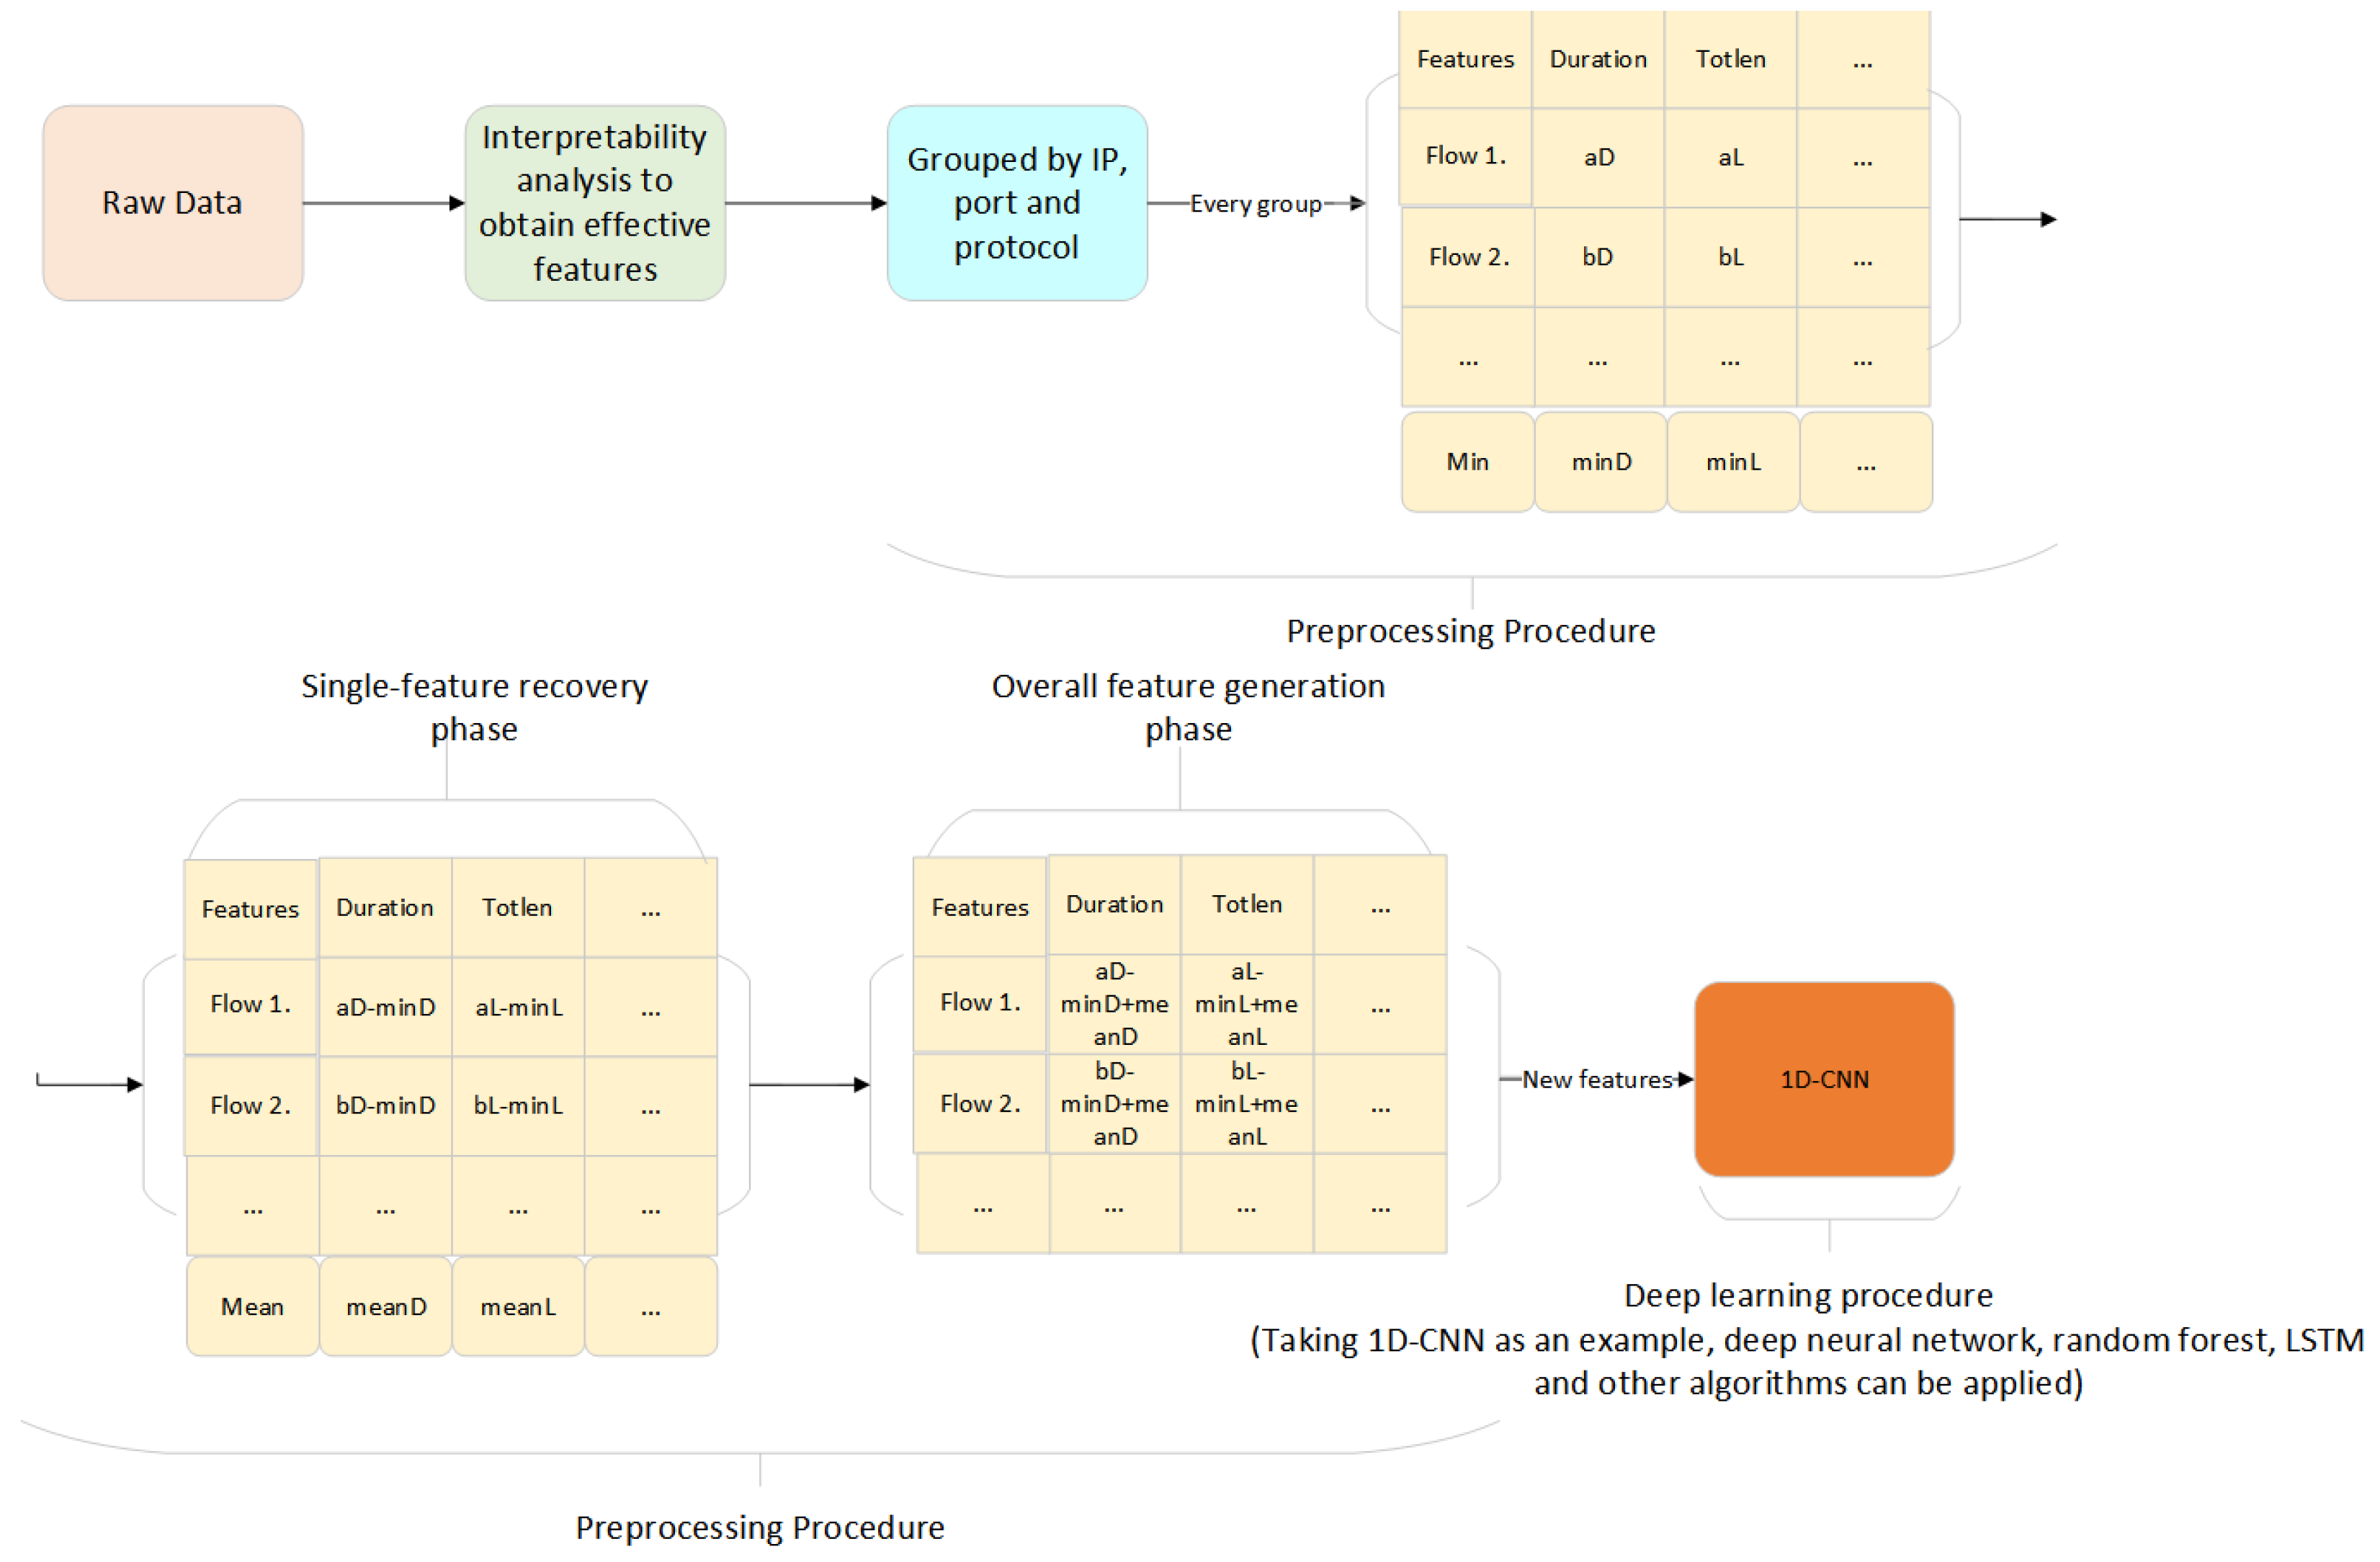
Figure 1. The adversarial malicious encrypted traffic detection method based on refined session analysis (ADRSA) algorithm.
Symmetry 14 02329 g001
Figure 2. Gradient algorithm weight analysis of 76 features (6000 normal traffic samples and 6000 malicious traffic samples).
Symmetry 14 02329 g002
Figure 3. The CAM algorithm weight analysis of 76 features (6000 normal traffic samples and 6000 malicious traffic).
Symmetry 14 02329 g003
Figure 4. (a) Malicious encrypted traffic. (b) Normal encrypted traffic. (The vertical axis represents the frequency of the feature value, while the horizontal axis represents the value of the feature in microseconds.).
Symmetry 14 02329 g004
Figure 5. (a) Malicious encrypted traffic. (b) Normal encrypted traffic. (The vertical axis represents the frequency of the feature value, while the horizontal axis represents the value of the feature in microseconds.).
Symmetry 14 02329 g005
Figure 6. (a) Malicious encrypted traffic before refinement processing. (b) Normal encrypted traffic before refinement processing. (The vertical axis represents the frequency of the feature value, while the horizontal axis represents the value of the feature in microseconds.).
Symmetry 14 02329 g006
Figure 7. (a) Refined processed malicious encrypted traffic. (b) Refined processed normal encrypted traffic. (The vertical axis represents the frequency of the feature value, while the horizontal axis represents the value of the feature in microseconds.).
Symmetry 14 02329 g007
Figure 8. Feature correlation.
Symmetry 14 02329 g008
Figure 9. (a) Malicious encrypted traffic. (b) Forged malicious encrypted traffic. (c) Normal encrypted traffic. (The vertical axis represents the frequency of the feature value, while the horizontal axis represents the value of the feature in microseconds.).
Symmetry 14 02329 g009
Figure 10. (a) Malicious encrypted traffic. (b) Forged malicious encrypted traffic. (c) Normal encrypted traffic. (The vertical axis represents the frequency of the feature value, while the horizontal axis represents the value of the feature in microseconds.).
Symmetry 14 02329 g010
Figure 11. (a) Malicious encrypted traffic. (b) Malicious encrypted traffic after restoration. (c) Normal encrypted traffic. (The vertical axis represents the frequency of the feature value, while the horizontal axis represents the value of the feature in microseconds.).
Symmetry 14 02329 g011
Figure 12. Experimental flow.
Symmetry 14 02329 g012
Figure 13. Preprocessing procedure.
Symmetry 14 02329 g013
Figure 14. A 1D-CNN model is used to process the traffic, based on 76 features.
Symmetry 14 02329 g014
Table 1. Important features for adversarial malicious encryption traffic detection.
flow_durationDuration of the entire flow
flow_iatThe arrival time interval between two datagrams in a flow
fwd_iatThe arrival time interval between two datagrams in a forward flow
bwd_iatThe arrival time interval between two datagrams in a backward flow
totlen_fwd_pktsTotal number of packets in the forward flow
totlen_bwd_pktsTotal number of packets in the backward flow
......
Table 2. The 1D-CNN capability of malicious encrypted traffic classification (Dataset 1).
MethodsPrecision (%)Accuracy (%)Recall (%)F1-Score (%)
CICFLOWMETER99.6099.5599.5099.55
99.5099.6099.7099.60
99.7099.7099.7099.70
DOHLYZER98.2298.7099.2098.71
97.2698.2599.3098.27
99.7099.6099.5099.60
ADRSA99.9099.9510099.95
99.9099.8599.8099.85
99.7099.7599.8099.75
Table 3. The 1D-CNN capability of malicious encrypted traffic classification (Dataset 2).
MethodsPrecision (%)Accuracy (%)Recall (%)F1-Score (%)
CICFLOWMETER98.6199.1099.6099.10
99.0199.3599.7099.35
99.1099.3099.5099.30
DOHLYZER99.0199.3099.6099.30
99.1099.3599.6099.35
99.0099.1599.3099.15
ADRSA99.8099.9010099.90
99.3099.5599.8099.55
99.4099.5599.7099.55
Table 4. The 2D-CNN capability of malicious encrypted traffic classification (Dataset 1).
MethodsPrecision (%)Accuracy (%)Recall (%)F1-Score (%)
CICFLOWMETER99.2099.4599.7099.45
99.6099.6599.7099.65
99.4399.6399.8399.63
DOHLYZER98.7199.1199.5099.10
98.1198.4898.8598.48
98.9399.2799.6099.26
ADRSA99.8099.8099.8099.80
99.7599.8399.9099.83
99.9599.9099.8599.90
Table 5. The 2D-CNN capability of malicious encrypted traffic classification (Dataset 2).
MethodsPrecision (%)Accuracy (%)Recall (%)F1-Score (%)
CICFLOWMETER98.9099.0599.2099.05
99.0099.0599.1099.05
99.2799.2499.2099.24
DOHLYZER99.0099.1099.2099.10
99.3599.1098.8599.10
99.2599.2899.3099.28
ADRSA99.2099.3099.4099.30
99.5099.7099.9099.70
99.5099.6599.8099.65
Table 6. The 1D-CNN detectability of a malicious encryption sample (Dataset 3).
MethodsPrecision (%)Accuracy (%)Recall (%)F1-Score (%)
CICFLOWMETER99.8099.9010099.90
DOHLYZER96.6896.4596.2096.44
Table 7. The 2D-CNN detectability of a malicious encryption sample (Dataset 3).
MethodsPrecision (%)Accuracy (%)Recall (%)F1-Score (%)
CICFLOWMETER99.6099.8010099.80
DOHLYZER96.3797.3498.3097.33
Table 8. The 1D-CNN validity of adversarial malicious encrypted traffic (Dataset 4).
MethodsPrecision (%)Accuracy (%)Recall (%)F1-Score (%)
CICFLOWMETER050.0000
DOHLYZER050.0000
Table 9. The 2D-CNN validity of adversarial malicious encrypted traffic (Dataset 4).
MethodsPrecision (%)Accuracy (%)Recall (%)F1-Score (%)
CICFLOWMETER050.0000
DOHLYZER050.0000
Table 10. The 1D-CNN validity of adversarial malicious encrypted traffic (Dataset 4).
MethodsPrecision (%)Accuracy (%)Recall (%)F1-Score (%)
CICFLOWMETER050.0000
DOHLYZER050.0000
ADRSA99.9099.9099.9099.90
Table 11. The 2D-CNN validity of adversarial malicious encrypted traffic (Dataset 4).
MethodsPrecision (%)Accuracy (%)Recall (%)F1-Score (%)
CICFLOWMETER050.0000
DOHLYZER050.0000
ADRSA99.9099.9510099.95
Publisher’s Note: MDPI stays neutral with regard to jurisdictional claims in published maps and institutional affiliations.