Abstract
In this paper, the membrane effect of geogrid reinforcement was investigated based on numerical simulation to understand the serviceability and deformation of highway piled embankments under moving vehicle loads. The membrane effect of geogrid reinforcement in low embankments (i.e., the ratio of embankment height to pile spacing is less than 1.5) was clearly emphasized. It has been found that the maximum settlement of geogrid occurs in the central area between the piles, and the maximum tension was concentrated at the corner of the pile cap. Due to the attenuation of the soil arching effect under moving dynamic loads and the punching mechanism, the settlement and tension of the geogrid increased considerably by approximately 35% and 23% compared to those under static loads. A parametric study was also achieved, and the results presented that the geogrid reinforcement tension increased by increasing the pile spacing, embankment height and geogrid stiffness, vehicle wheel load and vehicle velocity. It was also found that the reinforcement tension was most sensitive to the pile spacing among all the parameters considered in this paper, whose magnitude increased by approximately 104% as the pile spacing increased from 2.0 m to 2.5 m under dynamic loads.
1. Introduction
The piled embankment has been extensively used in highway and railway infrastructures constructed over soft soil foundations. In order to enhance the load transfer from the soft soils to the pile cap and to minimize the soil yielding above the pile cap, one or more layers of geogrid reinforcement are usually incorporated in the piled embankment, which are referred to as reinforced piled embankments. Recently, a large number of studies based on experimental, numerical and analytical models have been carried out to investigate the bearing capacity and load transfer mechanism of the reinforced piled embankment (e.g., Han and Gabr [1]; Almeida et al. [2]; Rowe and Liu [3]; Rui et al. [4]; Fagundes et al. [5]; Yu and Bathurst [6]; Ewerton et al. [7]; Michalowski et al. [8]; Rui et al. [9]; Reshma et al. [10]; Shen et al. [11]; Pham and Dias [12]).
The fundamental load transfer mechanisms of the geogrid reinforced piled embankments are soil arching and tensioned membrane effects, both of which are key design aspects. The inclusion of geogrid reinforcement helps the vertical load transfers from the subsoil to the pile cap, which is generally called the membrane effect, and refers to the ability of a geosynthetic reinforcement to deform by tension absorption of forces initially perpendicular to its surface [13,14,15,16,17,18,19]. Generally, the membrane effect of the geogrid reinforcement in a piled embankment occurs along with the soil arching effect, in which the soil arching is evaluated to obtain the load acting on the geogrid reinforcement over the subsoil, while the membrane effect directly decides the maximum tensile force of the geogrid and significantly influences the subsoil settlement. To investigate the membrane effect, the tensile force of the geogrid reinforcement is significant, for which some guidelines have been developed in the past decades [20,21,22,23,24,25,26,27]. The British ‘Code of practice for strengthened/reinforced soils and other fills’ (BS8006) gave a method for calculating the tension of reinforcement in a piled embankment based on the “Marston” equation. Subsequently, in a substantial revision in 2010 [20], an alternative soil arching method proposed by Hewlett and Randolph [28] was incorporated to predict the tension of reinforcement. As the method was overly conservative, however, another revision was made in 2012 [29] to reduce the prediction of the tension of the reinforcement using Hewlett and Randolph’s [28] method. The German Recommendations of Geosynthetic Reinforcement [21] estimated the maximum strain in a reinforcement considering the elastic response of the subsoil. Zhuang and Ellis [24] considered predictions of reinforcement tension in a piled embankment from BS8006 [20] and compared the results with finite element (FE) model predictions; this was then extended to include the potentially beneficial contribution of a lightly over-consolidated clay subsoil layer, both in the FE models and the analytical method in Zhuang and Ellis [25]. However, based on overly conservative assumptions, some design methods have yielded contradictory conclusions, especially in terms of geogrid reinforcement load transfer mechanisms and stress–strain predictions [30,31,32,33,34,35]. Due to the complexity of reinforced pile embankments, there are currently no clear uniform guidelines for the design of the geogrid reinforcement contained therein. As a result, the membrane effect of the geogrid reinforcement is not well investigated in the literature, particularly for the degree of the load transfer and the stress–strain developed in the geogrid reinforcement.
The British Standard BS8006 [29] recommends that the embankment height (h) should be greater than 0.7 times the clear pile spacing (s-a). Meanwhile, BS8006 [29] considers that when the embankment height is in the range of 0.7(s-a) to 1.4(s-a) (i.e., low embankment), the soil arching in the embankment is partially generated, and after the embankment height exceeds 1.4(s-a) (i.e., high-filled embankment), the soil arching in the embankment is fully generated. Zhuang et al. [36] investigated the soil arching effect of piled embankments by numerical methods. They concluded that the ratio of embankment height to pile spacing (h/s) less than 1.5 are low embankments and their soil arching is only partially developed. Lai et al. [37] found that the bearing capacity and stability of the partial arch in the low embankment under quasi-static loading is much worse than that of the full arch in the high-filled embankment. Therefore, the membrane effect of the geogrid reinforcement is particularly significant in low embankments. However, most of the current studies [16,17,18,19] on the membrane effect of reinforcement have been conducted on high-filled embankments.
Most research conducted so far has investigated the serviceability behavior of geogrid reinforcement in piled embankments under static loads, very limited literature is available to understand its membrane effect under moving vehicle loads. Heitz et al. [38] conducted a large-scale model test (scale of 1:3) and concluded that the inclusion of geogrid enhanced the soil arching effect and can considerably reduce the settlement at the surface of the embankment. However, the strain in geogrid under dynamic loads may significantly increase due to the reduction in the soil arching effect under cyclic loading and the punching mechanism, especially for geogrid with relatively low stiffness. Chen et al. [39] evaluated the tension of the geogrid reinforcement in piled highway embankments based on a model experiment. However, the geogrid tension under dynamic loads was only qualitatively assessed, without a discussion of the load transfer mechanics. Based on a large-scale test, Liu et al. [40] concluded that the loading frequency had an important influence on the dynamic behavior of the reinforced soil railway embankment. However, the loading conditions and the boundary conditions of the model test are different from those of actual railway embankments. Aqoub et al. [41] conducted a quantitative analysis of reinforcement in piled embankments under cyclic loading based on a model experiment. However, they used only a single cyclic load instead of focusing on the actual moving vehicle loads. Patel et al. [42] investigated the stress distribution in geogrid reinforced piled embankments under seismic loading, but this is not a common load for reinforced embankments. Zhuang et al. [43] investigated the tension of geogrid reinforcement in piled embankments under traffic loading based on a numerical model. However, the low embankments were not considered. Therefore, the guidelines to design this type of earth structure under authentic moving vehicle loads require further investigation.
This paper investigated the membrane effect of the geogrid reinforcement in highway piled embankments based on the finite element (FE) method, which explicitly emphasizes the membrane effect of geogrid reinforcement in low embankments (i.e., h/s < 1.5). The vertical stress both carried by the geogrid and the subsoil, tension and deformation of geogrid are comprehensively analyzed under moving vehicle loads. A parametric study including the influence of the pile spacing, embankment height, geogrid stiffness, vehicle wheel load and vehicle velocity on the geogrid tension is finally performed.
2. Numerical Simulation
2.1. General Description
A hypothetical highway piled embankment constructed on subsoil is shown in Figure 1. The embankment with 1v:1h slope is built on a uniform 6.0 m-thick soft clay layer, under which there is a rigid layer. The top of the embankment is paved with a total thickness of 0.6 m, including 0.15 m AC layer, 0.20 m base course and 0.25 m subbase. The surface of the pile cap is at the same level as the embankment–subsoil interface. The square pile cap is normally 1.0 m with a thickness of 0.50 m. The geometric dimension of square section pile is 0.30 m, and it is arranged in a square pattern. Geogrid is laid at a height of 0.1 m above the bottom of embankment. In order to cover a wide range of parameters that may affect the membrane behavior of reinforcement, different geometries and stiffness were considered, as shown in Table 1. According to the manufacturer, the short-term load range that the geogrid can bear under 5% strain is from approximately 20 kN/m to 500 kN/m. Therefore, the corresponding range of nominal stiffness is 0.4 to 10 MN/m. However, in the long term, creep may significantly reduce these values. Thus, the geogrid with stiffness J = 1, 3 or 7 MN/m is used in this paper to fully understand the performance of reinforcement in the piled embankment.
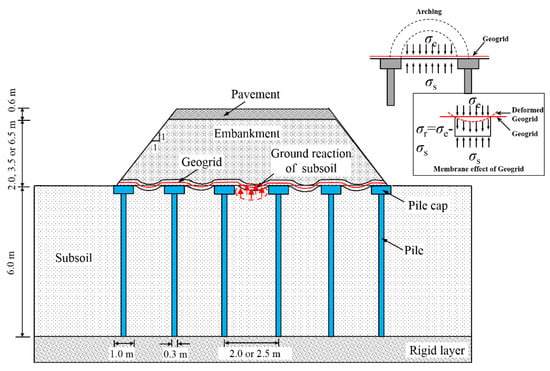
Figure 1.
Membrane effect of geogrid in piled embankment.

Table 1.
Summary of the material parameters used in the finite element analyses.
Due to symmetry, a simplified piled embankment model was presented using the finite element software ABAQUS, as shown in Figure 2 (take s = 2.5 m, h = 2.0 m as an example). The size of model bottom is 2s × 2s, where s is the pile spacing, whose value is 2.0 or 2.5 m in this paper. The embankment filler is modeled as linear elastic ideal plastic material according to the Mohr–Coulomb yielding criteria, while the pile and pavement are modeled as linear elastic material. See Table 1 for parameters. The embankment fill is non-linear material; in order to accurately reproduce the stress–strain relationship under dynamic load, an advanced constitutive law along with the finite element formulation is required. As a preliminary study, this paper uses a simple elastic ideal plastic model to simulate embankment filling, to avoid the difficulties related to the calibration of complex formula parameters. The 6.0 m-thick soft soil foundation is modeled by the improved Cam clay. The underground water level generates hydrostatic pressure on the foundation surface and is represented by 8-node stress pore pressure coupled brick element. The geogrid is assumed to be “biaxial”, which is modeled as an orthotropic material with non-zero stiffness only in the orthogonal direction of the square “grid” of the pile cap. The geogrid has a non-linear stress–strain time response that may cause the computational cost of analysis and numerical simulation to be too high, especially under cyclic loads. Generally, the linearization of the nonlinear tension–strain curve of the geogrid is considered, and its linear elastic behavior is assumed. Therefore, creep and other behaviors related to time and strain rate are indirectly considered. In this paper, the geogrid is modeled by a 4-node quadrilateral membrane element, which has tensile stiffness J (MN/m) without bending stiffness.
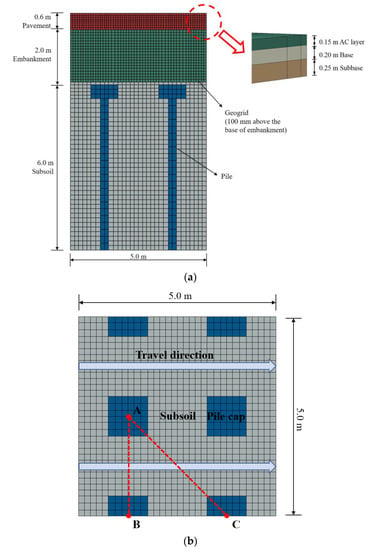
Figure 2.
Finite element mesh of the reinforced piled embankment (s = 2.5 m, h = 2.0 m). (a) Cross-section of the finite element model; (b) load moving strip and the piles arrangement (Points A, B, C are located in the center of the pile cap).
2.2. Simulation Procedure
In this analysis, it is assumed that the subsoil is fully consolidated before the cyclic load is applied. The simulation procedure of foundation consolidation is simple and clear, which is completely the same as that of Zhuang and Wang [44]. After the consolidation is completed, the traffic load with speed v is applied to the pavement surface through the subroutine DLOAD.
The dynamic loads were modeled using a simple sine curve [45] as follows:
where
where P0 is the static wheel load, M0 is the unsprung weight, which are taken as 50 kN/m2 and 250 N∙s2/m, respectively, based on typical vehicles; μw/r(y) is a function of pavement roughness with a value of 2 mm (international highway flatness index), which reflects the road condition; υ is the speed of the vehicle, and the vehicle of 60 km/h is taken as the standard condition; L is the geometric curve wavelength, and its value is 6 m (take the vehicle length); t is the duration of the load. To simplify the problem, according to Huang [46], it is assumed that the wheel load is uniformly distributed over an area of 0.30 m within a rectangular area of 0.24 m, and the vehicle load spacing is 2.0 m. In this analysis, a periodically repeated moving traffic load is applied to the pavement with 100 load cycles.
3. Analysis of Vertical Stress Carried by the Subsoil and Geogrid
Zhuang et al. [47] proposed that if the vertical stress in the embankment considering the arch effect, as shown by the GRC in terms of the maximum settlement of subsoil, then:
In the formula, σs is the vertical stress borne by the subsoil; σr is the vertical stress borne by the geogrid. σG can be based on the concept of ‘Ground Reaction Curve’ (GRC) of underground structure arching proposed by Iglesia et al. [48]. In this paper, σG will be determined based on the finite element method for arching in embankment considering uniform foundation support, as presented by Zhuang et al. [36].
In the present study, finite element models with pile spacing of 2.0 m and 2.5 m and embankment heights of 2.0, 3.5 and 6.5 m are considered to cover various geometries of pile embankment. In order to better compare various influencing factors, the finite element model with embankment height of 2.0 m and pile spacing of 2.5 m is selected as the standard model. The ratio of embankment height to pile spacing (h/s) of the standard model is 0.8, which is therefore a low embankment height. Figure 3 shows the results of the vertical stresses carried by the soft subsoil (σs) and reinforcement (σr) along the AB and AC (in Figure 2b) directions. It is worth noting that there are no data with distances less than 0.50 m and 0.71 m along AB and AC, respectively, because the data above the pile caps (a/2 = 0.50 m and ) were not calculated. Likewise, the midpoint of AB and AC are located at 1.25 and 1.77 m, respectively. As presented in Figure 3, the vertical stress distribution of soft subsoil and geogrid under moving vehicle load and static load is almost the same, but the stress under moving vehicle load is much larger than that under static load.
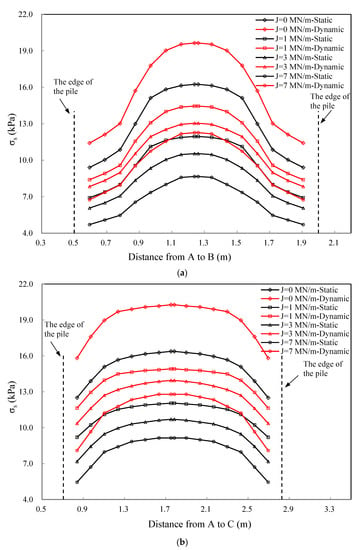
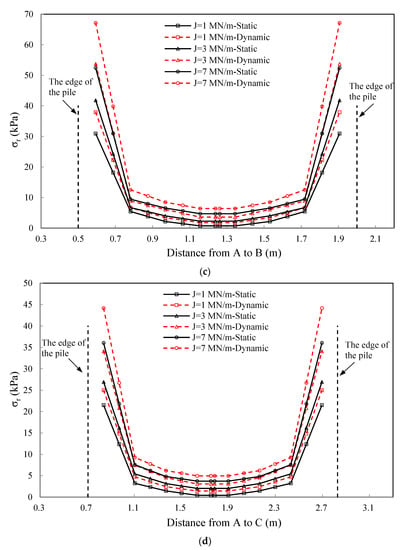
Figure 3.
Vertical stress carried by the subsoil (σs) and the geogrid (σr) varied with geogrid stiffness (s = 2.5 m, h = 2.0 m). (a) Vertical stress carried by the subsoil (σs) from A to B (edge). (b) Vertical stress carried by the subsoil (σs) from A to C (diagonal). (c) Vertical stress carried by the geogrid (σr) from A to B (edge). (d) Vertical stress carried by the geogrid (σr) from A to C (diagonal).
The finite element results shown in Figure 3a,b include the case without reinforcement (J = 0 MN/m). The vertical stress on the subsoil (σs) tends to a comparatively small value adjacent to the pile cap and then rises to a roughly uniform value toward the center of AB or AC. As expected, the addition of the geogrid effectively transfers the stress from the subsoil to the pile cap, thereby reducing the vertical stress on the subsoil by approximately 36%, particularly for the stiffer geogrid.
Figure 3c,d show the vertical stresses on the geogrid (σr), where σr is derived as the stress at bottom of the embankment (σG) minus the stress on the subsoil (σs) as shown in Equation (4). The data in Figure 3c,d show that the stress value on the pile cap is relatively high (particularly along the edge AB). Moving from the edge of pile cap to the midpoint of the AB or AC line, the bearing vertical stress of geogrid (σr) reduces rapidly and reaches almost uniform spreading at the midpoint of the subsoil. In general, this pattern of behavior is an ‘extreme’ version of the ‘inverse trapezoid’, which is different from the assumptions in the literature, such as the uniform load distribution on the geogrid, the triangular shaped line load [21] and the inverse triangle load distribution [23]. As expected, the stress carried by the geogrid increases with the growth of the stiffness of the geogrid reinforcement.
4. Distribution of Settlement and Tension of the Geogrid Reinforcement
Figure 4 presents the geogrid settlement (or the surface settlement of the subsoil without geogrid) along AB and AC, which varies with the stiffness of the geogrid (J = 0 MN/m indicates no geogrid). The data start from A (distance = 0), and the vertical dashed line represents the edge of the pile cap (distance = 0.50 m or 0.71 m). The deformed shape of geogrid both under static and moving vehicle loads for various values of geogrid stiffness are approximately the same, and it is consistent with the analytical deformation shape of reinforcement suggested by Halvordson et al. [49] and Zhuang and Ellis [24]. The settlement of the edge of the pile cap increases rapidly but is very flat at the “midspan” (e.g., compared to a parabola), especially at the midpoint of the AC line. It is noted that the settlement at the mid-point of line AC is only slightly larger than that at the mid-point of line AB. These observations are consistent with observations made by Van Eekelen et al. [50,51] in physical model tests, linked to the ‘inverse triangular load’ on the reinforcement. The maximum settlement induced by the traffic load is approximately 35% larger. It is also found that the maximum settlement rises with the decrease in the reinforcement stiffness; as a result, the embankment with no geogrid reinforced shows the major settlement, which is roughly 124% larger than the standard case (e.g., J = 3 MN/m).
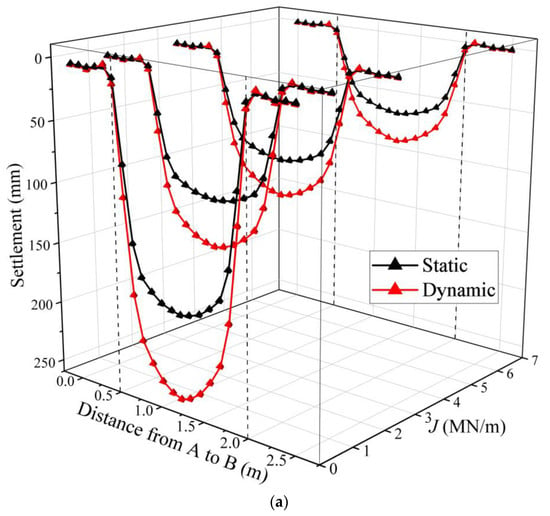
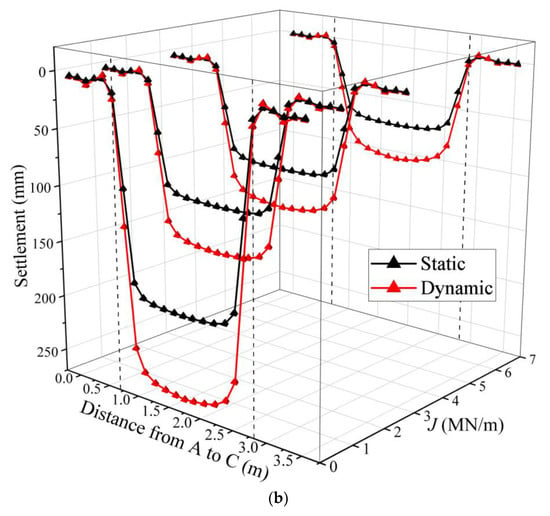
Figure 4.
Settlement (δ) of geogrid varied with geogrid stiffness (s = 2.5 m, h = 2.0 m). (a) δ from A to B (edge). (b) δ from A to C (diagonal).
Figure 5 shows the distribution of tension in the geogrid along line AC varied with different influence factors (i.e., geogrid stiffness, vehicle wheel load, vehicle velocity). The investigations for vehicle wheel load and vehicle velocity were based on the model of J = 3 MN/m. The maximum tension value in the geogrid appears at the edge of the pile cap and decreases toward the center of the pile cap, while the tension distribution at the center of the soft soil tends to be zero and uniform. As anticipated, the geogrid tension increases with the geogrid stiffness, vehicle wheel load and vehicle velocity. Due to the reduction in the arching effect under the moving vehicle load and the punching mechanism, the tension of the geogrid is significantly increased by approximately 23% compared with the tension under the standard static load (J = 3 MN/m, P0 = 50 kPa, V = 60 km/h).
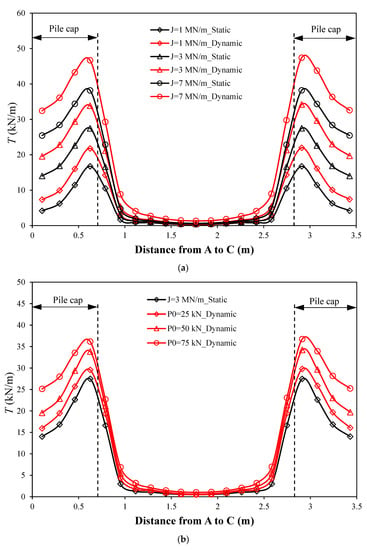
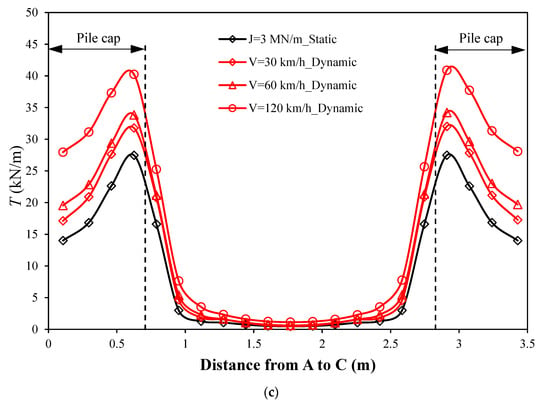
Figure 5.
Distribution of geogrid tension (T) from A to B (edge) for different influence factors. (a) Effect of geogrid stiffness. (b) Effect of vehicle wheel load. (c) Effect of vehicle velocity.
5. Parametric Study in Terms of the Geogrid Tension
In order to comprehensively study the membrane effect of geogrid in low embankments under moving vehicle load, a series of finite element models were established by changing the geometric structure (pile spacing and embankment height), geogrid stiffness, wheel load and vehicle speed. The results are discussed in the form of geogrid tension, as shown in Figure 6. It is notable that the variation of geogrid tension with the influence factors under static and moving vehicle loads show almost the same trend, and the vehicle load induced reinforcement tension is approximately 9–49% larger compared to that under static load.
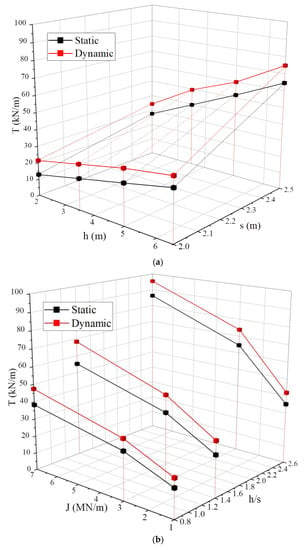
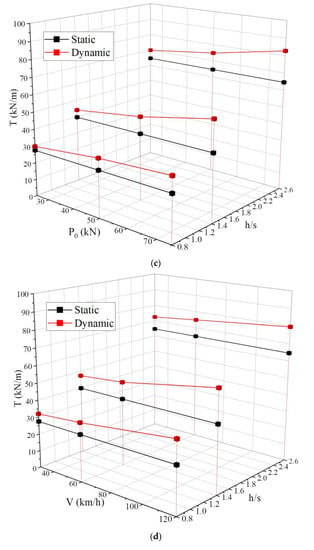
Figure 6.
Variation of geogrid tension (T) with influencing factors. (a) Effect of embankment height and pile spacing. (b) Effect of geogrid stiffness. (c) Effect of vehicle wheel load. (d) Effect of vehicle velocity.
In Figure 6a, the geogrid tension increased by approximately 48% when the embankment height increased from 3.5 m to 6.5 m for a pile spacing of 2.5 m under vehicle loads. The membrane effect of the geogrid was more sensitive to the pile spacing than the embankment height, and the tension of the geogrid increased by approximately 104% when the pile spacing increased from 2.0 m to 2.5 m.
The stiffness of geogrid has a significant effect on the membrane effect of geogrid, particularly when the stiffness of geogrid reinforcement is relatively low, as shown in Figure 6b. The role of geogrid in reinforced piled embankment can be explained by the reinforcement of the geo platform and the additional vertical component of tension in geogrid [1]. As expected, the stress carried by the geogrid rises with the increase in the stiffness of the reinforcement and results in an increase in maximum tension by approximately 56% as the geogrid stiffness increases from 1 MN/m to 3 MN/m.
The influence of magnitude and velocity of the moving vehicle load on geogrid tension is investigated herein (Figure 6c,d). Three results of different magnitude (i.e., 25, 50 and 75 kN) and velocities (i.e., 30, 60 and 120 km/h) are studied. As anticipated, the magnitude and speed of the increase in traffic load increase the vertical stress and settlement of the embankment above the geogrid, especially for relatively large velocity and magnitude of vehicle load [52]. The geogrid tension increases by approximately 23% and 19% when growing the magnitude of the vehicle load from 25 kN to 75 kN and increasing the velocity from 60 to 120 km/h, respectively.
6. Conclusions
Based on the 3D FE models, this paper comprehensively investigated the membrane effect of the geogrid reinforcement, intending to deeply understand the serviceability behavior and deformation of the geogrid reinforcement in low piled embankments (i.e., h/s < 1.5). It showed that the distribution of the vertical stress acting on the geogrid actually exhibited an inverse trapezoid, and the general plots of the settlement and tensile force in the geogrid under moving vehicle loads exhibited excellent agreement with Halvordson et al. [49] and Zhuang and Ellis [24]. The maximum settlement of geogrid occurs in the central area between the piles, while the maximum tension is concentrated in the corner of the pile cap. Due to the reduction in soil arching effect under moving vehicle loads and the punching mechanism, the settlement and tension of geogrid are significantly increased by approximately 35% and 23% compared with that under static loads.
A parametric study was presented and discussed in terms of the geogrid tension to gain a comprehensive understanding of the membrane effect under moving vehicle loads. It has been found that the geogrid tension increases with the increase in pile spacing, embankment height, geogrid stiffness, wheel load and vehicle speed. The membrane effect of reinforcement is the most sensitive to the pile spacing among all the influencing factors investigated in this paper, and the tension increases by approximately 104% with the pile spacing increasing from 2.0 m to 2.5 m.
As a preliminary study, this paper mainly studies the dynamic characteristics of geogrid reinforced pile embankments, rather than the vibration caused by the dynamic load. The linear elastic ideal model (Mohr–Coulomb) is used to simulate the embankment filling. It is impossible to fully capture the complex dynamic soil behavior using the Mohr–Coulomb model, especially the strain dependent behavior of stiffness and damping. Therefore, the present method may have some limitations in studying the dynamic response of pile embankment vibration. The response of the geogrid reinforced pile embankment should be further studied. The advanced constitutive model should be used, and the unloading/reloading behavior of the soil should be considered.
Author Contributions
Conceptualization, Y.Z. and S.H.; methodology, Y.Z. and S.H.; software, S.H.; writing—original draft preparation, Y.Z.; writing—review and editing, S.H.; validation, X.S.; formal analysis, X.S.; investigation, H.Z.; data curation, H.Z.; visualization, X.S. and H.Z.; supervision, Y.Z. and W.C.; project administration, W.C.; funding acquisition, Y.Z. All authors have read and agreed to the published version of the manuscript.
Funding
The financial support of the National Science Foundation for Excellent Young Scholars of China (Grant No. 51922029), and the National Natural Science Foundation for General Program of China (Grant No. 52178316) is acknowledged.
Data Availability Statement
Not applicable.
Conflicts of Interest
The authors declare no conflict of interest.
References
- Han, J.; Gabr, M.A. Numerical Analysis of Geosynthetic-Reinforced and Pile-Supported Earth Platforms over Soft Soil. J. Geotech. Geoenviron. Eng. 2002, 128, 44–53. [Google Scholar] [CrossRef]
- Almeida, M.S.S.; Ehrlich, M.; Spotti, A.P.; Marques, M.E.S. Embankment supported on piles with biaxial geogrids. Proc. Inst. Civ. Eng. Geotech. Eng. 2007, 160, 185–192. [Google Scholar] [CrossRef]
- Rowe, R.K.; Liu, K.-W. Three-dimensional finite element modelling of a full-scale geosynthetic-reinforced, pile-supported embankment. Can. Geotech. J. 2015, 52, 2041–2054. [Google Scholar] [CrossRef]
- Rui, R.; van Tol, A.F.; Xia, Y.Y.; van Eekelen, S.J.M.; Hu, G. Investigation of Soil-Arching Development in Dense Sand by 2D Model Tests. Geotech. Test. J. 2016, 39, 415–430. [Google Scholar] [CrossRef]
- Fagundes, D.F.; Almeida, M.S.; Thorel, L.; Blanc, M. Load transfer mechanism and deformation of reinforced piled embankments. Geotext. Geomembr. 2017, 45, 1–10. [Google Scholar] [CrossRef]
- Yu, Y.; Bathurst, R.J. Modelling of geosynthetic-reinforced column-supported embankments using 2D full-width model and modified unit cell approach. Geotext. Geomembr. 2017, 45, 103–120. [Google Scholar] [CrossRef]
- Fonseca, E.C.; Palmeira, E. Evaluation of the accuracy of design methods for geosynthetic-reinforced piled embankments. Can. Geotech. J. 2019, 56, 761–773. [Google Scholar] [CrossRef]
- Michalowski, R.L.; Wojtasik, A.; Duda, A.; Florkiewicz, A.; Park, D. Failure and Remedy of Column-Supported Embankment: Case Study. J. Geotech. Geoenviron. Eng. 2018, 144, 05017008. [Google Scholar] [CrossRef]
- Rui, R.; Han, J.; van Eekelen, S.J.M.; Wan, Y. Experimental Investigation of Soil-Arching Development in Unreinforced and Geosynthetic-Reinforced Pile-Supported Embankments. J. Geotech. Geoenviron. Eng. 2019, 145, 04018103. [Google Scholar] [CrossRef]
- Reshma, B.; Rajagopal, K.; Viswanadham, B.V.S. Centrifuge model studies on the settlement response of geosynthetic piled embankments. Geosynth. Int. 2020, 27, 170–181. [Google Scholar] [CrossRef]
- Shen, P.; Xu, C.; Han, J. Geosynthetic-reinforced pile-supported embankment: Settlement in different pile conditions. Geosynth. Int. 2020, 27, 315–331. [Google Scholar] [CrossRef]
- Pham, T.A.; Dias, D. 3D numerical study of the performance of geosynthetic-reinforced and pile-supported embankments. Soils Found. 2021, 61, 1319–1342. [Google Scholar] [CrossRef]
- King, D.J.; Bouazza, A.; Gniel, J.R.; Rowe, R.K.; Bui, H.H. Serviceability design for geosynthetic reinforced column supported embankments. Geotext. Geomembr. 2017, 45, 261–279. [Google Scholar] [CrossRef]
- Ghosh, C.; Madhav, M. Reinforced granular fill-soft soil system: Membrane effect. Geotext. Geomembr. 1994, 13, 743–759. [Google Scholar] [CrossRef]
- Palmeira, E.M.; Antunes, L.G. Large scale tests on geosynthetic reinforced unpaved roads subjected to surface maintenance. Geotext. Geomembr. 2010, 28, 547–558. [Google Scholar] [CrossRef]
- Lu, W.; Miao, L. A simplified 2-D evaluation method of the arching effect for geosynthetic-reinforced and pile-supported embankments. Comput. Geotech. 2015, 65, 97–103. [Google Scholar] [CrossRef]
- Feng, S.-J.; Ai, S.-G.; Chen, H.-X. Membrane effect of geosynthetic reinforcement subjected to localized sinkholes. Can. Geotech. J. 2018, 55, 1334–1348. [Google Scholar] [CrossRef]
- Zhuang, Y.; Cui, X.; Zhang, S.; Dai, G.; Zhao, X. The load transfer mechanism in reinforced piled embankment under cyclic loading and unloading. Eur. J. Environ. Civ. Eng. 2020, 26, 1364–1378. [Google Scholar] [CrossRef]
- Wang, X.; Wang, X.; Yang, G.; Yang, X.; Zhang, D. Research on the Load Transfer Law of Cross-Sections of Pile-Supported Reinforced Embankments Based on the Finite Element Method. Sustainability 2022, 14, 7831. [Google Scholar] [CrossRef]
- BS 8006-1; Code of Practice for Strengthened/Reinforced Soils and other Fills. BSI: London, UK, 2010.
- GGS. Recommendations for Design and Analysis of Earth Structures Using Geosynthetic Reinforcements—EBGEO; German Geotechnical Society: Berlin, Germany, 2011. [Google Scholar]
- van Eekelen, S.; Bezuijen, A.; van Tol, A. Analysis and modification of the British Standard BS8006 for the design of piled embankments. Geotext. Geomembr. 2011, 29, 345–359. [Google Scholar] [CrossRef]
- van Eekelen, S.; Bezuijen, A.; van Tol, A. Validation of analytical models for the design of basal reinforced piled embankments. Geotext. Geomembr. 2015, 43, 56–81. [Google Scholar] [CrossRef]
- Zhuang, Y.; Ellis, E. Finite-element analysis of a piled embankment with reinforcement compared with BS 8006 predictions. Géotechnique 2014, 64, 910–917. [Google Scholar] [CrossRef]
- Zhuang, Y.; Ellis, E.A. Finite-element analysis of a piled embankment with reinforcement and subsoil. Géotechnique 2016, 66, 596–601. [Google Scholar] [CrossRef]
- Zhuang, Y.; Wang, K.Y.; Liu, H.L. A simplified model to analyze the reinforced piled embankments. Geotext. Geomembr. 2014, 42, 154–165. [Google Scholar] [CrossRef]
- Pham, T.A.; Dias, D. A simplified model for the analysis of piled embankments considering arching and subsoil consolidation. Geotext. Geomembr. 2022, 50, 408–431. [Google Scholar] [CrossRef]
- Hewlett, W.J.; Randolph, M.F. Analysis of piled embankments. Ground Eng. 1988, 21, 12–18. [Google Scholar]
- BS 8006-1; Code of Practice for Strengthened/Reinforced Soils and other Fills, Incorporating Corrigendum 1. BSI: London, UK, 2012.
- Zhuang, Y.; Wang, K. Three-dimensional behavior of biaxial geogrid in a piled embankment: Numerical investigation. Can. Geotech. J. 2015, 52, 1629–1635. [Google Scholar] [CrossRef]
- Russell, D.; Pierpoint, N. An assessment of design methods for piled embankments. Ground Eng. 1997, 30, 39–44. [Google Scholar]
- Gourc, J.; Villard, P. Reinforcement by membrane effect: Application to embankments on soil liable to subsidence. In Proceedings of the 2nd Asian Geosynthetics Conference; The Institution of Engineers Malaysia: Kuala Lumpur, Malaysia, 2000; Volume 1, pp. 55–72. [Google Scholar]
- Hufenus, R.; Rueegger, R.; Banjac, R.; Mayor, P.; Springman, S.; Bronnimann, R. Full-scale field tests on geosynthetic reinforced unpaved roads on soft subgrade. Geotext. Geomembr. 2006, 24, 21–37. [Google Scholar] [CrossRef]
- Abdullah, C.H.; Edil, T.B. Behaviour of geogrid-reinforced load transfer platforms for embankment on rammed aggregate piers. Geosynth. Int. 2007, 14, 141–153. [Google Scholar] [CrossRef]
- Chen, R.; Xu, Z.; Chen, Y.; Ling, D.; Zhu, B. Field tests on pile-supported embankments over soft ground. J. Geotech. Geoenviron. Eng. 2010, 136, 777–785. [Google Scholar] [CrossRef]
- Zhuang, Y.; Ellis, E.; Yu, H.S. Three-dimensional finite-element analysis of arching in a piled embankment. Geotechnique 2012, 62, 1127–1131. [Google Scholar] [CrossRef]
- Lai, H.-J.; Zheng, J.-J.; Zhang, J.; Zhang, R.-J.; Cui, L. DEM analysis of “soil”-arching within geogrid-reinforced and unreinforced pile-supported embankments. Comput. Geotech. 2014, 61, 13–23. [Google Scholar] [CrossRef]
- Heitz, C.; Lüking, J.; Kempfert, H.-G. Geosynthetic reinforced and pile supported embankments under static and cyclic loading. Strain 2008, 1, 1–5. [Google Scholar]
- Chen, R.; Wang, Y.; Ye, X.; Bian, X.; Dong, X. Tensile force of geogrids embedded in pile-supported reinforced embankment: A full-scale experimental study. Geotext. Geomembr. 2016, 44, 157–169. [Google Scholar] [CrossRef]
- Liu, H.; Yang, G.; Wang, H.; Xiong, B. A large-scale test of reinforced soil railway embankment with soilbag facing under dynamic loading. Géoméch. Eng. 2017, 12, 579–593. [Google Scholar] [CrossRef]
- Aqoub, K.; Mohamed, M.; Sheehan, T. Quantitative analysis of shallow unreinforced and reinforced piled embankments with different heights subject to cyclic loads: Experimental study. Soil Dyn. Earthq. Eng. 2020, 138, 106277. [Google Scholar] [CrossRef]
- Patel, R.M.; Jayalekshmi, B.R.; Shivashankar, R. Stress Distribution in Basal Geogrid Reinforced Pile-Supported Embankments Under Seismic Loads. Transp. Infrastruct. Geotechnol. 2021, 8, 516–541. [Google Scholar] [CrossRef]
- Zhuang, Y.; Cheng, X.; Wang, K. Analytical solution for geogrid-reinforced piled embankments under traffic loads. Geosynth. Int. 2020, 27, 249–260. [Google Scholar] [CrossRef]
- Zhuang, Y.; Wang, K.Y. Finite-element analysis of arching in highway piled embankments subjected to moving vehicle loads. Géotechnique 2018, 68, 857–868. [Google Scholar] [CrossRef]
- Zhang, Y.M.; Liang, B. Dynamic response of expressway subgrade under geometric irregularity conditions. J. Lanzhou Railw. Univ. 2001, 20, 66–69. [Google Scholar]
- Huang, Y.H. Pavement Analysis and Design; Pearson, Prentice Hall: Upper Saddle River, NJ, USA, 2004. [Google Scholar]
- Zhuang, Y.; Ellis, E.A.; Yu, H.S. Plane strain FE analysis of arching in a piled embankment. In Proceedings of the Institution of Civil Engineers—Ground Improvement; ICE: London, UK, 2010; Volume 163, pp. 207–215. [Google Scholar] [CrossRef]
- Iglesia, G.R.; Einstein, H.H.; Whitman, R.V. (Eds.) Determination of vertical loading on underground structures based on an arching evolution concept. In Geo-Engineering for Underground Facilities; ASCE: Reston, VA, USA, 1999. [Google Scholar]
- Halvordson, K.; Plaut, R.; Filz, G. Analysis of geosynthetic reinforcement in pile-supported embankments, Part II: 3D cable-net model. Geosynth. Int. 2010, 17, 68–76. [Google Scholar] [CrossRef]
- Van Eekelen, S.J.; Bezuijen, A.; Lodder, H.; van Tol, A. Model experiments on piled embankments, Part II. Geotext. Geomembr. 2012, 32, 82–94. [Google Scholar] [CrossRef]
- van Eekelen, S.J.M.; Bezuijen, A.; Lodder, K.J.; van Tol, A.F. Model experiments on piled embankments, Part I. Geotext. Geomembr. 2012, 32, 69–81. [Google Scholar] [CrossRef]
- Cai, Y.; Wu, T.; Guo, L.; Wang, J. Stiffness degradation and plastic strain accumulation of clay under cyclic load with principal stress rotation and deviatoric stress variation. J. Geotech. Geoenviron. Eng. 2018, 144, 04018021. [Google Scholar] [CrossRef]
Publisher’s Note: MDPI stays neutral with regard to jurisdictional claims in published maps and institutional affiliations. |
© 2022 by the authors. Licensee MDPI, Basel, Switzerland. This article is an open access article distributed under the terms and conditions of the Creative Commons Attribution (CC BY) license (https://creativecommons.org/licenses/by/4.0/).