Abstract
The magnetic sensor should acquire a high detection ability over a wide low-frequency (LF) band of 1–100 Hz for biomagnetic measurements due to the large LF noise. This work presents a magnetic sensor with a modulation coil based on the tri-layer symmetrical Metglas/Quartz/Metglas laminate for LF magnetic fields detection. The Metglas/Quartz/Metglas laminate was fabricated using a rectangle quartz plate with twenty Metglas foils epoxy glued symmetrically. Additionally, the coil can be used to generate modulation voltage. The limit of detection (LOD) of the fabricated symmetrical magnetoelectric (ME) sensor has been measured and optimized without DC bias via frequency modulation technique. Experimental results demonstrate that the proposed ME sensor can detect a small magnetic field of 11 pT at 1 Hz. Moreover, the Metglas thickness and the modulation voltage also have been optimized and the detection ability of the fabricated sensor has been enhanced with a lower LOD value of 2.7 pT at 1 Hz. This paper provides a symmetrical magnetoelectric sensor using piezoelectric quartz material for LF pico-Tesla magnetic field signals detection. Additionally, the symmetrical sensor without bias can provide a cost-effective and high-performance approach for LF magnetic field detection.
1. Introduction
Magnetoelectric (ME) materials have long been used in technological applications such as sensitive magnetic sensors, magnetoelectric inductors, and so on. ME materials can convert magnetic field signals into electric field signals due to a high magnitude of the ME coefficient, i.e., response of either electric a polarization (P) to a magnetic field (H) or a conversely magnetization (M) to an electric field (E) [1,2,3,4]. With the ME effect in the magnetoelectric materials, the magnetoelectric sensor can sense weak magnetic fields. Additionally, a great deal of progress has been made to enhance the ME effect of the ME composites for enhancing the detective ability of the sensor [5,6,7,8]. For example, the two-phase magnetoelectric composites (piezoelectric/magnetostrictive), which can exhibit a giant ME coefficient compared with single-phase counterparts, have been presented [9,10]. Additionally, different types of composites such as particulate composites and laminated composites operating in various vibration modes also have been investigated to achieve the high performance. Compared with the ME particulate composites which have relatively low ME coefficient and high dielectric losses, the laminated ME composites can show higher ME coefficient with simpler structure and hence simplify the fabrication process [11]. For example, the symmetrical magnetoelectrical composite using PMN-PT and laser-treated amorphous FeBSi alloy can achieve a giant ME coefficient at resonance frequency [12].
Magnetoelectric sensors utilizing laminate magnetostrictive/piezoelectric composites can detect very weak magnetic signals, showing a potential in the application of biomagnetic field detection [13,14,15]. Magnetoelectric sensors consist of piezoelectric and magnetostrictive materials, and the materials are mechanically coupled. Therefore, when the applied magnetic field changes, a strain induced by the magnetostrictive phase will be transferred to the piezoelectric phase of the ME composites. Subsequently, the sensor will produce a voltage output in the piezoelectric layer. Under no bias, the linear strain induced by magnetostrictive materials will result in a weak voltage signal output in piezoelectric laminate for an ME sensor. Therefore, the ME sensor can achieve a high ME coefficient only at an optimal Hdc bias. Due to this, the ME sensor will become complex and the ME sensor cannot meet the requirement of miniaturization. In order to address this issue, self-biased ME composites have been proposed with a non-zero ME-coupling coefficient which can generate large linear strain in magnetostrictive layers under zero bias [16,17]. In this way, the drawbacks arising from an external magnetic bias generally provided by energized solenoids can be avoided.
For the detection of low-frequency magnetic fields, the current fluxgate sensors and SQUID have the limitations. For example, the SQUID requires lower temperature which make it bulk and expensive [18]. Though the fluxgate can achieve a lower noise level and attain a high magnetic field detection ability, the size is larger and fabrication process is more complex than that of the ME sensor [19]. The ME sensor can achieve the best sensitivity at its resonance frequency due to the largest resonance ME coefficient [20]. However, the tri-layer symmetrical ME sensor has a resonance frequency in the kHz range. For enhancing the detective ability of the ME sensor in a wide low-frequency (LF) band of 1–100 Hz, the bilayer magnetic sensor based on a cantilever structure has been demonstrated to lower the resonance frequency [21,22]. With the high ME coefficient at the lower resonance frequency, the bilayer ME sensor can achieve a high detective ability in a range of several hundred Hertz. Nevertheless, neither the bilayer nor the tri-layer ME sensor cannot detect the bio-magnetic signals in a pico-Tesla regime due to the large noise and the non-resonance low ME coefficient in the LF range. In order to sense the LF bio-magnetic signals, the frequency modulation method has emerged. With the frequency modulation method, the LF magnetic field can be shifted to the carrier magnetic field and the ME sensor can achieve a high detection ability in LF regime [23,24]. Furthermore, the magnetic sensor should have a large ME coefficient and low noise floor for achieving a higher sensitivity with frequency modulation technique. In terms of the structure of the sensor, the ME coefficient of symmetry structure sensor is higher than the asymmetry one [25,26]. In addition, compared with the PZT or PMN-PT materials, the quartz laminate can obtain a higher ME coefficient and a lower noise floor due to a higher value of d/ε (d represents the piezoelectric coefficient, ε represents the permittivity) [27,28]. Quartz laminate provides great potential for the application of ME sensors.
In this paper, a symmetrical Metglas/Quartz/Metglas laminate structure sensor is presented for the LF magnetic signals detection. The LF magnetic field signals have been detected by the quartz-based sensor through frequency modulation scheme. In addition, the Metglas thickness and the modulation voltage have been optimized to enhance the detection ability of the ME sensor. Experimental results of the ME sensor demonstrate that the detection limit value of the ME sensor is 11 pT with optimized modulation voltage. Moreover, the Metglas layers of the symmetrical structure ME sensor also have been optimized and a lower LOD value of 2.7 pT at 1 Hz has been achieved. The proposed ME sensor can attain a high ME coefficient at its resonance frequency, and it is promising for application in LF pico-Tesla magnetic field signals sensing with frequency modulation method under zero bias.
2. ME Sensor Fabrication and Characterization
2.1. ME Sensor Fabrication
In order to fabricate the ME sensor, a rectangular quartz plate with a size of 72 × 9 mm2 should be diced at the first in the cleaning room. The thickness of the piezoelectric quartz plate is 0.5 mm. Then a 100 nm thick Pt–thin film was deposited on both sides of the quartz slab by magnetron sputtering as the electrodes. Subsequently, twenty highly amorphous Metglas foils with a size of 70 × 9 × 0.021 mm3 were stacked and symmetrically bonded onto quartz slab as the magnetostrictive phase of the sensor. Finally, the magnetoelectric laminate was pressed and cured to minimize the epoxy thickness in between the layers. The Metglas layers were aligned with one edge of the quartz plate in the length direction. The ME sensor consists of a quartz core with Metglas foils bonded symmetrically and is illustrated in Figure 1. The total numbers of Metglas layers is twenty.

Figure 1.
The symmetrical ME sensor. (a) Schematic illustration of a symmetrical ME sensor; (b) photograph of the ME sensor.
Figure 1a illustrates the symmetrical sensor which is compounded by a quartz core and two magnetostrictive layers. The magnetostrictive foils are symmetrically bonded on the two sides of the quartz material. The Figure 1b illustrates the symmetrical quartz-based ME sensor prototype. In the quartz layer, the Pt films have been deposited on the quartz plate using magnetron sputtering equipment as the electrodes of the sensor because the quartz plate cannot output signals directly.
When the magnetostrictive plate of a ME sensor is subject to an external magnetic field, the stress produced by the Metglas layer along the length direction will be converted into the quartz plate; thus, the quartz plate will produce a voltage signal output. The induced voltage is proportional to the ME effect αME of the magnetoelectric sensor, and the αME can be determined by:
where σ is the mechanical stress, λ is the magnetostriction of the Metglas, V is the voltage and H is the magnetic field. The αME is related to the magnetostrictive properties, mechanical coupling and the piezoelectric properties of the sensor. In order to enhance the detective ability of the ME sensor, the high-performance magnetostrictive materials should be adopted. Although the Terfenol-D alloy has a large magnetostrictive coefficient, the relative permeability is low. Compared with the Terfenol-D, the Metglas materials with high saturation magnetostrictive coefficient and high relative permeability can produce obvious stress under a weak magnetic field condition, which make it ideal for the ME sensor fabrication. The saturation magnetostriction of several Metglas materials have been illustrated in Table 1.

Table 1.
Specifications of several Metglas.
The magnetostrictive material selected in this paper is vitrovac 7600 T70, which has high saturation magnetostrictive coefficient and good performance. The relative permeability of the magnetostrictive alloy material is as high as 106, which can effectively concentrate the magnetic field signal in the magnetoelectric composite material.
2.2. Demagnetization Effect of the Metglas
The demagnetization effect of the magnetostrictive materials should be investigated because of that it can deteriorate the magnetoelectric coefficient of ME sensor. For a laminate ME sensor, the external magnetic field Hr around the composite material can be expressed by:
where ND is the demagnetization factor of the magnetoelectric material along the length direction and M is the magnetization of the material. ND can be calculated as [29]:
where l, w and tm are the length, width and thickness of the Metglas, respectively. The total thickness and the width of the Metglas layers are 0.42 mm and 9 mm, respectively. The demagnetizing factor ND at the center of ME composite with a constant thickness is a function of its width and length. The demagnetizing factor of the Metglas has been calculated and plotted as shown in Figure 2.
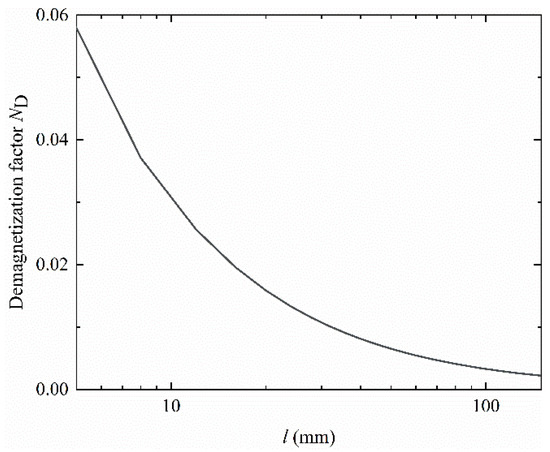
Figure 2.
Demagnetization factor of the magnetostrictive layer with length.
From Figure 2, the calculated results show that the demagnetization factor is decreased when the length of the ME laminate increased. The losses in the ME response will be reducing with the aspect ratio of the magnetostrictive material increasing. The demagnetization factor of the Metglas is lowered than 0.01 with the dimension 70 × 9 × 0.42 mm3 and it can be neglected.
2.3. ME Coefficient of the Sensor
When the AC and the DC magnetic fields are applied on the ME sensor at the same time, the quasi-static ME coefficient can be measurement. The ME coefficient versus frequency also can been measured with an alternating magnetic field applied. The corresponding ME coefficient VME has been measured using a Lock-In-Amplifier, as shown in Figure 3.
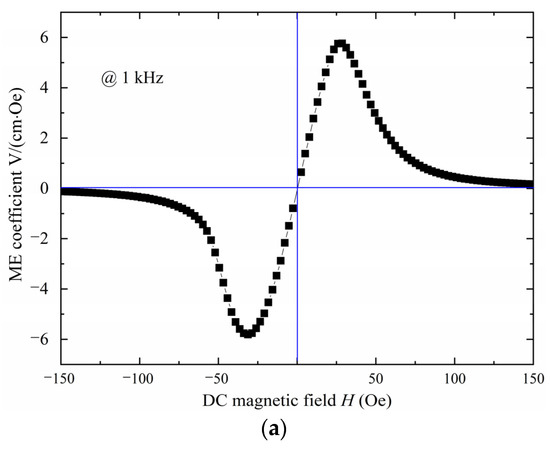
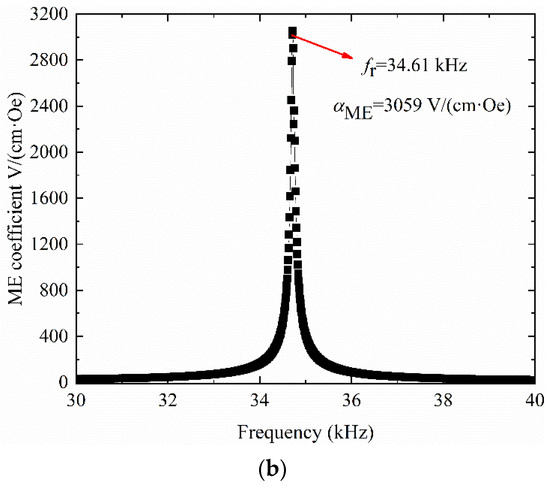
Figure 3.
The ME coefficient of the sensor. (a) The measured quasi-static ME coefficient αME of the sensor. (b) The measured ME coefficient αME versus frequency.
The experimental results indicate that the quasi-static αME of the fabricated symmetrical sensor is changed with the DC magnetic field varied. The ME coefficient of the sensor in Figure 3a can reach a maximum value of αME = 5.8 V/(cm·Oe) when the HDC increased up to 28 Oe. The sensor can result in a large voltage output with a smaller variation in magnetic field with the optimized bias. However, the DC bias generally provided by the electromagnet devices will make the ME sensor big and heavy. From Figure 3a, the quasi-static ME coefficient will decrease sharply and finally vanished when the DC magnetic field was increased to 100 Oe. The relationship of the ME coefficient αME versus frequency has been illustrated in Figure 3b. By sweeping the excitation frequency of the ac magnetic field, the ME-coupling coefficient can reach up to a maximal value of 3059 V/(cm·Oe) at its resonance frequency of 34.61 kHz with the optimal DC bias applied. The fabricated symmetrical structure sensor can attain a large ME-coupling coefficient which shows an improvement in the classical symmetrical ME sensor.
3. Measurement of Low-Frequency Magnetic Fields
3.1. Theory of Frequency Modulation
The ME sensor can exhibit strong magnetic field detective ability at its resonance frequency with the large ME coefficient. Unfortunately, the ME coefficient of the sensor is small and the LF noise is large which make it difficult to sense the LF magnetic signals with amplitudes below 100 pT directly. The frequency modulation method has been presented for the detection of LF magnetic fields due to the nonlinear ME effect [30]. With the frequency modulation technique, the LF magnetic signals can be carried to a higher frequency and be detected without suffering from the noise. Moreover, the external bias is not required with the frequency modulation method [31]. Consequently, the ME sensor can have a small size and weight. In practical, in a ME sensor array, a superposition of the DC biasing of each sensor can be avoid in future. In order to sensor the LF magnetic signals, the ME sensor was placed into a coil as shown in Figure 4.
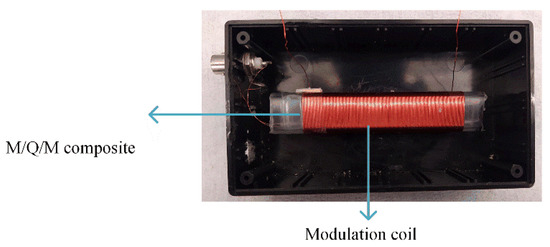
Figure 4.
The picture of ME sensor with a modulation coil applied.
The modulation coil can generate modulation voltage to shift the LF magnetic field signal to a higher frequency for detection. The BNC connector was used to output voltage signal for reducing noise. The induced voltage arising from the piezoelectric layer is proportional to the magnetostriction of the Metglas alloy. The magnetostriction λ can be described using the Fourier formula:
where H is the magnetic field, a0, a1, a2 and a3 are the constant. When H = Hmod(t) + Hsig(t), respectively. The Equation (4) can be rewritten as
where Hsig(t) = Hsig cos(2πfsigt) and Hmod(t) = Hmod cos(2πfmodt), the strain in the Metglas layer is proportional to
If the induced voltage of the sensor is attained with a lock-in detection scheme, the induced voltage will become proportional to the 2Hsig(t)Hmod(t), the Equation (6) will be derived as
The magnetoelectric voltage response of the magnetoelectric sensor to a low-frequency magnetic field can be expressed as:
where fmod and fsig represent the frequencies of the Hmod(t) and Hsig(t), respectively. In order to enhance the detect ability of the sensor, the resonance frequency is generally selected as the modulation frequency fmod for LF magnetic field detection. The LF equivalent magnetic signals can be detected at both frequencies of fmod + fsig and fmodfsig.
3.2. The Experiment of the Low-Frequency Magnetic Fields Detection
In order to measure the LF magnetic field signals, a pair of Helmholtz coils has been used to generate the LF target magnetic field signal and the ME sensor has been placed at the center of the coils to sense the magnetic field. The block diagram of the measurement system has been illustrated in Figure 5.
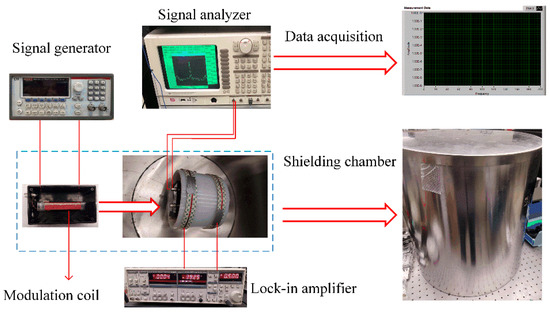
Figure 5.
The schematic of LOD measurement system.
For avoiding the noise, the ME sensor and the Helmholtz coils all should be placed into the shield box during the measurement process. In Figure 5, the modulation magnetic field is provided by the homemade coil. The Helmholtz coils can generate a small magnetic field at 1 Hz by connecting in series with a lock-in amplifier. With the frequency modulation method, the magnetic signal of 1 Hz can be shifted to a higher frequency. In the measurement system, the Helmholtz coil used is 8 cm in diameter and the number of coil turns is 100. The magnetic signal Hsig can be obtained with a signal analyzer.
In order to shift the LF magnetic field signal to a high frequency and attain a strong detective ability, the frequency of the modulation magnetic field has been set to be the same as the resonance frequency of the sensor with zero bias. In this way, the drawbacks of the ME composites can be removed through applying the frequency modulation technique. Moreover, it is useful for the ME sensor to meet the miniaturization requirement in the future. Firstly, the resonance of the ME sensor has been attained as 34.72 kHz under zero bias. With a modulation field applied, the measured modulation voltage spectra are shown in Figure 6.
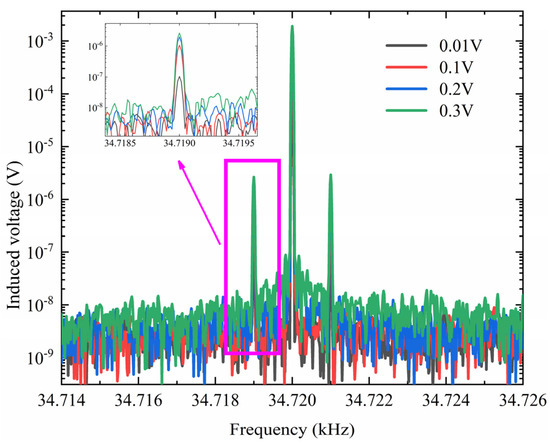
Figure 6.
The voltage spectra measurement versus frequency with different modulation voltages applied.
In the spectrum, two more peaks occur at the frequencies of fmod ± fsig. From Figure 6, the LF magnetic field signal can be sensed at both frequencies of 34.719 kHz and 34.721 kHz. Moreover, the induced voltage signals at the fmod ± fsig are equal and can be enhanced with different modulation voltages applied. The inset in Figure 6 illustrates the details of the induced voltages at the lower sideband of the resonance frequency. With the modulation voltage increasing, the induced voltage signals at 34.719 kHz are also increased. Unfortunately, the noise around 34.719 kHz behaved the same trend with the modulation voltage increased, thus the increased noise level will deteriorate the detection ability of the sensor. In order to enhance the detective ability of the sensor, the modulation voltage should be optimized for a higher voltage and a lower noise level. In this way, the strongest detective ability of the sensor can be attained with a maximal signal-to-noise-ratio (SNR). The voltage spectra measurement with the optimal voltage applied is illustrated in Figure 7.
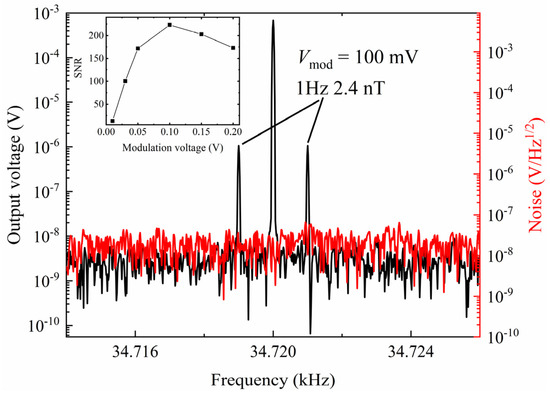
Figure 7.
The measured voltage spectra and noise.
It can be seen that the SNR will increase firstly and then reduce with the increasing of modulation voltage. The SNR can reached the maximum with the 100 mV modulation voltage applied. In this case, the induced voltage peak of the sensor at the 34.719 kHz is 1.06 μV and the SNR is 47.9 dB. The noise of the sensor is below 10−7 V/Hz−1/2 in the range of kHz. The real measurement of LOD is shown in Figure 8.
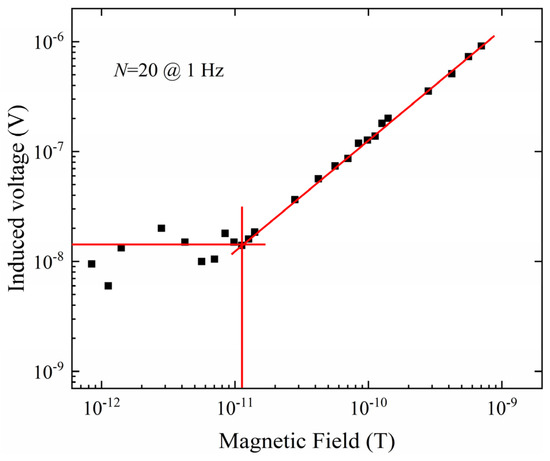
Figure 8.
LOD measurement with optimized modulation voltage.
When the LF magnetic field decreased linearly, the induced voltage of the sensor also decreased linearly at first in a large frequency range. In this case, the output voltage of the fabricated sensor is proportional to Hsig, and the target magnetic field surrounded by the sensor can be derived through the induced voltage signal. However, the induced voltage will be affected by the noise when the applied LF magnetic field signal is lower than the threshold value. At this point, the output voltage is mixed by the noise, and the induced voltage will be not correlated to Hsig. From Figure 8, the LOD of the sensor was experimentally demonstrated as 11 pT with 20 Metglas layers.
The detective ability of the sensor is related to the ME coefficient of the sensor, and the ME coefficient of the sensor can be enhanced by optimizing the Metglas thickness. In order to lower the value of the LOD, the Metglas thickness of the Metglas/Quartz/Metglas sensor also was investigated.
4. Optimal Metglas Thickness Configuration of ME Sensor
4.1. The Linear Characteristic of ME Sensor
For a symmetrical structure ME sensor, the thickness of the magnetostrictive phase can affect the ME coefficient with a given piezoelectric layer. For example, when the Metglas thickness of the ME sensor is zero, the ME coefficient will be zero because of an absence of strain generated in piezoelectric plate. Also, there will be a zero ME coefficient when the piezoelectric layer thickness is zero. Here, the thickness ratio of Metglas layers is described by vm = 2tm/(2tm + tp), tm and tp are the thickness of Metglas and quartz layers, respectively. Based on above analysis, the ME-coupling coefficient produced by the symmetrical ME sensor is closely related to the thickness ratio of the Metglas layers, there must exist a maximal ME coefficient with the vm increased from 0 to 1. In this paper, the magnetostrictive phase of the sensor is stacked one after another, so the Metglas thickness ratio n can be changed by altering the number N of Metglas foils.
In order to investigate the ME-coupling coefficient of the sensor with different Metglas thickness ratios, the value of N has been decreased from 20 to 2. For attaing a maximal ME coefficient, the impedance characteristics of the ME sensor have been tested and illustrated in Figure 9.
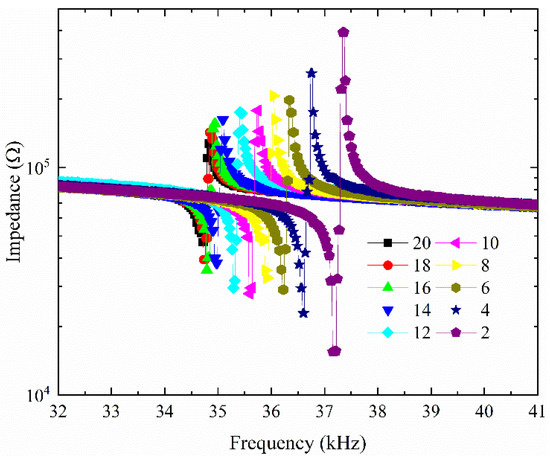
Figure 9.
Impedance spectra of the ME sensor.
The impedance characteristics show that the peaks of the impedance curves seem to increase as the Metglas layers decrease without any magnetic bias. Additionally, the resonance frequencies show a growing trend as the number of the Metglas layers decreased from 20 to 2. For getting a lower LOD value with frequency conversion method, the frequency of modulation magnetic field should be changed correspondingly. The resonance frequency can be calculated by [32]:
where l denotes the length, ρeq and Eeq denote the equivalent density and Young’s modulus, respectively. The ρeq and Eeq can be calculated by
where m and p represent the Metglas and quartz layer, respectively. Under zero bias, the resonance frequencies have been tested and calculated, and the ME coefficient with different thickness ratios also have been measured as shown in Figure 10.
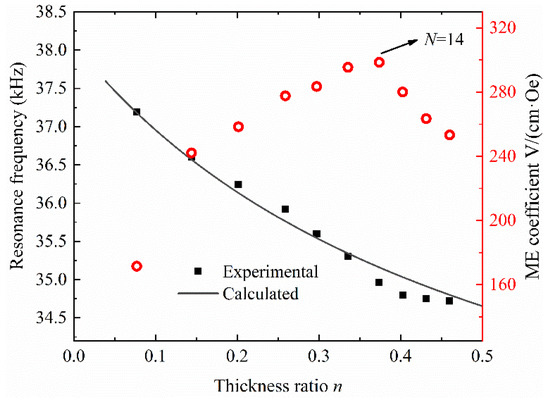
Figure 10.
Resonance frequency and ME coefficient of the symmetrical ME sensor with different thickness ratios.
The calculated and experimental resonance frequencies show a decreased trend with the thickness ratio vm increased from 0 to 0.5. It indicates that the calculated results of the resonance frequencies coincide with experimental results. The ME coefficient at different resonance frequencies with zero bias also has been measured. From Figure 10, the ME coefficient mounted dramatically and then reduced when the Metglas layers varied. The ME coefficient sensor can mount to 298 V/(cm·Oe) with the Metglas layers thickness ratio vm = 0.35 with no DC bias. The higher ME coefficient will lead to an enhancement in detective ability of the sensor. With the optimized thickness ratio, the ME sensor can exhibit the strongest detective ability in the LF range with frequency modulation method.
4.2. The Equivalent Circuit Model
For analyzing the ME sensor, the Modified Butterworth Van Dyke (MBVD) model can be adopted to model the sensor. The MBVD model of magnetic sensors can help to enhance the detective ability of the magnetoelectric sensor [33]. When the N = 14, the MBVD equivalent circuit model of the sensor is presented as shown in Figure 11.
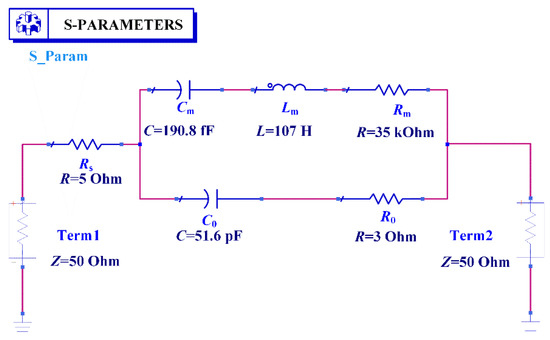
Figure 11.
Equivalent circuit of the sensor with N = 14.
In Figure 11, the equivalent MBVD circuit for modeling a ME sensor which contains an acoustic (or motional) RLC arm, a parallel capacitance C0 and two additional loss resistors R0 and Rs is presented. In the equivalent circuit, Rs models the substrate resistance for describing the electrical losses, and R0 can be used for the description of acoustic losses when the circuit operates in parallel resonance. To verify the MBVD model, the simulated results and the measurement results have been shown in Figure 12.
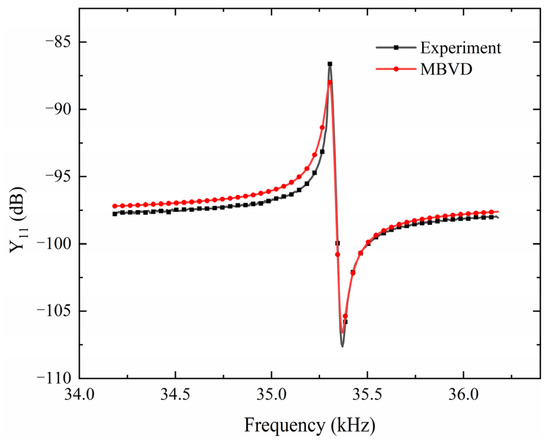
Figure 12.
Admittance amplitude of MBVD fitting model and measurement.
As shown in Figure 12, the input admittance |Y| versus frequency of the ME sensor without DC magnetic field bias has been measured and simulated. The simulation results attained by the MBVD model can properly describe the ME sensor compared with experimental results. The experimental results have been measured by the impedance analyzer (HP 4194A) in this work. The error between the simulation and measurement results mainly due to the inaccuracy by taking average of the impedance values at off-resonance frequencies and there are not enough data points measured by the impedance analyzer.
4.3. The LOD Measurment with Different Frequencies
Without any bias, the fabricated tri-layer symmetrical Metglas/Quartz/Metglas structure sensor can attain a maximum coefficient with N = 14. In this case, the LOD value is as shown in Figure 13.
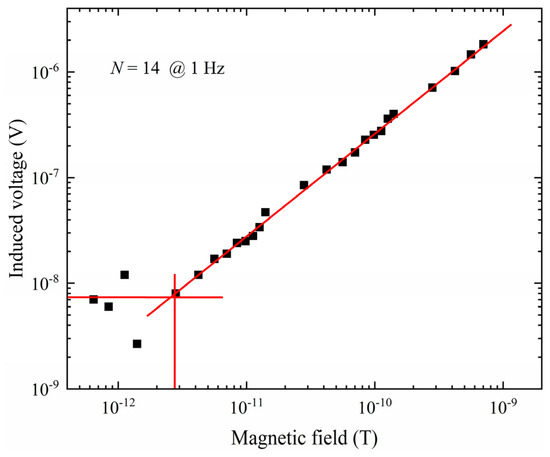
Figure 13.
The LOD of the sensor with N = 14.
When a small AC field signal at 1Hz decreases linearly, the voltage arising from the quartz plate of the sensor will decrease correspondingly. When the small AC field signal is lower than the LOD value, the voltage signal will be disturbed by the noise. With the LF magnetic field signals continuing decreased, the induced voltage of the sensor will not be proportional to the target LF magnetic field signals. The LOD can be attained as 2.7 pT with the optimized Metglas layer with SNR = 1. The detective ability of the quart-based sensor is 4 times higher than the original 20 layers ones. The LODs of the sensor at 10 Hz and 100 Hz also have been measured and the results are shown in Figure 14.
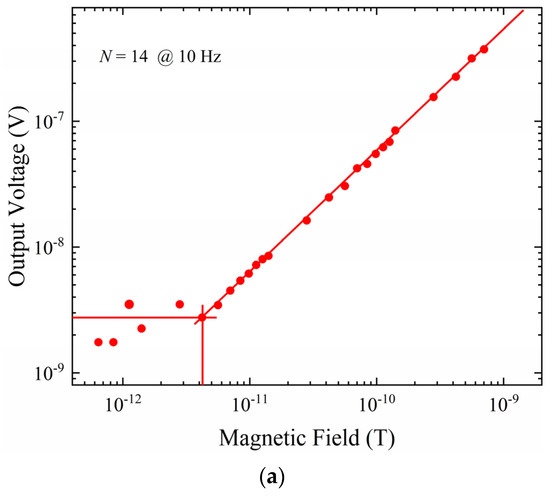
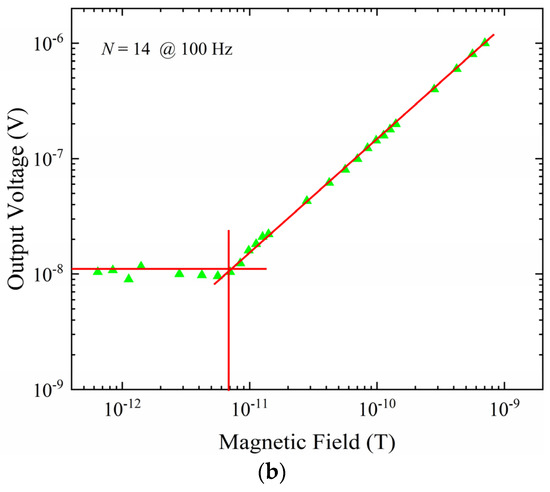
Figure 14.
LOD measurement of the ME sensor with different frequencies. (a) The LOD measurement at 10 Hz. (b) the LOD measurement at 100 Hz.
When the optimized layers and modulation voltage are applied on the sensor, the LODs of the sensor decreases to 4.2 pT and 7.1 pT at 10 Hz and 100 Hz, respectively. The LOD of the quart-based sensor has a lower value at 1 Hz than 10 Hz and 100 Hz. The LOD value will be increased when the frequency range interval between the target LF magnetic field and modulation magnetic field enlarged. It may be related to the high quality factor of the quartz, which makes the amplification of the LF magnetic field signal be restricted to a very limited frequency range with frequency modulation method. The presented sensor can be used to detect the pico-Tesla field of low frequencies (1–100 Hz) at room temperature.
5. Conclusions
In this paper, a tri-layer symmetrical structure ME sensor has been presented for the LF magnetic field detection using a frequency conversion technique. Without any magnetic field bias, the measurements of the sensor show a LOD of 11 pT at 1 Hz with the optimum modulation voltage. In addition, the LOD value can be decreased to 2.7 pT at 1 Hz with optimized Metglas layers and optimized modulation voltage applied at the same time. The LODs of the sensor have been experimental demonstrated as 4.2 pT and 7.1 pT at 10 Hz and 100 Hz, respectively. The proposed symmetrical quartz-based ME sensor indicates a potential in the LF magnetic fields detection with amplitude above 7.1 pT. In addition, the zero-biasing magnetic field of the sensor brings the advantage of size and weight. It has great potential for the usage in size-sensitive and weight-sensitive industrial magnetic field measurement instrument in future. The sandwiched Metglas/Quartz/Metglas ME sensor is highly beneficial for the detection of biomedical signals at room temperature.
Author Contributions
Conceptualization, methodology, validation, revisions, formal analysis, investigation, writing—original draft preparation by C.S.; resources, supervision by W.Y.; revisions, project administration by Y.Z. All authors have read and agreed to the published version of the manuscript.
Funding
This research received no external funding.
Data Availability Statement
Not applicable.
Conflicts of Interest
The authors declare no conflict of interest.
References
- Spaldin, N.A.; Ramesh, R. Advances in magnetoelectric multiferroics. Nat. Mater. 2019, 18, 203–212. [Google Scholar] [CrossRef] [PubMed]
- Dong, C.; He, Y.; Li, M.; Tu, C.; Chu, C.; Liang, X.; Chen, H.; Wei, Y.; Zaeimbashi, M.; Wang, X.; et al. A Portable Very Low Frequency (VLF) Communication System Based on Acoustically Actuated Magnetoelectric Antennas. IEEE Antennas Wirel. Propag. Lett. 2020, 19, 398–402. [Google Scholar]
- Gupta, R.; Kotnala, R.K. A review on current status and mechanisms of room-temperature magnetoelectric coupling in multiferroics for device applications. J. Mater. Sci. 2022, 57, 12710–12737. [Google Scholar] [CrossRef]
- Mao, Q.; Wu, J.; Hu, Z.; Xu, Y.; Du, Y.; Hao, Y.; Guan, M.; Wang, C.; Wang, Z.; Zhou, Z. Magnetoelectric devices based on magnetoelectric bulk composites. J. Mater. Chem. C 2021, 9, 5594–5614. [Google Scholar]
- Fiebig, M. Revival of the magnetoelectric effect. J. Phys. D 2005, 38, 123–152. [Google Scholar] [CrossRef]
- Tu, C.; Chu, Z.Q.; Spetzler, B.; Hayes, P.; Dong, C.Z.; Liang, Z.; Chen, H.; He, Y.; Wei, Y.; Lisenkov, I.; et al. Mechanical-Resonance-Enhanced Thin-Film Magnetoelectric Heterostructures for Magnetometers, Mechanical Antennas, Tunable RF Inductors, and Filters. Materials 2019, 12, 2259. [Google Scholar]
- Peddigari, M.; Woo, K.; Kim, S.D.; Kwak, M.S.; Jeong, J.W.; Kang, J.H.; Lee, S.H.; Park, J.H.; Park, K.I.; Annapureddy, V.; et al. Ultra-magnetic field sensitive magnetoelectric composite with sub-pT detection limit at low frequency enabled by flash photon annealing. Nano Energy 2021, 90, 106598. [Google Scholar] [CrossRef]
- Leung, C.M.; Li, J.; Viehland, D.; Zhuang, X. A review on applications of magnetoelectric composites: From heterostructural uncooled magnetic sensors, energy harvesters to highly efficient power converters. J. Phys. D 2018, 51, 263002. [Google Scholar]
- Wang, Y.; Li, J.; Viehland, D. Magnetoelectrics for magnetic sensor applications: Status, challenges and perspectives. Mater. Today 2014, 17, 269–275. [Google Scholar]
- Dong, S.; Li, J.F.; Viehland, D. Characterization of magnetoelectric laminate composites operated in longitudinal-transverse and transverse–transverse modes. J. Appl. Phys. 2004, 95, 2625–2630. [Google Scholar]
- Chu, Z.; PourhosseiniAsl, M.; Dong, S. Review of multi-layered magnetoelectric composite materials and devices applications. J. Phys. D 2018, 51, 243001. [Google Scholar]
- Chu, Z.; Shi, H.; Shi, W.; Liu, G.; Wu, J.; Yang, J.; Dong, S. Enhanced Resonance Magnetoelectric Coupling in (1-1) Connectivity Composites. Adv. Mater. 2017, 29, 1606022. [Google Scholar]
- Dong, C.; Liang, X.; Gao, J.; Chen, H.; He, Y.; Wei, Y.; Zaeimbashi, M.; Matyushov, A.; Sun, C.; Sun, N.X. Thin Film Magnetoelectric Sensors toward Biomagnetism: Materials, Devices, and Applications. Adv. Electron. Mater. 2022, 8, 2200013. [Google Scholar]
- Zuo, S.; Schmalz, J.; Ozden, M.; Gerken, M.; Su, J.; Niekiel, F.; Lofink, F.; Nazarpour, K.; Heidari, H. Ultrasensitive Magnetoelectric Sensing System for Pico-Tesla MagnetoMyoGraphy. IEEE Trans. Biomed. Circuits Syst. 2020, 14, 971–984. [Google Scholar] [CrossRef]
- Annapureddy, V.; Palneedi, H.; Yoon, W.; Park, D.; Choi, J.; Hahn, B.; Ahn, C.; Kim, J.; Jeong, D.; Ryu, J. A pT/√Hz sensitivity ac magnetic field sensor based on magnetoelectric composites using low-loss piezoelectric single crystals. Sens. Actuat. A-Phys. 2017, 260, 206–211. [Google Scholar] [CrossRef]
- Juanjuan, Z.; Han, D.; Xia, X.; Fang, C.; Weng, G.J. Theoretical study on self-biased magnetoelectric effect of layered magnetoelectric composites. Mech. Mater. 2021, 151, 103609. [Google Scholar]
- Ma, J.N.; Xin, C.Z.; Ma, J.; Lin, Y.H.; Cewen, N. Design and analysis of a self-biased broadband magnetoelectric cantilever operated at multi-frequency windows. AIP Adv. 2017, 7, 035013. [Google Scholar] [CrossRef]
- Sternickel, K.; Braginski, A.I. Biomagnetism using SQUIDs: Status and perspectives. Supercond. Sci. Tech. 2006, 19, 160–171. [Google Scholar] [CrossRef]
- Janosek, M.; Butta, M.; Dressler, M.; Saunderson, E.; Novotn, D.; Fourie, C.J. 1-pT Noise Fluxgate Magnetometer for Geomagnetic Measurements and Unshielded Magnetocardiography. IEEE Trans. Instrum. Meas. 2020, 69, 2552–2560. [Google Scholar] [CrossRef]
- Jingxiang, S.; Florian, N.; Fichtner, S.; Thormaehlen, L.; Kirchhof, C.; Meyners, D.; Quandt, E.; Wagner, B.; Lofink, F. AlScN-based MEMS magnetoelectric sensor. Appl. Phys. Lett. 2020, 117, 132903. [Google Scholar]
- Glavan, G.; Belyaeva, I.A.; Shamonin, M. Multiferroic Cantilevers Containing a Magnetoactive Elastomer: Magnetoelectric Response to Low-Frequency Magnetic Fields of Triangular and Sinusoidal Waveform. Sensors 2022, 22, 3791. [Google Scholar] [CrossRef]
- Turutin, A.V.; Vidal, J.V.; Kubasov, I.V.; Kisyuk, A.M.; Kiselev, D.A.; Malinkovich, M.D.; Parkhomenko, Y.N.; Kobeleva, S.P.; Kholkin, A.L.; Sobolev, N.A. Highly sensitive magnetic field sensor based on a metglas/bidomain lithium niobate omposite shaped in form of a tuning fork. J. Magn. Magn. Mater. 2019, 486, 165209. [Google Scholar] [CrossRef]
- Petrie, J.; Viehland, D.; Gray, D.; Mandal, S.; Sreenivasulu, G.; Srinivasan, G.; Edelstein, A.S. Enhancing the sensitivity of magnetoelectric sensors by increasing the operating frequency. J. Appl. Phys. 2011, 110, 124506. [Google Scholar] [CrossRef]
- Ou-Yang, J.; Liu, X.; Zhou, H.; Zou, Z.; Yang, Y.; Li, J.; Zhang, Y.; Zhu, B.; Chen, S.; Yang, X. Magnetoelectric laminate composites: An overview of methods for improving the DC and low-frequency response. J. Phys. D 2018, 51, 324005. [Google Scholar]
- Lei, L.; Chen, X.M. Magnetoelectric characteristics of a dual-mode magnetostrictive/piezoelectric bilayered composite. Appl. Phys. Lett. 2008, 92, 072903. [Google Scholar] [CrossRef]
- Chen, L.; Li, P.; Wen, Y.; Zhu, Y. Resonance magnetoelectric couplings of piezoelectric ceramic and ferromagnetic constant-elasticity alloy composites with different layer structures. J. Alloys Compd. 2013, 555, 156–160. [Google Scholar]
- Laletin, V.M.; Filippov, D.A.; Poddubnaya, N.N.; Manicheva, I.N.; Srinivasan, G. Specific Features of the Magnetoelectric Effect in Permendur–Quartz–Permendur Structures in the Region of Electromechanical Resonance. Tech. Phys. Lett. 2019, 45, 436–438. [Google Scholar] [CrossRef]
- Bian, L.; Wen, Y.; Wu, Y.; Li, P.; Wu, Z.; Jia, Y.; Zhu, Z. A Resonant Magnetic Field Sensor With High Quality Factor Based on Quartz Crystal Resonator and Magnetostrictive Stress Coupling. IEEE Trans. Electron Devices 2018, 65, 2585–2591. [Google Scholar]
- Aharoni, A. Demagnetizing factors for rectangular ferromagnetic prisms. J. Appl. Phys. 1998, 83, 3432–3434. [Google Scholar] [CrossRef]
- Burdin, D.A.; Chashin, D.V.; Ekonomov, N.A.; Fetisov, L.Y.; Fetisov, Y.K.; Sreenivasulu, G.; Srinivasan, G. Nonlinear magneto-electric effects in ferromagnetic-piezoelectric composites. J. Magn. Magn. Mater. 2014, 358, 98–104. [Google Scholar] [CrossRef]
- Shen, Y.; Gao, J.; Wang, Y.; Li, J.; Viehland, D. High non-linear magnetoelectric coefficient in Metglas/PMN-PT laminate composites under zero direct current magnetic bias. J. Appl. Phys. 2014, 115, 094102. [Google Scholar] [CrossRef]
- Sun, C.; Yang, W.; He, Y.; Dong, C.; Chen, L.; Chu, Z.; Liang, X.; Chen, H.; Sun, N.-X. Low-Frequency Magnetic Field Detection Using Magnetoelectric Sensor With Optimized Metglas Layers by Frequency Modulation. IEEE Sens. J. 2022, 22, 4028–4035. [Google Scholar]
- Lei, C.; Yao, W. Dependence of Modified Butterworth Van-Dyke Model Parameters and Magnetoimpedance on DC Magnetic Field for Magnetoelectric Composites. Materials 2021, 14, 4730. [Google Scholar]
Publisher’s Note: MDPI stays neutral with regard to jurisdictional claims in published maps and institutional affiliations. |
© 2022 by the authors. Licensee MDPI, Basel, Switzerland. This article is an open access article distributed under the terms and conditions of the Creative Commons Attribution (CC BY) license (https://creativecommons.org/licenses/by/4.0/).