Abstract
Accurate monitoring and prediction of tool wear conditions have an important influence on the cutting performance, thereby improving the machining precision of the workpiece and reducing the production cost. However, traditional methods cannot easily achieve exact supervision in real time because of the complexity and time-varying nature of the cutting process. A method based on Digital Twin (DT), which establish a symmetrical virtual tool system matching exactly the actual tool system, is presented herein to realize high precision in monitoring and predicting tool wear. Firstly, the framework of the cutting tool system DT is designed, and the components and operations rationale of the framework are detailed. Secondly, the key enabling technologies of the framework are elaborated. In terms of the cutting mechanism, a virtual cutting tool model is built to simulate the cutting process. The modifications and data fusion of the model are carried out to keep the symmetry between physical and virtual systems. Tool wear classification and prediction are presented based on the hybrid-driven method. With the technologies, the physical–virtual symmetry of the DT model is achieved to mapping the real-time status of tool wear accurately. Finally, a case study of the turning process is presented to verify the feasibility of the framework.
1. Introduction
Cutting tools, as key components of the Computer Numerical Control Machine Tool (CNCMT), significantly affect the quality of machined products and the safety of the CNCMT. Owing to the rapid development of material science, difficult-to-machine alloys are gradually being applied in the manufacturing industry (particularly the aerospace industry), which imposes high demands for the machining quality of workpieces. The temperature increase in the tool and workpiece is intensified, and the adhesion layer and hard abrasive particles appear on the tool surface during machining, resulting in excessive wear and fractures of the cutting tool in a short time. The inferior surface quality caused by tool wear makes a significant influence on the performance of the workpiece through deterioration in the structural strength, fatigue life, reliability, chemical stability, etc. [1]. To improve workpiece performance, tool substitution must be conducted after the wear exceeds a certain threshold such that the cutting cost can be reduced. From the perspective of industrial companies, the main target is to manufacture components with high performance at minimum cost and in a minimum amount of time. If manufacturers can obtain the real-time tool wear condition and change the cutting tool within the wear standard, the production efficiency and workpiece performance can be improved significantly.
Previously, the computer vision approach has been widely used to monitor the tool wear condition based on captured wear images of the tool edge. Considering that the chip and workpiece hide the flank and tool edge, the cutting process must be paused to capture images of cutting tools; this increases the downtime of the CNCMT and decreases the processing efficiency. Another typically used method is indirect measurement, which realizes tool wear monitoring and prediction by extracting the signals of the cutting process, such as the cutting force, vibration, acoustic emission signals, etc. It is known that the tool system status and environmental conditions change dynamically during machining. Although the indirect method offers real-time monitoring, the measurement precision is typically less than the precision of the direct method due to the status variety. Hence, a method that can reflect the actual condition of the cutting tool wear in real time is necessary.
Digital Twin (DT) technology provides a solution to the aforementioned problems in tool wear monitoring. The theory of DT has been utilized gradually in product design, manufacturing, and service since it was first proposed by Grieves in 2003 [2]. A typical definition of DT acknowledged by most scholars is that DT is an integrated simulation of multi-physics, multi-scale, multi-domain, and multi-context for a product or process based on fully utilizing data from the physical space and mapping the physical characteristics into the virtual space. Using DT technology, not only can the exact match between physical system and virtual model be conducted, but decisions can also be transferred from a virtual space to a physical space [3]. During cutting, the symmetrical DT model can be optimized continuously to keep consistency with the physical system such that it achieves higher accuracy and fidelity. Subsequently, the simulation data are processed to predict the tool wear value, and the results are returned to the physical system to guide tool substitution. Hence, DT can realize a more accurate monitoring and prediction of tool wear over time.
Under the current situation mentioned above, a novel tool wear monitoring method based on DT is proposed herein and the key enabling technologies are described. In terms of the cutting mechanism, a virtual cutting tool model is built to simulate the cutting process, mapping the physical space accurately in real time. The modifications and data fusion of the model are carried out to keep the symmetry between physical and virtual systems. With the dataset, a hybrid-driven model is developed to dynamically monitor and predict the cutting tool wear via kNN and SVM. A multi-view synchronization interface is presented to demonstrate the cutting process screen, simulation process, and all data plots in real time. Within the framework of the DT method, tool wear monitoring and prediction can be achieved with high accuracy over time.
The rest parts of this paper are organized as follows. In Section 2, studies related to tool wear and DT technology are introduced. In Section 3, a framework for the tool system DT model is proposed, and the organization and operational rationale of the physical and virtual systems are described comprehensively. The key enabling technologies are detailed in Section 4. Following this, a case study for the turning process is performed using the DT model is provided in Section 5. Finally, Section 6 presents the conclusions of this study.
2. Related Studies
2.1. Studies Regarding Tool Wear Prediction
Nowadays, scholars have conducted much research regarding tool wear condition monitoring extensively, which are classified into direct and indirect measurements. Table 1 summarizes the studies pertaining to tool wear monitoring in recent years. In direct measurement methods, the tool wear condition is monitored by observing wear images directly based on computer vision technology. Ong, et al. [4] acquired tool wear images and extracted a descriptor of the wear zone, after which Wavelet Neural Network (WNN) was applied to predict the wear value of the cutting tool with higher accuracy compared with ordinary Artificial Neural Network (ANN) and statistical models. García-Ordás, et al. [5] utilized B-ORCHIZ to categorize cutting tool wear in the edge profile milling process, facilitated by Support Vector Machine (SVM). Subsequently, hierarchical cluster analysis was performed to label the prototype images for wear levels. Moldovan, et al. [6] designed a tool flank wear monitoring system based on image acquisition and processing, as well as classified wear images using a two-hidden-layer auto-encoder ANN. Sun and Yeh [7] presented an approach for designing a visual inspection system mounted on a turning machine tool. The amount of wear in the captured image was calculated to assess the normal wear or over-wear condition. The tool edge and flank are generally covered by the chip and workpiece; as such, tool wear images cannot be obtained during the cutting process. Therefore, cutting must be suspended when extracting the tool-wear images, which decreases the production efficiency.

Table 1.
Findings of tool wear monitoring.
Compared with direct measurements, indirect measurements enable real-time monitoring by analyzing the signals from sensing devices. Some scholars extracted tool wear features from signals and then analyzed the physical properties of the signals via time and frequency-domain analyses to predict the tool wear condition. Duo, et al. [8] extracted all the statistical features of internal and external signals in the time domain to identify the most sensitive signals to tool wear. To predict the tool wear, they proposed an approach that was based on automatic learning algorithms. Klocke, et al. [9] proposed a method that uses an effective power signal combined with a prediction model to obtain the real-time tool wear status, thereby enabling the further investigation of online tool wear monitoring systems. Tangjitsitcharoen and Lohasiriwat [10] presented an in-process tool wear monitoring system for CNC turning via wavelet transform. A tool wear prediction formula was proposed based on the exponential function, which comprised the decomposed cutting force ratio, cutting velocity, thickness of cut, and feed rate. Shi, et al. [11] launched an Ensemble Empirical Mode Decomposition (EEMD) method based on the entropy and correlation of the cutting force signal. An automatic detector was presented utilizing the Cumulative SUM (CUSUM) control chart to monitor tool chipping and tool wear failure.
With the development of artificial intelligence technology, more scholars are using machine learning methods to monitor and predict tool wear conditions. Kothuru, et al. [12] analyzed sound signals acquired from the machining process to extract signal features that correlate with the actual cutting. Audible sound signals were used as a sensing approach to detect the cutting tool wear and failure during end milling using the Support Vector Machine (SVM) model. Li, et al. [13] presented a deep convolutional neural network by combining the concepts of a recursive residual network and a dense network to perform tool wear monitoring and prediction. Chen, et al. [14] integrated a Convolutional Neural Network (CNN) and a bidirectional Long Short-term Memory (BiLSTM) network to monitor the tool wear state during milling. Kong, et al. [15] proposed a hybrid WOA-SVM model, which integrates the Whale Optimization Algorithm (WOA) and Support Vector Machine (SVM). Using this model, the original signals were used to monitor and predict tool wear. Shen, et al. [16] developed a new machine learning method that considers machining parameters as inputs and generates features for tool wear prediction. The experimental results were consistent with the predicted results in terms of the averaged squared error values. Cai, et al. [17] presented a hybrid model for tool wear prediction based on Long Short-term Memory network (LSTM), where a stacked LSTM was used to extract the features. A nonlinear regression model was formed to predict the tool wear value.
In summary, the existing methods, including direct and indirect measurements, have various disadvantages and cannot satisfy the requirement for instantaneity and high accuracy in tool wear monitoring and prediction. Owing to the advancement of new technology, cyber-physical systems such as DT have been applied in the manufacturing industry and resulted in lower delays and higher accuracy of tool wear monitoring.
2.2. Digital Twin-Driven Machining Process
DT was first proposed by Grieves in 2003. It creates a virtual model of a physical entity digitally, simulates the behaviors of the physical entity with the aid of data, and conducts the interaction and fusion between the physical system and information world through interactive feedback, data analysis, iterative optimization, and other methods. Driven by Industry 4.0, IoT technology, and big data analysis [18], DT technology has been highlighted in the field of intelligent manufacturing. Scholars have conducted studies pertaining to the application of DT in the manufacturing industry, including robotic machining, process planning, and machine tool monitoring, as shown in Table 2.
Table 2.
Findings of DT in manufacturing.
In robotic machining, Pérez, et al. [19] utilized the DT methodology to process automation, enhanced implementation, and real-time monitoring during robotic machining. Bilberg and Malik [20] presented a simulation approach based on DT in a flexible assembly cell coordinated with a robot to perform assembly tasks alongside humans. In the methodology, the lean production methods of manual assembly are combined into human–robot collaboration, thereby facilitating flexible human–robot work teams. Studies pertaining to process planning have been conducted in recent years. Zhao, et al. [21] utilized DT technology to guide process planning and developed a hierarchical model and mapping strategy for machining. Biesinger, et al. [22] presented a DT model for the body-in-white production system based on current resources, products, and process information from a cyber-physical system. The model was evaluated based on an actual body-in-white production system. Liu, et al. [23] demonstrated a new process planning evaluation method via DT technology, in which the real-time mapping mechanism and the DT-based machining process evaluation framework were illustrated. Furthermore, the aforementioned model was verified based on the key components of a marine diesel engine. Leng, et al. [24] utilized DT technology for the rapid reconfiguration of automated manufacturing systems to accommodate process planning. From the perspective of machine tools, Tong, et al. [25] proposed an intelligent manufacturing tool DT model with the purpose of further manufacturing data analysis and optimization, including dynamic, contour error estimation, and compensation. Luo, et al. [26] investigated a multi-domain modeling method of DT for the CNCMT and discovered that it can decrease the abrupt fault probability as well as improve the performance and stability of the CNCMT. In studies regarding the CNCMT DT, the fault prediction strategy and the DT model were described. Wang, et al. [27] proposed a DT-based bidirectional operation framework, aiming at realizing energy-efficient manufacturing systems. This model describes the physical systems in a virtual space, performs simulation analysis, and controls the physical systems for various energy-saving purposes. For enhanced machining tool condition monitoring and prediction, Qiao, et al. [28] investigated a hybrid model approach based on DT and deep learning. In that study, a five-dimensional DT model combined with Deep Stacked Gated Recurrent Unit (DSGRU) was utilized for data analysis to perform system prediction. Considering the complexity and volatility of the CNCMT, Wei, et al. [29] proposed an updated DT method with performance attenuation. In that study, the method was investigated based on the performance attenuation update framework. Luo, et al. [30] illustrated a hybrid model based on the DT method to realize the predictive maintenance of a CNCMT. Tao, et al. [31] presented a new approach for product-lifestyle-based DT technology; the framework and application of DT-driven product design, manufacturing, and service after sale were described comprehensively. Cheng, et al. [32] elaborated the interplay and relationship between DT and Industrial Internet. Subsequently, a DT-enhanced Industrial Internet (DT-II) reference framework for smart manufacturing was proposed. Liu, et al. [33] investigated the multi-scale evolution mechanism of the DT model and constructed a DT quality knowledge model at macro, meso, and micro levels.
DT technology is used extensively in the manufacturing industry. However, studies regarding DT-based tool wear monitoring are scarce. Hence, DT should be utilized in the study of tool wear.
3. DT Model
3.1. Framework
As shown in Figure 1, the cutting tool system DT framework presents is relatively reliable for real-time tool wear condition monitoring. It comprises five primary components: the physical tool system, virtual tool system, cutting tool service system, DT data of tool system, and connections among the abovementioned components.
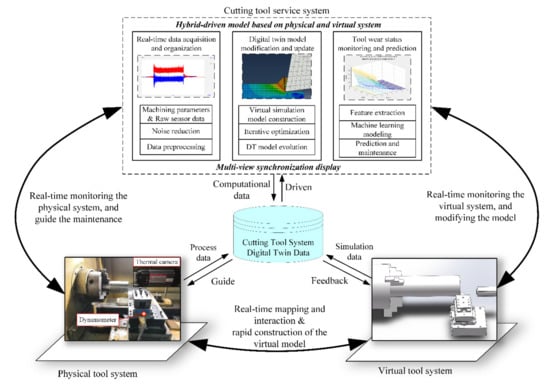
Figure 1.
Cutting tool system digital twin framework.
- (1)
- Physical tool system
The physical tool system comprises all physical entities in the cutting process. The significant components are the cutting tool system, sensing devices, and the surrounding environment where the physical cutting process is carried out. Advanced sensing technologies, including hyper-sensitized sensing, high-accuracy, low-delay communication, and heterogeneous multi-protocol data integration, have been utilized to perceive the tool system status in real time.
- (2)
- Virtual tool system
Based on the machining and tool wear mechanisms, rapid construction and modification of the virtual tool system is conducted, which duplicates the physical cutting process and achieves the symmetrical simulation in the properties and behaviors of the cutting tool (introduced in Section 4.1 in detail). It includes a high-synchronization virtual geometrical model, high-accuracy virtual material model, high-fidelity virtual environment model, and high-symmetry behavior model. The simulated results are compared with the physical experimental results to verify the consistency of the built virtual model, which is simulated and modified iteratively to mirror the physical system.
- (3)
- Cutting tool service system
The cutting tool service system provides assistance in monitoring and predicting the cutting tool wear condition, where the hybrid-driven model based on the physical and virtual system is presented (introduced in Section 4.3). Its primary function is to process massive data from physical and virtual spaces, predict tool wear, and perform model updating and evolution. In the cutting tool service system, many methods are utilized, including data preprocessing and noise reduction, multi-dimensional feature selection, and machine learning algorithms.
- (4)
- DT data
The cutting tool system of DT data combines material data, geometrical data, cutting force, temperature distribution, vibration, etc. The data are categorized into four types: property data, command data, dynamic condition data, and wear data. The property data, which can be acquired from manuals or measured directly, describe the natural static attributes of the cutting tools and workpiece. The command data primarily include the operation information of the machine tool and the environment data. The dynamic condition data comprise real-time status signals that can be monitored online. The wear data contains detailed information of the tool wear. Section 4 introduces the definition and fusion of the DT data of the tool system comprehensively.
- (5)
- Connections
Various connections exist among the abovementioned components. The physical tool system provides real-time processing data for the virtual tool system and maps the machining mechanisms to the virtual system. The real-time condition monitored in the physical system is conveyed to the cutting tool service system, which consequently guides the maintenance of the cutting tool. Simultaneously, the virtual system is monitored by the service system and evolves continuously with the service system. The DT gathers all data from the physical, virtual, and service systems and feeds corresponding decisions back to them.
Generally, all components of the framework are associated closely with each other. As the foundation of the digital model, the physical tool system generates a significant amount of process data that are transported to the virtual tool system. With the data from the physical system and domain knowledge, rapid construction of the virtual model is proceeded to mirror the actual cutting process. Subsequently, the data generated by the virtual tool system are transported to the cutting tool service system in a timely manner, together with the data from the physical system. In the cutting tool service system, a hybrid-driven model is built: firstly, all raw data from the physical and virtual systems are processed to eliminate noise and interference signals; secondly, the virtual system is modified by comparing the error between the physical and virtual systems, thereby realizing the evolution of the DT model; finally, the tool wear status is predicted based on the extracted data with the help of machine learning algorithms. Data visualization is performed, where data are shown in the physical entity and virtual simulation views, yielding a multi-view synchronization interface. The service system feeds back real-time manufacturing commands to the physical and virtual tool systems, after which the virtual tool system can predict the cutting tool wear degree and guide the actual manufacturing process in the physical system. All generated data are stored in the DT dataset.
3.2. Organization and Operational Process
The organization of the DT framework of the tool system presented herein is shown in Figure 2. In the DT model, the cutting process is classified into three layers (i.e., construction of a working environment, modeling of tool system, and implementation of cutting behavior) that proceed in a physical space and virtual space, separately. The working environment and tool system parameters in the physical space are recorded, and the real condition of the tool system is monitored by sensors during cutting. All parameters are copied to the virtual system, and then the virtual simulation is conducted, modified, and verified in the virtual space. A progressive relationship exists among the three layers. The cutting tool system exists in the working environment, both of which are the foundation of the cutting process. The detailed workflow is as follows:
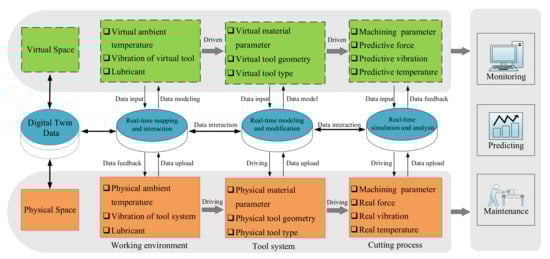
Figure 2.
Organization of the cutting tool system DT model.
- (1)
- In the working environment layer, the relevant physical environmental parameters, such as the external temperature and humidity, were first confirmed to build the environment in the virtual space. Considering the tool vibration and possible lubricant in the physical tool system, the virtual vibration and lubricant must be modeled to obtain the virtual working environment. At the same time, the virtual environment model is modified to maintain its high fidelity through interactions with the physical environment.
- (2)
- In the tool system layer, the material and geometry parameters of the cutting tool and workpiece are confirmed. The material data determine the constitutive model and damage mechanisms of the tool and workpiece. The virtual tool geometry model is mapped using detailed tool geometry data (including the tool rank angle, clearance angle, and tool edge size, etc.). Using the relevant parameters, the virtual tool system closely resembles the physical system. The geometrical model is updated during the cutting process, and the model modifies the material parameters as the temperature changes.
- (3)
- In the cutting process layer, all sensors extract data, including the cutting force, temperature, and vibration from the physical cutting process. Meanwhile, real-time simulation in the virtual space continues incessantly. The virtual cutting process is modified iteratively by comparing the data error between the physical and virtual tool systems. Following this, the tool wear status is monitored and predicted using machine learning method based on DT data, thereby realizing the maintenance of the worn cutting tool in real time.
4. Key Enabling Technologies
4.1. Rapid Construction of the Tool System Virtual Model
A symmetrical virtual model was built, as shown in Figure 3. The complex cutting process is mapped accurately with the aid of data and domain knowledge from the physical space.
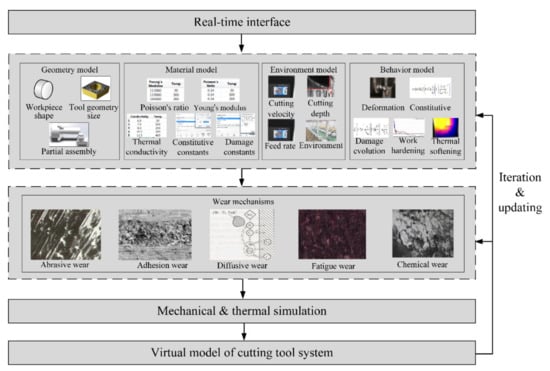
Figure 3.
Virtual model of the cutting tool system.
The virtual model of the cutting tool system integrates the geometry model, material model, environment model, and behavior model of the tool and workpiece. These models are described as follows:
- Geometry model
The geometry model describes the geometrical information of the cutting tool system, including the initial geometry and in-process geometry. The initial geometry, which represents the shape of the workpiece and tool, depicts the cutting tool rank angle, clearance angle, tool edge geometry size, workpiece diameter, and length, as indicated in Equation (3). The in-process geometry reflects the changing geometry. During cutting, the feed rate, cutting depth, and cutting time determine the material removal value, and the tool wear is determined by the tool wear rate. Hence, the in-process geometry can be calculated based on the initial geometry minus the removed material and tool wear, as shown in Equation (4), where Δt is the cutting time and dw/dt represents the wear rate:
- 2.
- Material model
The material model is the integration of the material characteristics of the actual cutting tool and workpiece, as indicated in Equation (5). In the equation, Ds, Ym, Pr, Ep, Tc, Sh, Cc, and Dc are the density, Young’s modulus, Poisson’s ratio, expansion, thermal conductivity, specific heat, constitutive constants, and damage constants, respectively, which are the static properties of the tool and workpiece.
- 3.
- Environment model
The environment model is a parametric replica of the machining environment that encompasses the surrounding environment and cutting parameters. The air humidity, room temperature, power voltage, and process parameters involved are as follows:
- 4.
- Behavior model
The behavior model of the cutting tool system describes the behaviors and mechanisms of the cutting process, i.e., the deformation and damage processes of the workpiece accompanied by work hardening and thermal softening, keeping the symmetry with the actual cutting process. Therefore, the constitutive model, i.e., the damage model, and tool system status (cutting force, temperature, and vibration) models are involved in the behavior model, as indicated in Equation (7):
The constitutive model is used to illustrate the deformation process, and the damage criteria depict the damage evolution, as shown in Equations (8) and (9), respectively. In Equation (8), constitutive is the constitutive function, ma is the material data, te is the relative temperature parameter, and gm represents the geometry data of the cutting tool. In Equation (9), damage represents the damage criteria function, whereas ma, te, and gm are the same as those for Equation (8):
The cutting force, temperature, and vibration reflect the running condition of the tool system, and they can be calculated using the constitutive and damage models. The prediction formula is expressed in Equation (10), in which the condition is on behalf of the function, and mc is the machining parameter. The constraints guarantee that the cutting force is within the maximum cutting force of the machine tool, and the machining parameters are within the range of the designed parameters:
Different wear mechanisms occur during cutting, including abrasive wear, adhesive wear, diffusive wear, fatigue wear, and chemical wear. The appearances and sizes of the wear zones differ from each other. For fatigue wear and chemical wear, the feature size of the wear zone is difficult to obtain. In this paper, three wear mechanisms, including abrasive wear [34], adhesive wear [35], and diffusive wear [36], are covered in the virtual model. The total tool wear can be calculated as Equations (11)–(14). In the equations, G, A, B, and R are the material data; σ is the normal stress; v and vs. are the cutting velocity and relative sliding velocity, respectively; and E represents the activation energy. All data were obtained and calculated using the virtual model.
During the construction of the virtual model, all the data are classified into four categories: property data, command data, dynamic condition data, and wear data, as shown in Table 3. The property data describe the natural attributes of the cutting tool and workpiece. The command data primarily include information regarding the machine tool operation and the environment. The dynamic condition data contain real-time status signals obtained dynamically online via sensors. The wear data contain detailed information regarding the tool wear.
Table 3.
Definition of the cutting tool system digital twin data.
4.2. Modification and Data Fusion of the Tool System Virtual Model
The virtual model was modified as illustrated in Figure 4.
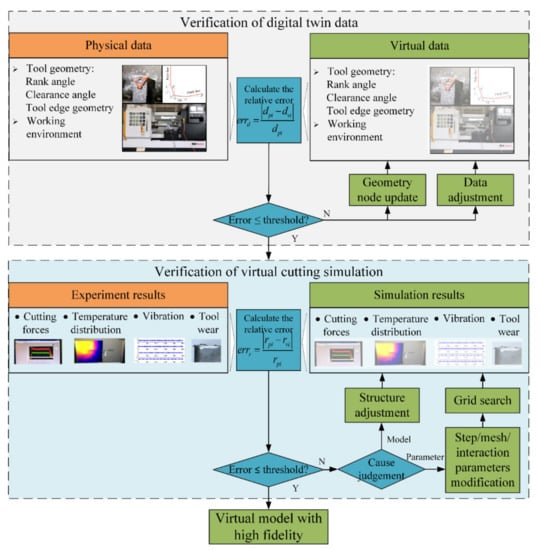
Figure 4.
Workflow of verifying the accuracy.
Firstly, data pertaining to the virtual model that belong to the factors affecting the cutting process performance are verified. Some of the DT data are offline data that could not be modified during cutting and need not be modified in real time. The other set of dynamic data reflect the tool wear condition, such as the tool geometry data and environment data. The real-time relative errors of the dynamic data are calculated using Equation (15), where dpi and dvi are the ith index of the physical and virtual models, respectively. After tool wear occurred, the original tool surface deformed, and the nodes on the original face also have a displacement. If the relative errors of geometry size reach the predefined threshold, the node of the tool surface will be updated to modify the virtual geometry model until the errors are sufficiently small. The updating scheme for the node is shown in Figure 5. If the environmental relative error reaches the set threshold, then the responding parameters in the virtual environment model will be adjusted to reduce the error.
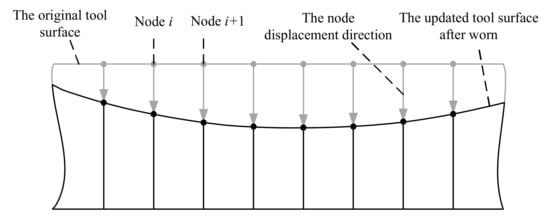
Figure 5.
Node updating scheme of tool surface.
The relative errors of the real-time results (i.e., real-time condition data and wear data) between the physical experiment and virtual simulation are expressed as shown in Equation (16). In the equation, rip and riv are the ith data of the physical and virtual systems, respectively. If the errors exceed the threshold, then the physical and virtual systems are inconsistent. After the cause is identified, the model structure is adjusted, or the step, mesh, and interaction parameters of the simulation process are modified to repeat the simulation.
After modifying the cutting tool system of the virtual model, the fusion of the massive multi-source heterogeneous data is conducted, as shown in Figure 6. During cutting, the property data and command data from the physical space are matched with those of the virtual space at time t. In the physical system, voltage and current signals from sensors reflect the cutting force and temperature in-formation of tool system. Before experiments, the relation between voltage and force can be defined by the calibration test. In this case, the real cutting tool condition, such as the cut-ting force and temperature, can be calculated. In virtual space, the stress, strain, and temperature can be simulated, and the simulated condition (cutting force and temperature) of virtual cutting tool can be obtained directly. Then, the relative error of force, temperature, and vibration can be calculated respectively. The errors from time 1 to j and the j*3 error matrix are obtained, expressed as:
ERR_Fk, ERR_Tk, and ERR_Vk represent the relative error of the cutting force, temperature, and vibration between physical and virtual spaces in time k. To clean the outlier, the whisker chart is utilized. In the whisker chart, the standard of outlier can be calculated by , where the Q3 and Q1 are the upper quartile and lower quartile of a column in the matrix. If the element in a column exceeds the standard, the relative ERR element will be cleaned. The average error of the rest ERR elements can be calculated as follows:
where a, b, and c are the number of the effective errors of force, temperature, and vibration, after cleaning the outlier. If the mean value exceeds the threshold, the effective percent of the elements in the matrix ERR over the threshold can be calculated by:
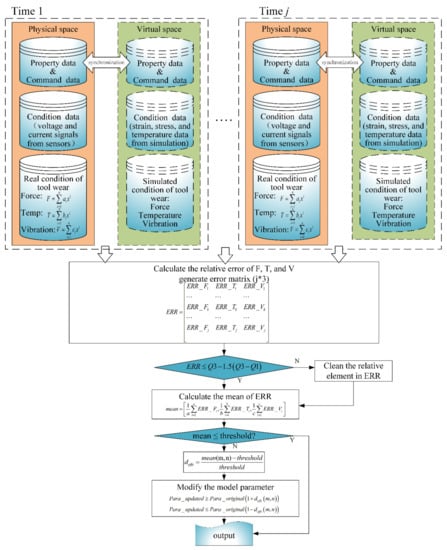
Figure 6.
Data fusion of the cutting tool system digital twin.
In terms of the percent, the model parameters of force, temperature, and vibration are updated by the respective deffe:
If the parameter is negatively associated with the model, the first equation is utilized. If it is positively associated with the model, select the second equation. Using the two equations, the range of updated parameter can be determined. In the equations, Para_updated and Para_original are the parameter after and before updating, reapectively.
4.3. Hybrid-Driven Model Based on Cutting Process and Simulation
In this section, a hybrid model is presented based on raw signals from the physical space. Data processing algorithms are applied to the hybrid-driven model, in which the algorithms are trained based on the obtained historical data. Finally, tool wear can be predicted based on the processed data and compared with the results of the physical system and theoretical predictions. Figure 7 shows the hybrid model workflow.
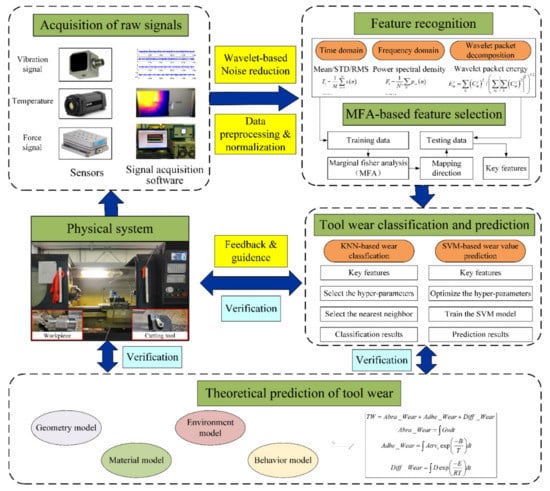
Figure 7.
Workflow of the hybrid-driven model.
It is inevitable that the condition signals extracted from sensing devices contain noise from a complex external environment. Reducing noise signals has a significant impact on obtaining the actual condition of the tool system, in which the wavelet de-noise method is utilized. Following noise reduction, data preprocessing is proceeded to convert the extracted data to a dimensionless quantity to achieve a higher monitoring accuracy.
The raw signals contain a significant amount of information, which is difficult to manage directly. Hence, feature recognition should be conducted to identify the features of the status signals in the time, frequency, and time-frequency domains. The signal features can be calculated directly using the equations listed in Table 4. The redundancy among excessive features can incur a significant amount of time for diagnosis and prediction, thereby decreasing the efficiency of the model. If the features are insufficient, then some important information would be lost. The features that sufficiently affect the health condition of the tool system are selected among all identified features via Marginal Fisher Analysis (MFA). All signal features calculated are segregated into a training set and a testing set. Using the training set, the marginal fisher function is established, and the mapping direction of the low-dimensional space is acquired. The crucial features of the testing set can be computed using the mapping direction.
Table 4.
Some signal features equations.
Different wear types occur during the cutting process, and their appearances and crucial sizes differ from each other. KNN-based classification algorithms are developed using the selected features to classify tool wear. Meanwhile, the tool wear value is predicted via SVM, where the RBF kernel is selected and the hyper-parameters are optimized by PSO to train the SVM model. The predicted results are compared with the results of the physical system and theoretical prediction in Section 4.1 to verify the classification and prediction of tool wear. After performing the high-accuracy calculation, the results are fed back to the physical and virtual spaces, thereby avoiding or decelerating tool wear.
5. Case Study
The widespread adoption of diamond-insert turning tools in axis components is crucial for monitoring their wear condition. The high-precision tool wear prediction of diamond inserts can enable the timely replacement of worn tools, thereby reducing the production cost and achieving the designed performances of products. Currently, a tool substitution policy is performed based on technical manuals and worker experiences; in this regard, the proposed symmetrical DT model is a more scientific and beneficial approach.
5.1. Data Acquisition
The data acquisition platform includes a CNC lathe, diamond carbide insert tool, Inconel 718 bar, and sensing devices, as shown in Figure 8. The three-direction force during the cutting process is measured using a Kistler 9257 B dynamometer. Considering the effect of temperature on tool wear, the temperatures of the tool and workpiece is measured in real time. In this platform, a FLIR A325 infrared thermal camera is chosen for convenience. After dismantling the knife tower, a dynamometer is installed on the workbench. Subsequently, a tool holder is installed on the dynamometer by a customized fixture.
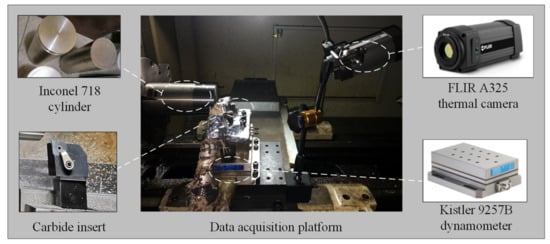
Figure 8.
Data acquisition platform of the turning process.
The machining parameters of the physical cutting process are presented in Table 5. The sampling frequency of the dynamometer is 30 kHz, and the infrared thermal camera records thermal images with a 406 × 240 LWIR resolution. The emissivity of the infrared thermal camera is set to 0.95 after performing standardization utilizing a thermal couple. The camera lens is directed toward the cutting area to obtain temperature images in real time. In this paper, only flank wear is observed, and the maximum width of the wear zone is measured as the tool wear value.
Table 5.
Material properties of the cutting tool and workpiece.
5.2. Realization of the Cutting Tool System DT Method
5.2.1. Realization of the Symmetrical Virtual Model
It is impossible to establish a DT model that can completely reflect all the details of the cutting process. Therefore, the turning process is simplified.
It can be observed that the cutting process is a thermal-mechanical coupling process. During the turning process, elastic and plastic deformations occurred, and a significant amount of heat is generated simultaneously. In the symmetrical model of the tool system, a simulation model coupled with dynamics and thermodynamics is developed. A simulation is conducted to resolve the force and temperature during the cutting process. Considering that the strain along the cutting speed and feed directions is much larger than that in the other directions, the strain in the radial direction of the workpiece is negligible. Therefore, the turning process of diamond inserts can be simplified to orthogonal turning problems in this study, as shown in Figure 9. The high-fidelity geometry model and material model are first established, in which the material properties are consistent with the physical entities, as shown in Table 6. Following this, a high-fidelity environment is established.
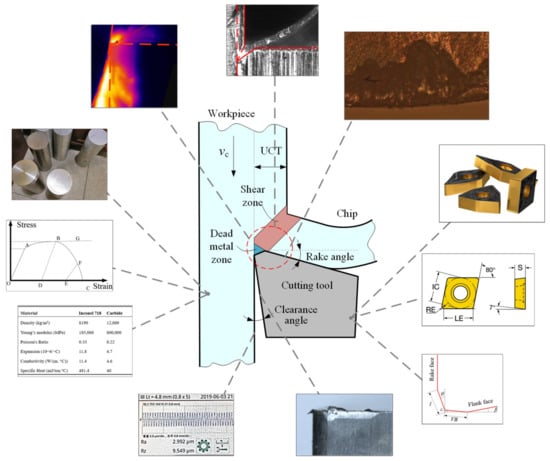
Figure 9.
Schematic diagram of the two-dimensional cutting process.
Table 6.
Material properties of the cutting tool and workpiece.
To simulate the turning process accurately, the Johnson–Cook constitutive model is used to define the plastic evolution; the model describes the stress, strain, and temperature during the turning process, as expressed in Equation (21):
where A is the initial yield strength, B is the hardening coefficient, is the equivalent plastic strain, is the equivalent plastic strain rate, n is the hardening index, C is the strain rate strengthening parameter, is the reference strain rate, Tr is the room temperature (generally is set as 20 °C), Tm is the melting temperature of the material, and m represents the thermal softening exponent. The Johnson–Cook material parameters of Inconel 718, as listed in Table 7, can be consulted from manuals [37].
Table 7.
Johnson–Cook material parameters of Inconel 718.
The Johnson–Cook damage criterion, as expressed in Equation (22), is utilized to describe failure initiation:
where σp, σMises, and are the hydrostatic pressure, von Mises equivalent stress, and equivalent plastic strain at the onset of damage, respectively; d1–d5 are the Johnson–Cook damage constants, as listed in Table 8.
Table 8.
Johnson–Cook damage parameters of Inconel 718.
The modeling space of the cutting tool system is set to two-dimensional planar, the part type is defined as deformable, the mesh element shape is set as quad-dominated, and the element is defined as an explicit coupled temperature-displacement type. In the interaction property manager, tangential behavior is selected. The friction formulation between the workpiece and tool is set as the penalty contact algorithm, which can achieve convergence quickly and easily. The temperature, force, and relative slip speed are recorded by field and historical output in the turning simulation, which can be utilized to calculate the tool wear rate.
Real-time updating of the DT is essential for achieving accurate mapping with a physical space. The dynamic conditions of the system can be categorized into two types, as follows:
- i.
- Working condition: Machining parameters, such as the cutting speed, feed rate, and cutting depth, are affected by vibration during cutting, which can be generated from the controller of the machine tool and directly affect the simulation results.
- ii.
- Geometry size: The geometric dimension change caused by tool wear during turning.
Before the next simulation is performed, the updated machining parameters and tool wear state from the last simulation are input to the model to update the virtual system of the cutting tool system.
5.2.2. Hybrid-Driven Model Realization
In the actual cutting process and experiment, the extracted data are the cutting force and temperature signals from the sensors and simulation software. The sensor drift caused by temperature variation contributed to the trend items in the original data. In addition, the original signals sampled typically overlap with noise signals, including periodic interference signals and random interference signals, which generate the sawtooth shape of the signal wave. To weaken the effect of the interfered signals and allow for a much smoother data variation graph, original data smoothing is performed using the Savitzky–Golay filtering algorithm, which is based on Least Square Principle.
Following data preprocessing, the features of the time domain are acquired, such as the root mean square value (RMS), mean value, and skewness coefficient, as shown in Table 9. The mean value is the average of the signal. The standard deviation reflects the degree of dispersion of the dataset; a higher standard deviation implies more discrete raw data. The RMS represents the average energy of the signal. The skewness coefficient reflects the symmetry of the signal: a system with high skewness deviates significantly from the normal status.
Table 9.
Signal features in the time domain.
In the frequency domain, a feature extraction method based on fourth-order moment estimation is utilized [38]. The standardized Power Spectral Density (PSD) pxx is separated into four segments, for ease of the balance between high distinguishability and low complexity of the calculation. The feature parameters are extracted from every divided segment, including four parameters, each based on fourth-order moment estimates of the power spectrum and fourth-order moment estimates of the frequency weighted by power. The load variation of the machine tool can result in fluctuations in the magnitude of the vibration spectra. Calculating the features of the power spectra without normalization affects the calculated features. Hence, the original PSD must be normalized prior to calculating the eight frequency-domain features. The following normalization equation is conducted:
In this formula, is the standard deviation of the original PSD. The extracted features of the frequency domain are listed in Table 10.
Table 10.
Signal features in the frequency domain.
The features in the time and frequency domains reflect the running status of the machine tool, whereas the signals from the machine tend to be nonstationary. Hence, wavelet packet decomposition is adopted to further construct the features. The normalized power value of the mth segment in the lth layer is extracted as follows:
where Cmj is the wavelet packet coefficient of the mth segment in the lth layer.
The features extracted from the original signal may contain some irrelevant and redundant features. If feature selection is not conducted, then the calculation complexity will increase and the computational accuracy will decrease, thereby reducing the running efficiency. MFA is utilized to select appropriate features with higher susceptibility to reflect the running status of the cutting tool system.
The cutting process is a complex, multi-variables, and nonlinear problem; hence, it is challenging to use a traditional mathematical model to predict the tool wear value and tool life. As a novel virtual method, machine learning offers a significant advantage in terms of prediction. The KNN and SVM are utilized to classify and predict cutting tool wear. When the model is trained, the PSO algorithm is applied to reduce the error between the actual wear and predicted value until the error is within the predesigned threshold. If the tool wear reaches the worn value, then the tool is replaced. Otherwise, the tool geometry is updated for the next prediction using the DT.
5.2.3. Multi-View Synchronization Interface in Real Time
A terminal display and control system is provided to tool users to observe the tool condition in real time such that timely decisions can be realized. The system integrates the cutting process information interface, dynamic video screen monitoring interface, virtual model interface, and tool condition plot. As shown in Figure 10, the multi-view synchronization tool wear real-time monitoring interface is presented in a user-friendly display. The real-time tool wear state data and cutting process data are shown at the interface. After cutting tool failures, maintenance warnings will be provided, thereby allowing operators or manufacturers to conduct the maintenance accordingly, e.g., tool replacement and grinding.
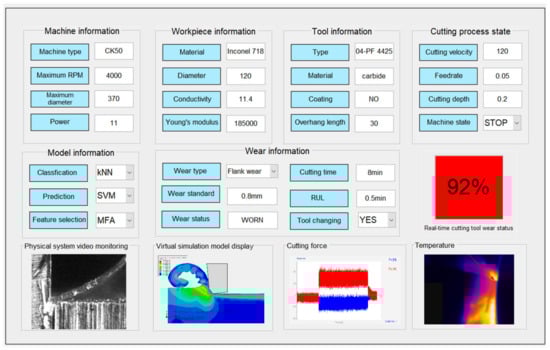
Figure 10.
Multi-view synchronization interface.
6. Conclusions and Future Works
Herein, a framework for tool wear monitoring and prediction driven by DT is proposed. The DT model is utilized to reflect the real-time working conditions. In terms of the cutting mechanism, a virtual cutting tool model is built to simulate the cutting process. The modifications and data fusion of the model are carried out to keep the symmetry between physical and virtual systems. Tool wear classification and prediction are presented based on the hybrid-driven method. Finally, a case study of the turning process is conducted to prove the feasibility of the proposed method; the real-time wear condition of the cutting tool can be displayed by the multi-view interface.
Owing to the complexity of the cutting process, the DT model of tool wear need to be improved further, and a more elaborate DT model will be investigated. The runout of tool nose and environmental temperature variation needs to be considered. In addition, the DT model needs to cover the entire life cycle of the tool, including the product design phase, manufacturing phase, and service phase. Because of the design parameters of the product, the process of the manufacturing and the working conditions of the service phase will have a direct impact on the tool life. It can not only help companies predict tool life, but also help companies improve tool life by optimizing product life cycles. More DT models need to be established, which helps companies accumulate a large amount of data to improve the accuracy of tool life prediction algorithms.
Author Contributions
Conceptualization, K.Z., Z.S., Z.G. and L.W.; methodology, Z.S.; software, Z.S.; resources, Y.S.; writing—original draft preparation, Z.S.; writing—review and editing, K.Z. and L.W.; project administration, K.Z., Z.G. and L.W. All authors have read and agreed to the published version of the manuscript.
Funding
This research was funded by the State Key Laboratory of Digital Manufacturing Equipment and Technology, grant number DMETKF2021005, and the Fundamental Research Funds for the Central Universities, grant number WUT: 2021III025JC, 2020IVB028.
Institutional Review Board Statement
Not applicable.
Informed Consent Statement
Not applicable.
Data Availability Statement
The data presented in this study are available on request from the corresponding author. The data are not publicly available due to the complexity of the data.
Conflicts of Interest
The authors declare no conflict of interest.
References
- Zhuang, K.J.; Fu, C.N.; Weng, J.; Hu, C. Cutting edge microgeometries in metal cutting: A review. Int. J. Adv. Manuf. Technol. 2021, 48. [Google Scholar] [CrossRef]
- Grieves, M. Digital twin: Manufacturing excellence through virtual factory replication. White Pap. 2014, 1, 1–7. [Google Scholar]
- Shangguan, D.; Chen, L.; Ding, J. A Digital Twin-Based Approach for the Fault Diagnosis and Health Monitoring of a Complex Satellite System. Symmetry 2020, 12, 1307. [Google Scholar] [CrossRef]
- Ong, P.; Lee, W.K.; Lau, R.J.H. Tool condition monitoring in CNC end milling using wavelet neural network based on machine vision. Int. J. Adv. Manuf. Technol. 2019, 104, 1369–1379. [Google Scholar] [CrossRef]
- García-Ordás, M.T.; Alegre, E.; González-Castro, V.; Alaiz-Rodríguez, R. A computer vision approach to analyze and classify tool wear level in milling processes using shape descriptors and machine learning techniques. Int. J. Adv. Manuf. Technol. 2016, 90, 1947–1961. [Google Scholar] [CrossRef] [Green Version]
- Moldovan, O.; Dzitac, S.; Moga, I.; Vesselenyi, T.; Dzitac, I. Tool-Wear Analysis Using Image Processing of the Tool Flank. Symmetry 2017, 9, 296. [Google Scholar] [CrossRef] [Green Version]
- Sun, W.H.; Yeh, S.S. Using the Machine Vision Method to Develop an On-machine Insert Condition Monitoring System for Computer Numerical Control Turning Machine Tools. Materials 2018, 11, 1977. [Google Scholar] [CrossRef] [Green Version]
- Duo, A.; Basagoiti, R.; Arrazola, P.J.; Aperribay, J.; Cuesta, M. The capacity of statistical features extracted from multiple signals to predict tool wear in the drilling process. Int. J. Adv. Manuf. Technol. 2019, 102, 2133–2146. [Google Scholar] [CrossRef]
- Klocke, F.; Dobbeler, B.; Goetz, S.; Viek, T.D. Model-Based Online Tool Monitoring for Hobbing Processes. Procedia CIRP 2017, 58, 601–606. [Google Scholar] [CrossRef]
- Tangjitsitcharoen, S.; Lohasiriwat, H. Intelligent monitoring and prediction of tool wear in CNC turning by utilizing wavelet transform. Int. J. Adv. Manuf. Technol. 2018, 99, 2219–2230. [Google Scholar] [CrossRef]
- Shi, X.; Wang, X.; Jiao, L.; Wang, Z.; Yan, P.; Gao, S. A real-time tool failure monitoring system based on cutting force analysis. Int. J. Adv. Manuf. Technol. 2018, 95, 2567–2583. [Google Scholar] [CrossRef]
- Kothuru, A.; Nooka, S.P.; Liu, R. Application of audible sound signals for tool wear monitoring using machine learning techniques in end milling. Int. J. Adv. Manuf. Technol. 2018, 95, 3797–3808. [Google Scholar] [CrossRef]
- Li, Y.; Xie, Q.; Huang, H.; Chen, Q. Research on a Tool Wear Monitoring Algorithm Based on Residual Dense Network. Symmetry 2019, 11, 809. [Google Scholar] [CrossRef] [Green Version]
- Chen, Q.; Xie, Q.; Yuan, Q.; Huang, H.; Li, Y. Research on a Real-Time Monitoring Method for the Wear State of a Tool Based on a Convolutional Bidirectional LSTM Model. Symmetry 2019, 11, 1233. [Google Scholar] [CrossRef] [Green Version]
- Kong, D.; Chen, Y.; Li, N.; Duan, C.; Lu, L.; Chen, D. Tool Wear Estimation in End Milling of Titanium Alloy Using NPE and a Novel WOA-SVM Model. IEEE Trans. Instrum. Meas. 2020, 69, 5219–5232. [Google Scholar] [CrossRef]
- Shen, Y.; Yang, F.; Habibullah, M.S.; Ahmed, J.; Das, A.K.; Zhou, Y.; Ho, C.L. Predicting tool wear size across multi-cutting conditions using advanced machine learning techniques. J. Intell. Manuf. 2020. [Google Scholar] [CrossRef]
- Cai, W.; Zhang, W.; Hu, X.; Liu, Y. A hybrid information model based on long short-term memory network for tool condition monitoring. J. Intell. Manuf. 2020, 31, 1497–1510. [Google Scholar] [CrossRef]
- Vasilyeva, N.; Fedorova, E.; Kolesnikov, A. Big Data as a Tool for Building a Predictive Model of Mill Roll Wear. Symmetry 2021, 13, 859. [Google Scholar] [CrossRef]
- Pérez, L.; Rodríguez-Jiménez, S.; Rodríguez, N.; Usamentiaga, R.; García, D.F. Digital Twin and Virtual Reality Based Methodology for Multi-Robot Manufacturing Cell Commissioning. Appl. Sci. 2020, 10, 3633. [Google Scholar] [CrossRef]
- Bilberg, A.; Malik, A.A. Digital twin driven human–robot collaborative assembly. CIRP Ann. Manuf. Technol. 2019, 68, 499–502. [Google Scholar] [CrossRef]
- Zhao, P.; Liu, J.; Jing, X.; Tang, M.; Sheng, S.; Zhou, H.; Liu, X. The Modeling and Using Strategy for the Digital Twin in Process Planning. IEEE Access 2020, 8, 41229–41245. [Google Scholar] [CrossRef]
- Biesinger, F.; Meike, D.; Kraß, B.; Weyrich, M. A digital twin for production planning based on cyber-physical systems: A Case Study for a Cyber-Physical System-Based Creation of a Digital Twin. Procedia CIRP 2019, 79, 355–360. [Google Scholar] [CrossRef]
- Liu, J.; Zhou, H.; Liu, X.; Tian, G.; Wu, M.; Cao, L.; Wang, W. Dynamic Evaluation Method of Machining Process Planning Based on Digital Twin. IEEE Access 2019, 7, 19312–19323. [Google Scholar] [CrossRef]
- Leng, J.; Liu, Q.; Ye, S.; Jing, J.; Wang, Y.; Zhang, C.; Zhang, D.; Chen, X. Digital twin-driven rapid reconfiguration of the automated manufacturing system via an open architecture model. Robot. Comput. Integr. Manuf. 2020, 63, 101895. [Google Scholar] [CrossRef]
- Tong, X.; Liu, Q.; Pi, S.; Xiao, Y. Real-time machining data application and service based on IMT digital twin. J. Intell. Manuf. 2019, 31, 1113–1132. [Google Scholar] [CrossRef]
- Luo, W.; Hu, T.; Zhang, C.; Wei, Y. Digital twin for CNC machine tool: Modeling and using strategy. J. Ambient Intell. Humaniz. Comput. 2018, 10, 1129–1140. [Google Scholar] [CrossRef]
- Wang, J.; Huang, Y.; Chang, Q.; Li, S. Event-Driven Online Machine State Decision for Energy-Efficient Manufacturing System Based on Digital Twin Using Max-Plus Algebra. Sustainability 2019, 11, 5036. [Google Scholar] [CrossRef] [Green Version]
- Qiao, Q.; Wang, J.; Ye, L.; Gao, R.X. Digital Twin for Machining Tool Condition Prediction. Procedia CIRP 2019, 81, 1388–1393. [Google Scholar] [CrossRef]
- Wei, Y.; Hu, T.; Zhou, T.; Ye, Y.; Luo, W. Consistency retention method for CNC machine tool digital twin model. J. Manuf. Syst. 2020, 58, 313–322. [Google Scholar] [CrossRef]
- Luo, W.; Hu, T.; Ye, Y.; Zhang, C.; Wei, Y. A hybrid predictive maintenance approach for CNC machine tool driven by Digital Twin. Robot. Comput. Integr. Manuf. 2020, 65, 101974. [Google Scholar] [CrossRef]
- Tao, F.; Cheng, J.; Qi, Q.; Zhang, M.; Zhang, H.; Sui, F. Digital twin-driven product design, manufacturing and service with big data. Int. J. Adv. Manuf. Technol. 2017, 94, 3563–3576. [Google Scholar] [CrossRef]
- Cheng, J.; Zhang, H.; Tao, F.; Juang, C.-F. DT-II:Digital twin enhanced Industrial Internet reference framework towards smart manufacturing. Robot. Comput. Integr. Manuf. 2020, 62, 101881. [Google Scholar] [CrossRef]
- Liu, S.; Lu, Y.; Li, J.; Song, D.; Sun, X.; Bao, J. Multi-scale evolution mechanism and knowledge construction of a digital twin mimic model. Robot. Comput. Integr. Manuf. 2021, 71, 102123. [Google Scholar] [CrossRef]
- Takeyama, H.; Murata, R. Basic Investigation of Tool Wear. J. Eng. Ind. 1963, 85, 33–37. [Google Scholar] [CrossRef]
- Usui, E.; Shirakashi, T.; Kitagawa, T. Analytical prediction of cutting tool wear. Wear 1984, 100, 129–151. [Google Scholar] [CrossRef]
- Attanasio, A.; Ceretti, E.; Fiorentino, A.; Cappellini, C.; Giardini, C. Investigation and FEM-based simulation of tool wear in turning operations with uncoated carbide tools. Wear 2010, 269, 344–350. [Google Scholar] [CrossRef]
- Ahmed, N.; Mitrofanov, A.V.; Babitsky, V.I.; Silberschmidt, V.V. Analysis of material response to ultrasonic vibration loading in turning Inconel 718. Mater. Sci. Eng. A 2006, 424, 318–325. [Google Scholar] [CrossRef]
- Wong, M.L.D.; Jack, L.B.; Nandi, A.K. Modified self-organising map for automated novelty detection applied to vibration signal monitoring. Mech. Syst. Signal Process. 2006, 20, 593–610. [Google Scholar] [CrossRef]
Publisher’s Note: MDPI stays neutral with regard to jurisdictional claims in published maps and institutional affiliations. |
© 2021 by the authors. Licensee MDPI, Basel, Switzerland. This article is an open access article distributed under the terms and conditions of the Creative Commons Attribution (CC BY) license (https://creativecommons.org/licenses/by/4.0/).