Article

Solar Ultraviolet Bursts in the Joint Footpoints of Multiple Transition Region Loops

Shandong Provincial Key Laboratory of Optical Astronomy and Solar-Terrestrial Environment, Institute of Space Sciences, Shandong University, Weihai 264209, China
*
Author to whom correspondence should be addressed.
Symmetry 2021, 13(8), 1390; https://doi.org/10.3390/sym13081390
Submission received: 27 June 2021 / Revised: 21 July 2021 / Accepted: 27 July 2021 / Published: 31 July 2021
(This article belongs to the Special Issue Solar Physics and Plasma Physics: Topics and Advances)

Abstract

:
Solar Ultraviolet bursts (UBs) associated with flux emergence are expected to help understand the physical processes of the flux emergence itself. In the present study, we analyse imaging and spectroscopic observations of a special group of UBs (including twelve of them) occurring in the joint footpoint regions of multiple transition region loops above the flux emerging regions. Consistent with previous studies of common UBs, we found that the spectral characteristics of this group of UBs are varied. Our results show that the responses of UBs in Ni ii, NUV continuum, Mg ii h and O i are originated from locations differ from that emits Si iv. The imaging data show that UBs have connections with the dynamics in the transition region loops. Brightenings starting from UB-regions and propagating along loops can be seen in SJ 1400/1330 Å and AIA 304 Å images and the corresponding time-space images. The apparent velocities are tens of kilometers per second in AIA 304 Å. For symmetry, the brightenings can propagate from the UB-regions towards opposite directions with similar apparent velocities in some cases. Given that these UBs are magnetic reconnection phenomena, we suggest that the propagating brightenings are the signals of the plasma flows resulted from heatings in the UB-regions.

1. Introduction

Flux emergence is a key process leading to the formation of active region, which hosts the most intense magnetic activities on the Sun. While rising into the photosphere from the convection zone, magnetic fluxes evolve dynamically and drive a diverse range of magnetic activities from sub-arcsec events (such as Solar ultraviolet bursts, see Young et al. [1] for a review) to massive eruptions like solar flares and coronal mass ejections (see Chen [2], Shibata and Magara [3] for reviews). Therefore, we can inspect the processes of flux emergence via studying these associated dynamics.
Solar ultraviolet (UV) bursts are small, intense, transient brightenings in solar active regions viewed in ultraviolet. Most UV bursts (hereafter, UBs) are associated with cancelling small-scale opposite polarity magnetic features in the photosphere that occur in emerging magnetic flux regions. More details of the definition and characteristics of UBs could be seen in Young et al. [1]. In the family of the UBs, there is an important class, which shows extraordinarily broadened spectral profiles of Si iv 1394 Å with superimposition of absorption lines of Ni ii and Fe ii. The superimposition of absorption lines in the transition region emission lines is also the main distinction between this class and the other types of UBs (such as the narrow line-width UBs [4]). This class of UBs was first discovered by Peter et al. [5] with observations of the Interface Region Imaging Spectrograph (IRIS [6]). They were first suggested to be signatures of hot structures (up to almost 100,000 K) in the photosphere (about 6000 K) of the Sun [5].
UBs were suggested to be observational signatures of magnetic reconnection associated with U-loops forming in the process of magnetic flux emergence in the lower solar atmosphere, i.e., photosphere [5]. Therefore, they might have strong connection to the so-called “Ellerman bombs” (EBs [7,8,9,10,11]) that are also believed to be magnetic reconnection in the photosphere [8,12], Kim et al. [13] and Vissers et al. [14] found that EBs can indeed produce UB-type spectra. Coordinated observations from the New Vacuum Solar Telescope (NVST [15]) and IRIS also reveal that many EBs are associated with UBs and the EB-related UBs generally reveal different properties from other UBs that are not related to EBs [16]. A recent work using coordinated observations from Big Bear Solar Observatory and IRIS found that about 20 of 161 flame-like EBs reveal signatures of UBs and UBs tend to occur at the upper part of the flames of the EBs [17]. Moreover, some compact brightenings in light bridge related to surge and jets also produce UB-type spectra, giving additional evidence that the UBs could be driven by the same mechanism as jets/surges in the lower solar atmosphere that could be magnetic reconnection between magnetic field within the light bridge and the surrounding magnetic field rooted in the nearby umbral region [18,19]. More and more evidences (both numerical and observational) have been found that the plasmas in the low atmosphere of the Sun could be heated to over 2 × 10 4 K with magnetic reconnection [20,21,22,23,24,25,26,27].
As overviewed above, many studies have demonstrated that UBs are closely associated with flux emergence. It is needed to know at what height such strong energy released events (e.g., UBs) can occur in the process of magnetic flux emergence. While the dynamics in the transition region loops connected to emerging fluxes can provide many critical information about the processes of flux emergence [28,29], the connection between UBs and dynamics of transition region loops has been poorly studied. In the present study, we focus on UBs that are occurring in the joint footpoints of multiple transition region loops that allow us to investigate both phenomena and the possible connection between them. In what follows, we describe the data and data analyses in Section 2, present the results in Section 3, and give the discussion and conclusions in Section 4.

2. Observations and Data Analysis
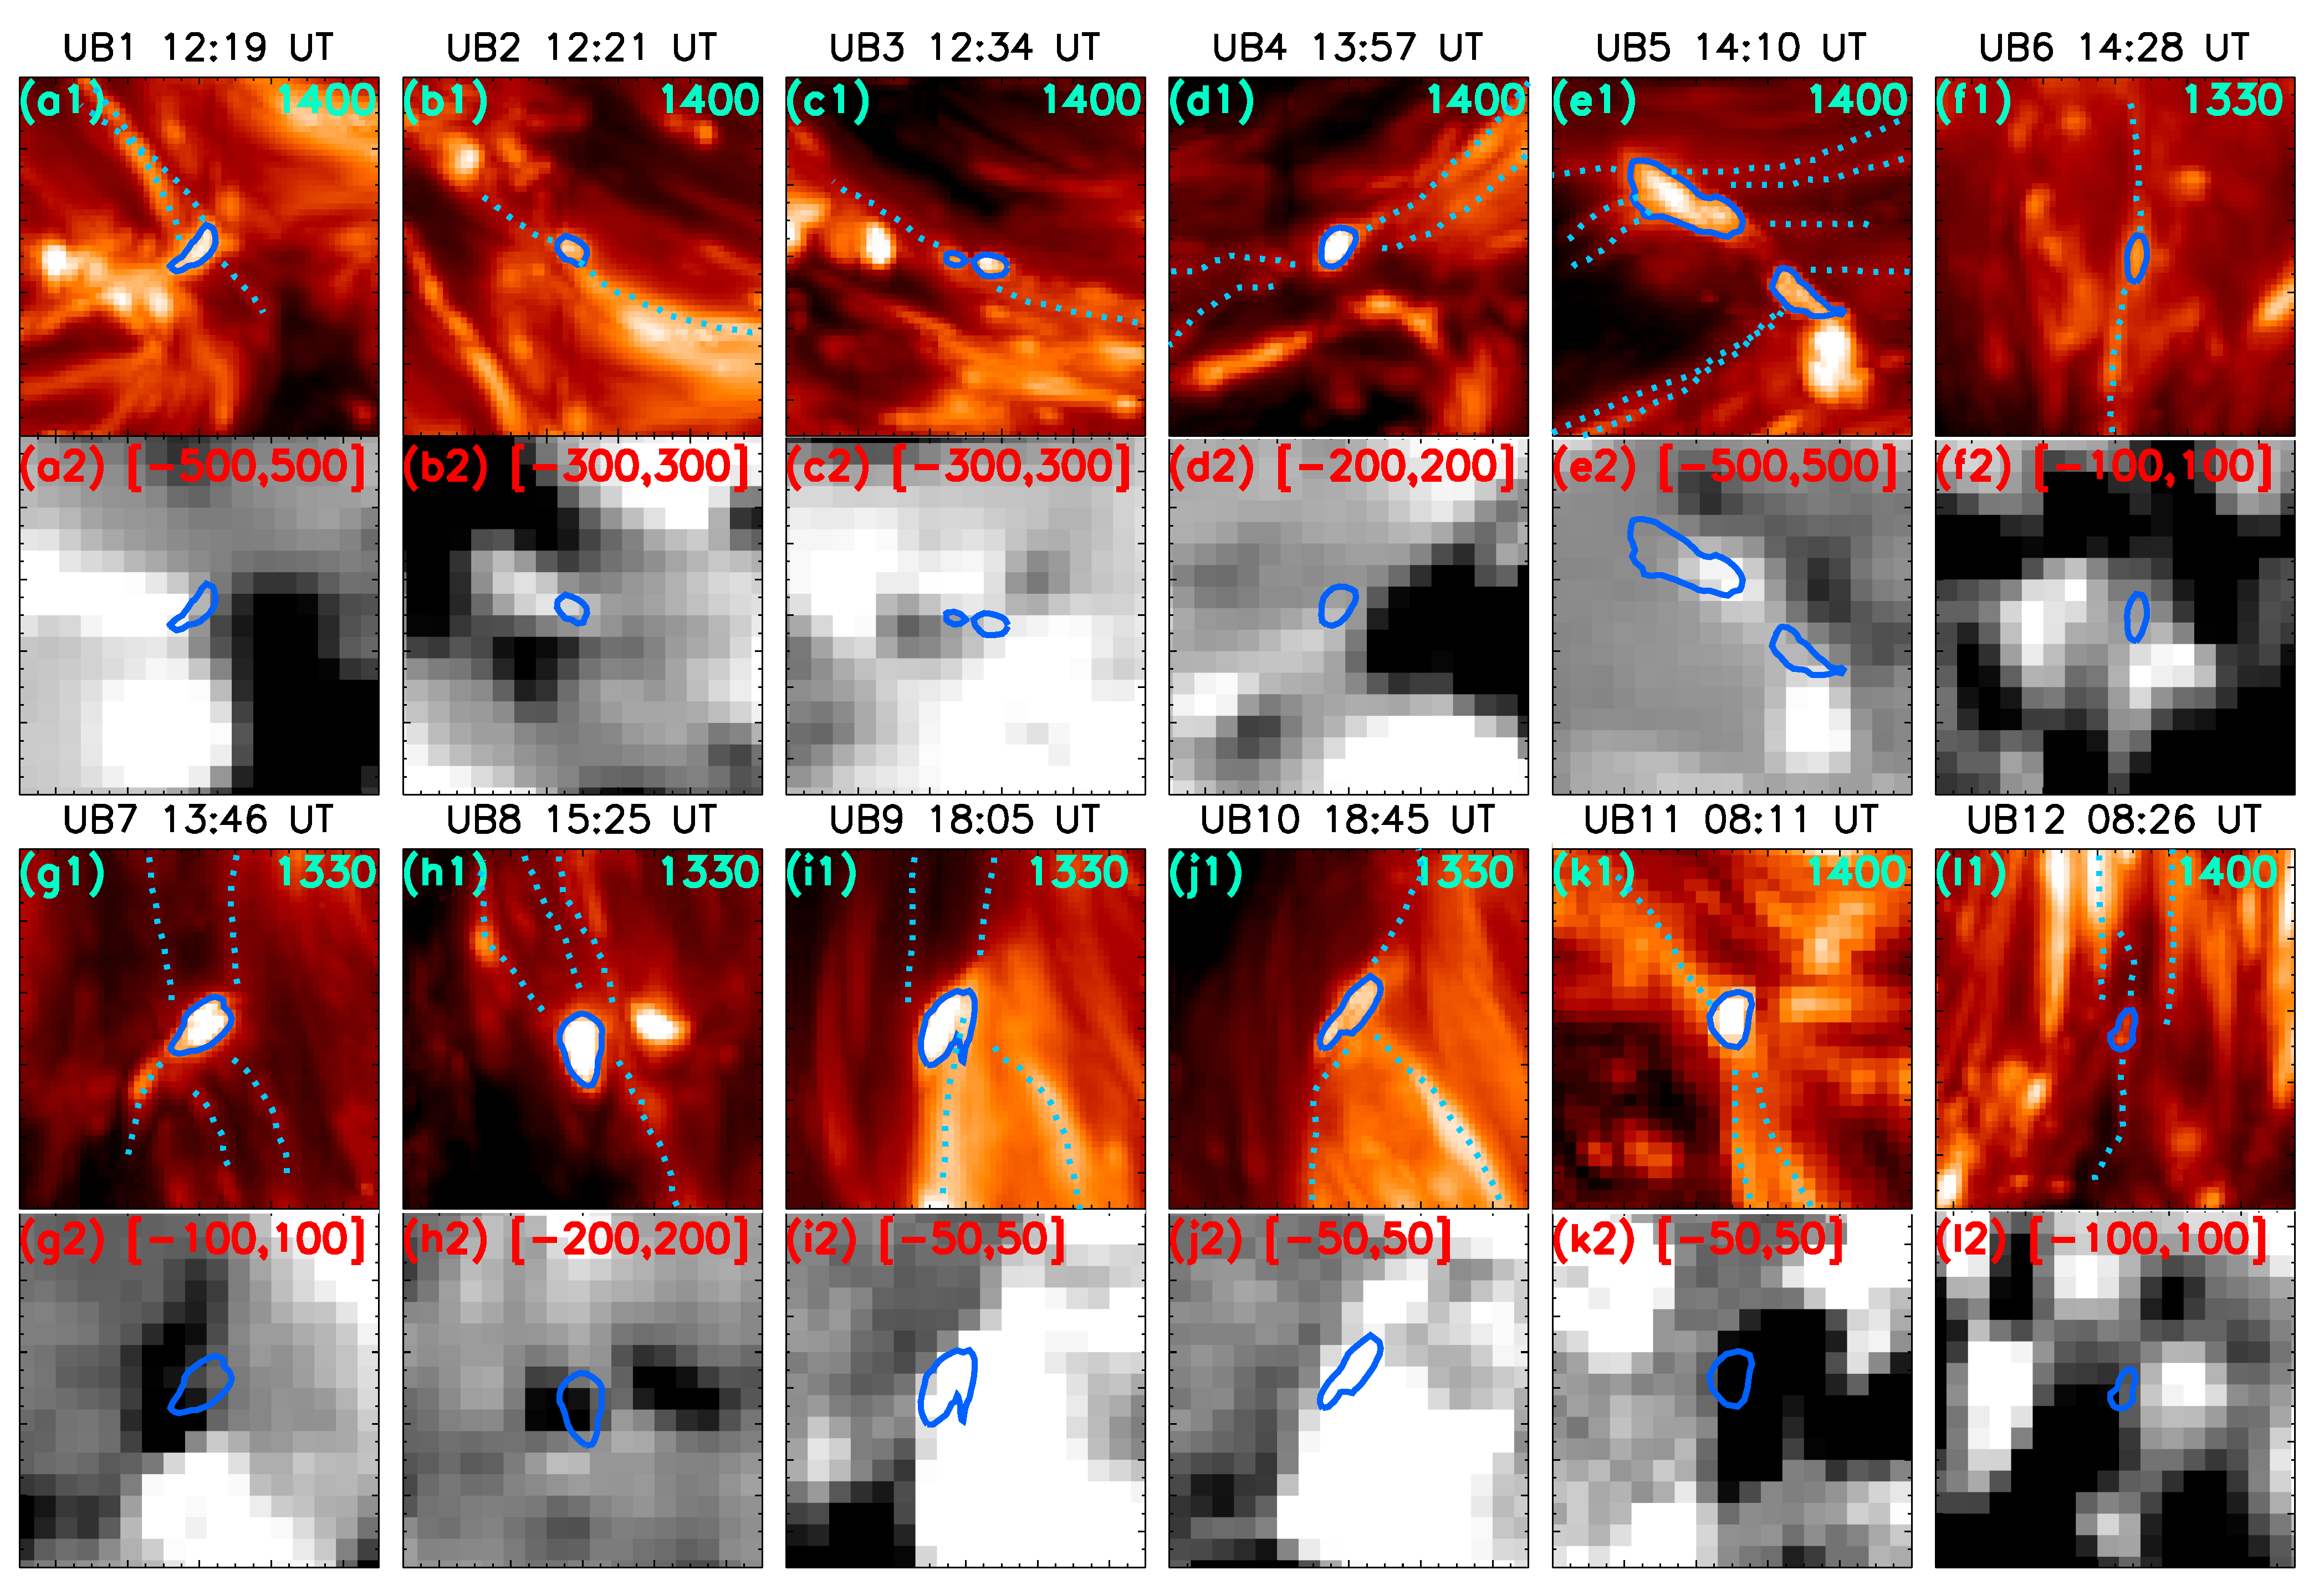
In this study, we initially search for UBs in nine datasets taken by IRIS that have targets of active regions. The identification of the UBs is mainly based on the FUV spectral observations taken by IRIS. We started our analysis by identifying the pixels with significantly broadened Si iv 1394 Å profiles in the FOV. To this end, we used the method described in Huang et al. [30], which filters out pixels with bad signals and spikes, and automatically selects the pixels with Si iv 1394 Å profiles broader than 3 σ above the mean value or Si iv 1394 Å profiles with enhanced wings at both blue and red ends (Doppler shifts larger than 50 kms 1 ). The automatic method also groups the identified pixels into events that are used for the candidates in the next identification step. Based on the events identified from the automatic procedure, we manually pick out those with Si iv 1394 Å profiles superimposed by absorption feature in Ni ii 1393.33 Å that are identified as UBs. In these nine datasets, we identify 52 UBs based on their spectral profiles. In these 52 UBs, we found 12 are apparently occurring in the joint footpoints of multiple transition region loops and they are selected for further analyses. These 12 UBs labelled as UB1–UB12 belong to four datasets (UB1–UB5 in DATA1, UB6–UB10 in DATA2, UB11 in DATA3 and UB12 in DATA4) that are described in detail in this section.
In Table 1, we list the details of the datasets including observing date, time, targets, exposure times, passbands and resolutions, etc. The IRIS spectrograph records its standard selection of spectral windows: the C ii lines near 1334.5 Å and 1335.7 Å, the Si iv doublet at 1394 Å and 1403 Å, the Mg ii h&k lines near 2796 Å and 2804 Å, including the Mg ii triplet lines near 2798 Å (which are two overlapping transitions that overlap so closely that they look like one line in the spectrum). The pixel size along the slit of the spectral data is 0.17″. We use the IRIS level 2 data that have been fully calibrated by the IRIS team and published on the IRIS official website (https://iris.lmsal.com, https://iris.lmsal.com/search, the dates of datasets are shown in Table 1). Furthermore, we have also applied radiometric calibrations to the spectral data via the method described in the Technical Note 26 for IRIS calibration (https://iris.lmsal.com/documents.html, https://iris.lmsal.com/itn26). In detail, the following function can be used to convert the spectral units from DN to flux:
F l u x = F l u x D N E λ · D N 2 P H O T _ S G A e f f · P i x x y · P i x λ · t e x p · W s l i t
where the obtained Flux is in the unit of erg cm 2 s 1 sr 1 Å 1 , Flux D N is the spectral intensity in the unit of DN, E λ = h · c / λ is the photon energy in the unit of erg, DN2PHOT_SG is the number of photons per DN, A e f f is the effective area in the unit of cm 2 , Pix x y = π / ( 180 · 3600 ) is the spatial pixel size in radians, Pix λ is the spectral pixel size in the unit of Å, t e x p is the exposure time in the unit of second, and W s l i t = π / ( 180 · 3600 ) is the slit width in radians. In this work, we use 1 pixel 1 as the Pix λ . In this way, the derived Flux is in the unit of erg cm 2 s 1 sr 1 pixel 1 .
We also analysed corresponding image sequences taken by the Atmospheric Imaging Assembly (AIA [31]) on board the Solar Dynamics Observatory (SDO [32]). For AIA observations, the data are primarily taken by the extreme ultraviolet (EUV) channel of 304 Å with a cadence of 12 s and pixel size of 0.6″. The temperature responses of AIA 304 Å peaks at 5 × 10 4 K. We aligned the IRIS SJ 1400 Å to the AIA 1600 Å images due to their strong continuum contribution, and the AIA 304 Å images can be then aligned to the 1600 Å.
To investigate the magnetic features associated with the UBs, we also analyse the line-of-sight (LOS) magnetograms taken by the Helioseismic and Magnetic Imager (HMI [33] on board SDO). The cadence and pixel size of the LOS magnetograms taken by HMI were 45 s and 0.5″, respectively.

3. Results

The locations of UBs and its associated animation can be seen in Figure 1. We show SJ 1330/1400 Å images and the corresponding HMI magnetograms of the region of each UB. The IRIS slit-jaw images show that the UBs appear as the round or elongated compact brightenings. Some of the brightenings seen in SJ images can exist more than 1 h, and four have lifetimes less than 10 min. One should note that the line profiles of Si iv 1394 Å in the brightenings might be not broadened at the time when the slit was not scanning them. All these UBs are rooted in the joint footpoints of multiple transition region loops as seen in the IRIS SJ images. The transition region loops are very dynamic and they are better seen at different frames of the time series when the cadences of the observations are large (especially in DATA1 and DATA2). In order to display the UBs and their associated transition region loops in the same image, the SJ images shown in Figure 1 are the artificial images generated by the the technique described in Huang et al. [34] that takes for each pixel the highest value obtained during the observing periods. The evolutions of the loops are therefore better viewed in the animations associated with Figure 1.
In the HMI magnetograms, we can see that all these UBs are located near the regions with mixed polarities. Among them, three UBs occurred in the mixed polarity regions that are dominated by positive polarity, another three UBs in the regions that are dominated by negative polarity, and the rest in regions without any significantly dominant polarity. We also found spatial offsets between the magnetic inversion lines and the UBs in some cases (e.g., UB5 and UB10). The corresponding photospheric magnetic field strengths of these UBs are shown in the last column of Table 2.

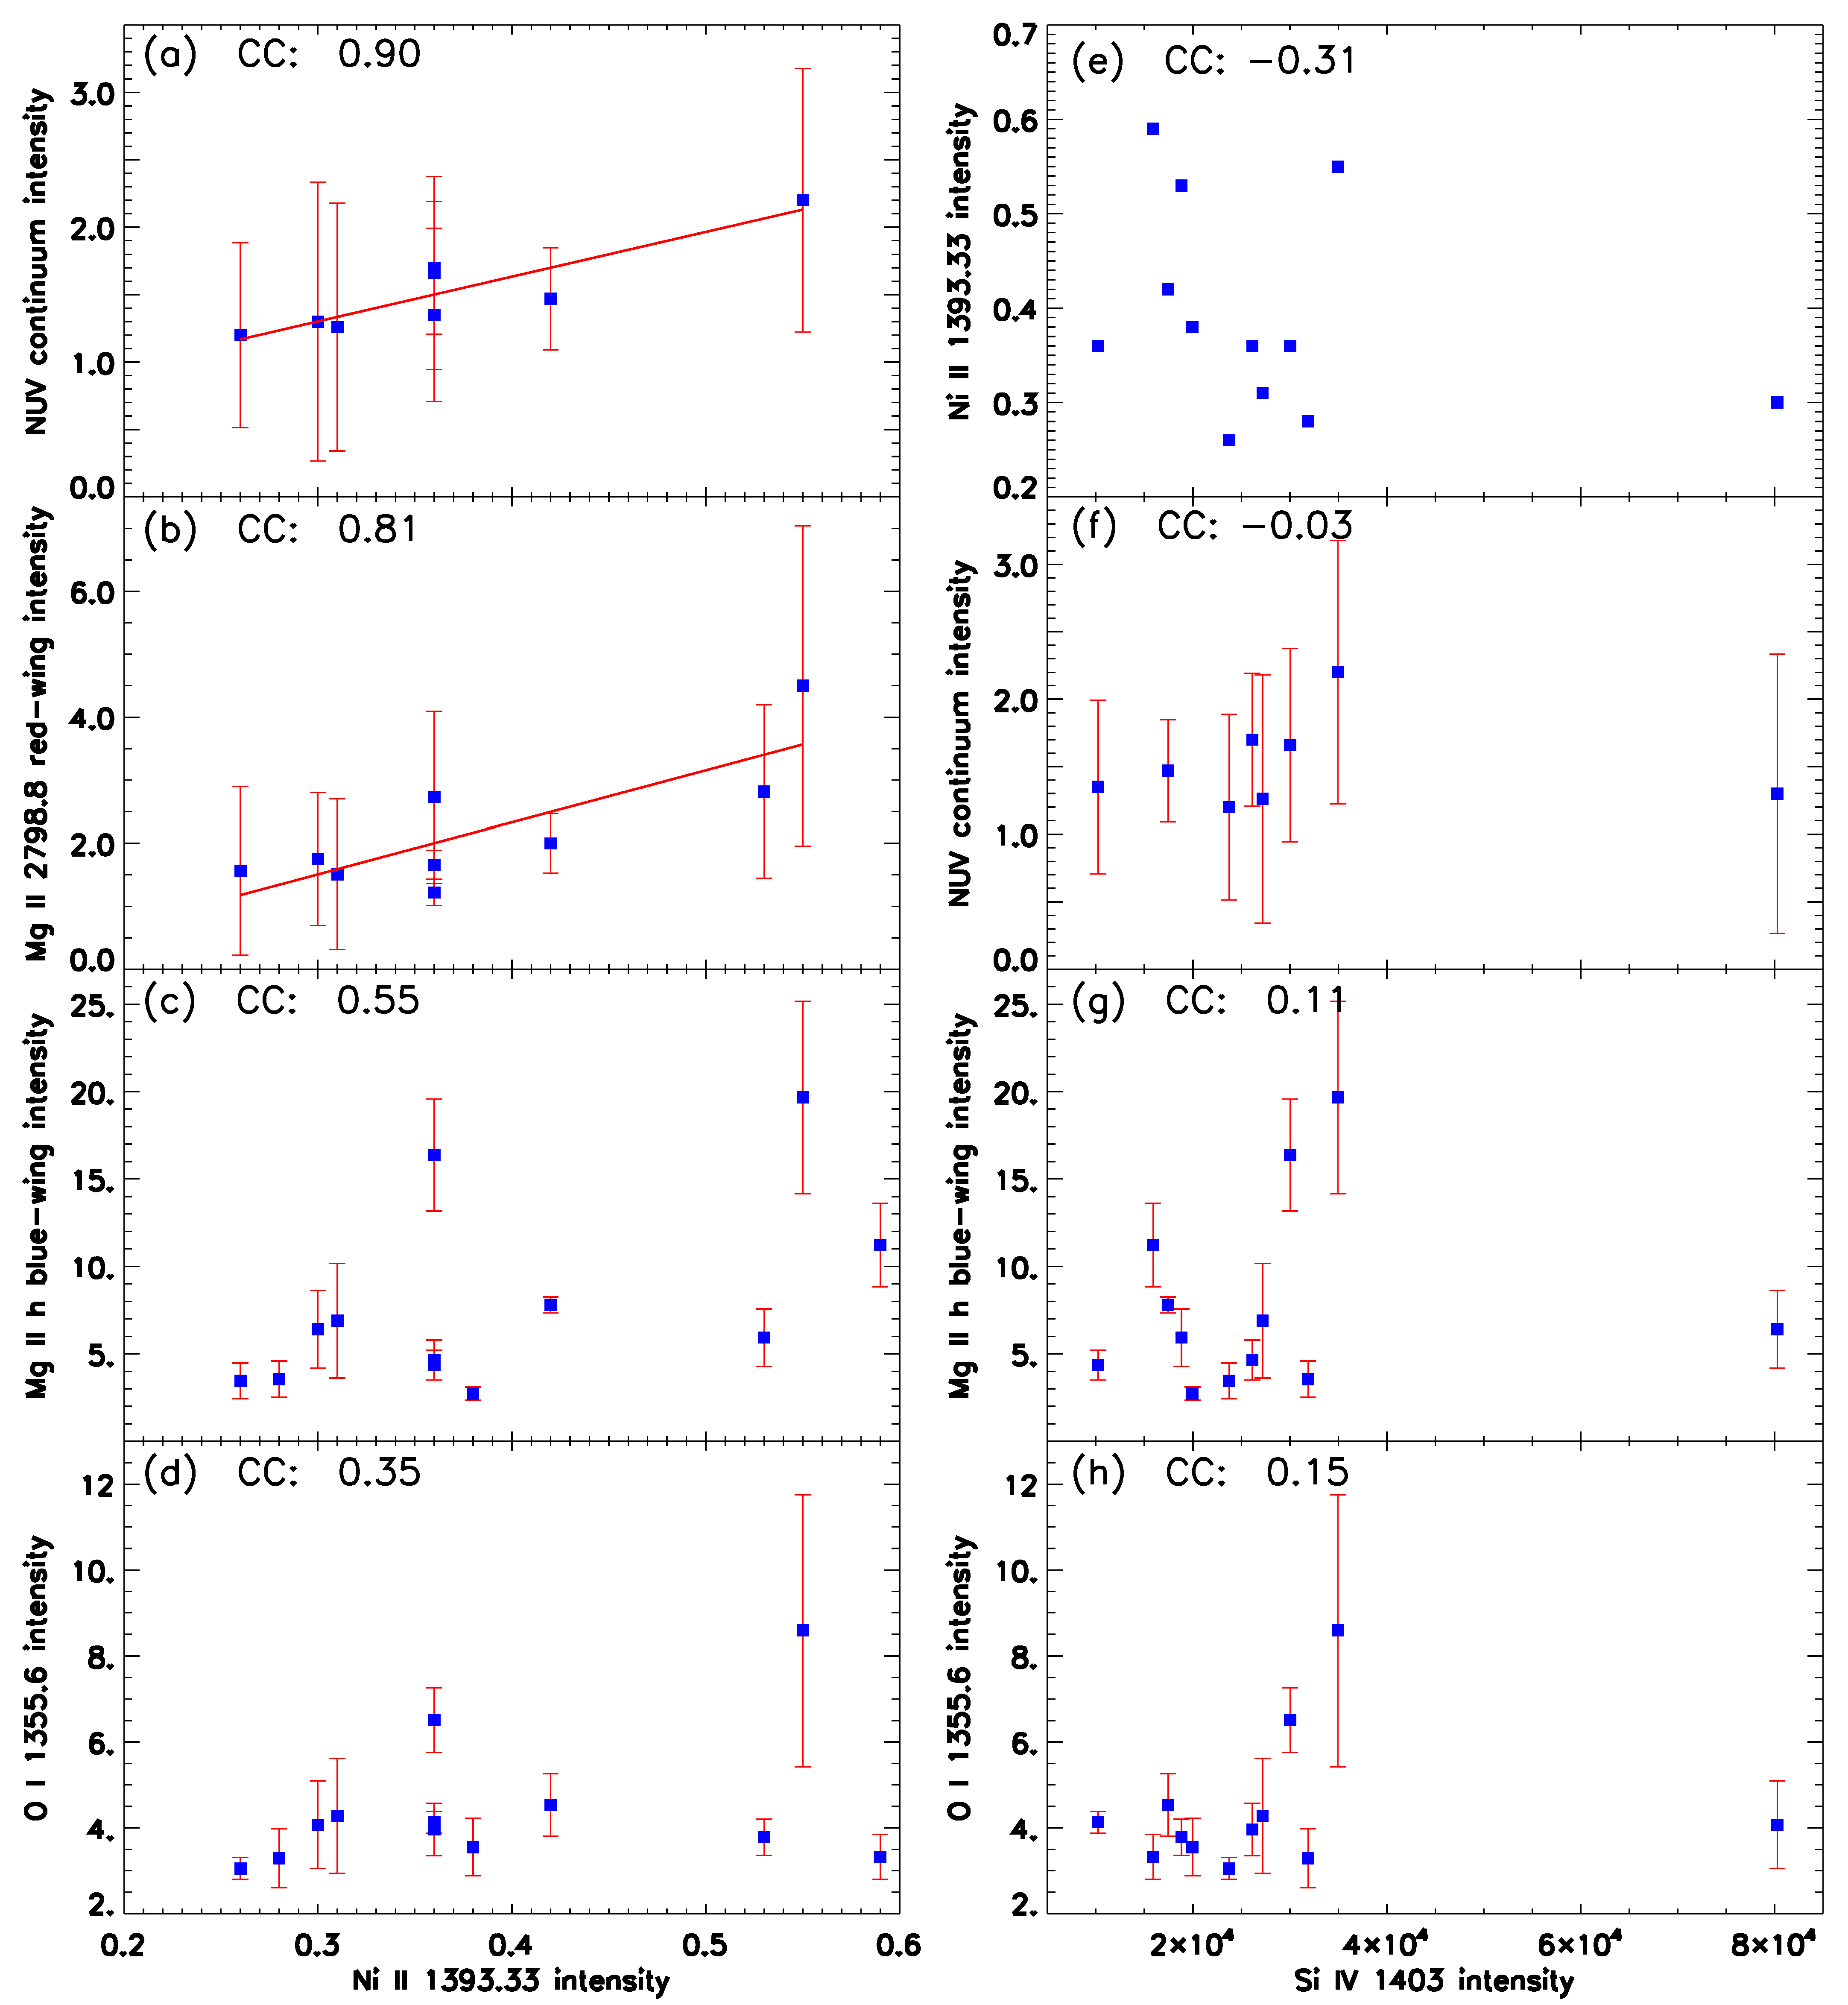
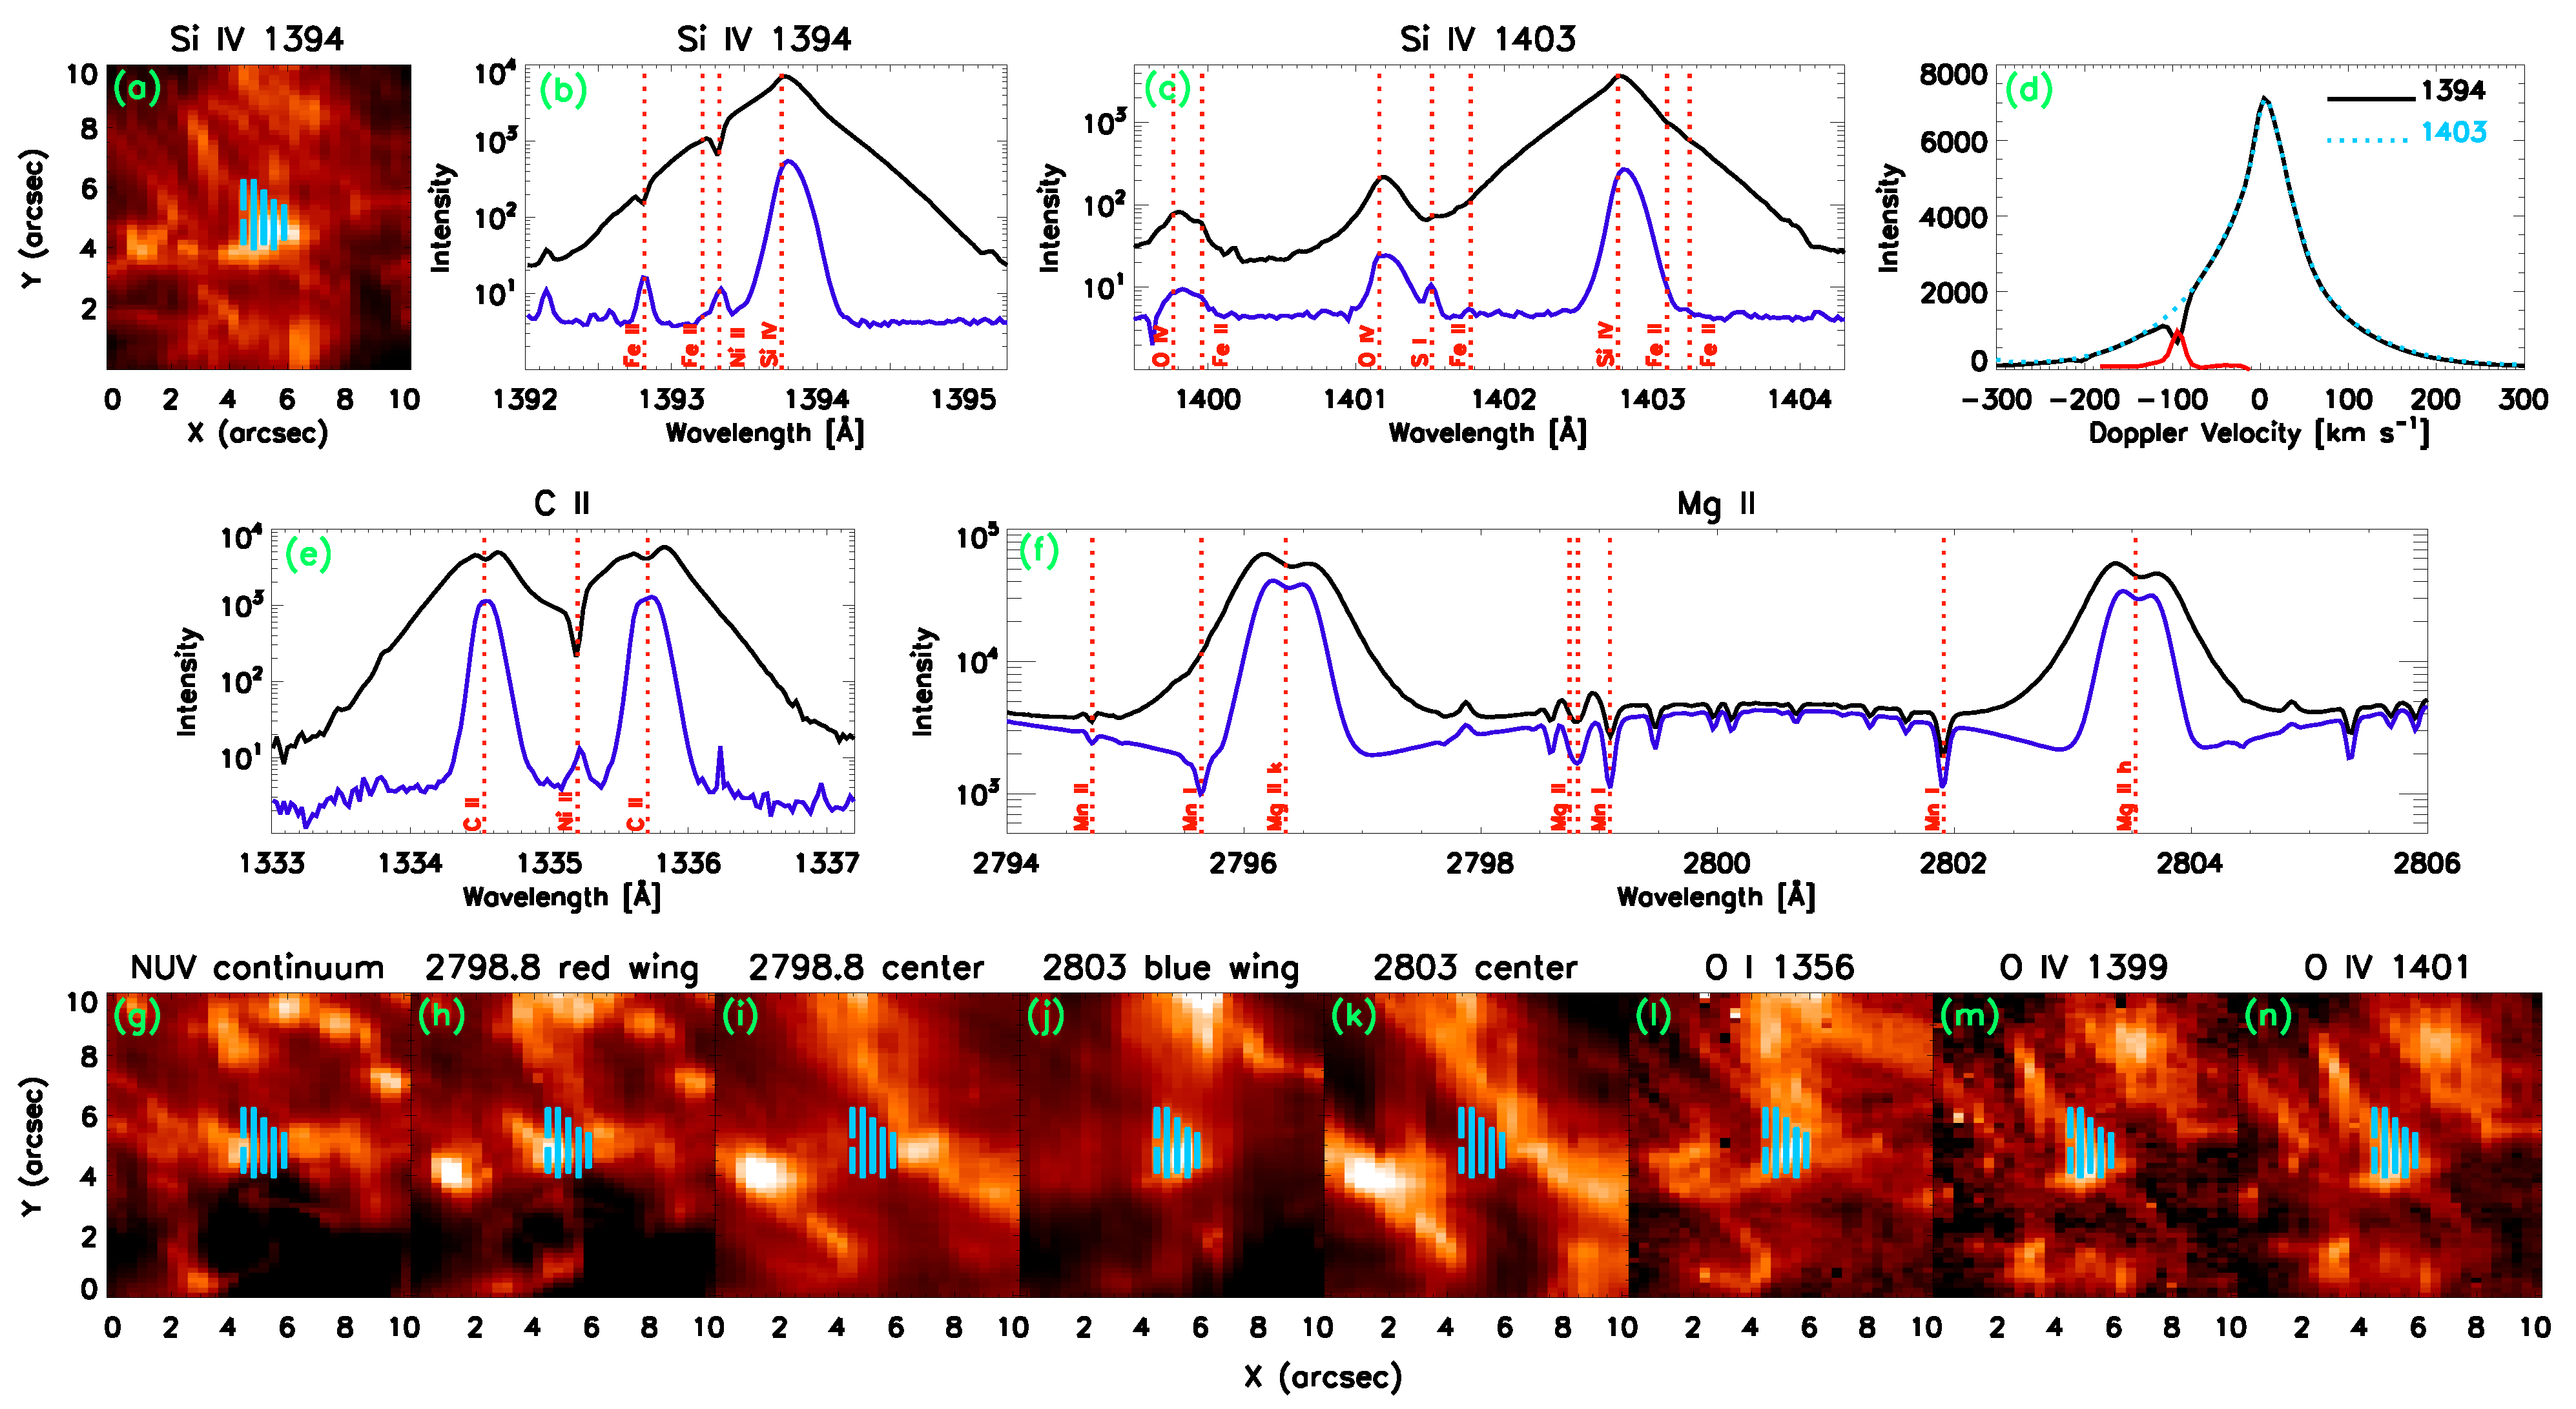
3.1. Spectral Characteristics

These 12 UBs clearly present complex line profiles in Mg ii, C ii and Si iv. In Figure 2, we show the typical line profiles of UB1 as an example. In these spectral windows with comparisons to the ones taken from the relative quiet region inside the active region, we can clearly see enhancements in the blue and red wings of the chromosphere/TR emission lines (Mg ii, C ii and Si iv), and also the absorption features of chromospheric cool lines (e.g., Ni ii, Fe ii and Mn i) are superposed on Si iv, C ii and Mg ii lines. These are the typical characteristics of UBs as reported in the previous studies (see the Introduction for details).
We first analyze the characteristics spectral lines of these UBs to see whether this group of UBs have any significant difference from those reported in the literature. An example of the information for the characteristics spectral lines in UB1 has been shown in Figure 2 and the results for all events are given in Table 2. Most of those parameters have been measured for the other samples reported in the literature (see the Introduction for details). Here we introduce one parameter which is firstly defined (or quantified) in the present study. We use the contributions of Ni ii absorption to the Si iv 1394 Å line as the relative intensities of Ni ii in these UBs (the temperature at max ionisation ratio for Ni ii is log(T/K) = 4.15 derived from CHIANTI V8, see Appendix A for more details and the associated results are given in 7th and 8th columns of Table 2). The chromospheric absorption lines like Ni ii emit from the cool materials located above the heated plasma of UBs and are found to be related to the formation heights of UBs [16]. We can see that the relative intensities of Ni ii are clearly various in different UBs.
To justify whether an UB has response in O iv, we checked the images of one UB at the wavelength bands around 1399.78 Å and 1401.16 Å subtracted by the continuum emissions (see Figure 2m,n). With these examinations, we found that three UBs (UB1, UB2, UB5) have responses in both O iv 1399.78 Å and 1401.16 Å, and two UBs (UB9 and UB11) has response only in O iv 1401.16 Å. Through the ratio of the two O iv lines, we can derive the electron number density of the event using the CHIANTI atomic database with modelling at a fixed temperature of 1.4 × 10 5 K. We found that the electron number densities (log( N e / cm 3 )) are 11.15, 10.47 and 11.04 for UB1, UB2 and UB5, respectively, (see Table 2). Using the ratio-density curves predicted from the Log-linear DEM method as discussed by Young et al. [35], we also derived the electron number densities (see Table 2) for the UBs (UB1, UB2, UB5, UB9 and UB11) with the integrated intensity ratio of Si iv 1402.77 Å to O iv 1401.16 Å. The electron number densities measured by the second method could be several times or an order of magnitude larger than that measured by the first method [37]. Combining the densities and the one-dimensional, time-independent, semi-empirical atmospheric model provided by Avrett and Loeser [38], we find that UBs might occur at the height ranging from 900 to 2000 km above τ 500 = 1.
Compared to the outer wings of Mg ii k&h, the NUV continuum that has lower formation height can be used to probe the information of the lower solar atmosphere [39]. The Mg ii 2798.8 Å line is blending of two Mg ii lines at 2798.754 Å and 2798.822 Å, which formed just above the temperature minimum of the solar atmosphere, at the heights around 0.6–1.2 Mm above τ 500 = 1 [40]. The O i 1355.6 Å line is an excellent probe of the middle chromosphere [41]. Based on our analysis and from Table 2, we find that all UBs have responses in the images of O i 1355.60 Å and the outer wings of Mg ii k and eight UBs have responses in both images of the NUV continuum and the red wing of Mg ii 2798.8 Å at wavelength from 2798.93 to 2798.98 Å. The emission of the NUV continuum and the red wing of Mg ii 2798.8 Å could be from the bottom parts of the heated plasma of the UBs, while the emission of O i could be from the top parts of the heated plasma. These results indicate that the plasma heating in these UBs mainly occurred at the low/mid chromosphere [39,40,41,42,43], while the eight UBs with the enhanced NUV continuum might have lower bottom parts of the heated plasma extending towards the photosphere. We also examined the images of these UBs at different wavelengths of the Mg ii h line to see whether they have response (the 11th column of Table 2). We found that these UBs show responses in Mg ii h at its wings from near center at ∼20 kms 1 to far wings as large as 160 kms 1 (see Table 2) and the wavelength ranges of Mg ii h with responses for different UBs are various. In detail, four UBs (i.e., UB3, UB5, UB7, and UB12) have no response at the outer wings (>140 kms 1 ) of Mg ii k&h, NUV continuum, and Mg ii 2798.8 Å line, indicating the bottom parts of heated plasma for these four events are higher than that of others. These results suggest that the thermodynamics and/or opacity of these UBs are various. Further investigation using radiation-MHD models [42,44] or machine and deep learning approach [45] with these observational constrains is required to understand the different behaviours of Mg ii lines of these UBs.
We see that our results show the variety in the characteristics of the UBs. Combining the density analysis and spectral responses of UBs, we suggests that UBs can take place in a variety of plasma environments at the height of low/mid chromosphere.
With these quantitative results shown in Table 2, we investigate the correlations between the Ni ii absorption and any other spectroscopic parameters of the UBs (see Figure 3a–d). It shows that the response of Ni ii absorption is well correlated with NUV continuum and Mg ii 2798.8 Å red wing intensities, but less correlated with Mg ii h blue wing and O i. This result is consistent with that reported by Tian et al. [16] who also found that UBs with deeper Ni ii absorption always have larger continuum enhancement. Since the Ni ii absorption is representative of the properties of absorption materials related to the UBs, our results further suggest that the responses in NUV continuum intensity and Mg ii 2798.8 Å red wing are two external proxies to study the absorption materials related to the UBs.
We also investigate the correlation between the Si iv intensity and any other spectroscopic parameters of the UBs (see Figure 3e–h). We found that Si iv intensity has very weak (almost no) correlation with any other parameters. Since the Si iv intensity could be representative of the main heated plasma of the UBs due to its highest temperature than other observed spectra, this weak correlation suggests that the responses of UBs in Ni ii, NUV continuum, Mg ii h wings and O i are originated from heights differ from that of the main heated plasma (which is defined to be the place emitting the Si iv line).

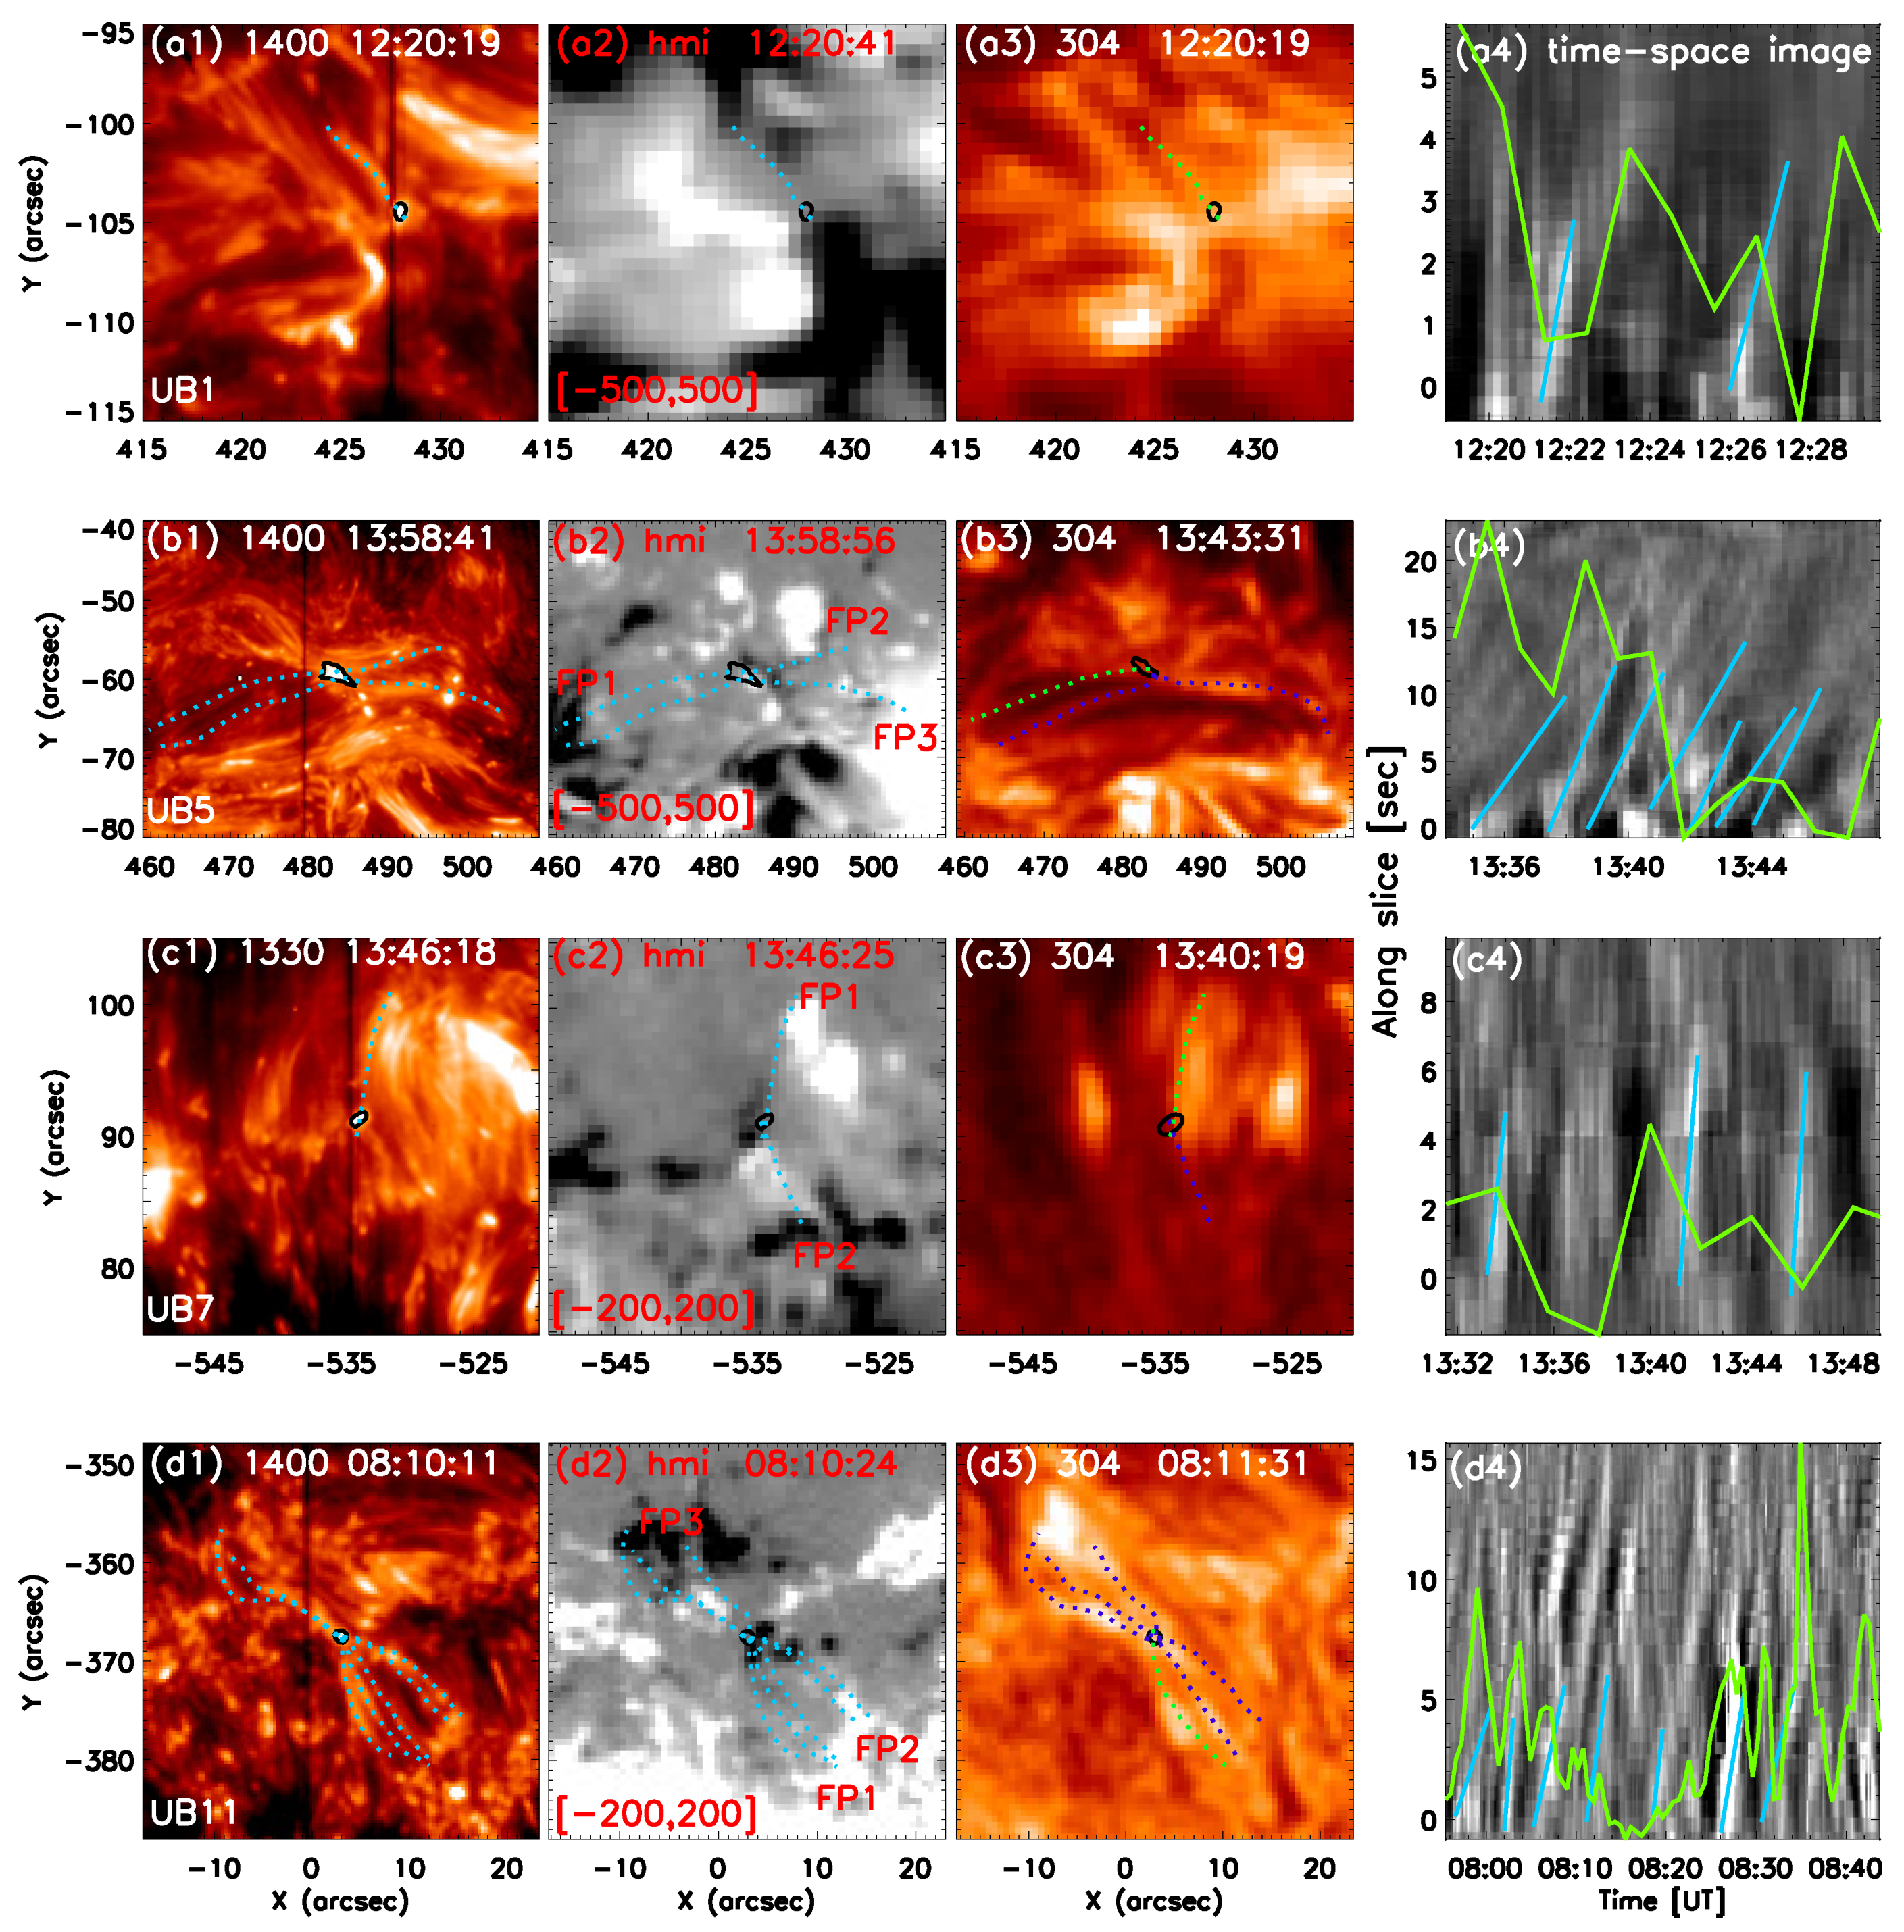
3.2. Activities of the Transition Region Loops Associated with UBs

In the SJ 1400 Å and 1330 Å and AIA 304 Å images, we can see that all these UBs are located in the joint footpoints of multiple loops. The loops (or loop systems) continually flare up when the corresponding UBs were observed. To continue our analysis, we conduct a more detailed investigation of the relationship between UBs and transition region loops in four cases (UB1, UB5, UB7 and UB11). The rest UBs are not suitable for analyses because of the low temporal resolution of the data, the complexity of the surrounding area, and the very weak signal of associated loops in the AIA 304 Å images.
We start our detailed analysis by giving the closer views for UB1, UB5, UB7, UB11 and their associated loops in SJ 1400/1330 Å, HMI and AIA 304 Å images shown in the left three columns of Figure 4. We also give quantitative parameters for UBs and their associated loops in Table 3, including the numbers of loops connected to the UB, magnetic strengths in the footpoint regions of the loops, loop lengths, and apparent velocities in along the loops. These values can be useful for numerical experiments for UBs. In SJ 1400/1330 Å images (and the associated animation of Figure 4), the loops related to UBs marked by dotted-lines are very dynamical and flare up repeatedly along with the lightenings of the UBs. Cross-checking with HMI magnetograms, we find that the loops are connecting opposite-polarities, and we give the magnetic strengths of the footpoints of the loops in Table 3. AIA 304 Å images present similar morphologies of the loops related with UBs (see the third column of Figure 4). The loops in AIA 304 Å images also marked by dotted-lines present similar morphologies to that in SJ 1400/1330 Å images, but the loops in SJ 1400/1330 Å images are more and finer than that in AIA 304 Å images. AIA 304 Å images with a cadence of 12 s can show apparent motions of brightenings starting from UB-regions and moving along the loops.
Because the temporal resolution of the SJ 1400/1330 Å images is too low, in order to investigate the dynamics of the transition region loops we investigate dynamics of these loops in the AIA 304 Å images instead. We put four slices along the loops marked by green dotted-lines in AIA 304 Å images in Figure 4. The time-space images corresponding to these slices can be obtained from AIA 304 Å images. The backgrounds for each pixels along the slices have been obtained from 5 min running average and subtracted from the original signals. The time-distance images along these slices are given in the right column of Figure 4. In time-space images, we can see many slant striations marked by blue solid lines in the time-space images. As compared with AIA 304 Å images, these striations are the signals of brightenings starting from UB-regions and moving along the loops. For UB5 and UB11, we can see bi-directional propagating brightenings with similar apparent velocities appearing symmetrically at both sides of the UB-regions.
We also investigate the time relationship between the loops and the corresponding UBs. See the right column of Figure 4, the light curves of UBs are overplotted marked by green curves in the time-space images. For UB11, almost every time the loop flares up, the event becomes brightening. Furthermore, the beginnings of the moving brightenings in loops are corresponding to the beginnings of brightenings of UB11. For UB5, we can also see the similar time relationship. For UB1 and UB7, however, this time relationships are not clear due to the higher time cadences of SJ 1400/1330 Å, and dynamics of TR background.
The propagating brightenings can be moving plasma (flows) starting from UB-regions. We can also calculate the apparent velocities for the propagating brightenings using the slopes of these slant striations. The apparent velocities along the loops in AIA 304 Å images are given in Table 3. In three cases, the velocities are less than 50 kms 1 , but in UB7 the velocity is as high as 100 kms 1 .

4. Discussion and Conclusions

In the present study, we investigate twelve UBs occurring in the joint footpoint region of multiple loops seen in the IRIS 1400 Å (or 1330 Å) images. The spectral characteristics of these UBs are consistent with those reported in the previous studies, e.g., [5,14,16]. Again, our results also show the variety in the characteristics of the UBs. This suggests that UBs can take place in a variety of plasma environments. The lifetime of these 12 UBs are also different from each other. Eight of them can exist more than 20 min in SJ images and others only exist several minutes. Notably, the long-lasting events appear intermittently and the duration of each appearance is about several minutes consistent with that of the short-existing UBs. This indicates that the long-lasting events are generated by intermittent process of magnetic reconnection.
We quantified the observational characteristics at different aspects of these UBs, i.e., the responses in NUV continuum, Mg ii 2798.8 red wing, Mg ii h blue wing, O i and Si iv, and investigated their correlations. The response of Ni ii absorption is well correlated with NUV continuum and Mg ii 2798.8 Å red wing intensities that is consistent with that reported by Tian et al. [16]. Our results further suggest that the responses in NUV continuum intensity and Mg ii 2798.8 Å red wing can also be used to study the absorption materials related to the UBs. The correlations between Si iv intensity and any other parameters are very weak (almost no correlation), which suggest that the responses of UBs in Ni ii, NUV continuum, Mg ii h wings and O i are originated from locations differ from the heating ones.
The events studied here could be different from those modelled by Hansteen et al. [27], who found EBs and UBs can be a result of the magnetic reconnection in a long-lasting current sheet that located in a large bubble of emerging magnetic field, carrying with it cool materials from the photosphere. In their case, the plasma densities in current sheet and cool region could be similar to each other, and the emission of Si iv is expected to have a correlation to the responses of cool absorption lines (such as Ni ii). In our study, we found that the correlation between Si iv intensity and the response of Ni ii absorption is very weak. This indicates that the heated plasma and the cool absorption materials related to the UBs might be not correlated, although their different formation temperatures might also play a role.
Combining SJ 1400/1330 Å and AIA EUV images, we made a detailed analysis for four UBs (UB1, UB5, UB7 and UB11) that clearly show connections with the activities in the associated transition region loops. These loops flare up several times when UBs are enhanced. We found that brightenings starting from UBs’ region and propagating along loops can be clearly seen in the SJ 1400/1330 Å, AIA 304Å images and their corresponding time-space images. The apparent velocities along the loops are less than 50 kms 1 in three cases and as high as 100 kms 1 in one case. For symmetry, the brightenings can propagate from the UB-regions towards opposite directions with similar apparent velocities in some cases. Given that these UBs are believed to be magnetic reconnection phenomena, we suggest that the propagating brightenings are the signals of moving plasma due to heating from the magnetic reconnection in the UBs’ sites.
Similar propagating brightenings have also been reported by Huang et al. [30] and Rouppe van der Voort et al. [25]. Huang et al. [30] observed propagating loop brightenings in the SJ images which are associated with six transition region explosive events. They speculated that the propagating brightenings are the result of magnetic reconnection. Based on the results from observations and numerical simulations, Rouppe van der Voort et al. [25] interpreted the propagating brightenings as a result of magnetic reconnection mediated by the plasmid instability. As mentioned above, some long-lasting UBs in this study were intermittently brightened and associated with repeated propagating brightenings along transition region loops. The propagating brightenings in this study might be generated by magnetic reconnection mediated by the plasmid instability.
Small-scale reconnection events (e.g., EBs and UBs) occur frequently in emerging active regions (e.g., Vissers et al. [14], Pariat et al. [46] and Young et al. [1]), especially in the earliest stage of flux emergence (e.g., Tian et al. [36]). For the UBs, the plasma can be heated up to the transition region temperature by the local heating through magnetic reconnection in the low atmosphere [1,5]. Furthermore, they appear often to be associated with loops (e.g., Rouppe van der Voort et al. [25], Huang et al. [30] and Tian et al. [36]). During flux emergence, such events were proposed to help the rise of undulatory flux tubes into high atmosphere (appearing as coronal loops with heated plasma, Pariat et al. [46] and Hou et al. [47]). Our study present consistent results including the UB-like spectral properties and propagating brightening along loops, indicating that the UBs in this study could play a role in the local plasma heating and providing mass and magnetic flux into high solar atmosphere.
Peter et al. [5] suggested an U-loop scenario for this kind events. In the upper part of the U shape, the magnetic field reconnects and results in one UB. In this cases, one big loop can be generated through the process of the magnetic reconnection. Before magnetic reconnections, the morphologies of UBs and the transition region loops shown in the present work appear to be consistent with that picture. In our imaging observations, we did not find signal of the generated loop. The reason can be that the temporal resolution of these data-sets are too low and the generated larger loops decay too quickly. Therefore we cannot capture the loops resulted from magnetic reconnection in the U-loop geometry. Another explanation is that there are multiple fine-scale U-loop configurations in a small region (e.g., UB region) and the magnetic reconnections occurring in one small-scale U-loop cannot produce any loops with distinguished changes in size.
In summary, our observations indicate that UBs occurring in the joint footpoints of multiple transition region loops are consistent with those reported in the literature. UBs can occur in a variety of magnetic and plasma environments. Based on our spectral analysis, we find that the plasma heating in these UBs mainly occurred at the low/mid chromosphere and the heating regions of most UBs can extend towards the photosphere. The transition region loops associated with the UBs can flare up due to the activity of the UBs (i.e., magnetic reconnections in the low solar atmosphere). We suggest that small-scale magnetic reconnection events play a role in plasma heating and mass transporting in TR loops from the low solar atmosphere. These observational results could provide insight into the formation of UBs and the dynamics in the transition region loops.

Author Contributions

Formal analysis, Z.H. (Zhenyong Hou), Z.H. (Zhenghua Huang), L.X., H.F.; investigation, Z.H. (Zhenyong Hou); writing—original draft preparation, Z.H. (Zhenyong Hou); writing—review and editing, Z.H. (Zhenghua Huang), L.X., H.F., Y.Q. and D.L. and N.T.; supervision, L.X.; project administration, Z.H. (Zhenghua Huang); funding acquisition, Z.H. (Zhenghua Huang), L.X. All authors have read and agreed to the published version of the manuscript.

Funding

This research is supported by National Natural Science Foundation of China (U1831112, 41627806, 11761141002, U1931105, 41474150), and the Young Scholar Program of Shandong University, Weihai (2017WHWLJH07).

Data Availability Statement

The data presented in this study are openly available in IRIS Data Search at https://iris.lmsal.com/search/, the dates of datasets are shown in Table 1 and JSOC Data Explore Info and Export at http://jsoc.stanford.edu/ajax/lookdata.html, the dates of datasets are shown in Table 1.

Acknowledgments

We thank Hui Tian, Tanmoy Samanta and Yajie Chen for the fruitful discussions. IRIS is a NASA small explorer mission developed and operated by LMSAL with mission operations executed at NASA Ames Research center and major contributions to downlink communications funded by ESA and the Norwegian Space Centre. Courtesy of NASA/SDO, the AIA and HMI teams and JSOC. CHIANTI is a collaborative project involving George Mason University, the University of Michigan (USA) and the University of Cambridge (UK).

Conflicts of Interest

The authors declare no conflict of interest.

Appendix A. The Relative Intensity of Ni ii Absorption

To obtain the contribution of Ni ii absorption to the Si iv 1394 Å line (the 7th column), we first align the Si iv 1403 Å and 1394 Å profiles that both of them match each other except the wavelength range that was affected by absorption lines (see Panel d of Figure 2), and a residual profile of each event is obtained by subtracting the amplified Si iv 1403 Å profile (that is the original profiles multiplied by the intensity ratio obtained above) from the original Si iv 1394 Å profile (see Panel d of Figure 2); then, the residual profile is used to represent the absorption of Ni ii in the Si iv 1394 Å profiles (hereafter, Ni ii representing profile, see the red lines in Panel d of Figure 2), which appear to have a single Gaussian profile; for the next step, we apply a Gaussian fit to the Ni ii representing profile to obtain its peak intensity ( p N i 2 ), line center ( λ N i 2 ) and line width (full width at half maximum, FWHM N i 2 ); finally, we calculate the ratio between the summed intensity of the Ni ii representing profile to that of the amplified Si iv 1403 Å profile in the wavelength range of λ N i 2 ± FWHM N i 2 , and this ratio is used to quantify the absorption contributions of Ni ii to the Si iv 1394 Å profile and listed in the 7th column. The Doppler shifts obtained from the Gaussian fits to the Ni ii representing profile of each UB are also given in the 8th column.

References

  1. Young, P.R.; Tian, H.; Peter, H.; Rutten, R.J.; Nelson, C.J.; Huang, Z.; Schmieder, B.; Vissers, G.J.M.; Toriumi, S.; Rouppe van der Voort, L.H.M.; et al. Solar Ultraviolet Bursts. Space Sci. Rev. 2018, 214, 120. [Google Scholar] [CrossRef] [Green Version]
  2. Chen, P.F. Coronal Mass Ejections: Models and Their Observational Basis. Living Rev. Sol. Phys. 2011, 8, 1. [Google Scholar] [CrossRef] [Green Version]
  3. Shibata, K.; Magara, T. Solar Flares: Magnetohydrodynamic Processes. Living Rev. Sol. Phys. 2011, 8, 6. [Google Scholar] [CrossRef] [Green Version]
  4. Hou, Z.; Huang, Z.; Xia, L.; Li, B.; Madjarska, M.S.; Fu, H.; Mou, C.; Xie, H. Narrow-line-width UV Bursts in the Transition Region above Sunspots Observed by IRIS. Astrophys. J. Lett. 2016, 829, L30. [Google Scholar] [CrossRef] [Green Version]
  5. Peter, H.; Tian, H.; Curdt, W.; Schmit, D.; Innes, D.; De Pontieu, B.; Lemen, J.; Title, A.; Boerner, P.; Hurlburt, N.; et al. Hot explosions in the cool atmosphere of the Sun. Science 2014, 346, 1255726. [Google Scholar] [CrossRef] [PubMed] [Green Version]
  6. De Pontieu, B.; Title, A.M.; Lemen, J.R.; Kushner, G.D.; Akin, D.J.; Allard, B.; Berger, T.; Boerner, P.; Cheung, M.; Chou, C.; et al. The Interface Region Imaging Spectrograph (IRIS). Sol. Phys. 2014, 289, 2733–2779. [Google Scholar] [CrossRef]
  7. Ellerman, F. Solar Hydrogen “bombs”. Astrophys. J. 1917, 46, 298. [Google Scholar] [CrossRef]
  8. Fang, C.; Tang, Y.H.; Xu, Z.; Ding, M.D.; Chen, P.F. Spectral Analysis of Ellerman Bombs. Astrophys. J. 2006, 643, 1325–1336. [Google Scholar] [CrossRef] [Green Version]
  9. Rutten, R.J.; Vissers, G.J.M.; Rouppe van der Voort, L.H.M.; Sütterlin, P.; Vitas, N. Ellerman bombs: Fallacies, fads, usage. J. Phys. Conf. Ser. 2013, 440, 012007. [Google Scholar] [CrossRef] [Green Version]
  10. Yang, H.; Chae, J.; Lim, E.K.; Park, H.; Cho, K.; Maurya, R.A.; Song, D.; Kim, Y.H.; Goode, P.R. Velocities and Temperatures of an Ellerman Bomb and Its Associated Features. Sol. Phys. 2013, 288, 39–53. [Google Scholar] [CrossRef]
  11. Hong, J.; Ding, M.D.; Cao, W. Multi-wavelength Spectral Analysis of Ellerman Bombs Observed by FISS and IRIS. Astrophys. J. 2017, 838, 101. [Google Scholar] [CrossRef] [Green Version]
  12. Nelson, C.J.; Shelyag, S.; Mathioudakis, M.; Doyle, J.G.; Madjarska, M.S.; Uitenbroek, H.; Erdélyi, R. Ellerman Bombs—Evidence for Magnetic Reconnection in the Lower Solar Atmosphere. Astrophys. J. 2013, 779, 125. [Google Scholar] [CrossRef] [Green Version]
  13. Kim, Y.H.; Yurchyshyn, V.; Bong, S.C.; Cho, I.H.; Cho, K.S.; Lee, J.; Lim, E.K.; Park, Y.D.; Yang, H.; Ahn, K.; et al. Simultaneous observation of a hot explosion by NST and IRIS. Astrophys. J. 2015, 810, 38. [Google Scholar] [CrossRef]
  14. Vissers, G.J.M.; Rouppe van der Voort, L.H.M.; Rutten, R.J.; Carlsson, M.; De Pontieu, B. Ellerman Bombs at High Resolution. III. Simultaneous Observations with IRIS and SST. Astrophys. J. 2015, 812, 11. [Google Scholar] [CrossRef] [Green Version]
  15. Liu, Z.; Xu, J.; Gu, B.Z.; Wang, S.; You, J.Q.; Shen, L.X.; Lu, R.W.; Jin, Z.Y.; Chen, L.F.; Lou, K. New vacuum solar telescope and observations with high resolution. Res. Astron. Astrophys. 2014, 14, 705–718. [Google Scholar] [CrossRef]
  16. Tian, H.; Xu, Z.; He, J.; Madsen, C. Are IRIS Bombs Connected to Ellerman Bombs? Astrophys. J. 2016, 824, 96. [Google Scholar] [CrossRef] [Green Version]
  17. Chen, Y.; Tian, H.; Peter, H.; Samanta, T.; Yurchyshyn, V.; Wang, H.; Cao, W.; Wang, L.; He, J. Flame-like Ellerman Bombs and Their Connection to Solar Ultraviolet Bursts. Astrophys. J. 2019, 875, L30. [Google Scholar] [CrossRef]
  18. Toriumi, S.; Katsukawa, Y.; Cheung, M.C.M. Light Bridge in a Developing Active Region. I. Observation of Light Bridge and its Dynamic Activity Phenomena. Astrophys. J. 2015, 811, 137. [Google Scholar] [CrossRef] [Green Version]
  19. Tian, H.; Yurchyshyn, V.; Peter, H.; Solanki, S.K.; Young, P.R.; Ni, L.; Cao, W.; Ji, K.; Zhu, Y.; Zhang, J.; et al. Frequently Occurring Reconnection Jets from Sunspot Light Bridges. Astrophys. J. 2018, 854, 92. [Google Scholar] [CrossRef] [Green Version]
  20. Vissers, G.J.M.; de la Cruz Rodríguez, J.; Libbrecht, T.; Rouppe van der Voort, L.H.M.; Scharmer, G.B.; Carlsson, M. Dissecting bombs and bursts: Non-LTE inversions of low-atmosphere reconnection in SST and IRIS observations. Astron. Astrophys. 2019, 627, A101. [Google Scholar] [CrossRef]
  21. Ni, L.; Lin, J.; Roussev, I.I.; Schmieder, B. Heating Mechanisms in the Low Solar Atmosphere through Magnetic Reconnection in Current Sheets. Astrophys. J. 2016, 832, 195. [Google Scholar] [CrossRef] [Green Version]
  22. Ni, L.; Lukin, V.S.; Murphy, N.A.; Lin, J. Magnetic Reconnection in Strongly Magnetized Regions of the Low Solar Chromosphere. Astrophys. J. 2018, 852, 95. [Google Scholar] [CrossRef] [Green Version]
  23. Ni, L.; Lukin, V.S. Onset of Secondary Instabilities and Plasma Heating during Magnetic Reconnection in Strongly Magnetized Regions of the Low Solar Atmosphere. Astrophys. J. 2018, 868, 144. [Google Scholar] [CrossRef] [Green Version]
  24. Ni, L.; Lukin, V.S.; Murphy, N.A.; Lin, J. Magnetic reconnection in the low solar chromosphere with a more realistic radiative cooling model. Phys. Plasmas 2018, 25, 042903. [Google Scholar] [CrossRef] [Green Version]
  25. Rouppe van der Voort, L.; De Pontieu, B.; Scharmer, G.B.; de la Cruz Rodríguez, J.; Martínez-Sykora, J.; Nóbrega-Siverio, D.; Guo, L.J.; Jafarzadeh, S.; Pereira, T.M.D.; Hansteen, V.H. Intermittent Reconnection and Plasmoids in UV Bursts in the Low Solar Atmosphere. Astrophys. J. 2017, 851, L6. [Google Scholar] [CrossRef] [Green Version]
  26. Hansteen, V.H.; Archontis, V.; Pereira, T.M.D.; Carlsson, M.; Rouppe van der Voort, L.; Leenaarts, J. Bombs and Flares at the Surface and Lower Atmosphere of the Sun. Astrophys. J. 2017, 839, 22. [Google Scholar] [CrossRef] [Green Version]
  27. Hansteen, V.; Ortiz, A.; Archontis, V.; Carlsson, M.; Pereira, T.M.D.; Bjørgen, J.P. Ellerman bombs and UV bursts: Transient events in chromospheric current sheets. Astron. Astrophys. 2019, 626, A33. [Google Scholar] [CrossRef] [Green Version]
  28. Huang, Z. Magnetic Loops above a Small Flux-emerging Region Observed by IRIS, Hinode, and SDO. Astrophys. J. 2018, 869, 175. [Google Scholar] [CrossRef] [Green Version]
  29. Huang, Z.; Li, B.; Xia, L.; Shi, M.; Fu, H.; Hou, Z. Transition Region Loops in the Very Late Phase of Flux Emergence in IRIS Sit-and-stare Observations. Astrophys. J. 2019, 887, 221. [Google Scholar] [CrossRef]
  30. Huang, Z.; Madjarska, M.S.; Scullion, E.M.; Xia, L.D.; Doyle, J.G.; Ray, T. Explosive events in active region observed by IRIS and SST/CRISP. Mon. Not. R. Astron. Soc. 2017, 464, 1753–1761. [Google Scholar] [CrossRef] [Green Version]
  31. Lemen, J.R.; Title, A.M.; Akin, D.J.; Boerner, P.F.; Chou, C.; Drake, J.F.; Duncan, D.W.; Edwards, C.G.; Friedlaender, F.M.; Heyman, G.F.; et al. The Atmospheric Imaging Assembly (AIA) on the Solar Dynamics Observatory (SDO). Sol. Phys. 2012, 275, 17–40. [Google Scholar] [CrossRef] [Green Version]
  32. Pesnell, W.D.; Thompson, B.J.; Chamberlin, P.C. The Solar Dynamics Observatory (SDO). Sol. Phys. 2012, 275, 3–15. [Google Scholar] [CrossRef] [Green Version]
  33. Scherrer, P.H.; Schou, J.; Bush, R.I.; Kosovichev, A.G.; Bogart, R.S.; Hoeksema, J.T.; Liu, Y.; Duvall, T.L.; Zhao, J.; Title, A.M.; et al. The Helioseismic and Magnetic Imager (HMI) Investigation for the Solar Dynamics Observatory (SDO). Sol. Phys. 2012, 275, 207–227. [Google Scholar] [CrossRef] [Green Version]
  34. Huang, Z.; Madjarska, M.S.; Doyle, J.G.; Lamb, D.A. Coronal hole boundaries at small scales. IV. SOT view. Magnetic field properties of small-scale transient brightenings in coronal holes. Astron. Astrophys. 2012, 548, A62. [Google Scholar] [CrossRef]
  35. Young, P.R.; Keenan, F.P.; Milligan, R.O.; Peter, H. A Si IV/O IV Electron Density Diagnostic for the Analysis of IRIS Solar Spectra. Astrophys. J. 2018, 857, 5. [Google Scholar] [CrossRef]
  36. Tian, H.; Zhu, X.; Peter, H.; Zhao, J.; Samanta, T.; Chen, Y. Magnetic Reconnection at the Earliest Stage of Solar Flux Emergence. Astrophys. J. 2018, 854, 174. [Google Scholar] [CrossRef] [Green Version]
  37. Judge, P.G. UV Spectra, Bombs, and the Solar Atmosphere. Astrophys. J. 2015, 808, 116. [Google Scholar] [CrossRef] [Green Version]
  38. Avrett, E.H.; Loeser, R. Models of the Solar Chromosphere and Transition Region from SUMER and HRTS Observations: Formation of the Extreme-Ultraviolet Spectrum of Hydrogen, Carbon, and Oxygen. Astrophys. J. Suppl. Ser. 2008, 175, 229–276. [Google Scholar] [CrossRef] [Green Version]
  39. Pereira, T.M.D.; Leenaarts, J.; De Pontieu, B.; Carlsson, M.; Uitenbroek, H. The Formation of IRIS Diagnostics. III. Near-ultraviolet Spectra and Images. Astrophys. J. 2013, 778, 143. [Google Scholar] [CrossRef] [Green Version]
  40. Pereira, T.M.D.; Carlsson, M.; De Pontieu, B.; Hansteen, V. The Formation of IRIS Diagnostics. IV. The Mg II Triplet Lines as a New Diagnostic for Lower Chromospheric Heating. Astrophys. J. 2015, 806, 14. [Google Scholar] [CrossRef] [Green Version]
  41. Lin, H.H.; Carlsson, M. The Formation of IRIS Diagnostics. VII. The Formation of the OI 135.56 NM Line in the Solar Atmosphere. Astrophys. J. 2015, 813, 34. [Google Scholar] [CrossRef] [Green Version]
  42. Leenaarts, J.; Pereira, T.M.D.; Carlsson, M.; Uitenbroek, H.; De Pontieu, B. The Formation of IRIS Diagnostics. II. The Formation of the Mg II h&k Lines in the Solar Atmosphere. Astrophys. J. 2013, 772, 90. [Google Scholar] [CrossRef] [Green Version]
  43. Guglielmino, S.L.; Zuccarello, F.; Young, P.R.; Murabito, M.; Romano, P. IRIS Observations of Magnetic Interactions in the Solar Atmosphere between Preexisting and Emerging Magnetic Fields. I. Overall Evolution. Astrophys. J. 2018, 856, 127. [Google Scholar] [CrossRef] [Green Version]
  44. Leenaarts, J.; Pereira, T.M.D.; Carlsson, M.; Uitenbroek, H.; De Pontieu, B. The Formation of IRIS Diagnostics. I. A Quintessential Model Atom of Mg II and General Formation Properties of the Mg II h&k Lines. Astrophys. J. 2013, 772, 89. [Google Scholar] [CrossRef] [Green Version]
  45. Sainz Dalda, A.; de la Cruz Rodríguez, J.; De Pontieu, B.; Gošić, M. Recovering Thermodynamics from Spectral Profiles observed by IRIS: A Machine and Deep Learning Approach. Astrophys. J. Lett. 2019, 875, L18. [Google Scholar] [CrossRef] [Green Version]
  46. Pariat, E.; Aulanier, G.; Schmieder, B.; Georgoulis, M.K.; Rust, D.M.; Bernasconi, P.N. Resistive Emergence of Undulatory Flux Tubes. Astrophys. J. 2004, 614, 1099–1112. [Google Scholar] [CrossRef]
  47. Hou, Z.; Tian, H.; Chen, H.; Zhu, X.; Huang, Z.; Bai, X.; He, J.; Song, Y.; Xia, L. Formation of Solar Quiescent Coronal Loops through Magnetic Reconnection in an Emerging Active Region. Astrophys. J. 2021, 915, 39. [Google Scholar] [CrossRef]
Figure 1. The closer looks at UB1-12 in SJ 1330 Å (or 1400 Å) images (a1l1) and HMI magnetograms (a2l2). The sizes of small regions in SJ 1330 Å (or 1400 Å) images and HMI magnetograms are 10″ × 10″. The locations of the UBs are at the center of small regions in the SJ images and marked by blue contours on the SJ 1330/1400 Å images. The related loops are marked by the blue dashed lines in SJ 1330/1400 Å images. The scales of the HMI magnetograms are labeled in the corresponding images. An animation of this figure is available.
Symmetry 13 01390 g001
Figure 2. Spectral respondings of UB1 as an example. (a,gn): the closer looks at UB1 in intensity images for Si iv 1394 Å, the NUV continuum, the red wing and line center of Mg ii 2798.8 Å, the outer blue wing (at the Doppler shifts from −60 kms 1 to −40 kms 1 ) and line center of Mg ii h, O i 1355.60 Å, and O iv 1399.78 Å and 1401.16 Å. In intensity images whose sizes are 10″ × 10″, the pixels with UB-type spectra are marked by the light-blue points. (bf): typical IRIS line profiles (black lines) of UB1 at Si iv 1394, 1403, C ii and Mg ii spectral windows and aligned line profiles for Si iv 1394 Å (black solid lines) and 1403 Å (light-blue dashed lines). Radiometric calibration was applied on the spectra to convert the spectral units from DN to flux with the units of erg cm 2 s 1 sr 1 pixel 1 . The reference line profiles (blue lines) averaged over the relative quiet region inside the active region is also overplotted. In Panel (e), we also plot the Ni ii presenting profile in red solid lines.
Symmetry 13 01390 g002
Figure 3. The correlation diagrams between various spectroscopic parameters of UBs: (a) Ni ii 1393 intensity and NUV continuum intensity, (b) Ni ii 1393 intensity and Mg ii 2798.8 red-wing intensity, (c) Ni ii 1393 intensity and Mg ii h blue-wing intensity, (d) Ni ii 1393 intensity and O i 1355.6 intensity, (e) Si iv 1403 intensity and Ni ii 1393 intensity, (f) Si iv 1403 intensity and NUV continuum intensity, (g) Si iv 1403 intensity and Mg ii h blue-wing intensity, (h) Si iv 1403 intensity and O i 1355.6 intensity. The corresponding correlation coefficients (CCs) are labelled in the diagrams. The error bars for I N U V , I 2798.8 , I M g I I h and I O I are obtained from the ratios of the standard deviations of UBs to those of backgrounds (i.e., the whole FOVs).
Symmetry 13 01390 g003
Figure 4. The left three columns (a1d1, a2d2 and a3d3): closer looks for UB1, UB5, UB7, UB11 and their associated loops in SJ 1400 Å or 1330 Å, HMI and AIA 304 Å images, respectively. The black contours and dotted-lines in these images represent the UBs and loops, respectively. The footpoints (FPs) are marked in HMI magnetograms. The right column (a1a4): time-space images for the loops marked by green dotted-lines in AIA 304 Å images. The blue solid lines indicate the flows which are originated from UB-regions and propagate along loops. The green solid curves represent light curves of UBs obtained from SJ 1400 Å images. An animation of this figure is provided.
Symmetry 13 01390 g004
Table 1. Summary of the datasets analysed in the present study.
Data IDDate and Time
(UT)
TargetRaster MapsSlit–Jaw Imaging Data
ARX,Y (″)ModeStep Size
(″)
EXPPassband [Å]Cadence
[s]
Pixel Size
DATA114 February 2014
11:49–15:21
11,974481, −981 raster,
400 steps
0.3530 s1330/140063 s0.17″ × 0.17″
DATA225 July 2014
13:20–18:58
12,121−541, 5510 rasters
64 steps
0.3530 s1330/2796/2832127 s0.17″ × 0.17″
DATA35 August 2014
07:55–08:53
12,13235, −3931 raster
400 steps
0.358 s1400/2796/283235 s0.33″ × 0.33″
DATA420 April 2015
07:59–08:35
12,32526, 1551 raster
400 steps
0.355 s1400/2796/283221 s0.17″ × 0.17″
X,Y gives the FOV center on the Sun. The fifth column presents the observing mode of raster scan. The slit moves from left to right in the imaging coordinate. EXP: The exposure time of the spectral observations.
Table 2. The summary of the specified values of the properties for UBs.
UBI 1403 RatioO ivlog( N e 1 )log( N e 2 )I Ni II V Doppler I NUV I 2798.8 Mg ii h Resp.I Mg II I O I LFB
( × 10 4 ) 1394 / 1403 Emission[ cm 3 ][ cm 3 ] [kms 1 ] redwing [kms 1 ] bluewing [min][G]
18.01.92yes11.1511.910.30 (0.026)−2.81.301.75[−160, −22][26, 155]6.414.0726480
23.01.94yes10.4711.910.36 (0.054)0.61.662.73[−160, −20][25, 155]16.376.514167
32.01.97no××0.38 (0.056)−1.4××[−120, −27][26, 130]2.723.554176
42.61.94no××0.36 (0.026)0.71.701.66[−160, −25][24, 155]4.643.96>2057
53.21.88yes11.0411.880.28 (0.059)−4.6××[−100, −22][18, 95]3.553.29108150
61.72.02no××0.42 (0.043)−2.61.472.00[−130, −25][24, 125]7.804.538.30
71.91.85no××0.53 (0.025)−1.4×2.82[−120, −23][27, 120]5.933.7860−67
83.51.96no××0.55 (0.021)0.62.204.50[−160, −17][18, 155]19.678.5930−184
92.71.99only 1401×12.260.31 (0.055)−2.31.261.51[−145, −20][22, 120]6.894.28120137
101.01.99no××0.36 (0.112)0.11.351.22[−160, −25][22, 155]4.364.13120121
112.41.95only 1401×11.940.26 (0.099)−1.41.201.56[−160, −26][17, 155]3.453.0548−91
121.62.02no××0.59 (0.295)0.1××[−105, −22][21, 110]11.223.32354
PreE, B1.7–2.0not all×12–13×−5EEEEEtens×
I 1403 : Integrated intensity of Si iv 1402.77 Å, the unit is erg cm 2 s 1 sr 1 pixel 1 . Ratio: Intensity ratio of Si iv 1393.76 Å to 1402.77 Å. N e 1 : Density diagnostics from the intensity ratio of O iv 1399.78 Å to 1401.16 Å, the theoretical intensity ratio-density curve is derived from CHIANTI v8. N e 2 : Density diagnostics from the intensity ratio of Si iv 1402.77 Å to O iv 1401.16 Å with the Log-linear DEM method described in Young et al. [35]. I N i I I : Relative intensity of Ni ii 1393.33 Å to the amplified blue wing of Si iv 1402.77 Å at λ N i I I ± FWHM around 1393.33 Å. The errors of I N i I I shown in the brackets are calculated from the measurement errors provided by the IRIS level 2 data and transferred in the calculating process. V D o p p l e r : Doppler shifts for Ni ii 1393.33 Å. I N U V , I 2798.8 , I M g I I h and I O I : The relative intensities of the intensities of UB to the average intensities in the whole FOVs for NUV continuum, Mg ii 2798.8 Å red-wing, Mg ii h blue-wing and O i 1355.60 Å, respectively. Mg ii h Resp.: Wavelength range of Mg ii h in the units of kms 1 , in which the UBs have responses. LF: lifetime of UBs. B: photospheric LOS magnetic field strength (−/+) of UBs in the location marked by the blue contour in Figure 1. Pre: spectral parameters reported in the previous studies, e.g., [5,13,16,36]. Because the lack of quantitative values, here we used ’E’ and ’B’ to, respectively, represent the enhancements and broadening of spectral lines as reported in the previous studies.
Table 3. Parameters for UBs and their associated loops.
UB IDLoop NumberMagnetic Strength [G]Loop LengthApparent Velocity
UB-RegionFootpoint[Mm][km s 1 ]
UB13 in 1400
1 in 304
−194 ± 22/19 ± 5−234 ± 114.2
(304)
24 ± 3
UB5>4 in 1400
4 in 304
−52 ± 6/102 ± 3FP1: −541 ± 6
FP2: 146 ± 20
FP3: 698 ± 70
16.5
10.0
18.0
45 ± 15
UB75 in 1330
2 in 304
−42 ± 4/27 ± 5FP1: 108 ± 6
FP2: −80 ± 4
7.1
5.4
100 ± 22
UB117 in 1400
6 in 304
−73 ± 28/<10FP1: 246 ± 16
FP2: 171 ± 6
FP3: −132 ± 3
11.0
10.7
11.6 ± 2.9
29 ± 15
Loop number: The loop (system) numbers associated with UBs are obtained by multi-channels, i.e., SJI 1400/1330 Å and AIA 304 Å. Magnetic strength: photospheric magnetic field strength in the unit of Gauss around the UB-region. Please note that the magnetic strengths listed in Table 2 were obtained from the regions of UV bursts only that is different from here. Apparent velocity: The velocity of flows are derived from AIA 304 Å images.
Publisher’s Note: MDPI stays neutral with regard to jurisdictional claims in published maps and institutional affiliations.

