
Particle Flow Simulation of the Strength and Failure Characteristics of a Layered Composite Rock-Like Sample with a Single Hole

 ,
,
Abstract
:1. Introduction
2. Model Establishment and Micro-Parameter Calibration
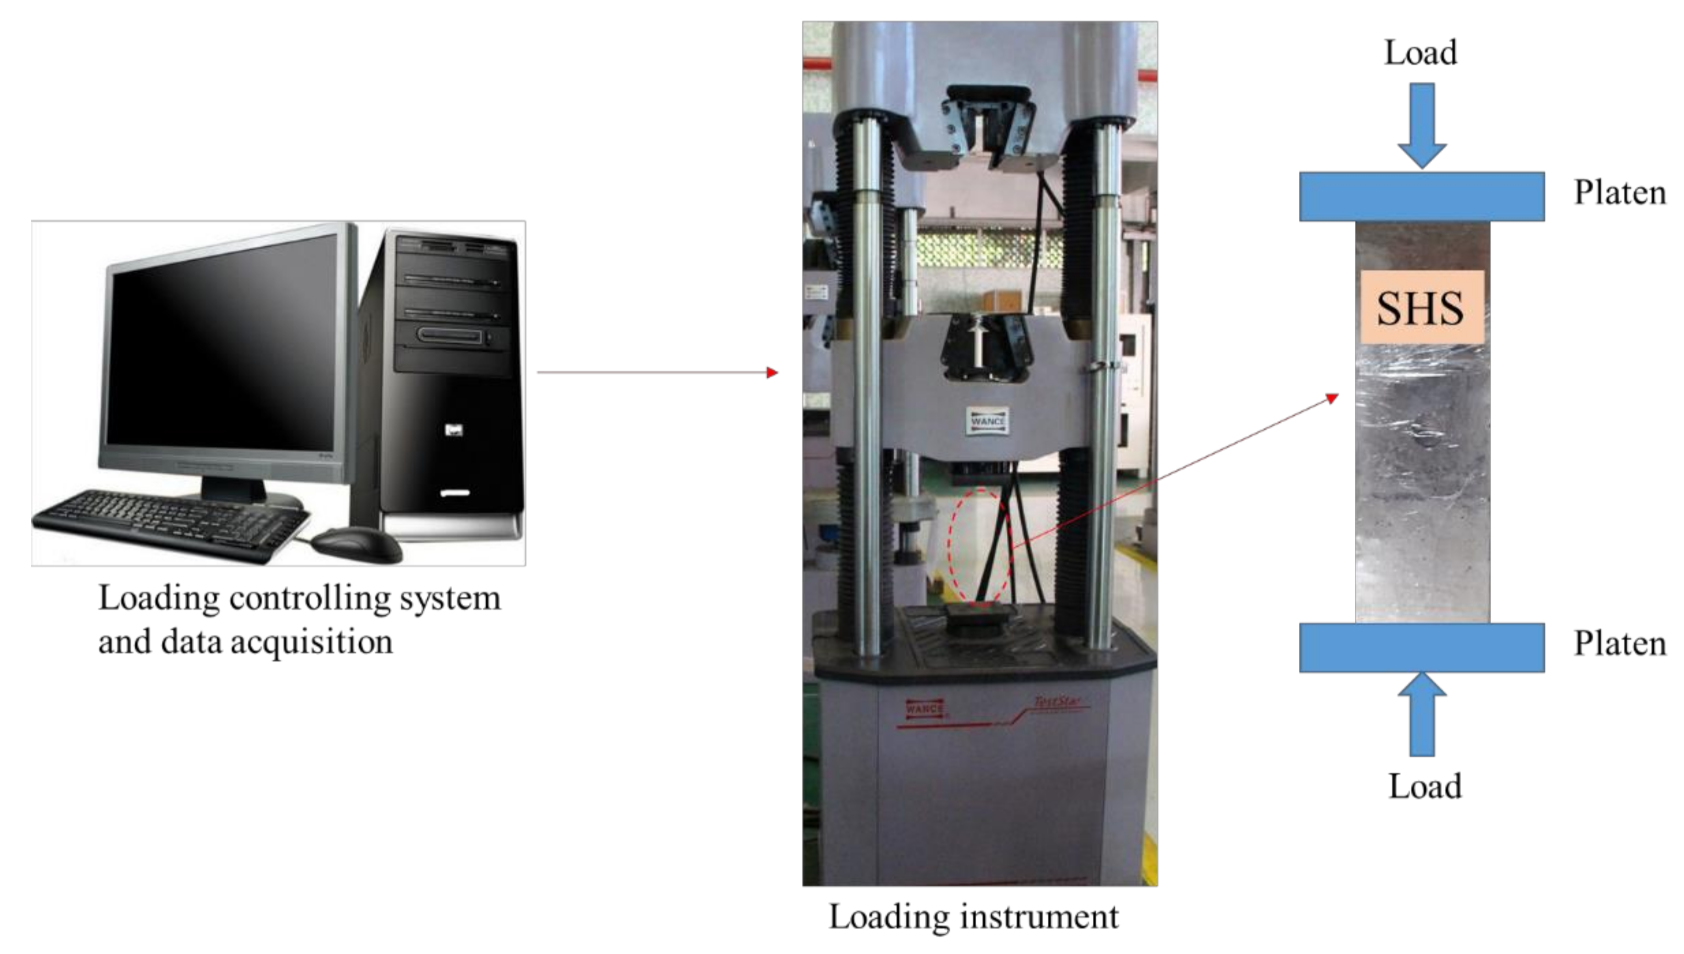
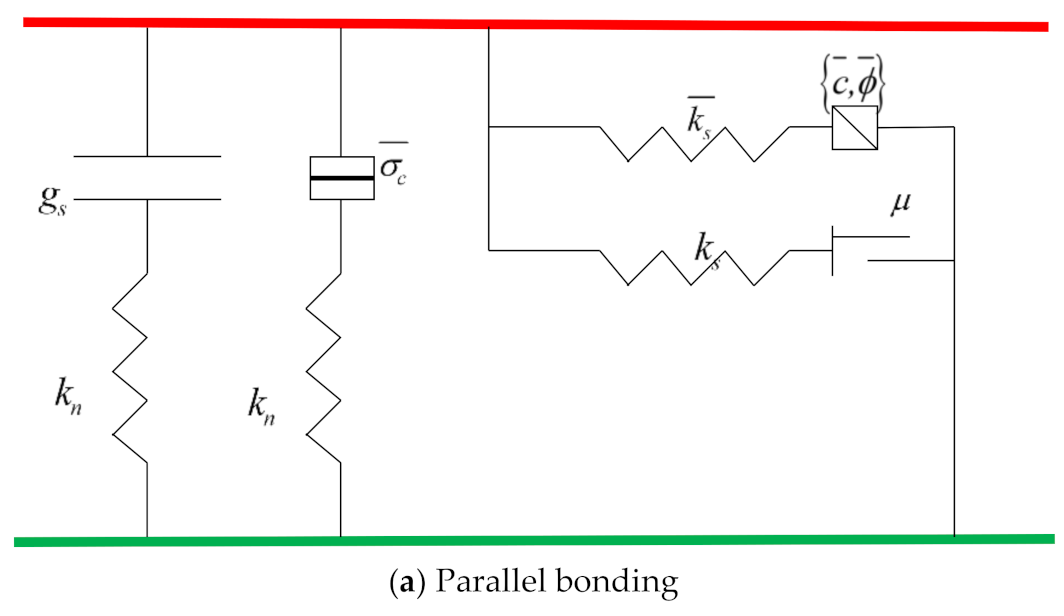
2.1. Brief Introduction of the Particle Flow Program
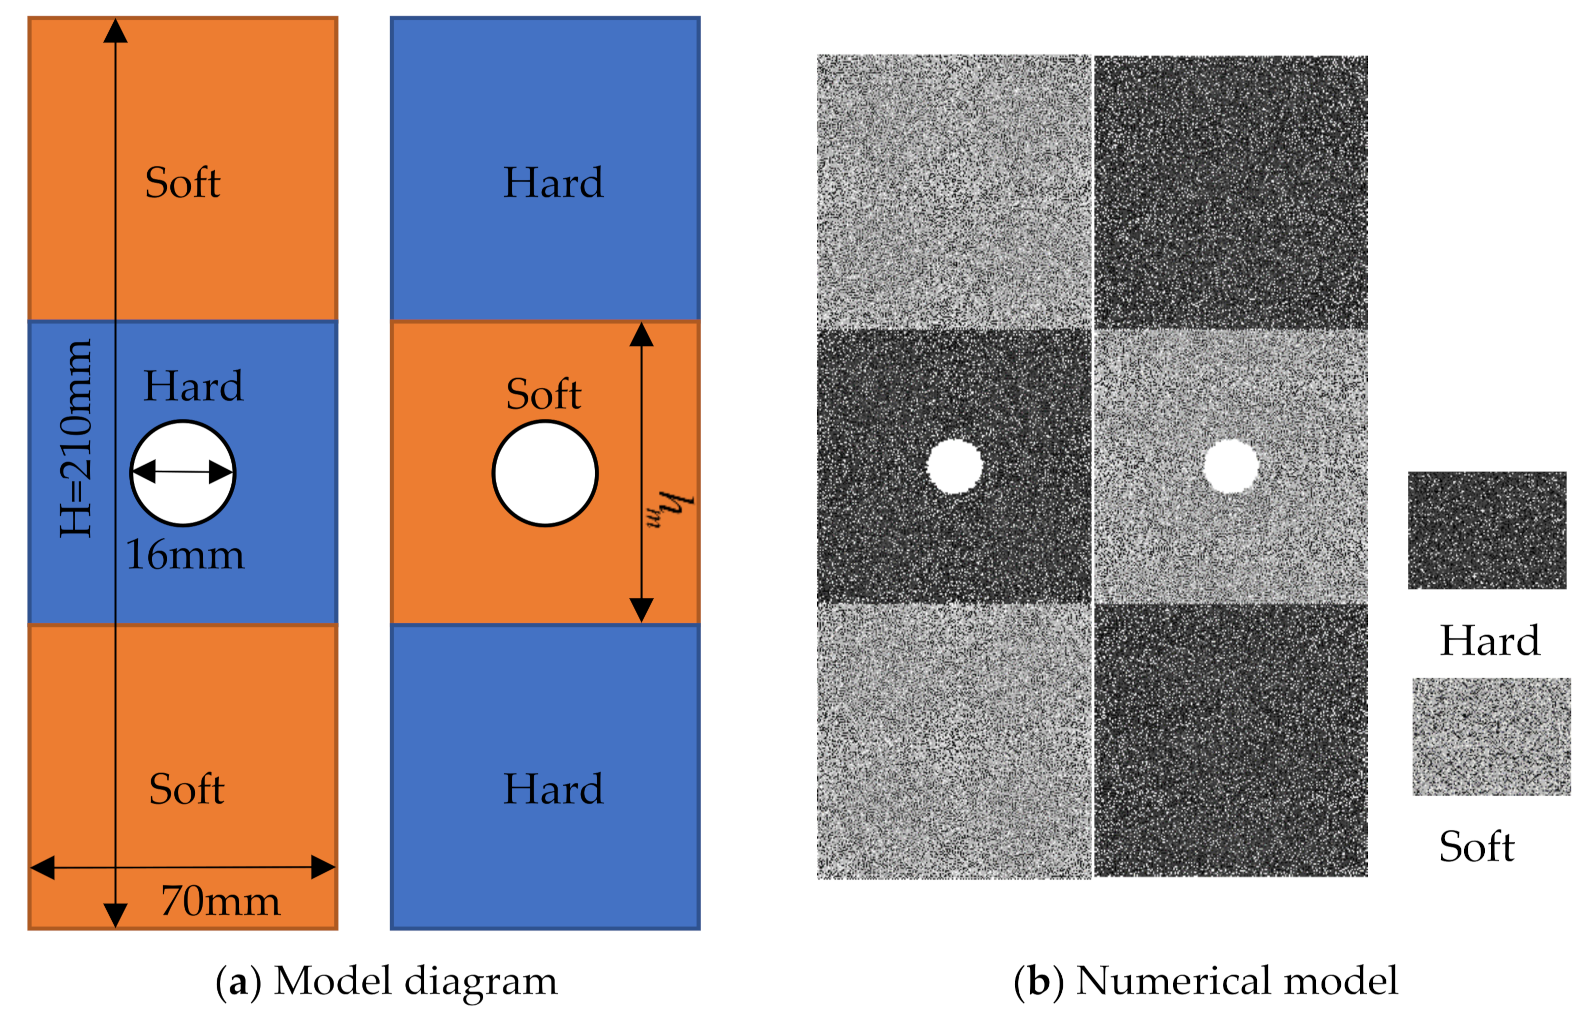
2.2. Modelling
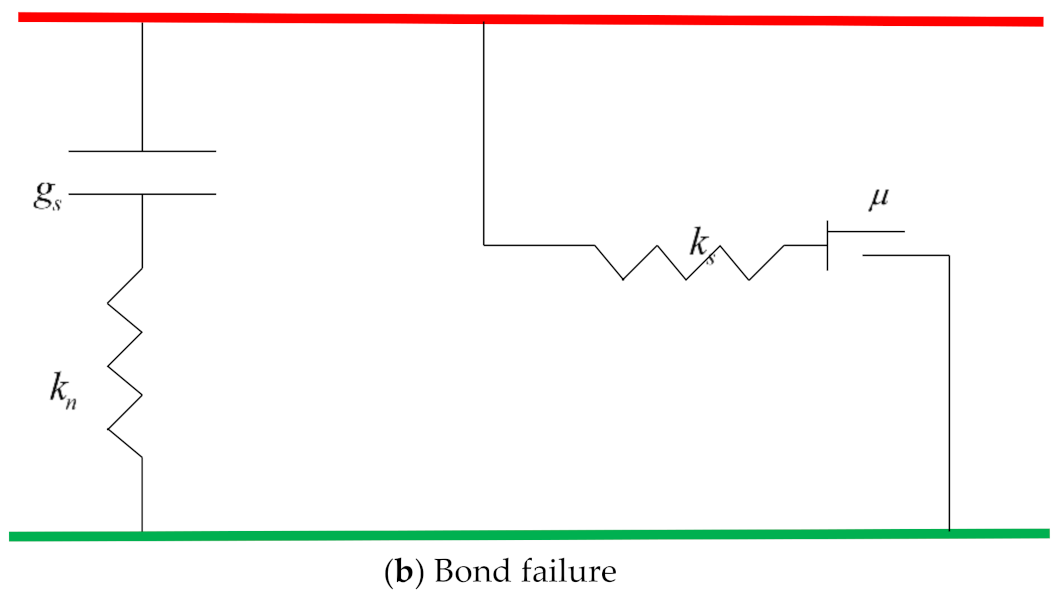
2.3. Micro-Parameter Calibration
3. Results and Analysis
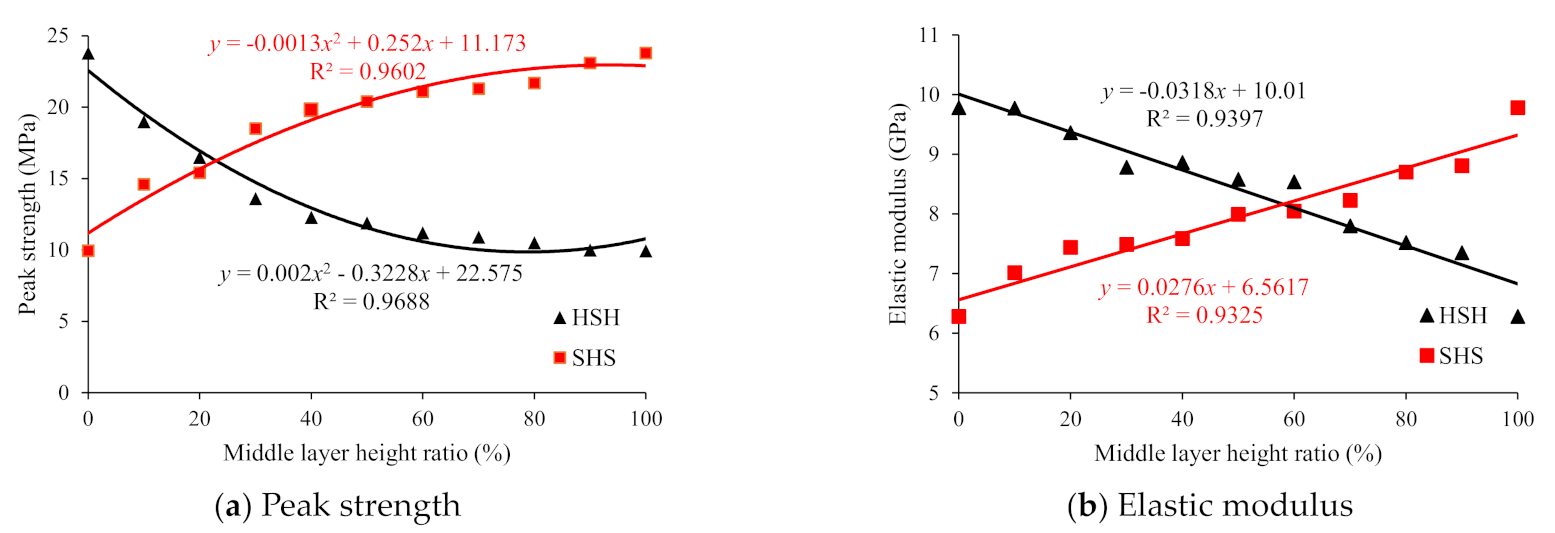
3.1. Analysis of the Mechanical Parameters of a Layered Rock Mass with a Single Hole
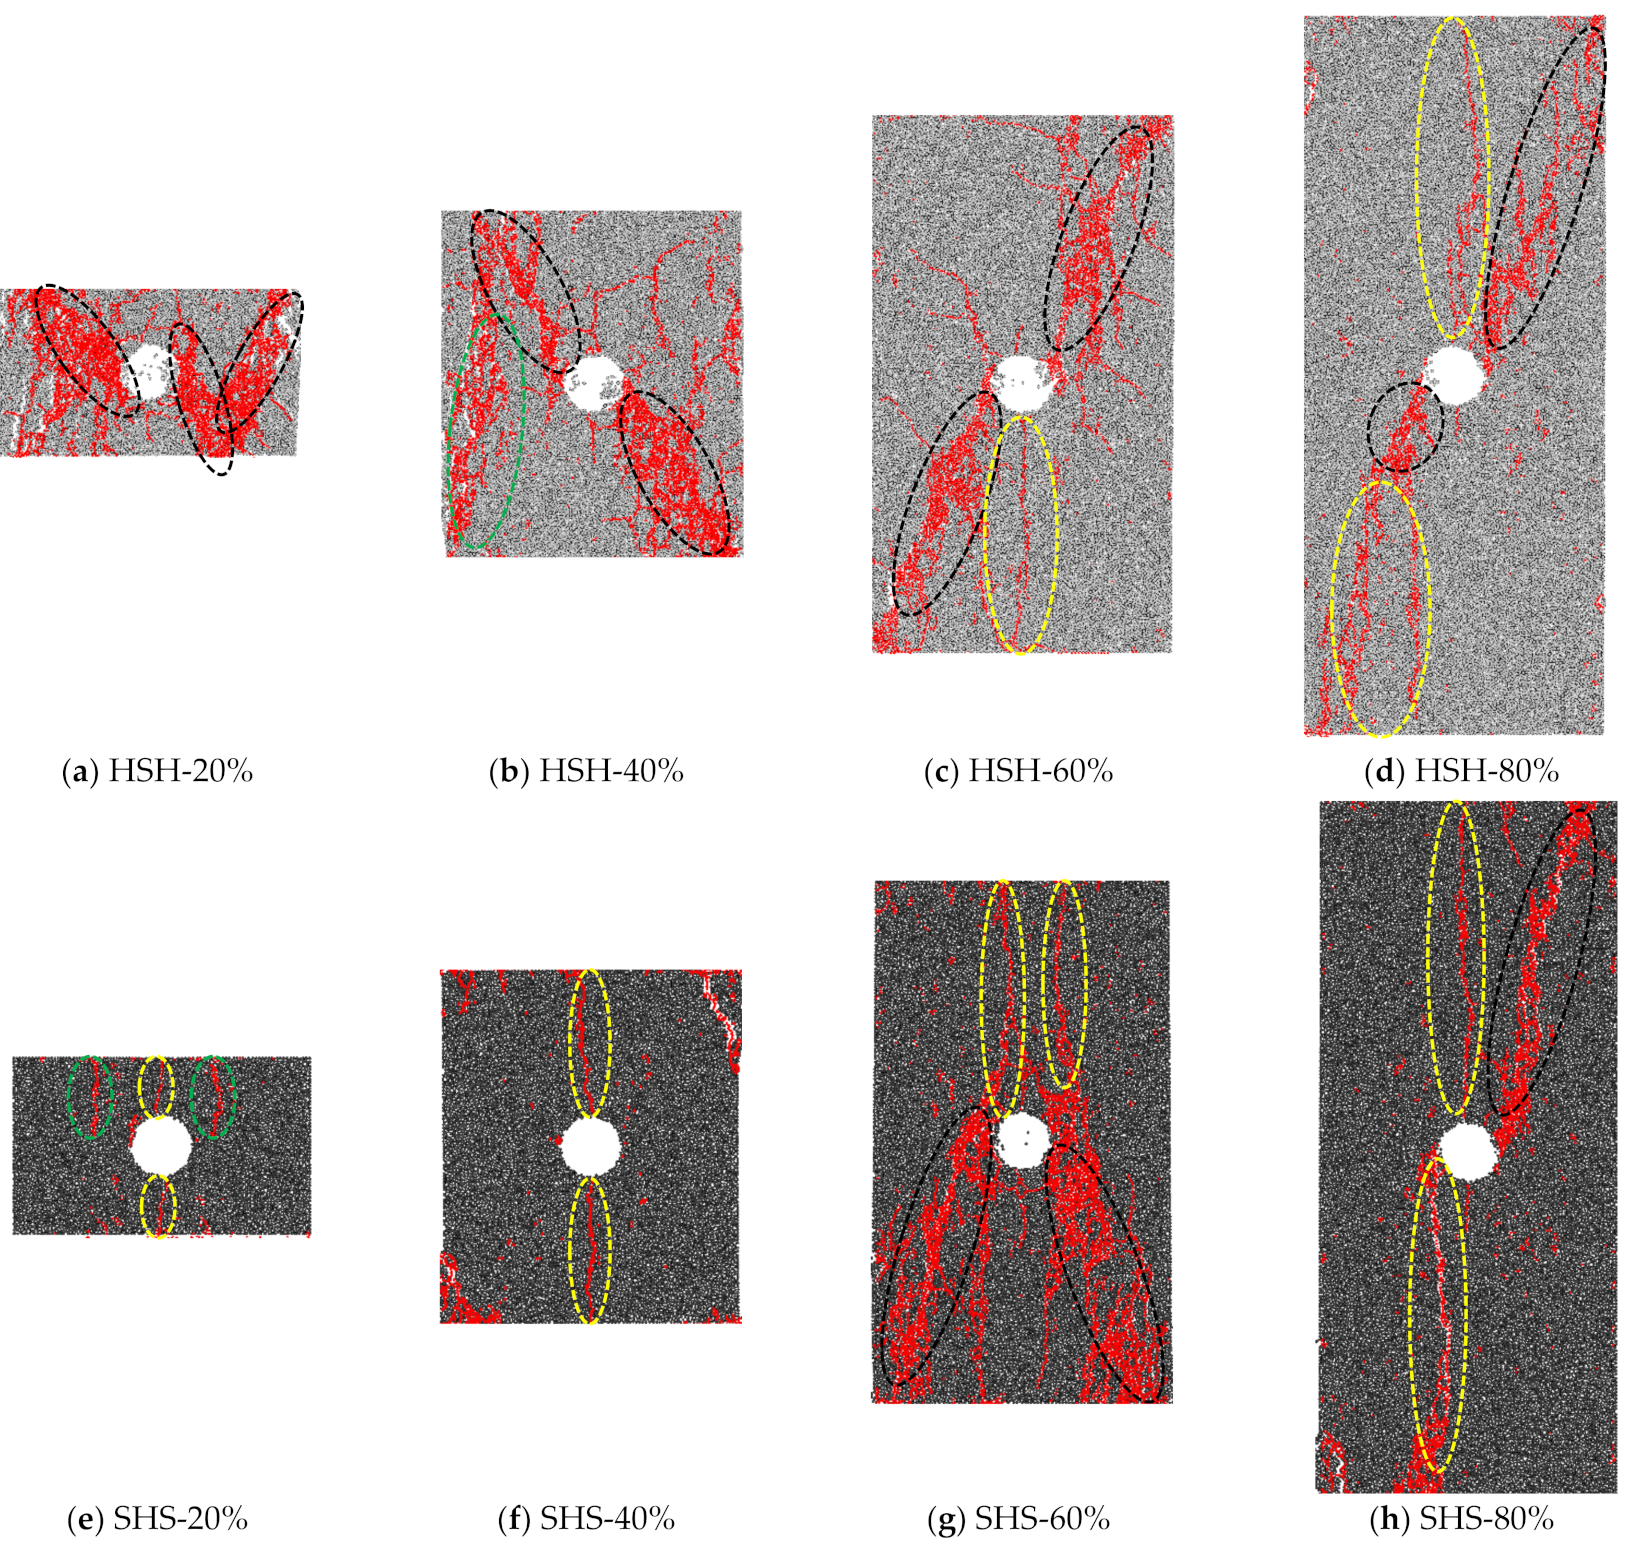
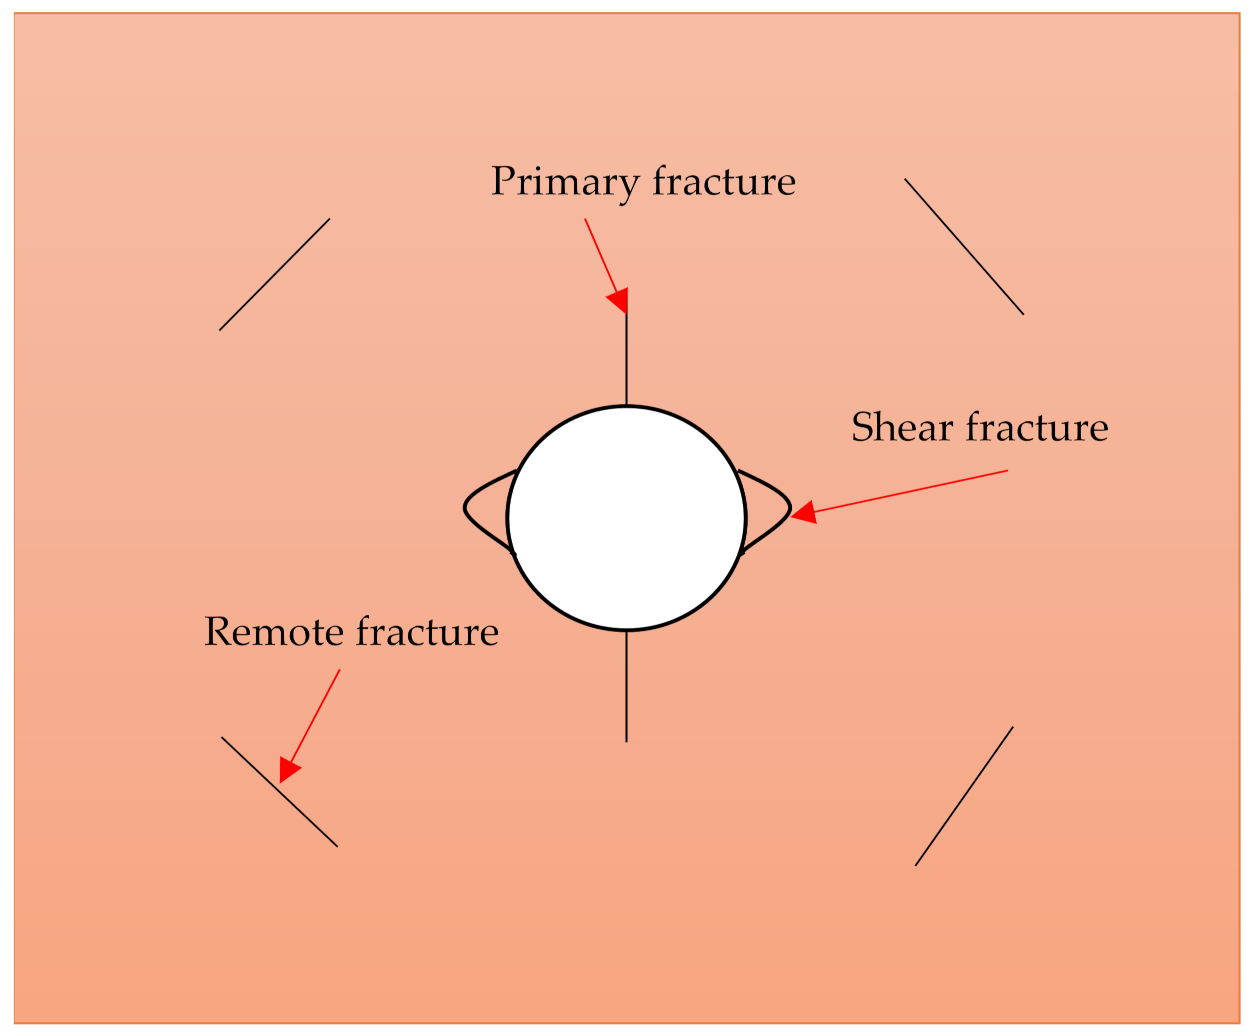
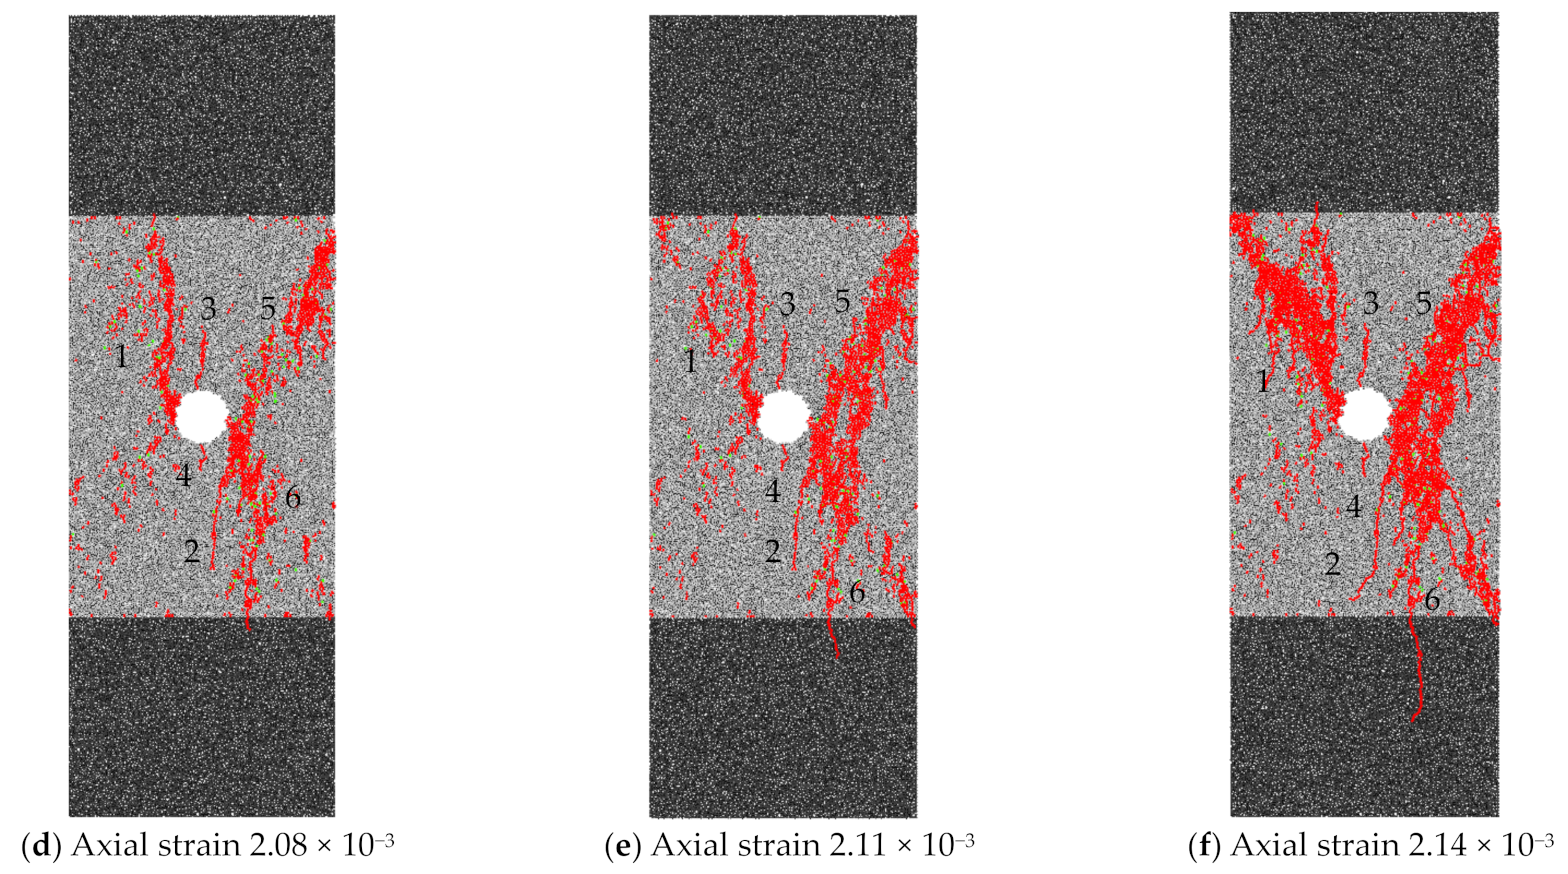
3.2. Analysis of the Failure Characteristics of a Layered Rock Mass with a Single Hole
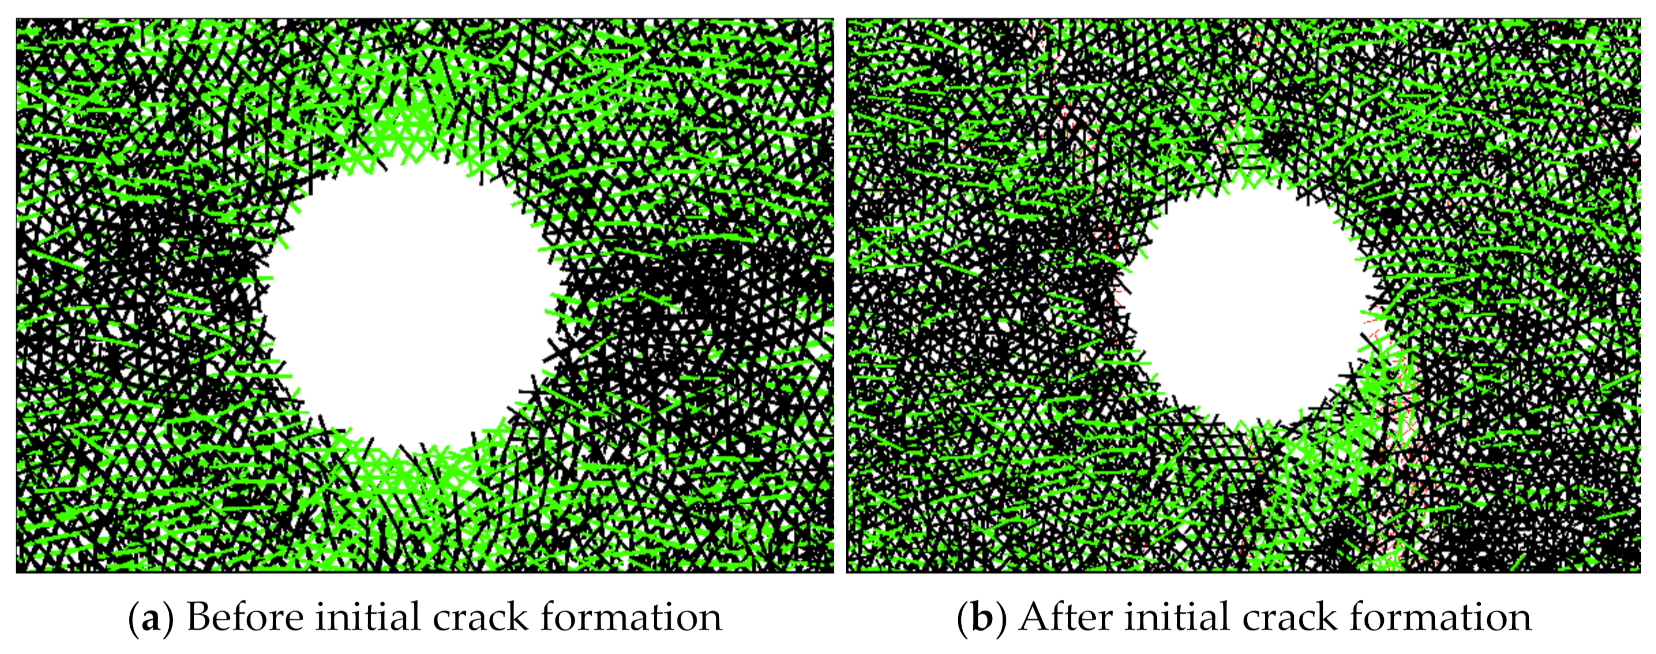
4. Discussion on the Crack Propagation Mechanism
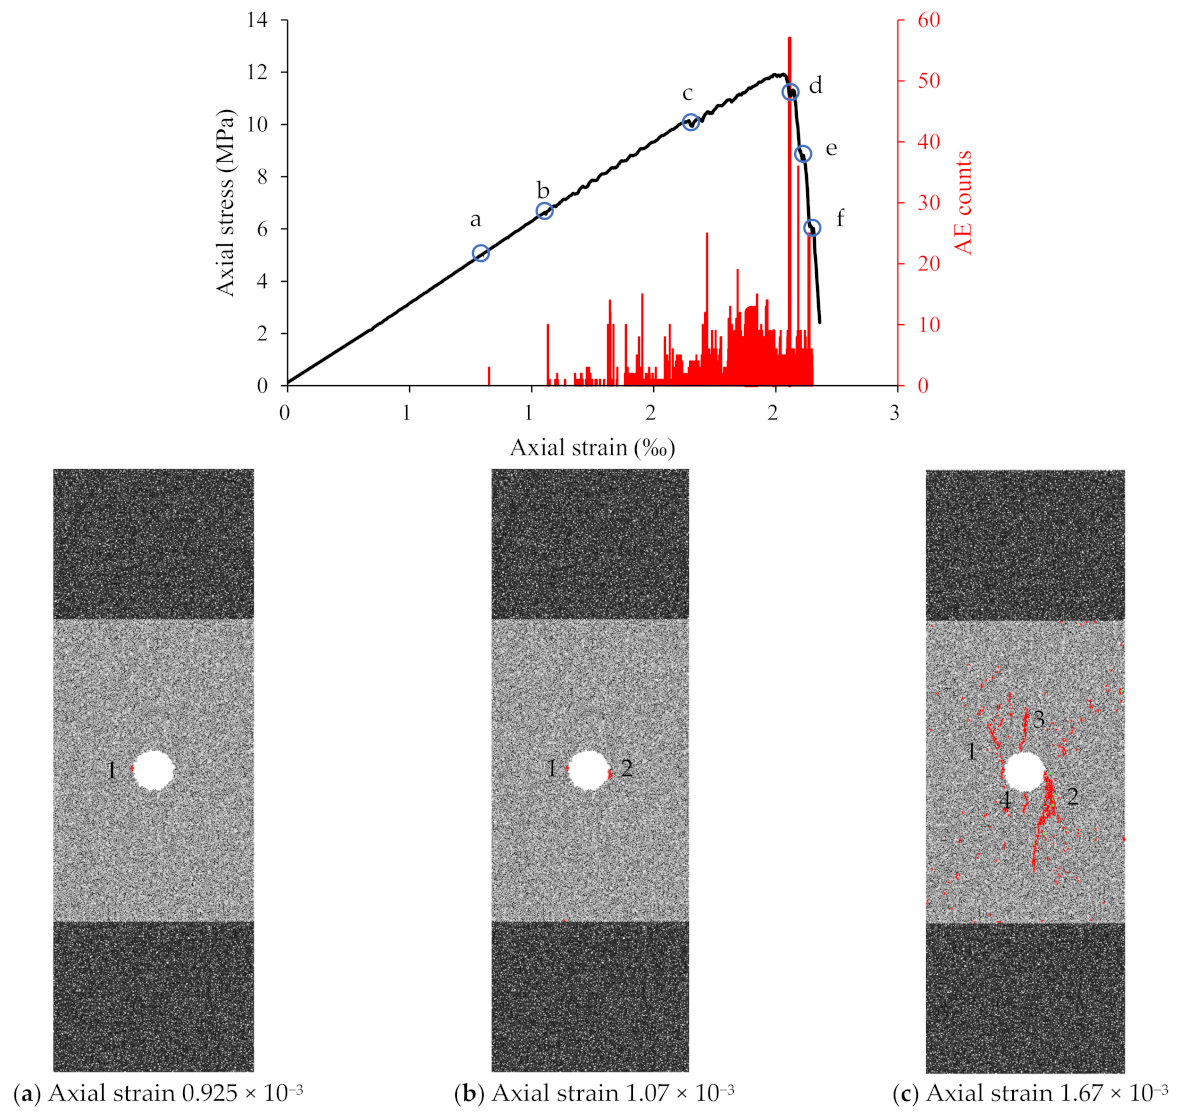
4.1. Relationship between Crack Propagation and AE
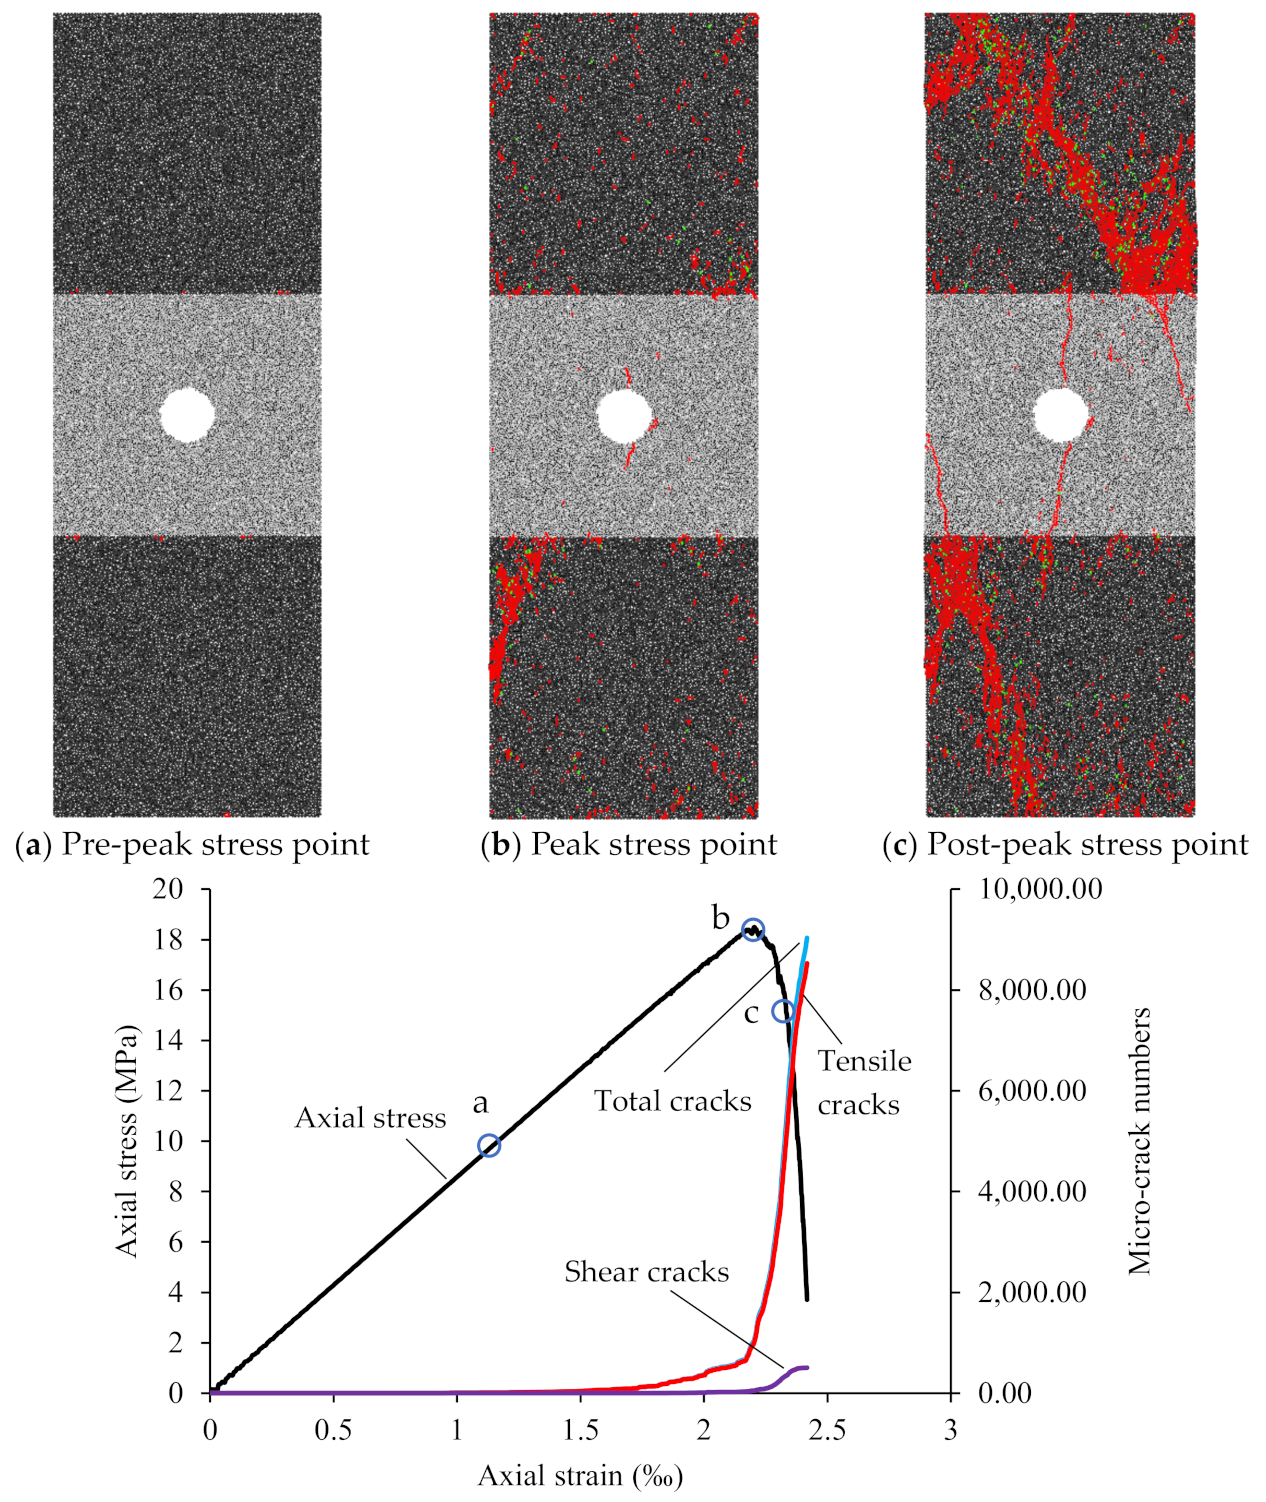
4.2. Relationship between the Crack Growth Process and Stress Field
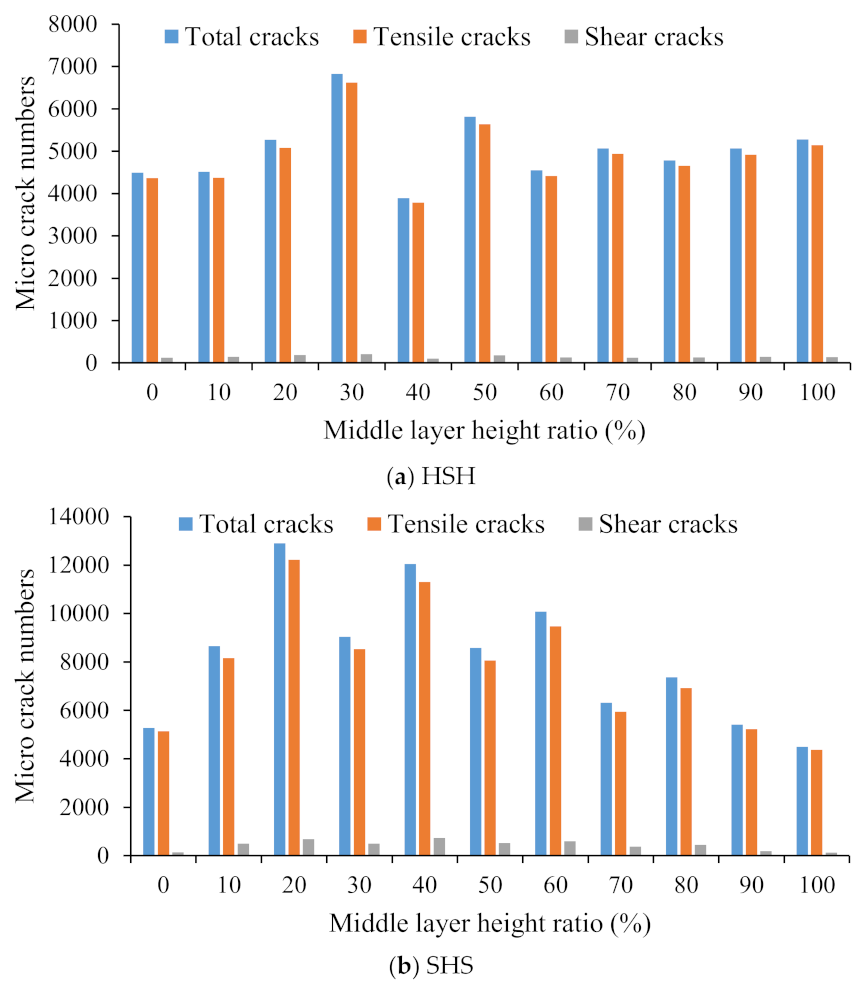
4.3. Relationship between the Crack Growth Process and Number of Micro-cracks
5. Conclusions
Author Contributions
Funding
Institutional Review Board Statement
Informed Consent Statement
Data Availability Statement
Conflicts of Interest
References
- Wen, S.; Zhang, C.S.; Chang, Y.L.; Hu, P. Dynamic compression characteristics of layered rock mass of significant strength changes in adjacent layers. J. Rock Mech. Geotech. Eng. 2020, 12, 353–365. [Google Scholar] [CrossRef]
- Huang, D.M.; Chang, X.K.; Tan, Y.L.; Zhou, J.H.; Yin, Y.C. Numerical Study of the Mechanical and Acoustic Emissions Characteristics of Red Sandstone under Different Double Fracture Conditions. Symmetry 2019, 11, 772. [Google Scholar] [CrossRef] [Green Version]
- Xie, H.P.; Liu, J.F.; Ju, Y.; Li, J.; Xie, L.Z. Fractal property of spatial distribution of acoustic emissions during the failure process of bedded rock salt. Int. J. Rock. Mech. Min. Sci. 2011, 48, 1344–1351. [Google Scholar] [CrossRef]
- Aksoy, C.O.; Kantarci, O.; Ozacar, V. An example of estimating rock mass deformation around an underground opening using numerical modeling. Int. J. Rock. Mech. Min. Sci. 2010, 47, 272–278. [Google Scholar] [CrossRef]
- Yang, X.W.; Zhang, X.P.; Zhang, Q.; Li, C.D.; Wang, D.J. Study on the mechanisms of crack turning in bedded rock. Eng. Fract. Mech. 2021, 247, 107630. [Google Scholar] [CrossRef]
- Stephansson, O. Stability of single openings in horizontally bedded rock. Eng. Geol. 1971, 5, 5–17. [Google Scholar] [CrossRef]
- Jaeger, J.C. Shear failure of anistropic rocks. Geol. Mag. 1960, 97, 65–72. [Google Scholar] [CrossRef]
- Tien, Y.M.; Kuo, M.C. A failure criterion for transversely isotropic rocks. Int. J. Rock. Mech. Min. Sci. 2001, 35, 399–412. [Google Scholar] [CrossRef]
- Saeidi, O.; Rasouli, V.; Vaneghi, R.G.; Gholami, R.; Torabi, S.R. A modified failure criterion for transversely isotropic rocks. Geosci. Front. 2014, 5, 215–225. [Google Scholar] [CrossRef]
- Tien, Y.M.; Kuo, M.C.; Juang, C.H. An experimental investigation of the failure mechanism of simulated transversely isotropic rocks. Int. J. Rock. Mech. Min. Sci. 2006, 43, 1163–1181. [Google Scholar] [CrossRef]
- Zhang, G.M.; Li, Y.P.; Yang, C.L.; Liu, W.; Shi, X.L.; Yang, C.H. Physical simulation of the deformation and failure mechanism of soft and hard interbedded salt rocks. Chin. J. Rock Mech. Eng. 2012, 31, 1813–1820. [Google Scholar]
- Liu, X.Y.; Ma, L.J.; Ma, S.N.; Zhang, X.W.; Gao, L. Comparative study of four failure criteria for intact bedded rock salt. Int. J. Rock. Mech. Min. Sci. 2011, 48, 341–346. [Google Scholar] [CrossRef]
- Qiu, J.D.; Li, D.Y.; Li, X.B.; Zhou, Z.L. Dynamic Fracturing Behavior of Layered Rock with Different Inclination Angles in SHPB Tests. Shock Vib. 2017, 2017, 7687802. [Google Scholar] [CrossRef] [Green Version]
- Xu, D.P.; Gu, G.K.; Wang, L.P.; Chen, D.F.; Huang, S.L. An Index for Estimating the Stability of the Layered Rock Masses under Excavation Disturbance. Avd. Mater. Sci. Eng. 2018, 2018, 1761895. [Google Scholar] [CrossRef] [Green Version]
- Parsamehr, H.; Mohammadi, S.D.; Moarefvand, P. Numerical modeling of wellbore stability in layered rock masses. Arab. J. Geosci. 2015, 8, 10845–10858. [Google Scholar] [CrossRef]
- Wasantha, P.L.P.; Ranjith, P.G.; Shao, S.S. Energy monitoring and analysis during deformation of bedded-sandstone: Use of acoustic emission. Ultrasonics 2014, 54, 217–226. [Google Scholar] [CrossRef]
- Wang, H.; Ren, F.Q.; Chang, Y. Effect of bedding angle on tunnel slate failure behavior under indirect tension. Geomat. Nat. Haz. Risk 2020, 11, 428–445. [Google Scholar] [CrossRef]
- Wu, B.; Huang, W. Uniaxial Compression Mechanical Properties of Rock Samples in Soft and Hard Composite Strata. Adv. Mater. Sci. Eng. 2020, 2020, 5920348. [Google Scholar] [CrossRef]
- Cheng, J.L.; Yang, S.Q.; Chen, K.; Ma, D.; Li, F.Y.; Wang, L.M. Uniaxial experimental study of the acoustic emission and deformation behavior of composite rock based on 3D digital image correlation (DIC). Acta Mech. Sin. 2017, 33, 999–1021. [Google Scholar] [CrossRef]
- Duveau, D.; Shao, J.F. A modified single plane of weakness theory for the failure of highly stratified rocks. Int. J. Rock. Mech. Min. Sci. 1998, 35, 807–813. [Google Scholar] [CrossRef]
- Nasseri, M.H.B.; Rao, K.S.; Ramamurthy, T. Anisotropic strength and deformational behavior of Himalayan schists. Int. J. Rock. Mech. Min. Sci. 2003, 40, 3–23. [Google Scholar]
- Zhang, X.M.; Feng, Y.; Yang, J.S. Experimental Study on Anisotropic Strength Properties of Sandstone. Electron. J. Geotech. Eng. 2010, 15, 1325–1335. [Google Scholar]
- Xu, L.R.; Huang, Y.Y.; Rosakis, A.J. Dynamic crack deflection and penetration at interfaces in homogeneous materials: Experimental studies and model predictions. J. Mech. Phys. Solids 2003, 51, 461–486. [Google Scholar]
- Sammis, C.G.; Ashby, M.F. The failure of brittle porous solids under compressive stress states. Acta Metall. 1986, 34, 511–526. [Google Scholar] [CrossRef]
- Carranaza-Torres, C.; Fairhurst, C. Application of the Convergence-Confinement method of tunnel design to rock masses that satisfy the Hoek-Brown failure criterion. Tunn. Undergr. Space Technol. 2000, 15, 187–213. [Google Scholar] [CrossRef]
- Unlu, T.; Gercek, H. Effect of Poisson’s ratio on the normalized radial displacements occurring around the face of a circular tunnel. Tunn. Undergr. Space Technol. 2003, 15, 547–553. [Google Scholar] [CrossRef]
- Lajtai, E.Z.; Lajtai, V.N. The collapse of cavities. Int. J. Rock Mech. Min. Sci. 1975, 12, 81–86. [Google Scholar] [CrossRef]
- Carter, B.J.; Lajtai, E.Z.; Petukhov, A. Primary and remote fracture around underground cavities. Int. J. Numer. Anal. Methods Geomech. 1991, 15, 21–40. [Google Scholar] [CrossRef]
- Wong, R.H.C.; Lin, P.; Tang, C.A. Experimental and numerical study on splitting failure of brittle solids containing single pore under uniaxial compression. Mech. Mater. 2006, 38, 142–159. [Google Scholar] [CrossRef]
- Li, D.Y.; Zhou, Q.Q.; Zhou, Z.L.; Li, X.B.; Ranjith, P.G. Fracture analysis of marble specimens with a hole under uniaxial compression by digital image correlation. Eng. Fract. Mech. 2017, 183, 109–124. [Google Scholar] [CrossRef]
- Wu, H.; Zhao, G.Y.; Liang, W.Z. Investigation of cracking behavior and mechanism of sandstone specimens with a hole under compression. Int. J. Mech. Sci. 2018, 163, 105084. [Google Scholar] [CrossRef]
- Cundall, P.A.; Strack, O.D.L. A discrete numerical model for granular assemblies. Geotechnique 1979, 29, 47–65. [Google Scholar] [CrossRef]
- Cho, N.; Martin, C.D.; Sego, D.C. A clumped particle model for rock. Int. J. Rock. Mech. Min. Sci. 2007, 44, 997–1010. [Google Scholar] [CrossRef]
- Ministry of Water Resources of the People’s Republic of China. B/T 50218-2014 Standard for Engineering Classification of Rock Mass; China Standard Press: Beijing, China, 2015.
- Shi, H.; Song, L.; Zhang, H.Q.; Xue, K.K.; Yuan, G.T.; Wang, Z.S.; Wang, G.Z. Numerical study on mechanical and failure properties of sandstone based on the power-law distribution of pre-crack length. Geomech. Eng. 2019, 19, 421–434. [Google Scholar]
- Shi, H.; Zhang, H.Q.; Song, L. Evolution of sandstone shear strength parameters and its mesoscopic mechanism. Geomech. Eng. 2020, 20, 29–41. [Google Scholar]
- Khodadadian, A.; Noii, N.; Parvizi, M.; Abbaszadeh, M.; Wick, T.; Heitzinger, C. A Bayesian estimation method for variational phase-field fracture problems. Comput. Mech. 2020, 66, 827–849. [Google Scholar] [CrossRef]
- Aldakheel, F.; Noii, N.; Wick, T.; Wriggers, P. A global-local approach for hydraulic phase-field fracture in poroelastic media. Comput. Math. Appl. 2021, 91, 99–121. [Google Scholar] [CrossRef]
- Dzik, E.J.; Lajtai, E.Z. Primary fracture propagation from circular cavities loaded in compression. Int. J. Fract. 1992, 57, 221–236. [Google Scholar] [CrossRef]
- Cundall, P.A. Particle Flow Code in 2 Dimensions Command and Fish Reference Summary; Itasca Consulting Group Inc.: Minneapolis, MN, USA, 1999. [Google Scholar]


| Type | Water/(kg m−3) | Cement/(kg m−3) | Quartz Sand/(kg m−3) |
|---|---|---|---|
| Hard | 310 | 360 | 1450 |
| Soft | 330 | 320 | 1450 |
| Type | Compressive Strength/MPa | Tensile Strength/MPa | Elastic Modulus/GPa | Poisson’s Ratio |
|---|---|---|---|---|
| Hard | 310 | 360 | 1450 | 0.16 |
| Soft | 37.26 | 3.22 | 13.35 | 0.12 |
| Parameters | Value | Parameters | Value |
|---|---|---|---|
| Minimum particle size (mm) | 0.3 | Friction coefficient | 0.8 |
| Maximum particle size (mm) | 0.45 | Parallel bond tensile strength (MPa) | 6.25 (15.3) |
| Density (kg·m−3) | 2590 | Parallel bond cohesion (MPa) | 16.0 (39.2) |
| Porosity | 0.15 (0.1) | Parallel bond friction angle (°) | 45 |
| Contact bond modulus (GPa) | 5.9 | Parallel bond modulus (GPa) | 7.0 (9.0) |
| Contact bond stiffness ratio | 1.0 | Parallel bond stiffness ratio | 3.0 |
| Sample ID | Stress-Strain Curve | Test Results | Numerical Results |
|---|---|---|---|
| SHS-0% | 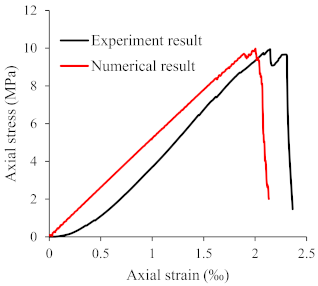 | 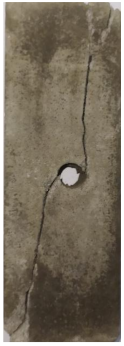 |  |
| SHS-30% | 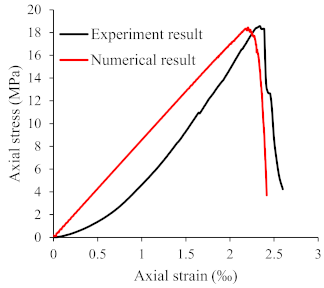 | 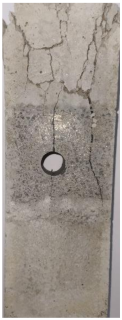 |  |
| HSH-30% | 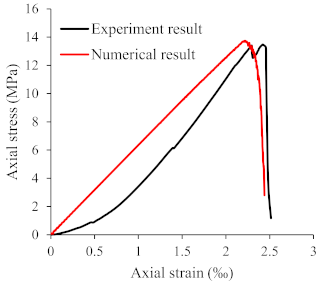 |  |  |
| HSH-0% | 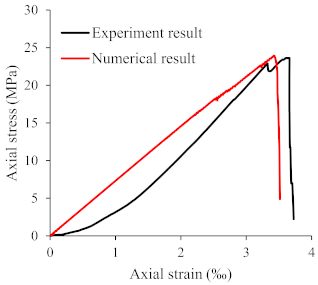 | 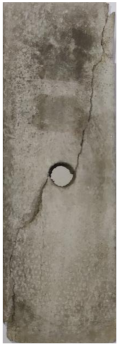 | 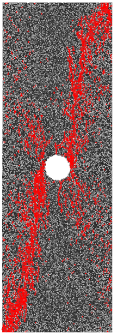 |
Publisher’s Note: MDPI stays neutral with regard to jurisdictional claims in published maps and institutional affiliations. |
© 2021 by the authors. Licensee MDPI, Basel, Switzerland. This article is an open access article distributed under the terms and conditions of the Creative Commons Attribution (CC BY) license (https://creativecommons.org/licenses/by/4.0/).
Share and Cite
Wang, G.; Wang, Y.; Song, L.; Shi, H.; Zhang, M.; Yuan, G.; Xu, Q.; Xu, G.; Zhang, W.; Gao, J. Particle Flow Simulation of the Strength and Failure Characteristics of a Layered Composite Rock-Like Sample with a Single Hole. Symmetry 2021, 13, 1132. https://doi.org/10.3390/sym13071132
Wang G, Wang Y, Song L, Shi H, Zhang M, Yuan G, Xu Q, Xu G, Zhang W, Gao J. Particle Flow Simulation of the Strength and Failure Characteristics of a Layered Composite Rock-Like Sample with a Single Hole. Symmetry. 2021; 13(7):1132. https://doi.org/10.3390/sym13071132
Chicago/Turabian StyleWang, Guozhu, Yu Wang, Lei Song, Hao Shi, Mingwei Zhang, Guotao Yuan, Qiangguo Xu, Guangda Xu, Weiqian Zhang, and Jianjun Gao. 2021. "Particle Flow Simulation of the Strength and Failure Characteristics of a Layered Composite Rock-Like Sample with a Single Hole" Symmetry 13, no. 7: 1132. https://doi.org/10.3390/sym13071132
APA StyleWang, G., Wang, Y., Song, L., Shi, H., Zhang, M., Yuan, G., Xu, Q., Xu, G., Zhang, W., & Gao, J. (2021). Particle Flow Simulation of the Strength and Failure Characteristics of a Layered Composite Rock-Like Sample with a Single Hole. Symmetry, 13(7), 1132. https://doi.org/10.3390/sym13071132