
Automatic Lung Segmentation Algorithm on Chest X-ray Images Based on Fusion Variational Auto-Encoder and Three-Terminal Attention Mechanism


Abstract
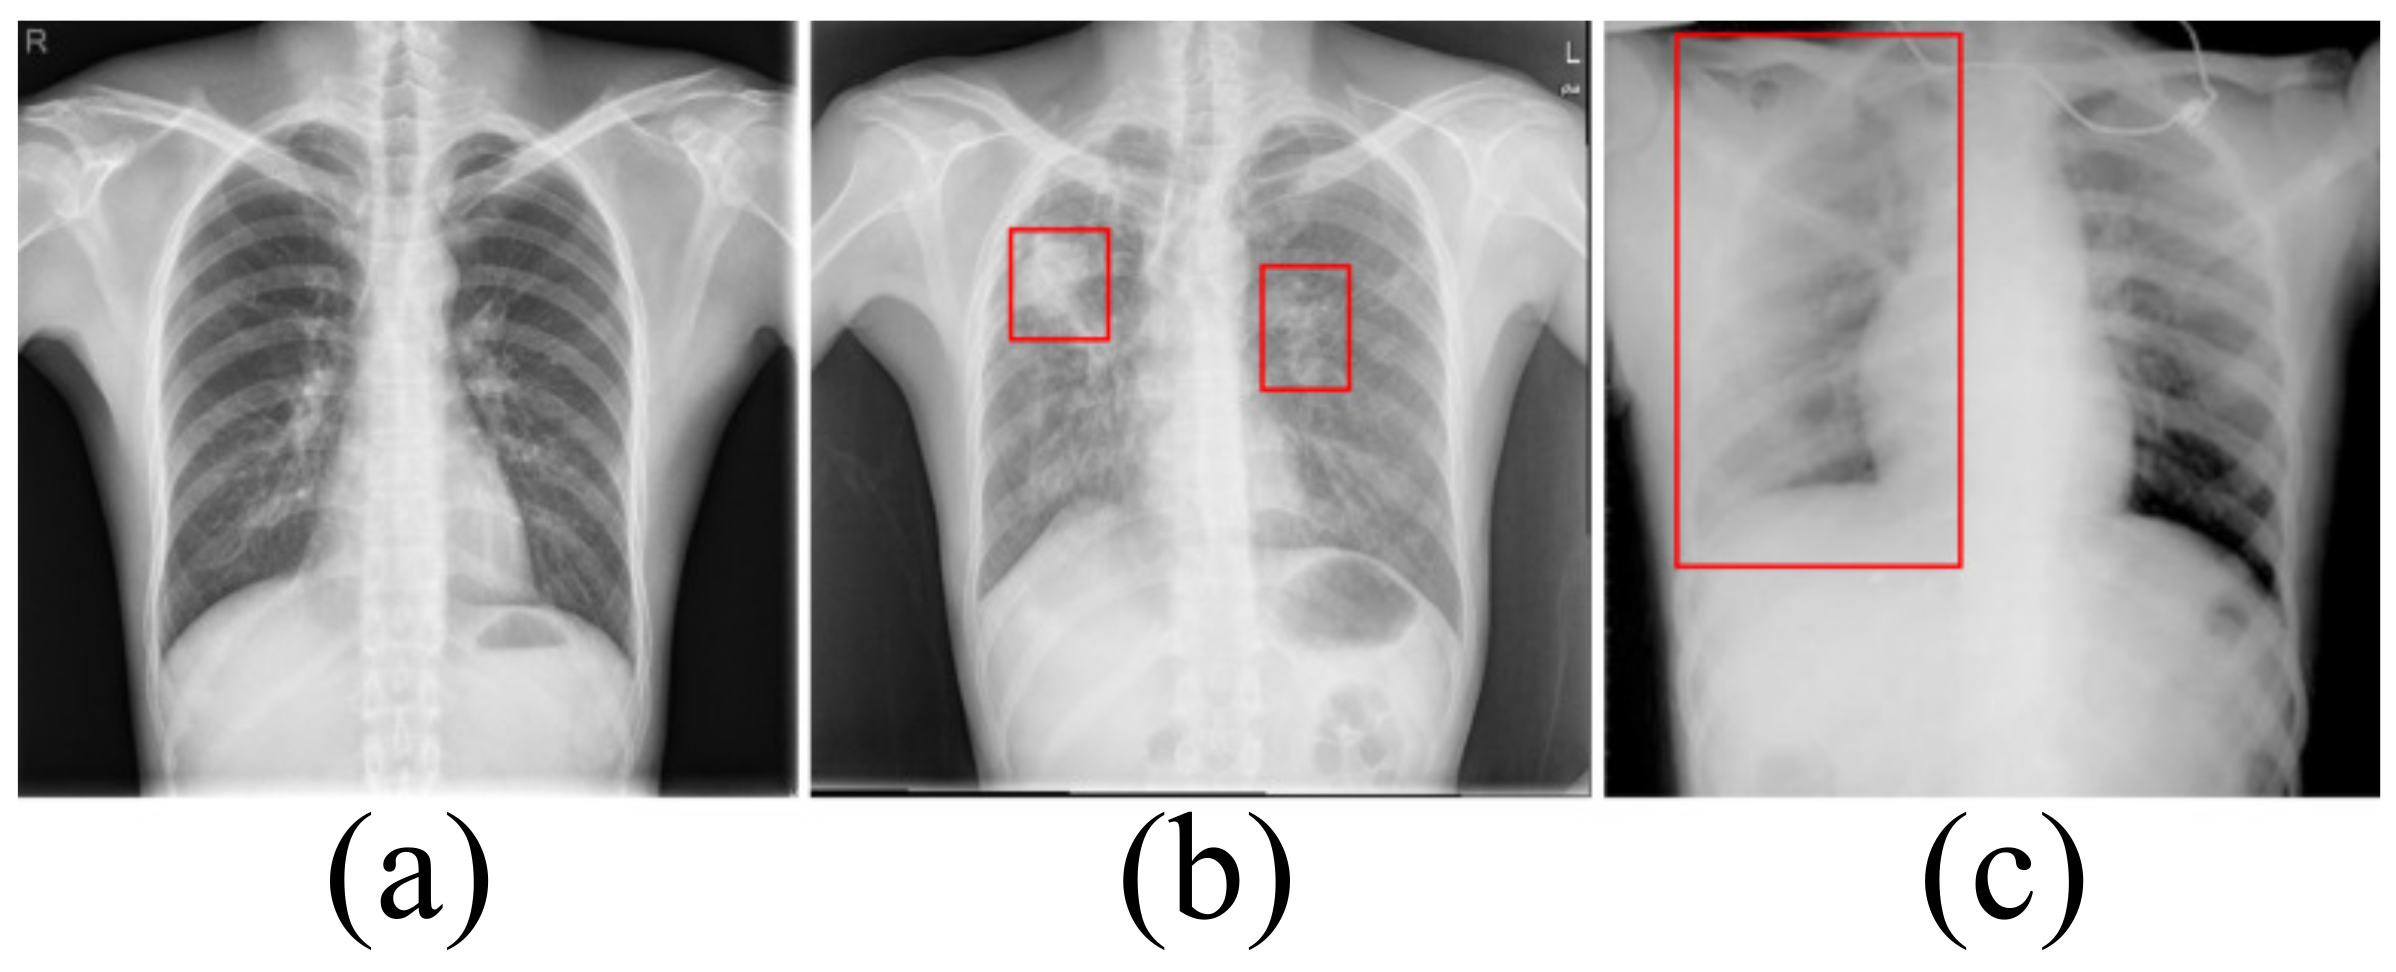
1. Introduction
2. Related Work
3. Materials and Methods
3.1. Dataset
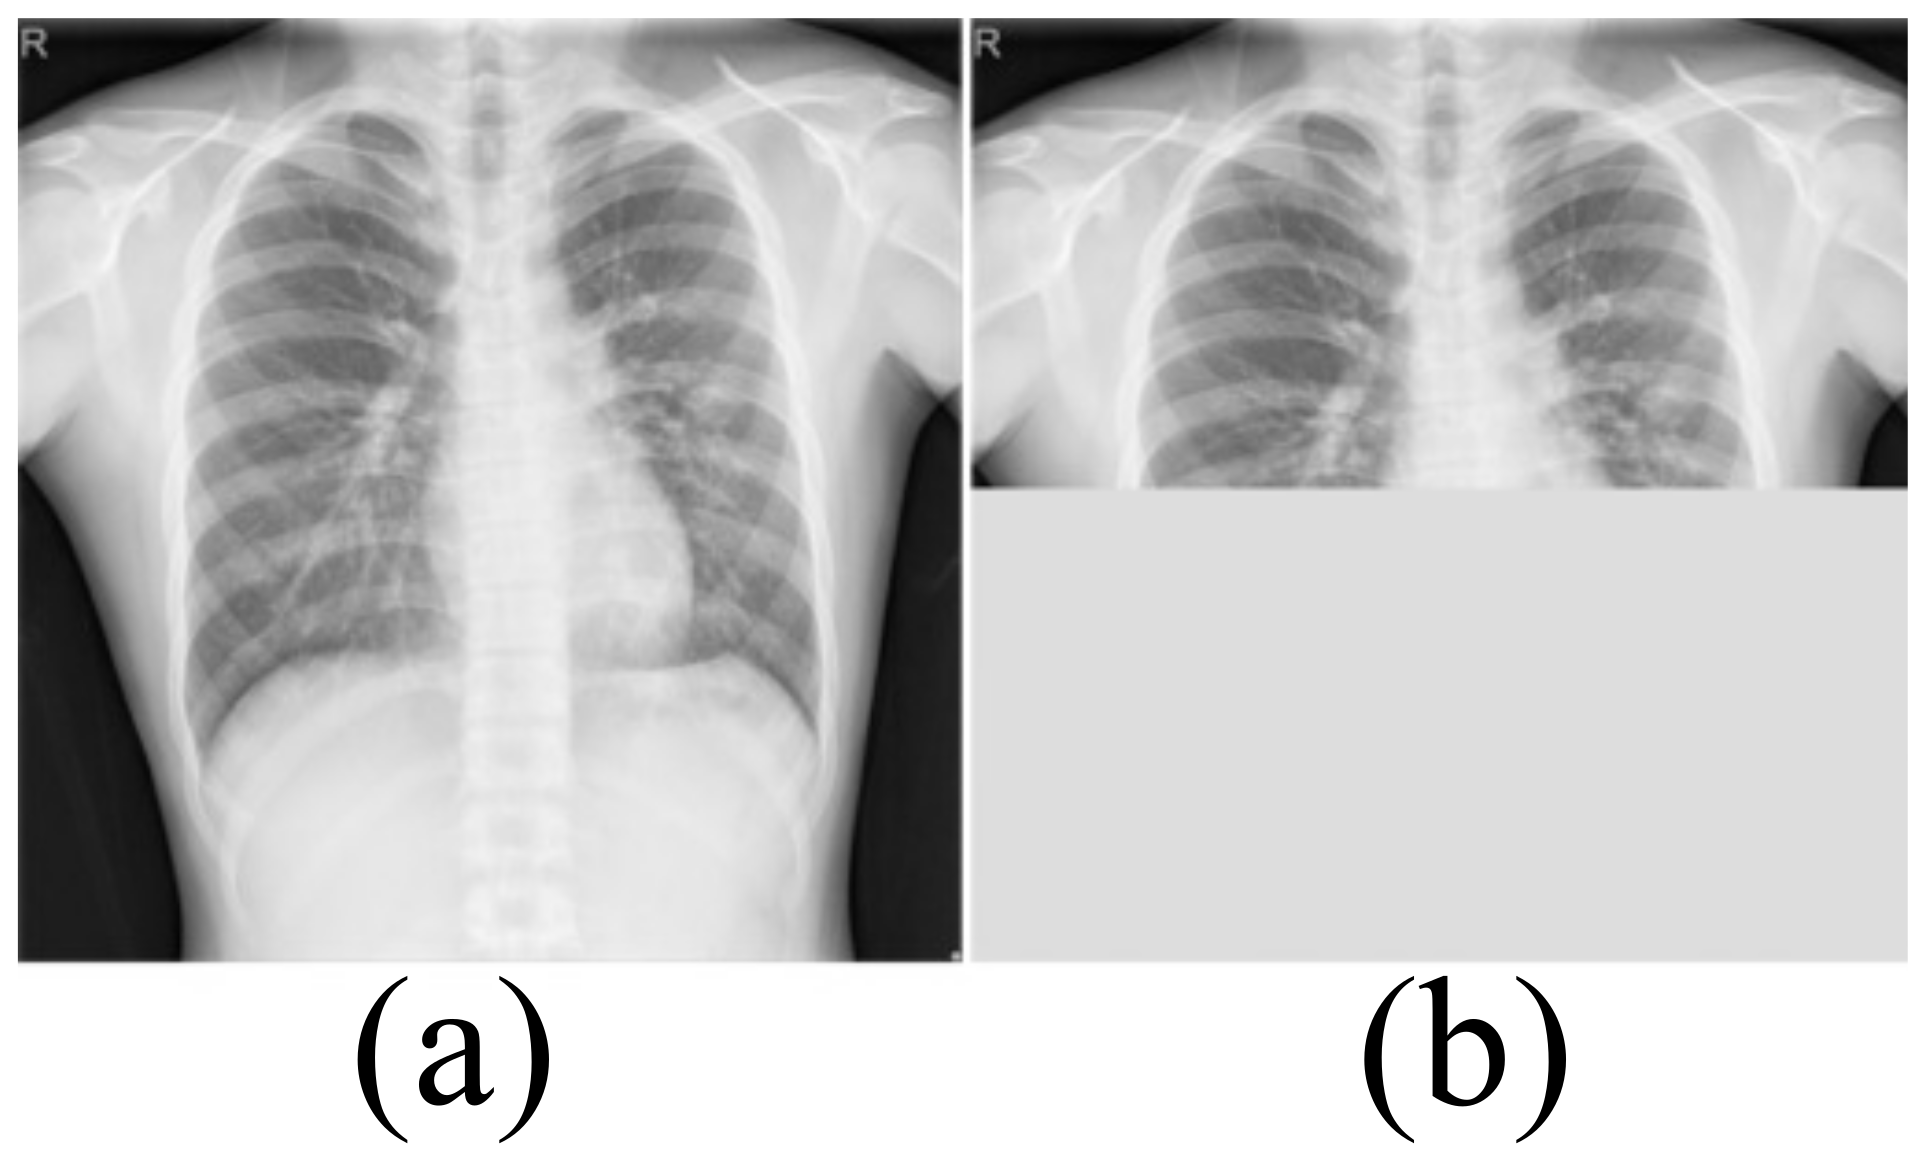
Data Enhancement
3.2. Model Architecture
3.2.1. Fusion Variational Autoencoder
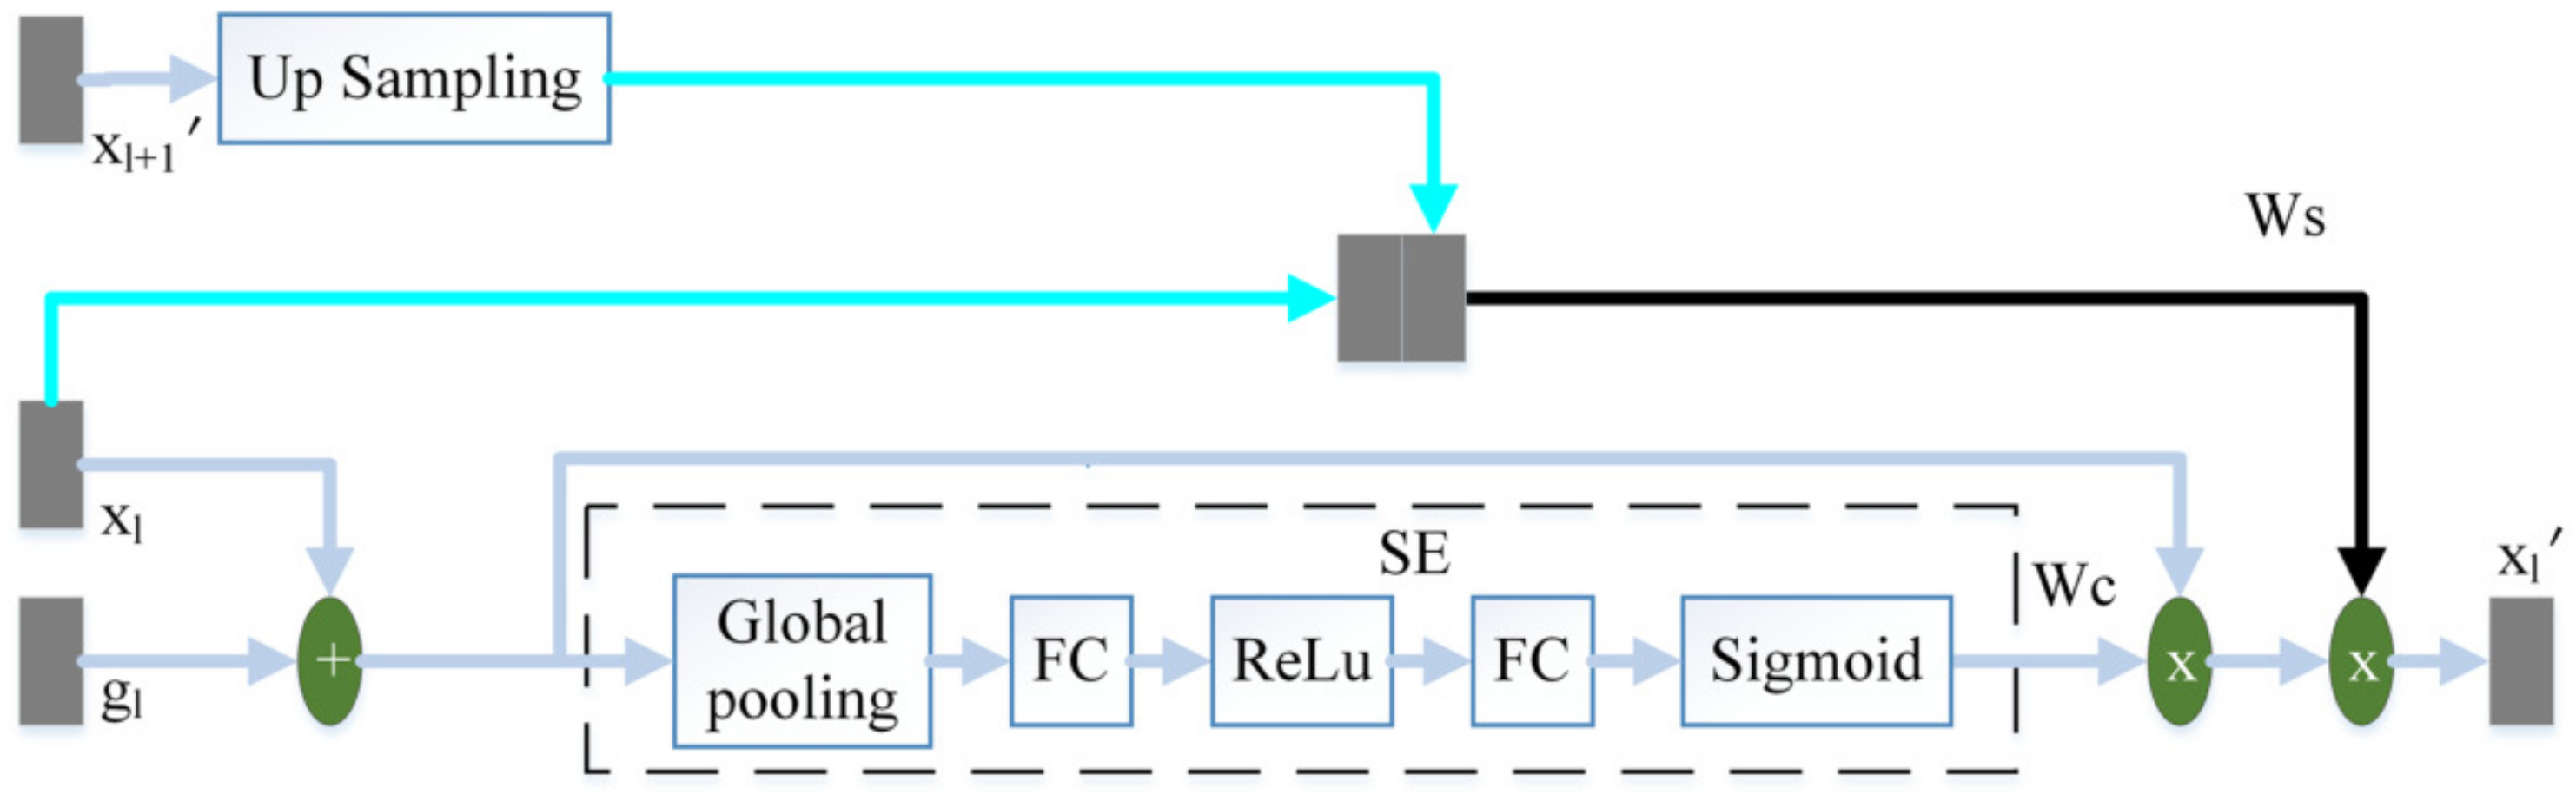
3.2.2. Three-Terminal Attention Mechanism
3.3. Objective Function
3.4. Implementation Environment
3.5. Evaluation Metrics
4. Results and Discussion
4.1. Comparison with State-of-the-Art Algorithms
4.1.1. Statistical Results
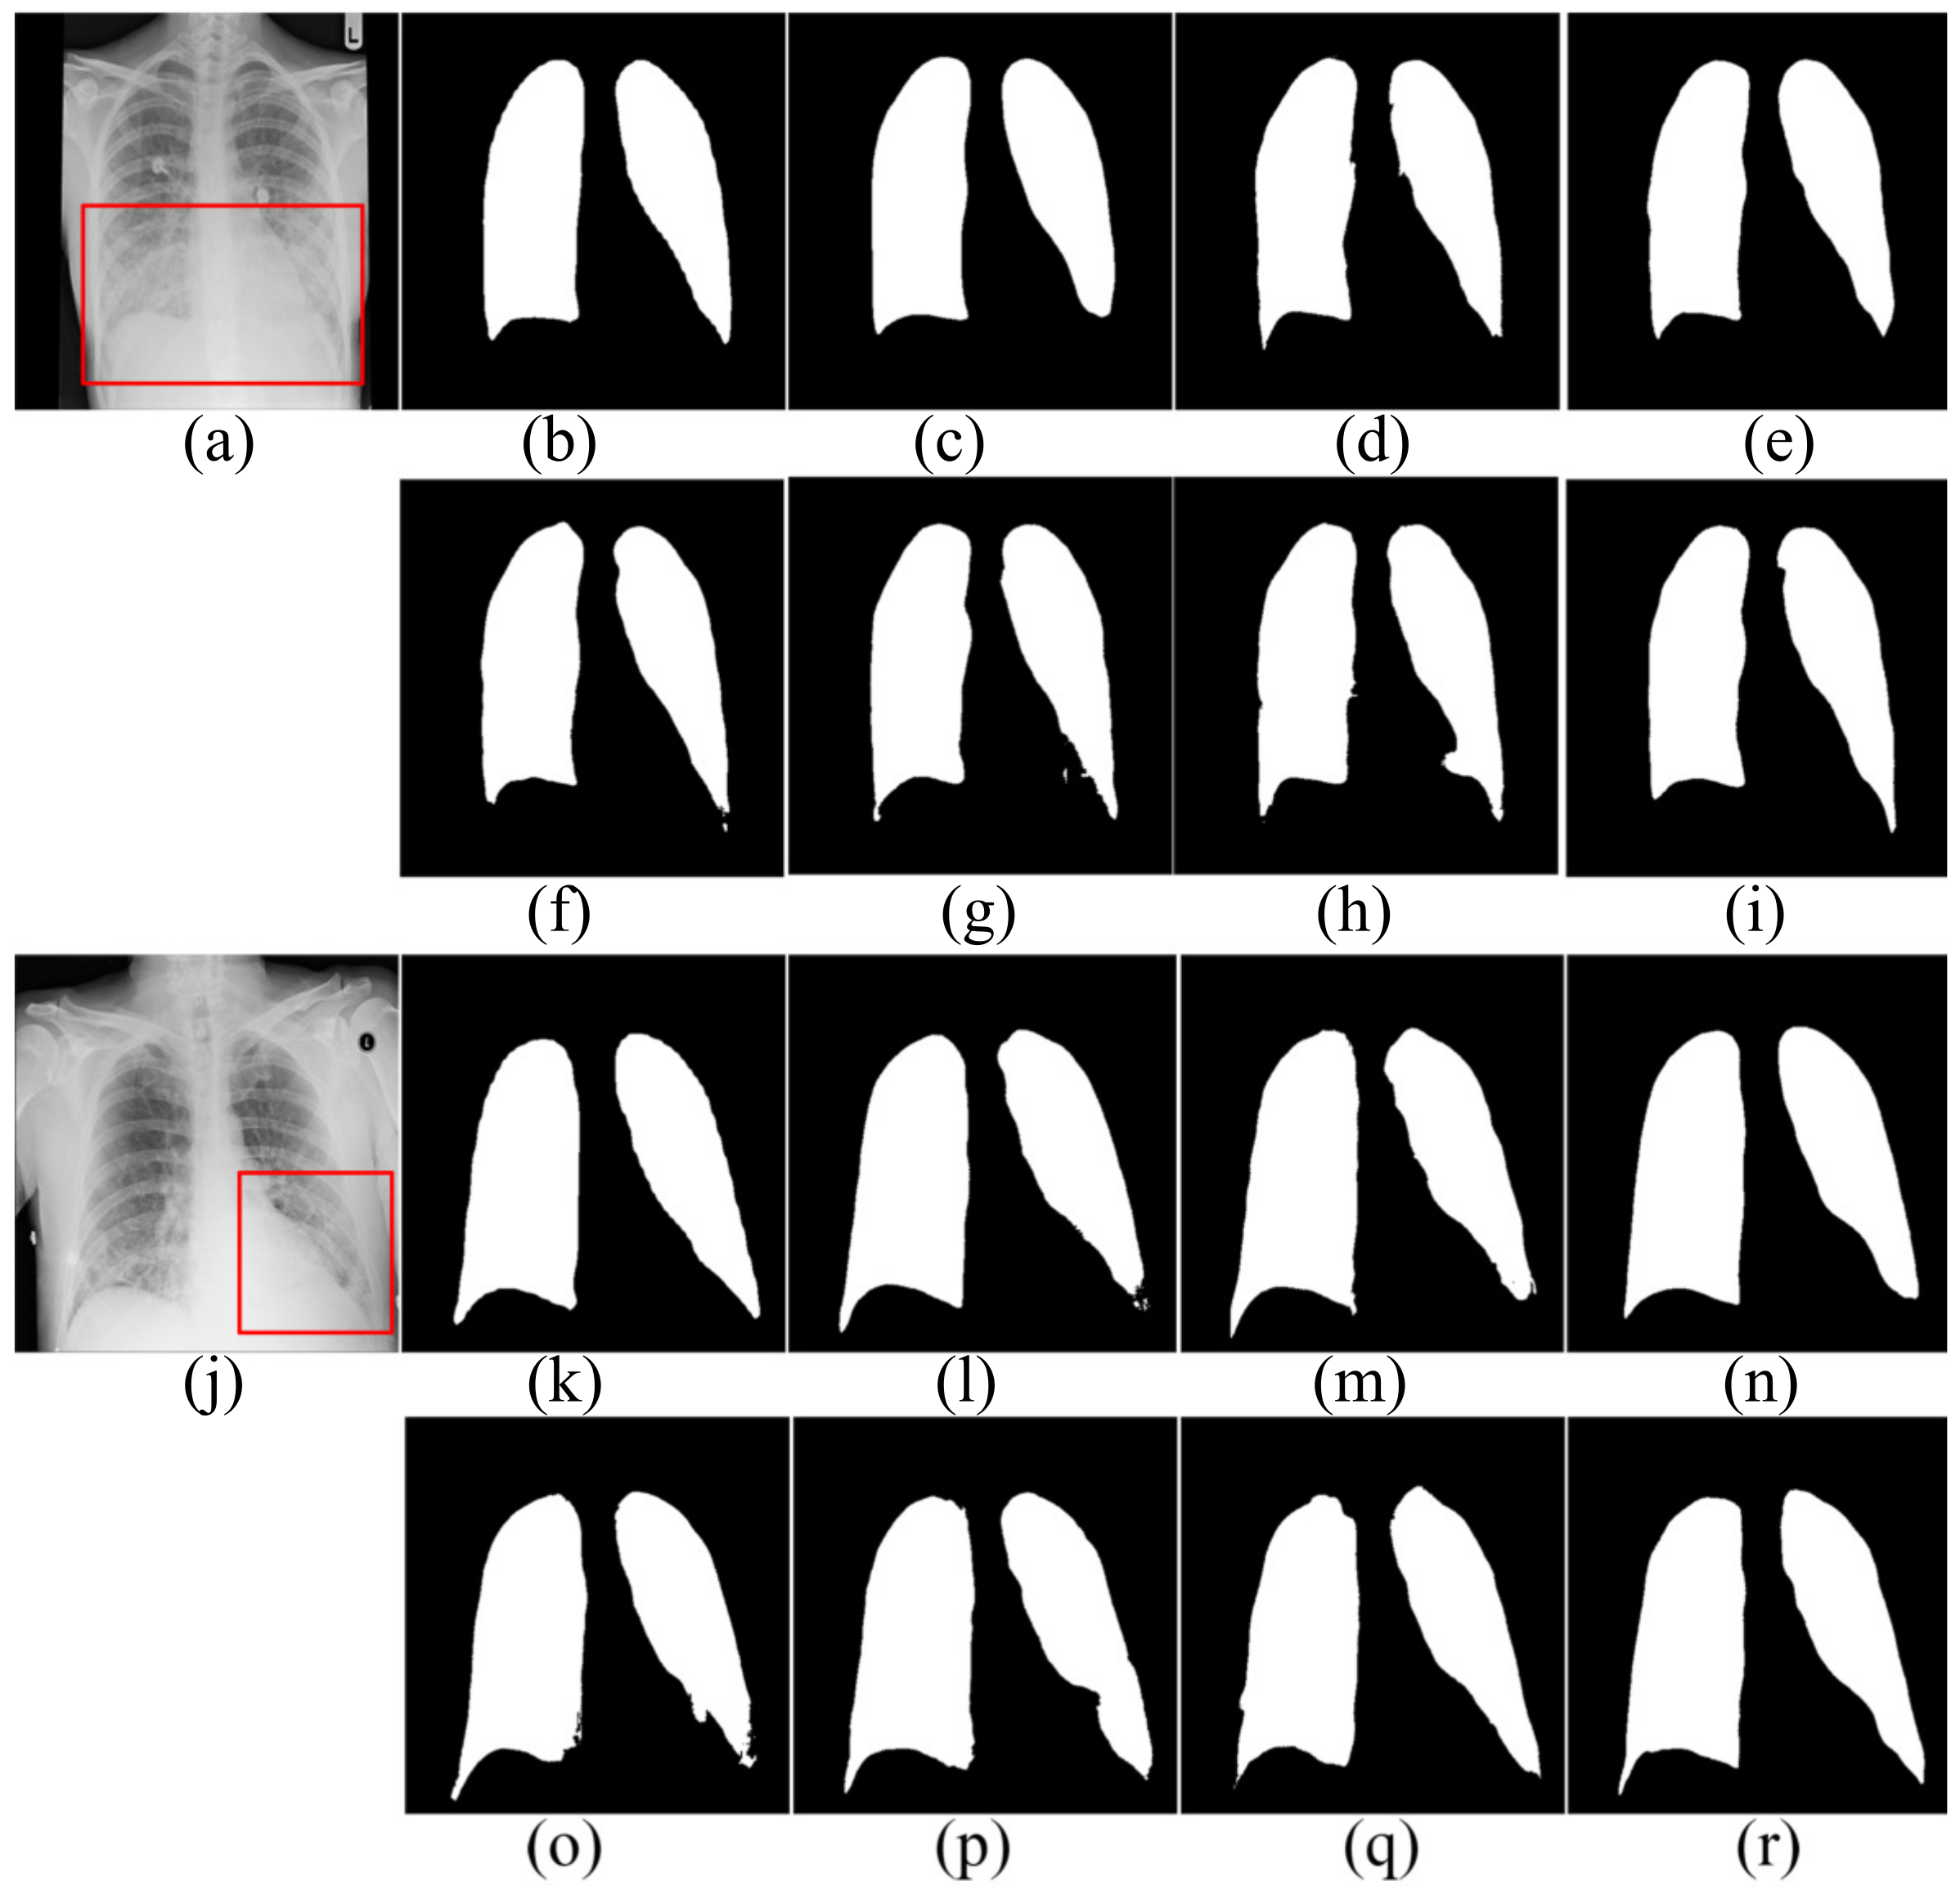
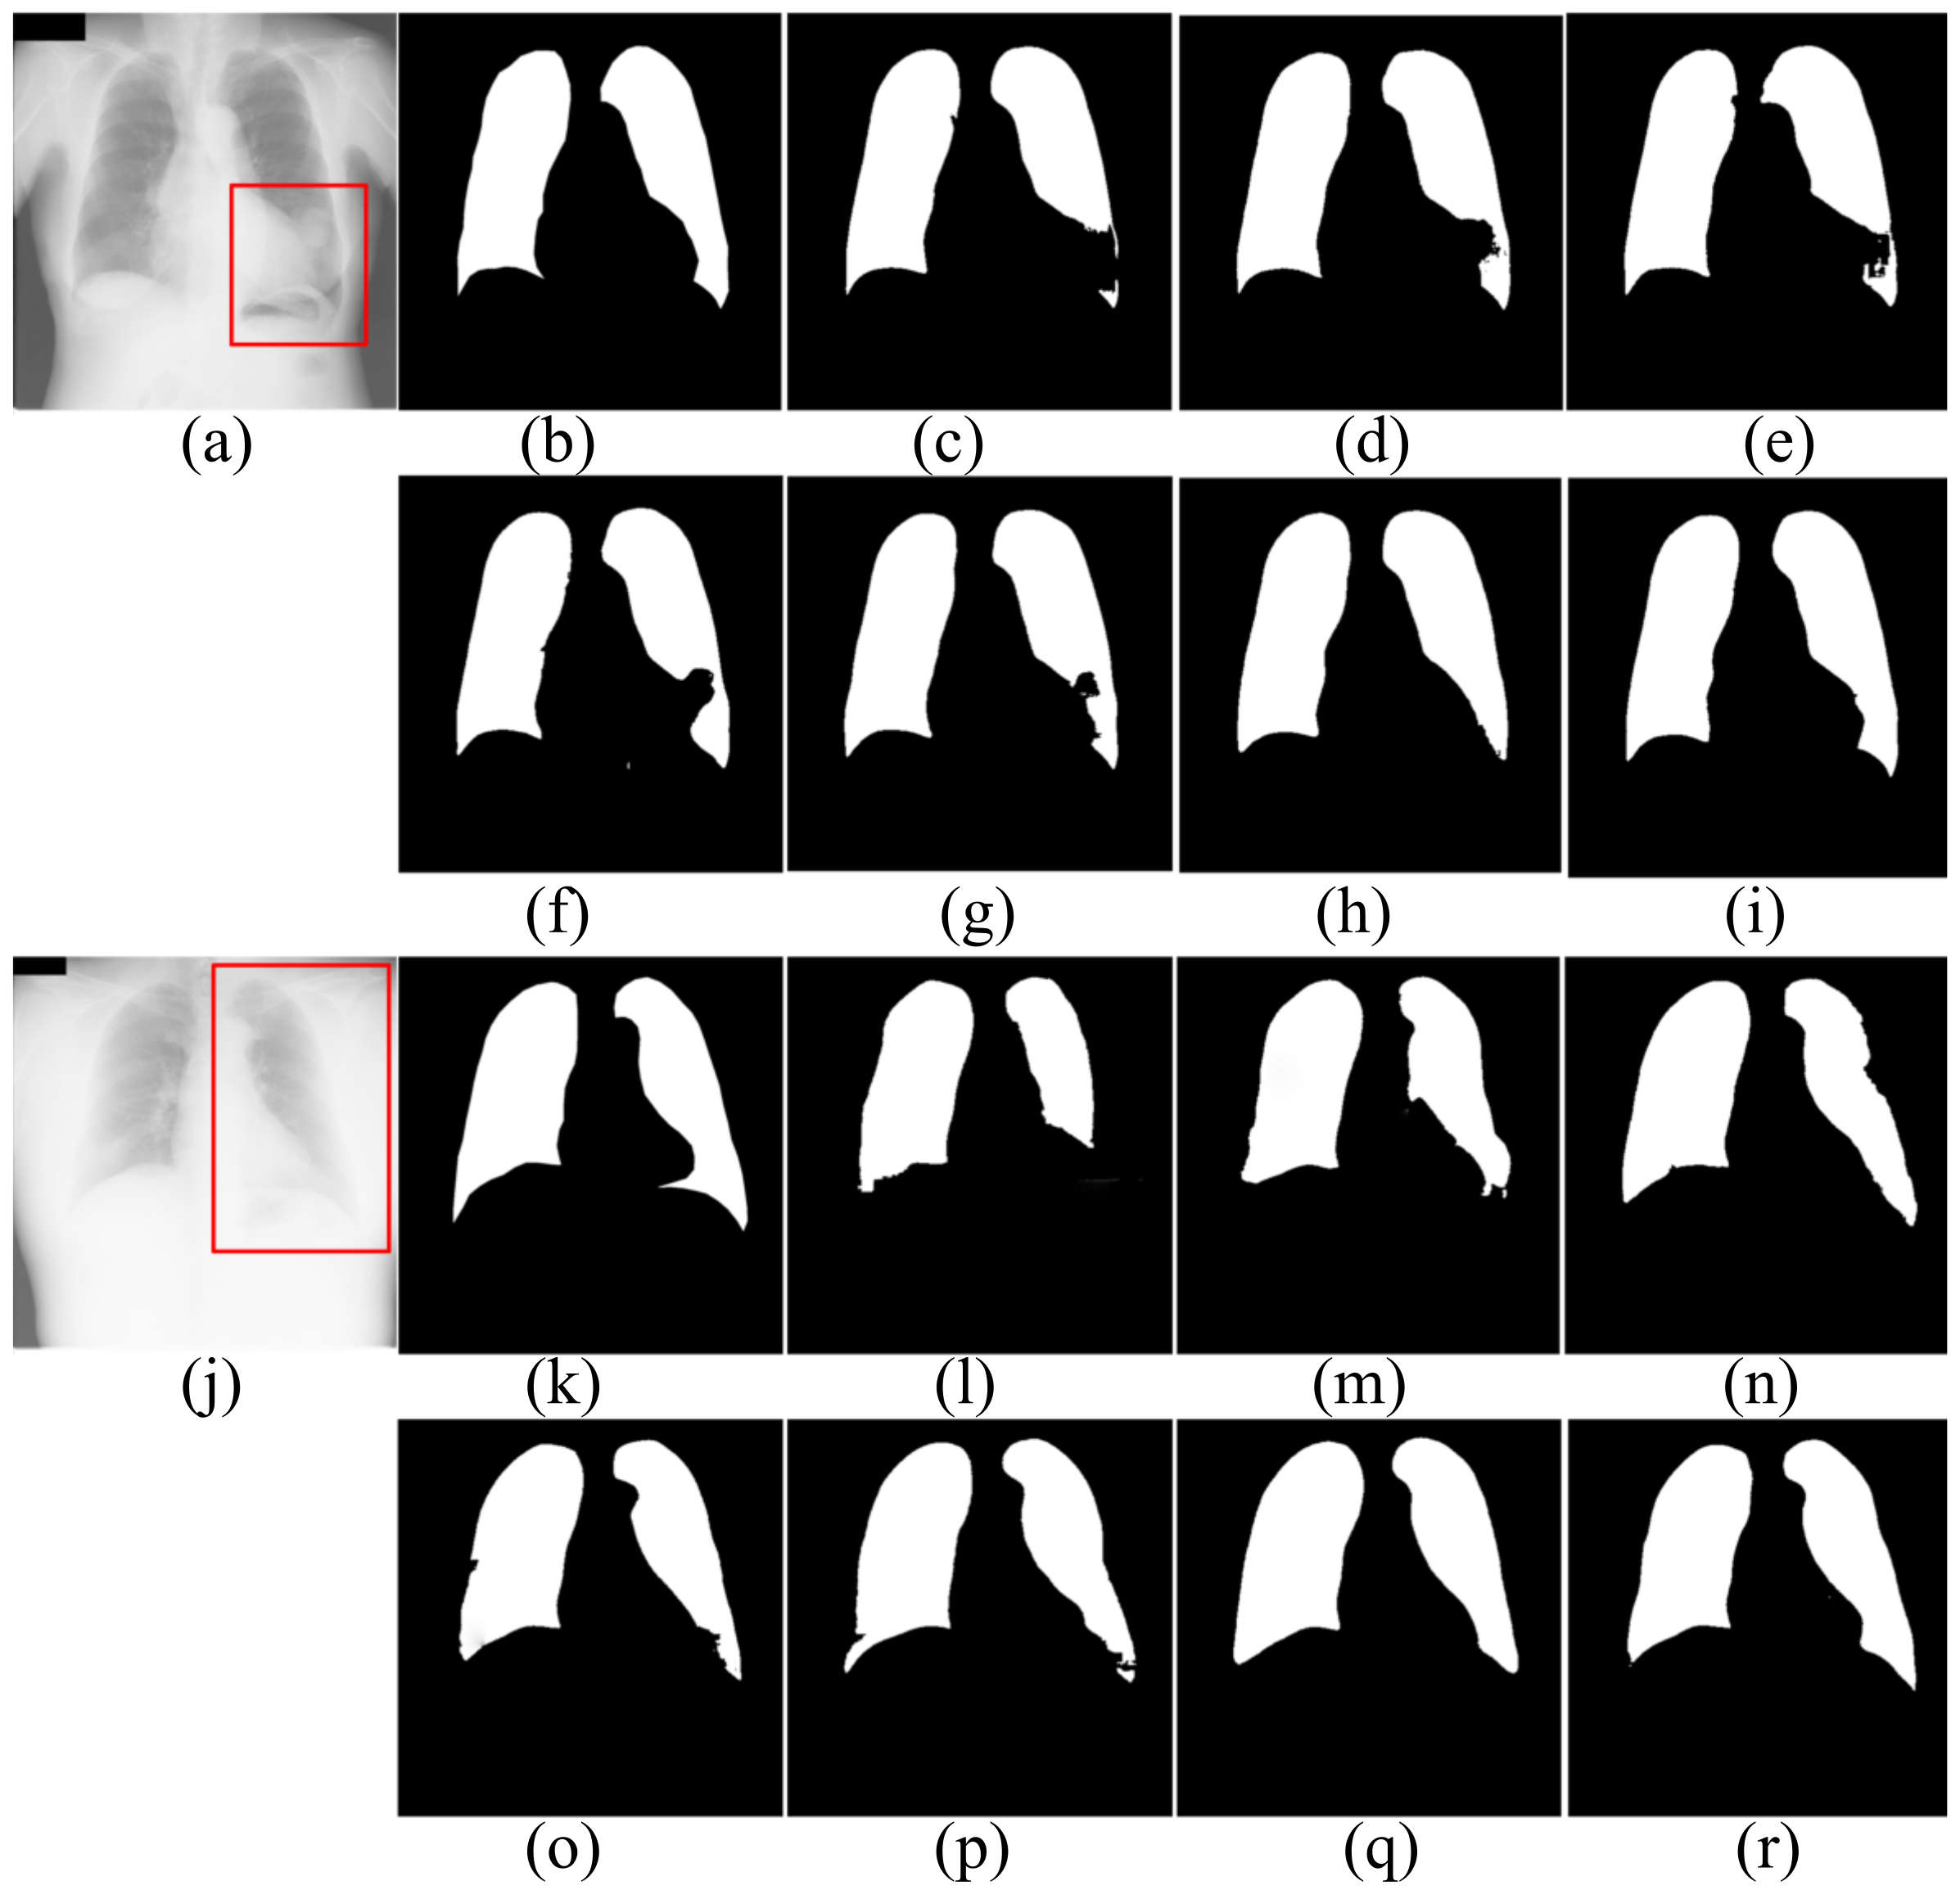
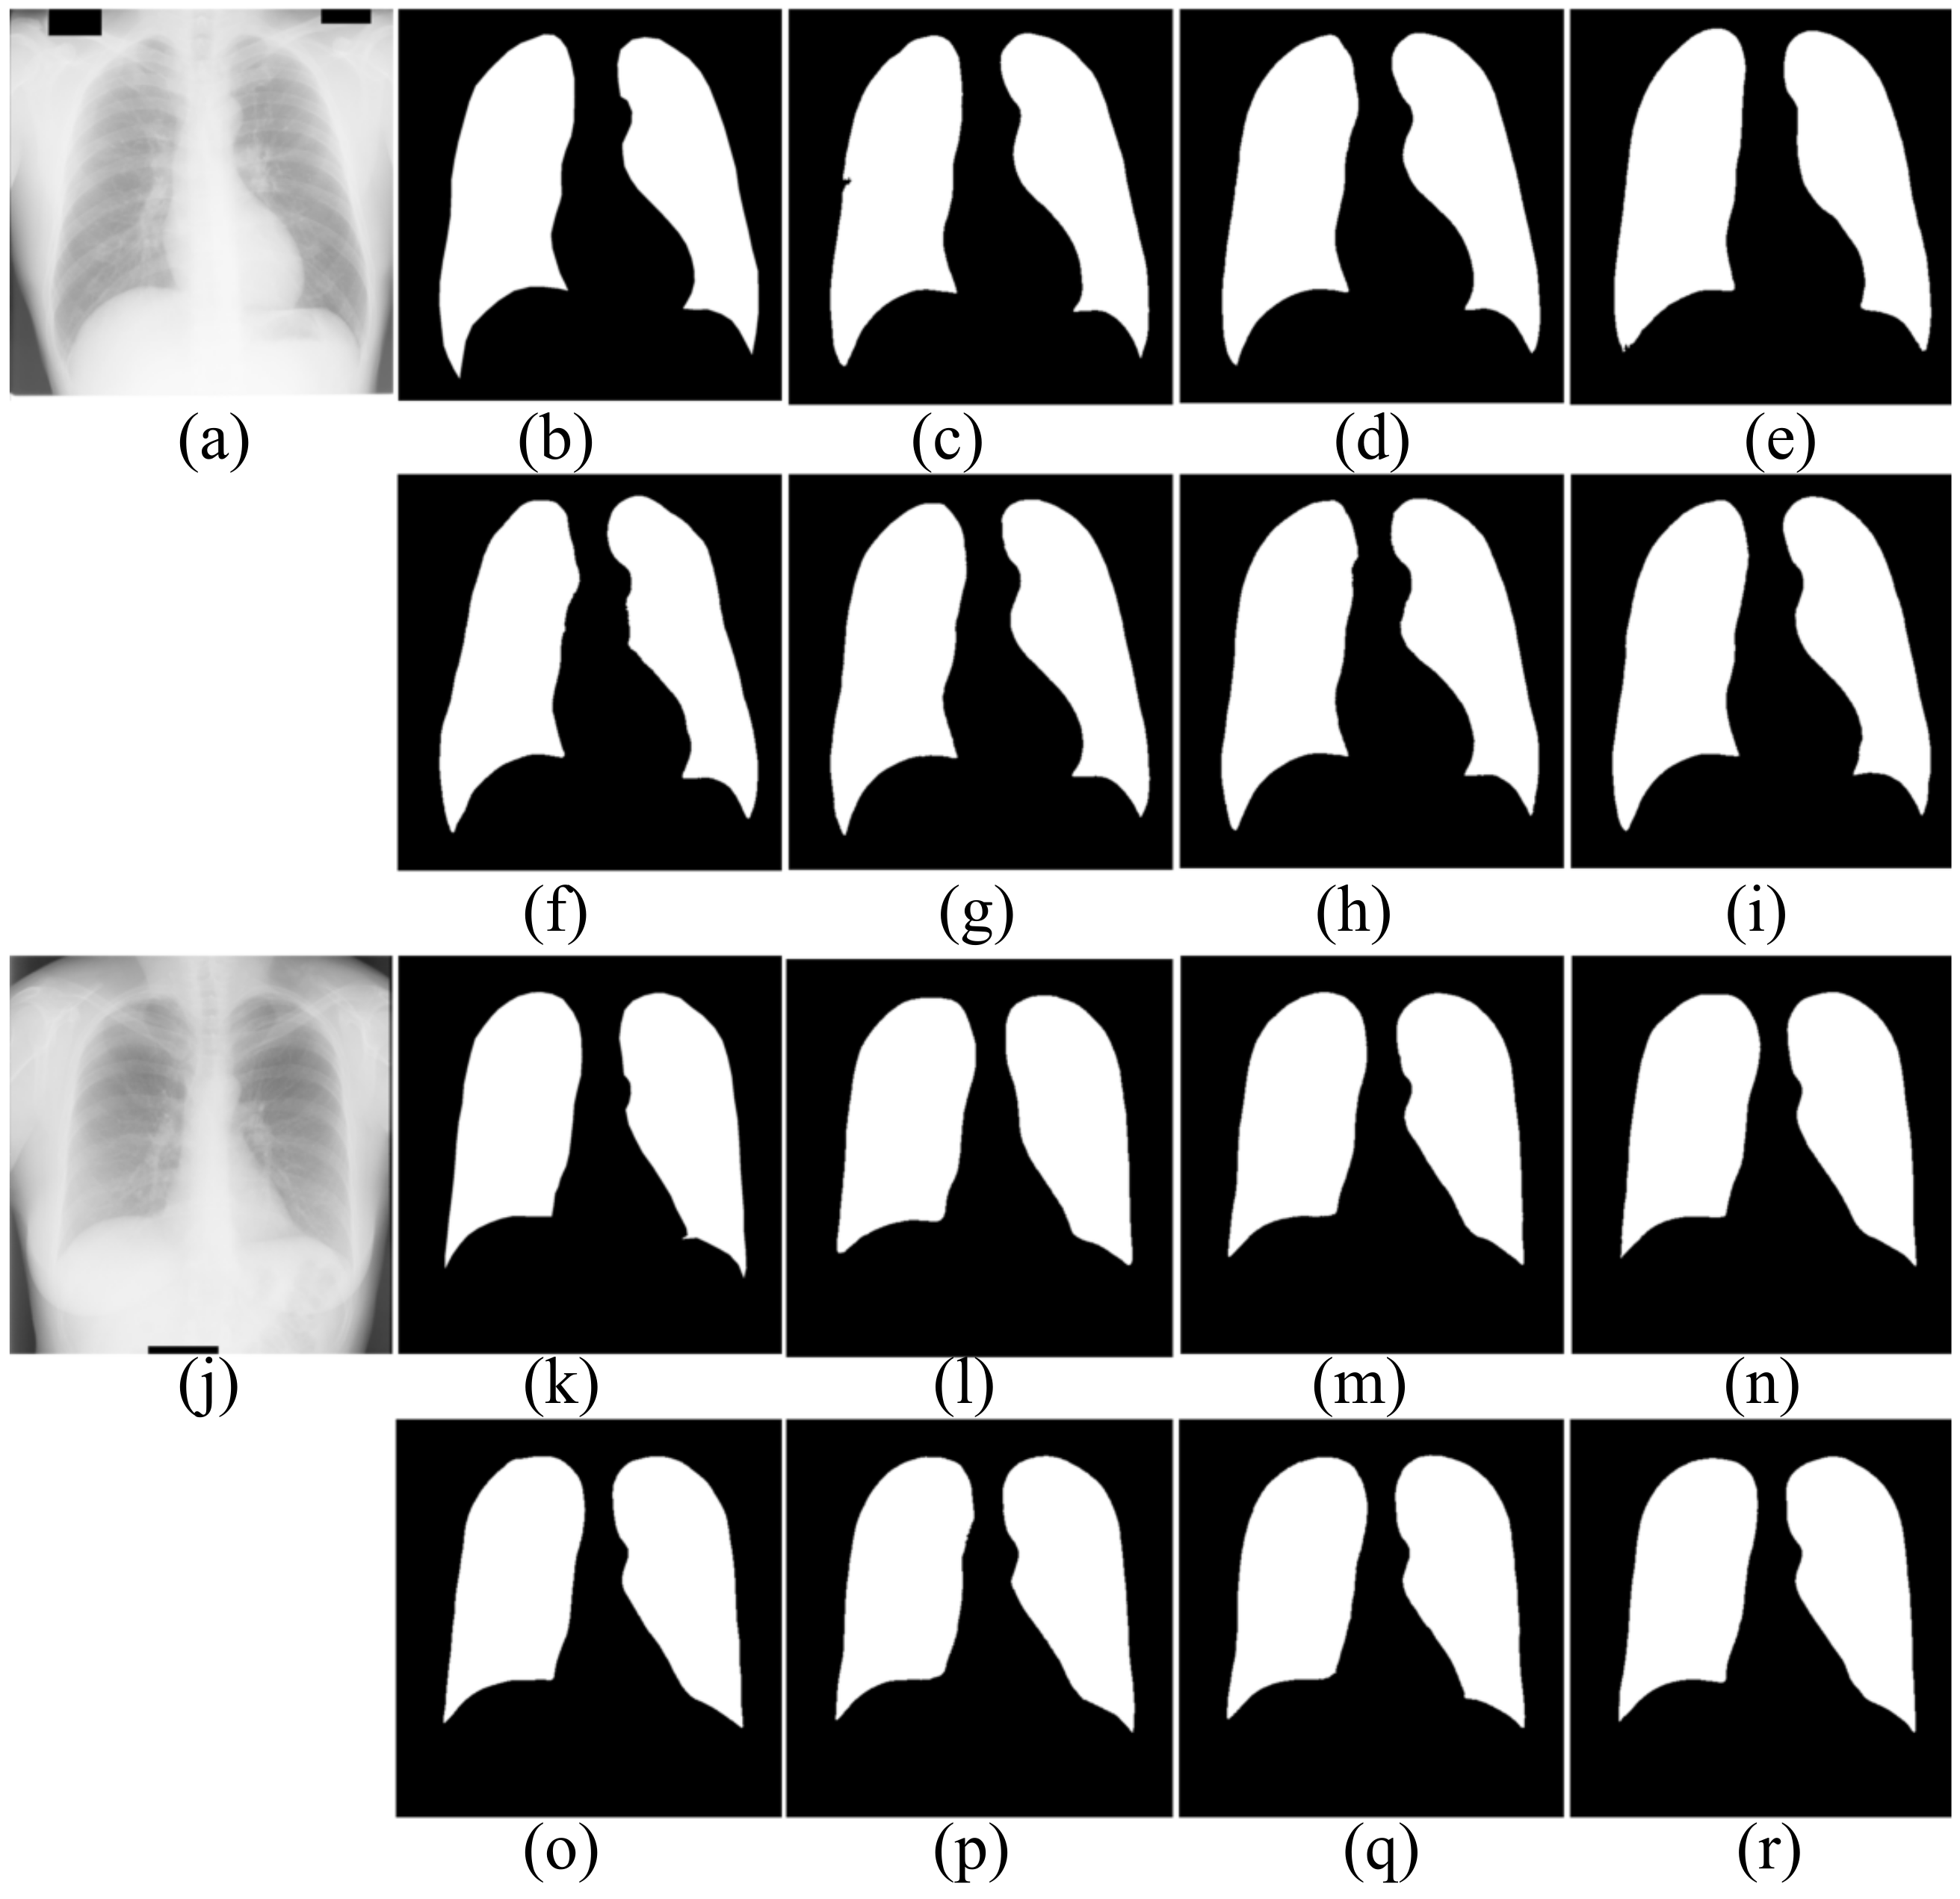
4.1.2. Segmentation Results
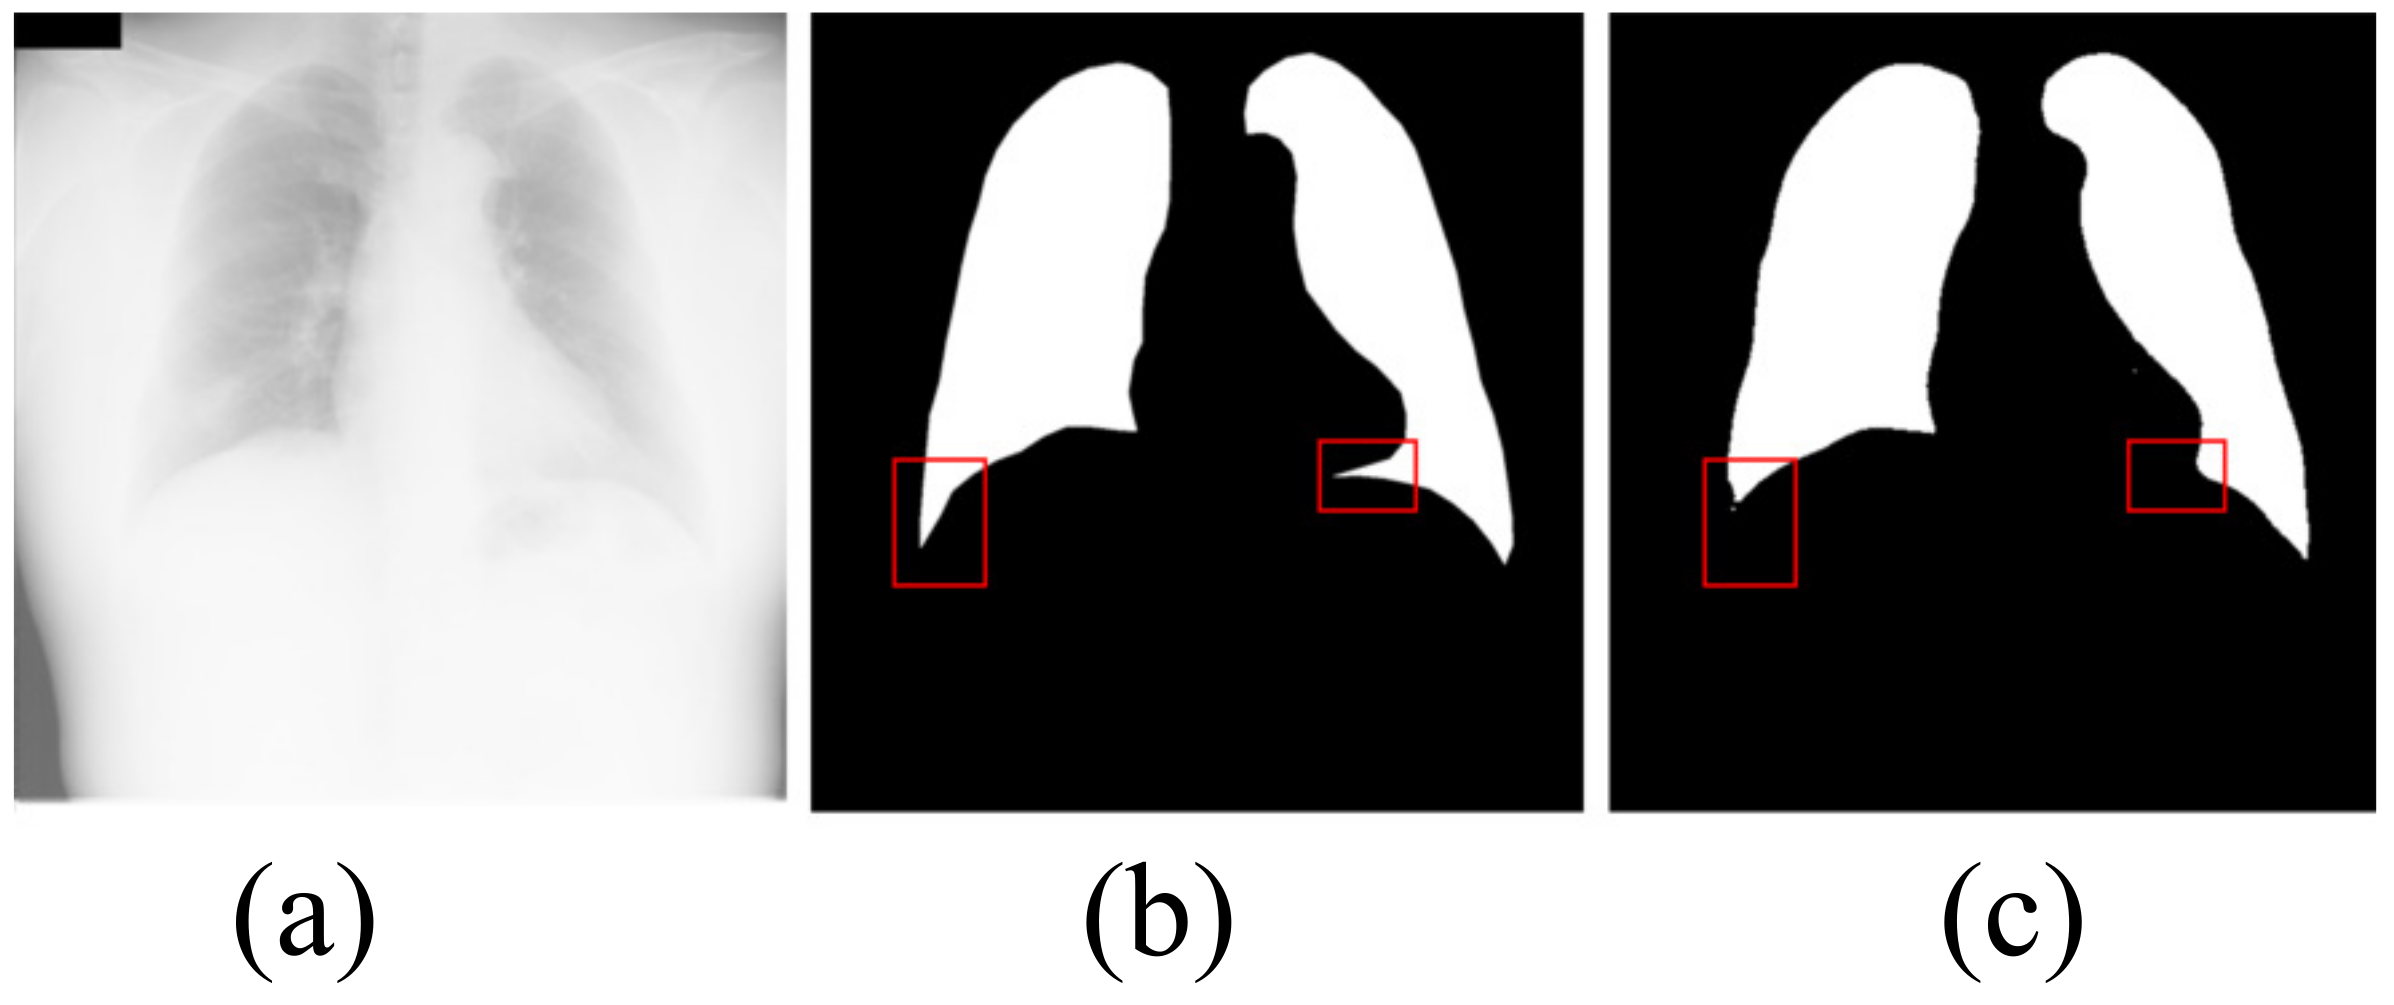
4.1.3. Limitation
4.2. Ablation Study
5. Conclusions
Author Contributions
Funding
Institutional Review Board Statement
Informed Consent Statement
Data Availability Statement
Conflicts of Interest
Abbreviations
| VAE | variational auto-encoder |
| FVAE | fusin variational auto-encoder |
References
- Rigby, D.M.; Hacking, L. Interpreting the chest radiograph. Anaesth Intensive Care 2018, 19, 50–54. [Google Scholar] [CrossRef]
- Schilham, A.; Ginneken, B.; Loog, M. A computer- aided diagnosis system for detection of lung nodules in chest radiographs with an evaluation on a public database. Med. Image Anal. 2006, 10, 247–258. [Google Scholar] [CrossRef]
- Mittal, A.; Hooda, R.; Sofat, S. Lung field segmentation in chest radiographs: A historical review, current status, and expectations from deep learning. IET Image Process 2017, 11, 937–952. [Google Scholar] [CrossRef]
- Raoof, S.; Feigin, D.; Sung, A.; Irugulpati, L.; Rosenow, E.C. Interpretation of Plain Chest Roentgenogram. Chest 2012, 141, 545–558. [Google Scholar] [CrossRef] [PubMed]
- Reamaroon, N.; Sjoding, M.W.; Derksen, H.; Sabeti, E.; Najarian, K. Robust segmentation of lung in chest X-ray: Applications in analysis of acute respiratory distress syndrome. BMC Med. Imaging 2020, 20, 1–13. [Google Scholar] [CrossRef] [PubMed]
- Candemir, S.; Antani, S. A review on lung boundary detection in chest X-rays. Int. J. Comput. Assist. Radiol. Surg. 2019, 14, 563–576. [Google Scholar] [CrossRef] [PubMed]
- Brady, A.P. Error and discrepancy in radiology: Inevitable or avoidable? Insights Imaging 2016, 8, 171–182. [Google Scholar] [CrossRef] [PubMed]
- Doi, K. Computer-aided diagnosis in medical imaging: Historical review, current status and future potential. Comput. Med. Imaging Graph. 2007, 31, 198–211. [Google Scholar] [CrossRef]
- Rajinikanth, V.; Dey, N.; Raj, A.N.J.; Hassanien, A.E.; Santosh, K.C.; Raja, N. Harmony-search and otsu based system for coronavirus disease (COVID-19) detection using lung CT scan images. arXiv 2020, arXiv:2004.03431. [Google Scholar]
- Zohora, F.T.; Santosh, K.C. Foreign circular element detection in chest X-rays for effective automated pulmonary abnormality screening. Int. J. Comput. Vis. Image Process. (IJCVIP) 2017, 7, 36–49. [Google Scholar] [CrossRef]
- Santosh, K.C.; Vajda, S.; Antani, S.; Thoma, G.R. Edge map analysis in chest X-rays for automatic pulmonary abnormality screening. Int. J. Comput. Assist. Radiol. Surg. 2016, 9, 1637–1646. [Google Scholar] [CrossRef] [PubMed]
- Bosdelekidis, V.; Ioakeimidis, N.S. Lung Field Segmentation in Chest X-rays: A Deformation-Tolerant Procedure Based on the Approximation of Rib Cage Seed Points. Appl. Sci. 2020, 10, 6264. [Google Scholar] [CrossRef]
- Sahlol, A.T.; Abd Elaziz, M.; Tariq, J.A.; Damaševičius, R.; Farouk, H.O. A novel method for detection of tuberculosis in chest radiographs using artificial ecosystem-based optimisation of deep neural network features. Symmetry 2020, 12, 1146. [Google Scholar] [CrossRef]
- Afifi, A.; Hafsa, N.E.; Ali, M.A.; Alhumam, A.; Alsalman, S. An Ensemble of Global and Local-Attention Based Convolutional Neural Networks for COVID-19 Diagnosis on Chest X-ray Images. Symmetry 2021, 13, 113. [Google Scholar] [CrossRef]
- Ronneberger, O.; Fischer, P.; Brox, T. U-net: Convolutional networks for biomedical image segmentation. In Proceedings of the Medical Image Computing and Computer-Assisted Intervention, Munich, Germany, 5–9 October 2015; pp. 234–241. [Google Scholar]
- Kingma, D.P.; Welling, M. Auto-encoding variational bayes. In Proceedings of the International Conference on Learning Representations, Banff, AB, Canada, 14–16 April 2014. [Google Scholar]
- Hu, J.; Shen, L.; Sun, G. Squeeze-and-excitation networks. In Proceedings of the IEEE Conference on Computer Vision and Pattern Recognition, Salt Lake City, UT, USA, 18–23 June 2018; pp. 7132–7141. [Google Scholar]
- Long, J.; Shelhamer, E.; Darrell, T. Fully convolutional networks for semantic segmentation. In Proceedings of the IEEE Conference on Computer Vision and Pattern Recognition, Boston, MA, USA, 8–10 June 2015; pp. 3431–3440. [Google Scholar]
- Badrinarayanan, V.; Kendall, A.; Cipolla, R. Segnet: A deep convolutional encoder-decoder architecture for image segmentation. IEEE Trans. Pattern Anal. Mach. Intell. 2017, 39, 2481–2495. [Google Scholar] [CrossRef] [PubMed]
- Oktay, O.; Schlemper, J.; Folgoc, L.L.; Lee, M.; Heinrich, M.; Misawa, K.; Mori, K.; McDonagh, S.; Hammerla, N.Y.; Kainz, B.; et al. Attention U-Net: Learning Where to Look for the Pancreas. arXiv 2018, arXiv:1804.03999. [Google Scholar]
- Zhou, Z.; Siddiquee, M.M.R.; Tajbakhsh, N.; Liang, J. Unet++: A nested u-net architecture for medical image segmentation. In Proceedings of the 4th Deep Learning in Medical Image Analysis (DLMIA) Workshop, Granada, Spain, 20 September 2018; pp. 3–11. [Google Scholar]
- Alom, M.Z.; Yakopcic, C.; Hasan, M. Recurrent residual U-Net for medical image segmentation. J. Med. Imaging 2019, 6, 014006. [Google Scholar] [CrossRef] [PubMed]
- Hooda, R.; Mittal, A.; Sofat, S. An efficient variant of fully-convolutional network for segmenting lung fields from chest radiographs. Wirel. Pers. Commun. 2018, 101, 1559–1579. [Google Scholar] [CrossRef]
- Mittal, A.; Hooda, R.; Sofat, S. LF-SegNet: A fully convolutional encoder-decoder network for segmenting lung fields from chest radiographs. Wirel. Pers. Commun. 2013, 101, 511–529. [Google Scholar] [CrossRef]
- Dai, W.; Doyle, J.; Liang, X.; Zhang, H.; Dong, N.; Li, Y.; Xing, E.P. Scan: Structure correcting adversarial network for organ segmentation in chest X-rays. arXiv 2017, arXiv:1703.08770. [Google Scholar]
- Tang, Y.; Tang, Y.; Xiao, J.; Summers, R.M. XLSor: A robust and accurate lung segmentor on chest X-rays using criss-cross attention and customized radiorealistic abnormalities generation. arXiv 2019, arXiv:1904.09229. [Google Scholar]
- Huang, X.; Liu, M.Y.; Belongie, S.; Jan, K. Multimodal unsupervised image-to-image translation. In Proceedings of the European Conference on Computer Vision, Munich, Germany, 8–14 September 2018; pp. 172–189. [Google Scholar]
- Huang, Z.; Wang, X.; Huang, L.; Huang, C.; Wei, Y.; Liu, W.C. Ccnet: Criss-cross attention for semantic segmentation. In Proceedings of the IEEE International Conference on Computer Vision, Seoul, Korea, 27 October–2 November 2019; pp. 603–612. [Google Scholar]
- Selvan, R.; Dam, E.B.; Rischel, S.; Sheng, K.; Nielsen, M.; Pai, A. Lung Segmentation from Chest X-rays using Variational Data Imputation. arXiv 2020, arXiv:2005.10052. [Google Scholar]
- Souza, J.C.; Diniz, J.; Ferreira, J.L.; Silva, G.; Paiva, A. An automatic method for lung segmentation and reconstruction in chest x-ray using deep neural networks. Comput. Methods Programs Biomed. 2019, 177, 285–296. [Google Scholar] [CrossRef]
- Jaeger, S.; Candemir, S.; Antani, S.; Wang, Y.X.J.; Lu, P.X.; Thoma, G. Two public chest X-ray datasets for computer-aided screening of pulmonary diseases. Quant. Imaging Med. Surg. 2014, 4, 475. [Google Scholar]
- Jaeger, S.; Karargyris, A.; Candemir, S.; Folio, L.; Siegelman, J.; Callaghan, F.; McDonald, C. Automatic tuberculosis screening using chest radiographs. IEEE Trans. Med. Imaging 2014, 33, 233–245. [Google Scholar] [CrossRef] [PubMed]
- Shiraishi, J.; Katsuragawa, S.; Ikezoe, J.; Matsumoto, T.; Kobayashi, T.; Komatsu, K.I.; Doi, K. Development of a digital image database for chest radiographs with and without a lung nodule: Receiver operating characteristic analysis of radiologists’ detection of pulmonary nodules. Am. J. Roentgenol. 2000, 174, 71–74. [Google Scholar] [CrossRef] [PubMed]
- Dong, C.; Loy, C.C.; He, K.; Tang, X. Image super-resolution using deep convolutional networks. IEEE Trans. Pattern Anal. Mach. Intell. 2015, 38, 295–307. [Google Scholar] [CrossRef] [PubMed]
- Nazabal, A.; Olmos, P.M.; Ghahramani, Z.; Valera, I. Handling incomplete heterogeneous data using vaes. Pattern Recognit. 2020, 107, 107501. [Google Scholar] [CrossRef]
- Lin, T.Y.; Goyal, P.; Girshick, R.; He, K.; Dollár, P. Focal loss for dense object detection. In Proceedings of the IEEE International Conference on Computer Vision, Santiago, Chile, 7–13 December 2015; pp. 2980–2988. [Google Scholar]
- Milletari, F.; Navab, N.; Ahmadi, S.A.V. V-net: Fully convolutional neural networks for volumetric medical image segmentation. In Proceedings of the 2016 Fourth International Conference on 3D Vision, Stanford, CA, USA, 25–28 October 2015; pp. 565–571. [Google Scholar]


| METHOD | ACC | R | SP | P | F1-Score | Jaccard | Time (ms) |
|---|---|---|---|---|---|---|---|
| FCN | 0.9598 | 0.8296 | 0.9838 | 0.9306 | 0.8721 | 0.8344 | 25.11 |
| SegNet | 0.9676 | 0.8897 | 0.9906 | 0.9640 | 0.9214 | 0.8545 | 25.88 |
| U-Net | 0.9673 | 0.9062 | 0.9861 | 0.9479 | 0.9244 | 0.8618 | 33.01 |
| AttU-Net | 0.9698 | 0.9035 | 0.9882 | 0.9557 | 0.9260 | 0.8624 | 42.45 |
| LF_Seg | 0.9676 | 0.9047 | 0.9846 | 0.9411 | 0.9201 | 0.8605 | 29.68 |
| VAEU-Net | 0.9684 | 0.9060 | 0.9861 | 0.9460 | 0.9226 | 0.8615 | 37.14 |
| OUR | 0.9731 | 0.9178 | 0.9886 | 0.9573 | 0.9358 | 0.8817 | 44.36 |
| METHOD | ACC | R | SP | P | F1-Score | Jaccard | Time (ms) |
|---|---|---|---|---|---|---|---|
| FCN | 0.9609 | 0.9121 | 0.9824 | 0.9513 | 0.9274 | 0.8727 | 25.21 |
| SegNet | 0.9692 | 0.9208 | 0.9897 | 0.9378 | 0.9292 | 0.8754 | 25.73 |
| U-Net | 0.9658 | 0.9325 | 0.9802 | 0.9534 | 0.9397 | 0.8915 | 33.05 |
| AttU-Net | 0.9734 | 0.9388 | 0.9867 | 0.9732 | 0.9545 | 0.9149 | 42.34 |
| LF_Seg | 0.9701 | 0.9321 | 0.9871 | 0.9689 | 0.9489 | 0.9046 | 29.71 |
| VAEU-Net | 0.9721 | 0.9488 | 0.9851 | 0.9651 | 0.9561 | 0.9172 | 37.13 |
| OUR | 0.9781 | 0.9504 | 0.9884 | 0.9693 | 0.9588 | 0.9201 | 44.38 |
| DATASET | METHOD | ACC | R | SP | P | F1-Score | Jaccard | Time (ms) |
|---|---|---|---|---|---|---|---|---|
| NIH | U-Net | 0.9673 | 0.9062 | 0.9861 | 0.9479 | 0.9244 | 0.8618 | 33.01 |
| U-Net + FVAE | 0.9701 | 0.9135 | 0.9885 | 0.9567 | 0.9334 | 0.8777 | 39.27 | |
| OUR | 0.9731 | 0.9178 | 0.9886 | 0.9573 | 0.9358 | 0.8817 | 44.36 | |
| JRST | U-Net | 0.9658 | 0.9325 | 0.9802 | 0.9534 | 0.9397 | 0.8915 | 33.05 |
| U-Net + FVAE | 0.9750 | 0.9497 | 0.9861 | 0.9673 | 0.9578 | 0.9176 | 39.25 | |
| OUR | 0.9781 | 0.9504 | 0.9884 | 0.9693 | 0.9588 | 0.9201 | 44.38 |
Publisher’s Note: MDPI stays neutral with regard to jurisdictional claims in published maps and institutional affiliations. |
© 2021 by the authors. Licensee MDPI, Basel, Switzerland. This article is an open access article distributed under the terms and conditions of the Creative Commons Attribution (CC BY) license (https://creativecommons.org/licenses/by/4.0/).
Share and Cite
Cao, F.; Zhao, H. Automatic Lung Segmentation Algorithm on Chest X-ray Images Based on Fusion Variational Auto-Encoder and Three-Terminal Attention Mechanism. Symmetry 2021, 13, 814. https://doi.org/10.3390/sym13050814
Cao F, Zhao H. Automatic Lung Segmentation Algorithm on Chest X-ray Images Based on Fusion Variational Auto-Encoder and Three-Terminal Attention Mechanism. Symmetry. 2021; 13(5):814. https://doi.org/10.3390/sym13050814
Chicago/Turabian StyleCao, Feidao, and Huaici Zhao. 2021. "Automatic Lung Segmentation Algorithm on Chest X-ray Images Based on Fusion Variational Auto-Encoder and Three-Terminal Attention Mechanism" Symmetry 13, no. 5: 814. https://doi.org/10.3390/sym13050814
APA StyleCao, F., & Zhao, H. (2021). Automatic Lung Segmentation Algorithm on Chest X-ray Images Based on Fusion Variational Auto-Encoder and Three-Terminal Attention Mechanism. Symmetry, 13(5), 814. https://doi.org/10.3390/sym13050814