Article

Machine Learning-Based Pulse Wave Analysis for Early Detection of Abdominal Aortic Aneurysms Using In Silico Pulse Waves

1
Department of Biomedical Engineering, School of Biomedical Engineering and Imaging Sciences, King’s College London, London SE1 7EU, UK
2
School of Naval Architecture, Ocean and Civil Engineering, Shanghai Jiao Tong University, Shanghai 200240, China
3
World-Class Research Center, Digital Biodesign and Personalized Healthcare, Sechenov First Moscow State Medical University, 119991 Moscow, Russia
*
Author to whom correspondence should be addressed.
Symmetry 2021, 13(5), 804; https://doi.org/10.3390/sym13050804
Submission received: 26 March 2021 / Revised: 23 April 2021 / Accepted: 1 May 2021 / Published: 5 May 2021
(This article belongs to the Special Issue Biofluids in Medicine: Models, Computational Methods and Applications)

Abstract

:
An abdominal aortic aneurysm (AAA) is usually asymptomatic until rupture, which is associated with extremely high mortality. Consequently, the early detection of AAAs is of paramount importance in reducing mortality; however, most AAAs are detected by medical imaging only incidentally. The aim of this study was to investigate the feasibility of machine learning-based pulse wave (PW) analysis for the early detection of AAAs using a database of in silico PWs. PWs in the large systemic arteries were simulated using one-dimensional blood flow modelling. A database of in silico PWs representative of subjects (aged 55, 65 and 75 years) with different AAA sizes was created by varying the AAA-related parameters with major impacts on PWs—identified by parameter sensitivity analysis—in an existing database of in silico PWs representative of subjects without AAAs. Then, a machine learning architecture for AAA detection was trained and tested using the new in silico PW database. The parameter sensitivity analysis revealed that the AAA maximum diameter and stiffness of the large systemic arteries were the dominant AAA-related biophysical properties considerably influencing the PWs. However, AAA detection by PW indexes was compromised by other non-AAA related cardiovascular parameters. The proposed machine learning model produced a sensitivity of 86.8 % and a specificity of 86.3 % in early detection of AAA from the photoplethysmogram PW signal measured in the digital artery with added random noise. The number of false positive and negative results increased with increasing age and decreasing AAA size, respectively. These findings suggest that machine learning-based PW analysis is a promising approach for AAA screening using PW signals acquired by wearable devices.

1. Introduction

An abdominal aortic aneurysm (AAA) is usually defined as the irreversible localized dilatation of the infrarenal abdominal aorta, which is usually asymptomatic until rupture [1]. The morbidity of AAA is significantly higher in men than in women (1.3% to 8.9% vs. 1.0% to 2.2%) and increases as a result of various factors such as tobacco smoking, ageing, and a family history of AAAs [1,2,3]. Given that the rupture of an AAA is often lethal with mortality reaching about 90% [4,5], timely diagnosis and appropriate treatment are crucial for patients with an AAA. Large AAAs in underweight subjects can often be detected by physical examination, but accuracy depends on the examiner’s skills and is considerably reduced for obese body habitus and small AAA size [6]. In current clinical practice, AAAs are most often detected as incidental findings of ultrasonography, abdominal computed tomography, or magnetic resonance imaging performed for other purposes [6]. However, these medical imaging examinations require professional equipment that cannot be used in daily life.
Considering that the presence of an AAA has a systemic impact on the biophysical properties of the cardiovascular system, thus influencing the arterial pulse wave (PW) [7,8], analysis of PWs acquired by wearable devices may provide an alternative approach for the early detection of AAAs. These devices are more convenient and less expensive for large-scale screening than medical imaging exams. In particular, the photoplethysmogram (PPG) PW is easily acquired using pulse oximeters, which are frequently used in healthcare settings to measure arterial blood oxygen saturation and pulse rate. The PPG signal can also be acquired by devices available to the wider population, such as smartphones, smartwatches and fitness bands [9]. Therefore, if it was possible to detect an AAA from the PPG then it may have great clinical utility.
In recent years, machine learning-based PW analyses have been performed to investigate a wide range of clinical problems, showing promising results [10,11,12,13]. Training machine learning models usually requires databases of PWs measured in a large number of subjects. Acquiring these data, however, presents several challenges: (i) the measurement accuracy is subject to the type of equipment used and may be operator-dependent; (ii) it is complex to measure PWs at all sites of interest; (iii) it can be difficult to measure reference variables precisely; (iv) it is challenging to study the influence of individual cardiovascular properties on the PW in vivo since other properties may change over time; and (v) data acquisition is expensive and time-consuming. Databases of simulated PWs representative of real subject samples provide an alternative approach that addresses all these challenges. A database of in silico PWs can be produced by using computational blood flow modelling [14,15,16,17]. This is a cost-effective approach to generate a large number of virtual subjects, each with a distinctive set of PW signals, across a wide range of pathophysiological conditions for the training process of a machine learning model for PW analysis. Consequently, machine learning-based PW analysis using the database of in silico PWs could be employed for the early detection of AAAs.
Previous studies on AAAs have mainly studied AAA rupture by statistical analysis of AAA morphology [18,19], biomechanical analysis using semi-empirical equations [20], and three-dimensional finite element analysis of AAA wall stress [21,22]. Some computational studies investigated the initiation and growth of an AAA [23,24,25], and others focused on the prediction and planning of interventional procedures for AAAs such as endovascular deployment of stent-grafts [26,27,28]. Moreover, some studies have studied PW propagation in the presence of AAAs [29,30,31] and investigated the effects of AAAs on PW morphology by using computational blood flow modelling [32,33,34,35,36].
The aim of this study was to create a new database of in silico PWs representative of subjects aged 55, 65 and 75 years old, with and without AAAs, and investigate the feasibility of machine learning-based PW analysis for the early detection of AAA using this database. Firstly, PWs in baseline subjects with and without AAAs were modelled using one-dimensional blood flow modelling, and a parameter sensitivity analysis was performed to evaluate the influence of AAA-related biophysical properties on the simulated PWs. Subsequently, the new database of in silico PWs was created by introducing the AAA-related parameters found to have a large impact on PWs (by the sensitivity analysis) into an existing in silico PW database representative of subjects without AAAs [14]. Finally, a machine learning architecture was proposed based on the recurrent neural network (RNN). This was trained and tested using the peripheral PPG PW derived from the in-silico PW database to evaluate the performance of machine learning-based PW analysis for the early detection of AAAs.

2. Materials and Methods

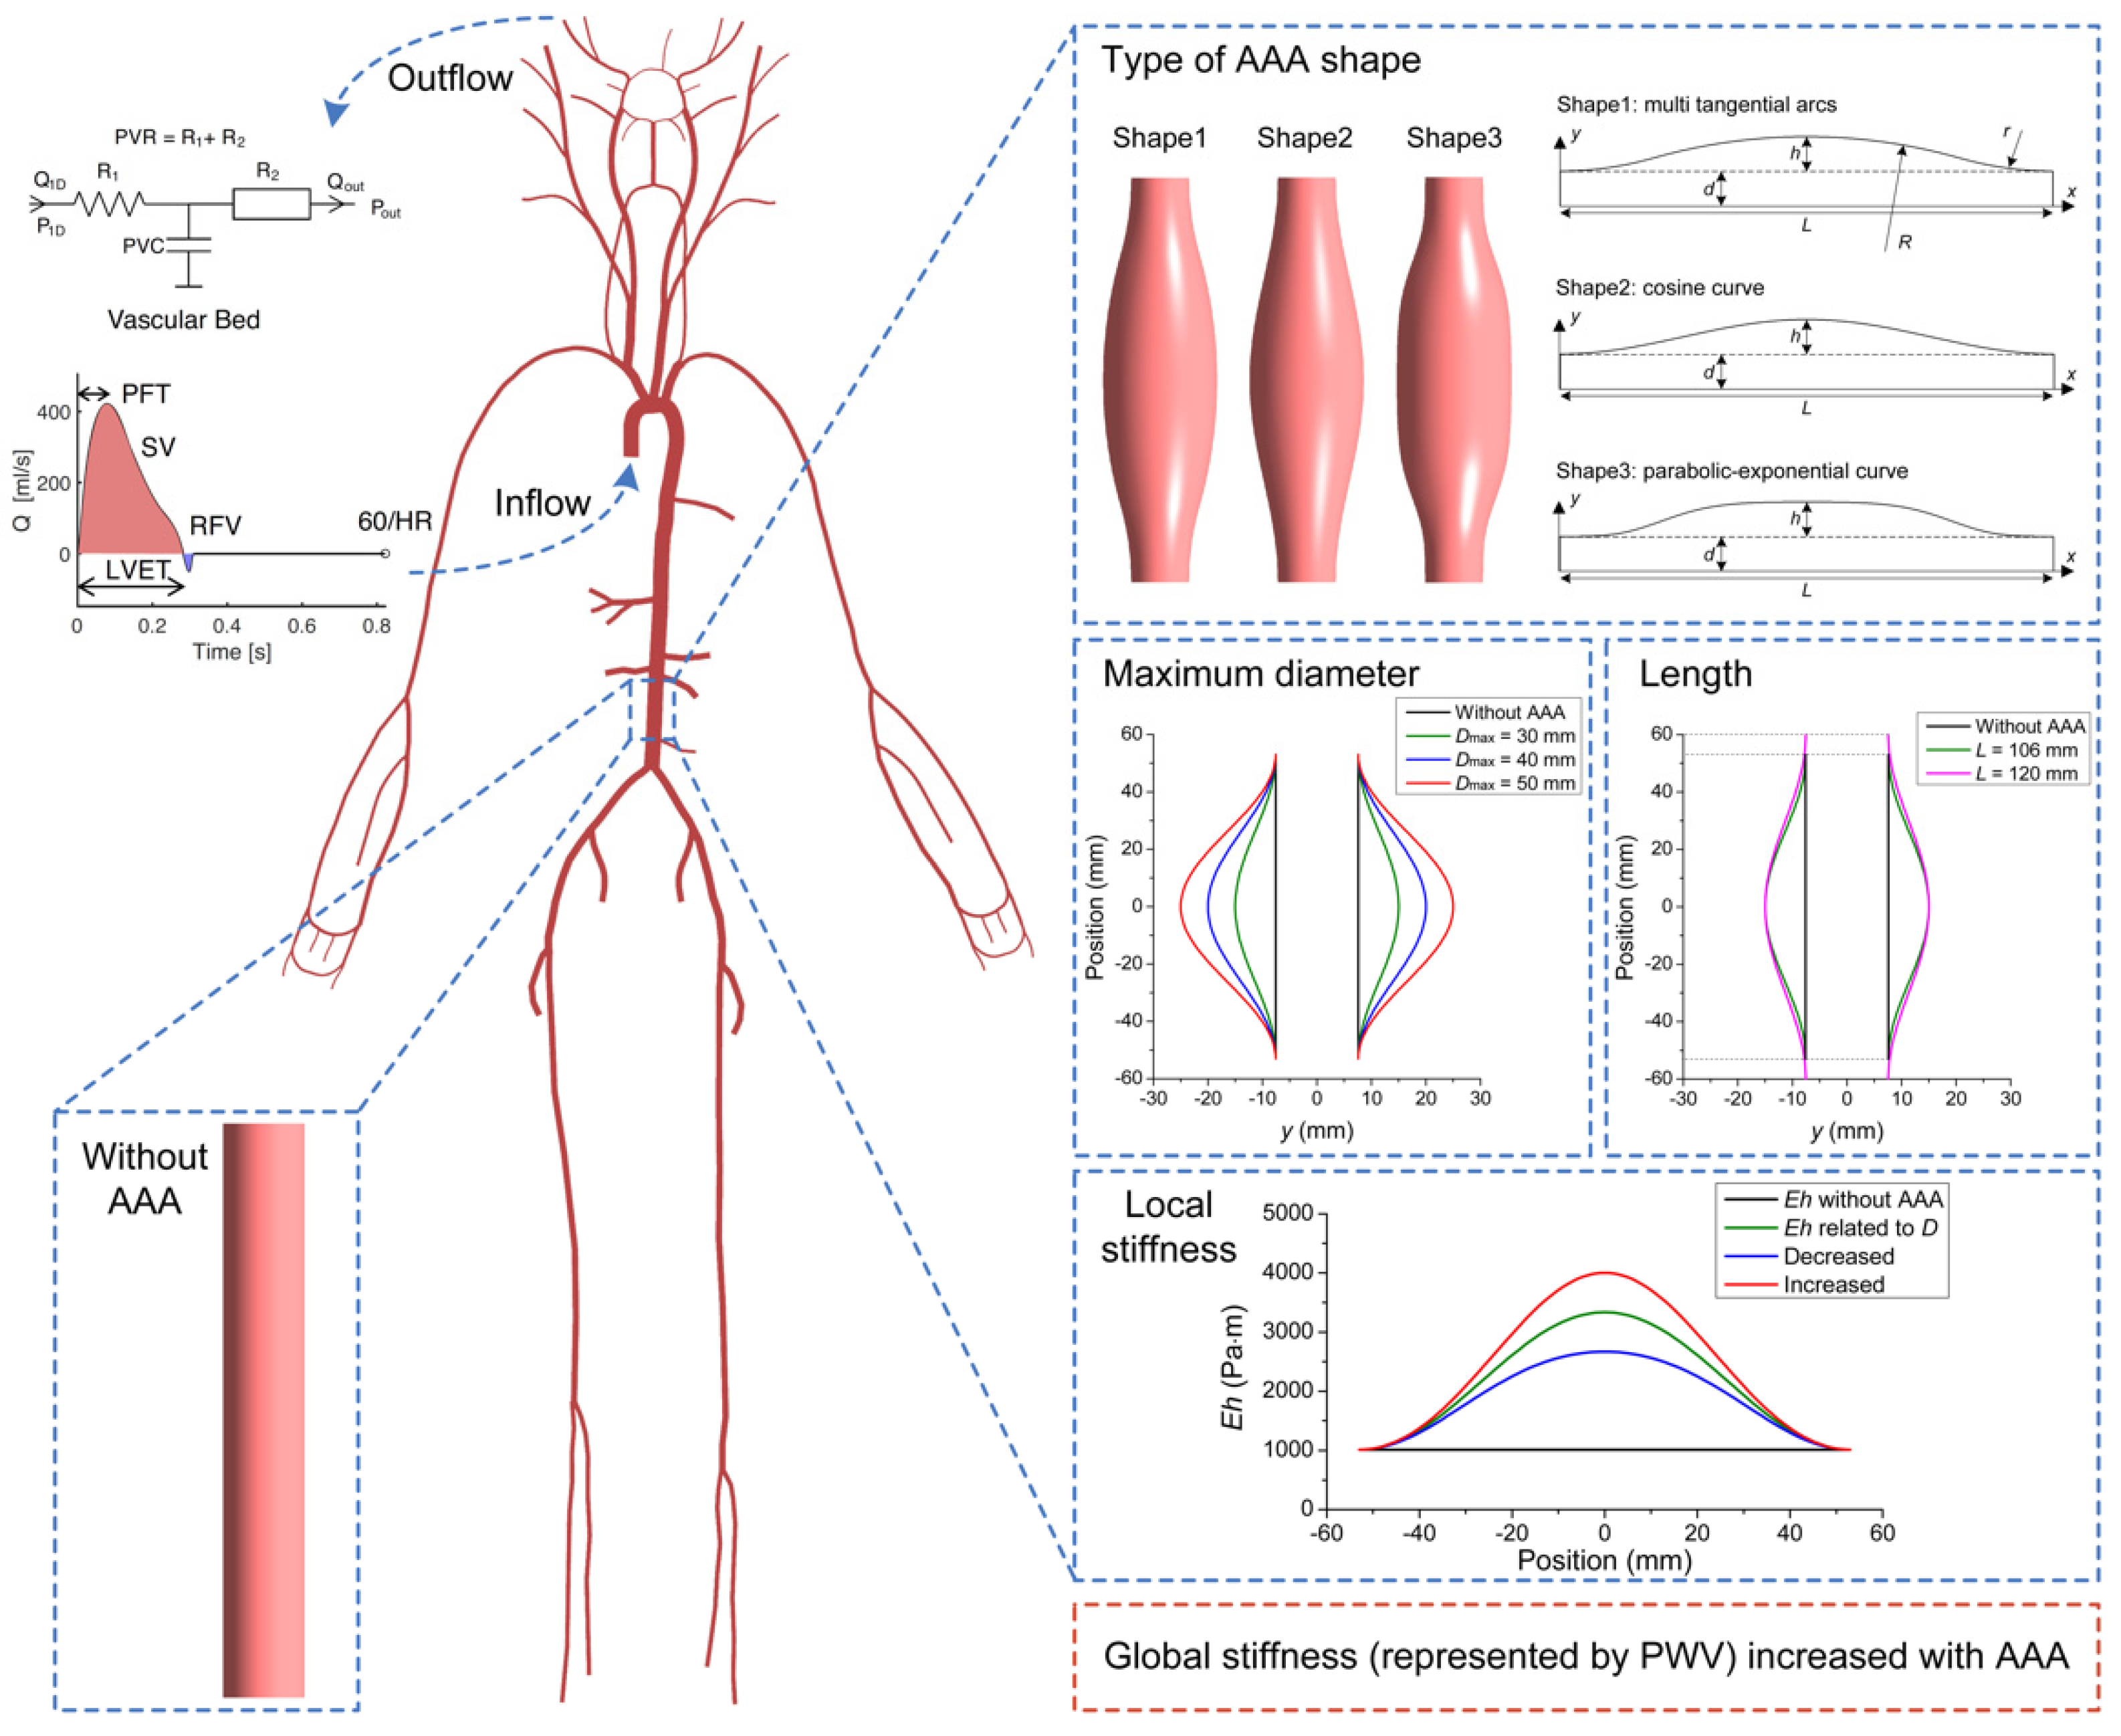
2.1. Modelling Pulse Waves in Baseline Subjects with and without AAAs

One-dimensional blood flow modelling in the lager systemic arteries (see Figure 1) was used to simulate several PW signals: blood pressure, blood flow velocity, blood flow rate and PPG. The baseline subject without an AAA was adapted from the baseline 65-year-old subject derived from the database of in silico PWs developed by Charlton [14], given that it is usually elderly people who suffer from AAA [2,22]. Herein, two biophysical properties of the original model were adapted to make the subjects with and without AAA comparable: (i) the tapered infrarenal abdominal aorta was replaced by a straight tube with a diameter equal to the average value of the original proximal and distal diameters, and (ii) wall viscosity in this segment was removed to improve numerical stability. The baseline subject with an AAA was then obtained by modifying the baseline subject without AAA (Figure 1). First, the shape of the infrarenal abdominal aorta was transformed from a straight line (i.e., constant diameter) into a cosine curve with the same length and the maximum diameter being set at 30 mm. Second, the stiffness of this segment, which was quantified by the product of elastic modulus and wall thickness (Eh), was decoupled from the diameter and thereby maintained constant.

2.2. Parameter Sensitivity Analysis

Based on the reference model of a subject aged 65 years old with an AAA introduced in Section 2.1, several AAA-related biophysical properties—the type of AAA shape, AAA maximum diameter, AAA length, AAA local stiffness and global stiffness of the larger systemic arteries—were varied individually to investigate their influence on the simulated PWs (see Figure 1).
Although AAAs in real patients are usually fusiform and asymmetric [1,21,37], previous model-based studies have simulated AAAs as being axisymmetrical with a geometry that can be described by several types of mathematical functions [33,35]. In the present study, three common types of AAA shapes derived from previous studies were considered: multiple tangential arcs [33] (Shape 1), a cosine curve [35,38] (Shape 2), and a parabolic-exponential curve [39] (Shape 3) (see Figure 1). The mathematical functions of the radius (y) against the distance from the vessel inlet (x) for the three types of shapes were respectively expressed by:
y = r 1 1 x 2 r 2 + d , 0 x 4 h L r 4 h 2 + L 2 y = 4 h 2 + L 2 8 h r 2 x L 2 2 L 2 4 h 2 8 h + r + d , 4 h L r 4 h 2 + L 2 < x L 4 h L r 4 h 2 + L 2 y = r 1 1 L x 2 r 2 + d , L 4 h L r 4 h 2 + L 2 x L r = 0.02 4 h 2 + L 2 4 h L ,
y = d + h 2 1 + cos 2 π x L 1 2 ,
y = d + h c 3 d x L 2 2 e c 1 x L 2 d c 2 c 1 = 0.001 , c 2 = 4.605 L 2 d c 1 , c 3 = h d 4 L 5 d 2 ,
where d is the radius of the straight infrarenal abdominal aorta without AAA, L is the vessel length and h is the difference between the AAA maximum diameter and d (see Figure 1).
The AAA size is usually evaluated by the maximum diameter (Dmax) in clinical practice, with Dmax larger than 30 mm being diagnosed as AAA and Dmax larger than 50 mm being stratified as a serious AAA [2,40]. Since this study focused on the early detection of AAAs, herein three levels of Dmax were considered in the parameter sensitivity analysis: 30, 40 and 50 mm. Besides the maximum diameter, the length of an AAA also shows inter-patient difference [18,41], which was considered in the present study by increasing the length of the reference model from 106 to 120 mm (see Figure 1).
Besides these morphological features, the infrarenal abdominal aorta in subjects with an AAA usually has a higher elastic modulus and a thicker vascular wall compared with normal subjects [25,42]. In the model this was simulated by coupling the stiffness Eh of the AAA with the diameter (D, varying along the infrarenal abdominal aorta) using:
E h = D k 1 exp k 2 D + k 3 .
The values of the empirical constants k1, k2, and k3 were taken from a previous study [14]. Variations in AAA local stiffness were described by multiplying the above expression by a cosine function that made the maximum Eh value decrease or increase by 20% (see Figure 1).
Moreover, clinical studies have found larger carotid-femoral pulse wave velocities (cf-PWVs) in patients with AAA than in age-matched healthy subjects [43,44,45]. The values of cf-PWV for control and AAA patients reported by three clinical studies are listed in Table 1. From these data a cf-PWV increase of 4.3 m/s was calculated in patients suffering from AAA. This change was considered in the parameter sensitivity analysis by increasing the prescribed desired cf-PWV as described by Charlton et al. [14].

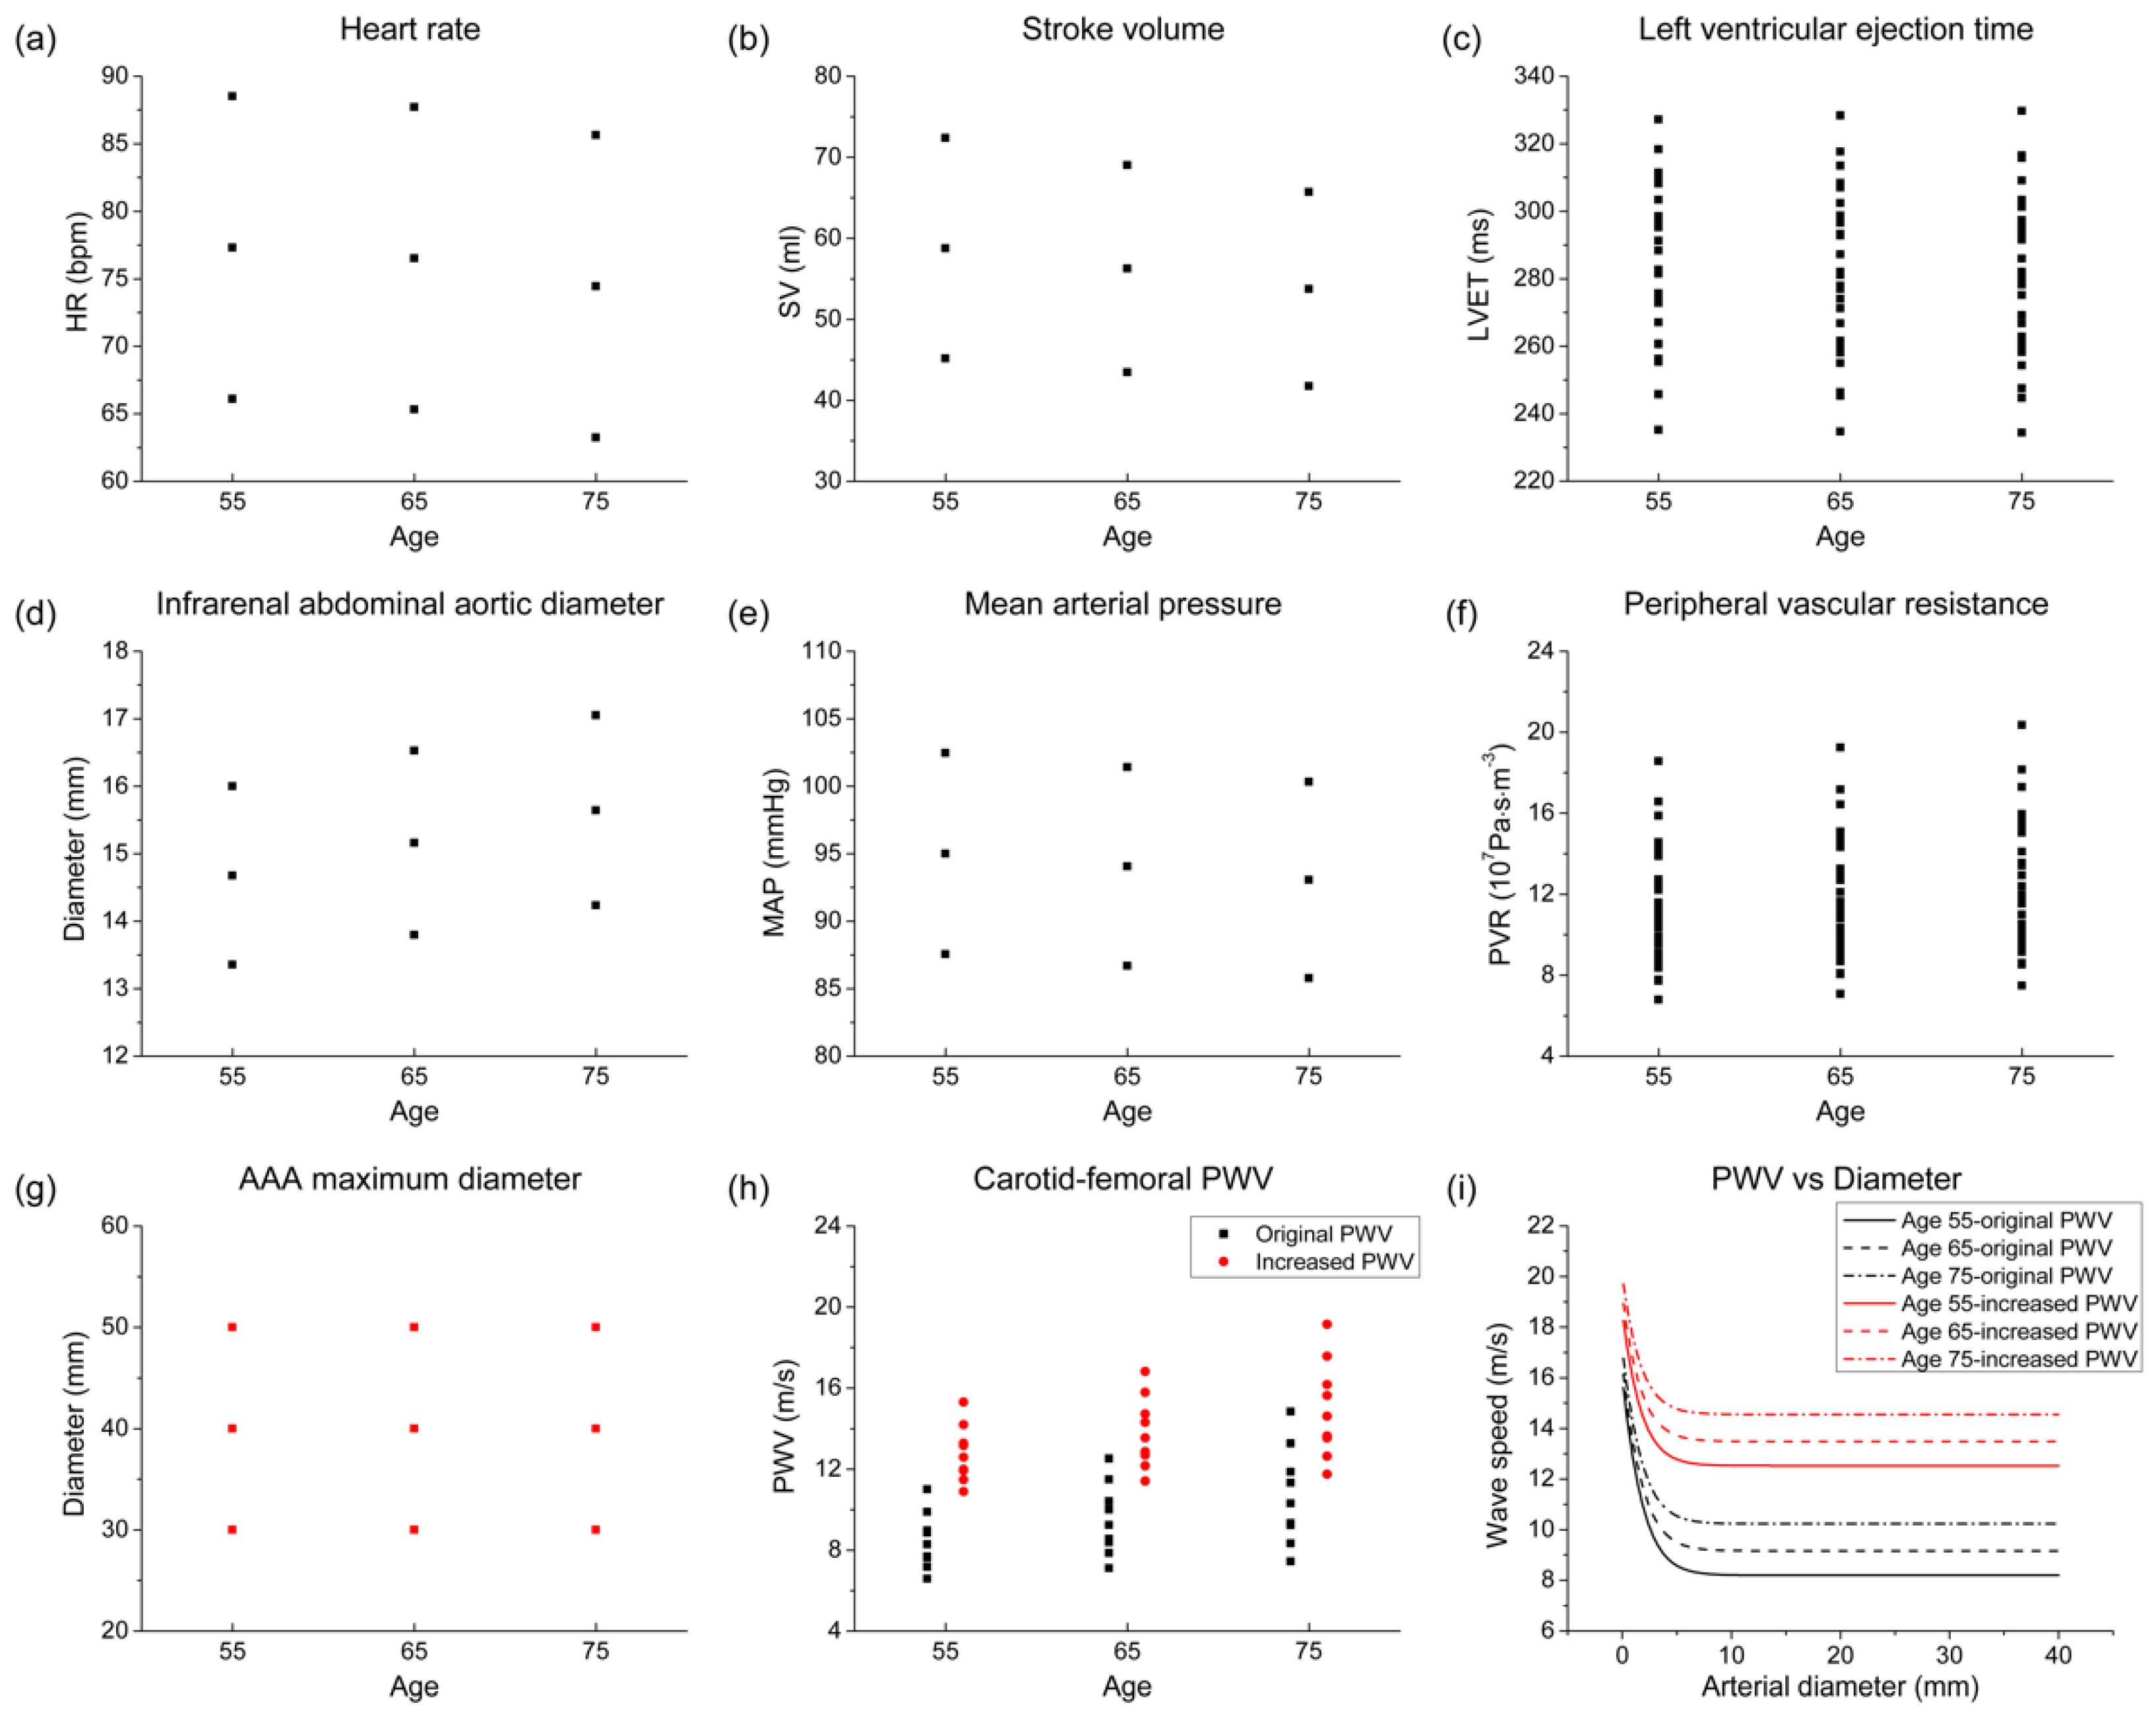
2.3. Database of In Silico Pulse Waves

2.3.1. Modelling a Database of Pulse Waves in Subjects with and without an AAA

The entire database of in silico PWs created in this study contains three subsets: (i) baseline subset, (ii) increased global stiffness (IGS) subset, and (iii) AAA subset. The first two subsets consist of subjects without AAAs, while the third subset contains subjects with different AAA sizes.
The baseline subset was modelled based on the database developed by Charlton et al. [14], which contains six age groups with 729 subjects in each group. In the present study, only the three groups with the older subjects (55, 65 and 75 years old) were used since AAA usually occurs in the elderly rather than the young [2,22]. The baseline subset was obtained by modifying each of the original 2187 (729 × 3) subjects as described in Section 2.1. The IGS subset (also 2187 subjects) was created from the baseline subset, by increasing the desired cf-PWV by 4.3 m/s as described above (see Table 1).
According to the parameter sensitivity analysis, the AAA-related parameters that strongly influence the simulated PWs were AAA maximum diameter and global stiffness of the systemic arteries (see Section 3.1). Variations in global stiffness, which was quantified by cf-PWV, were already considered in the IGS subset. Accordingly, the AAA subset was created by introducing an AAA with maximum diameters of 30, 40, or 50 mm to each subject of the IGS subset. The resulting AAA subset thereby included 6561 (2187 × 3) subjects with three different AAA sizes. The methodology used to simulate an AAA for each subject followed the steps described in Section 2.1 to obtain the baseline subject with an AAA, except for the calculation of AAA local stiffness. Herein, higher Eh values with cosine distributions were assigned instead of the constant Eh values used in the baseline and IGS subsets.
A literature review provided the elastic modulus, E, and wall thickness, h, of the normal infrarenal abdominal aorta and AAA, as summarized in Table 2. The mean increase in E from normal to AAA was 73.2%. The average h increased by 42.9%, from 1.4 mm (normal condition) to 2 mm (AAA) and was found to be independent of AAA size [42]. Accordingly, the Eh value of the infrarenal abdominal aorta for the baseline 65-year-old subject in the AAA subset was assigned a cosine distribution with the mean value increasing by 147.43% with respect to the baseline subset. At the two extremes in the vessel, Eh was assigned the same values as for the corresponding subject in the IGS subset. All other 6560 subjects in the AAA subset were prescribed the same distribution of Eh in the infrarenal abdominal aorta as the baseline 65-year-old subject. This distribution was linearly scaled to maintain the value at the two vessel extremes used in the IGS subset.
Figure 2 shows the variations in the model input parameters with age for the entire database. These include the cardiovascular parameters prescribed by Charlton et al. [14] and the AAA-related parameter changes introduce in this study; i.e., the AAA maximum diameter and global stiffness of the systemic arteries (shown in red dots and lines).

2.3.2. Extracting Pulse Wave Indexes

The cf-PWV and the augmentation index (AIx) have been shown to be significantly higher in patients with AAA compared to normal subjects [43,44,45]. Accordingly, for each subject in this study, cf-PWV was calculated from the carotid-femoral pulse transit time (cf-PTT) and corresponding arterial path length, with the cf-PTT measured from the pressure PWs in the carotid and femoral arteries using the foot-to-foot method [14,53]. Wave separation analysis [54] was used to calculate the AIx for each virtual subject, as well as the timing and magnitude of wave reflection. The forward (Pf) and backward (Pb) components of the pressure PW in the ascending aorta were calculated from the pressure (P), flow (Q), and local characteristic impedance (Zc, herein the average value of the modulus of the 3rd to 10th harmonics of the input impedance [55]):
P f = P + Z c Q / 2 P b = P Z c Q / 2 .
The wave reflection magnitude was calculated as the ratio of the amplitude of Pb to the amplitude of Pf. The time delay (ΔTf-b) between Pb and Pf was obtained using their zero cross-over as reference points. The AIx was calculated as:
AIx = 100 × SBP P fb PP ,
with SBP the systolic blood pressure, PP the pulse pressure, and Pfb the pressure at the time when the Pb adds to the Pf (corresponding to the zero cross-over of Pb).
The PPG PW in the digital artery of each virtual subject was extracted for further analysis using the mathematical expression [14]:
PPG t = 0 t Q 1 D t Q out t d t ,
where Q1D is the inflow to the windkessel segment connecting with the arterial outlet, and Qout is the outflow (see Figure 1).

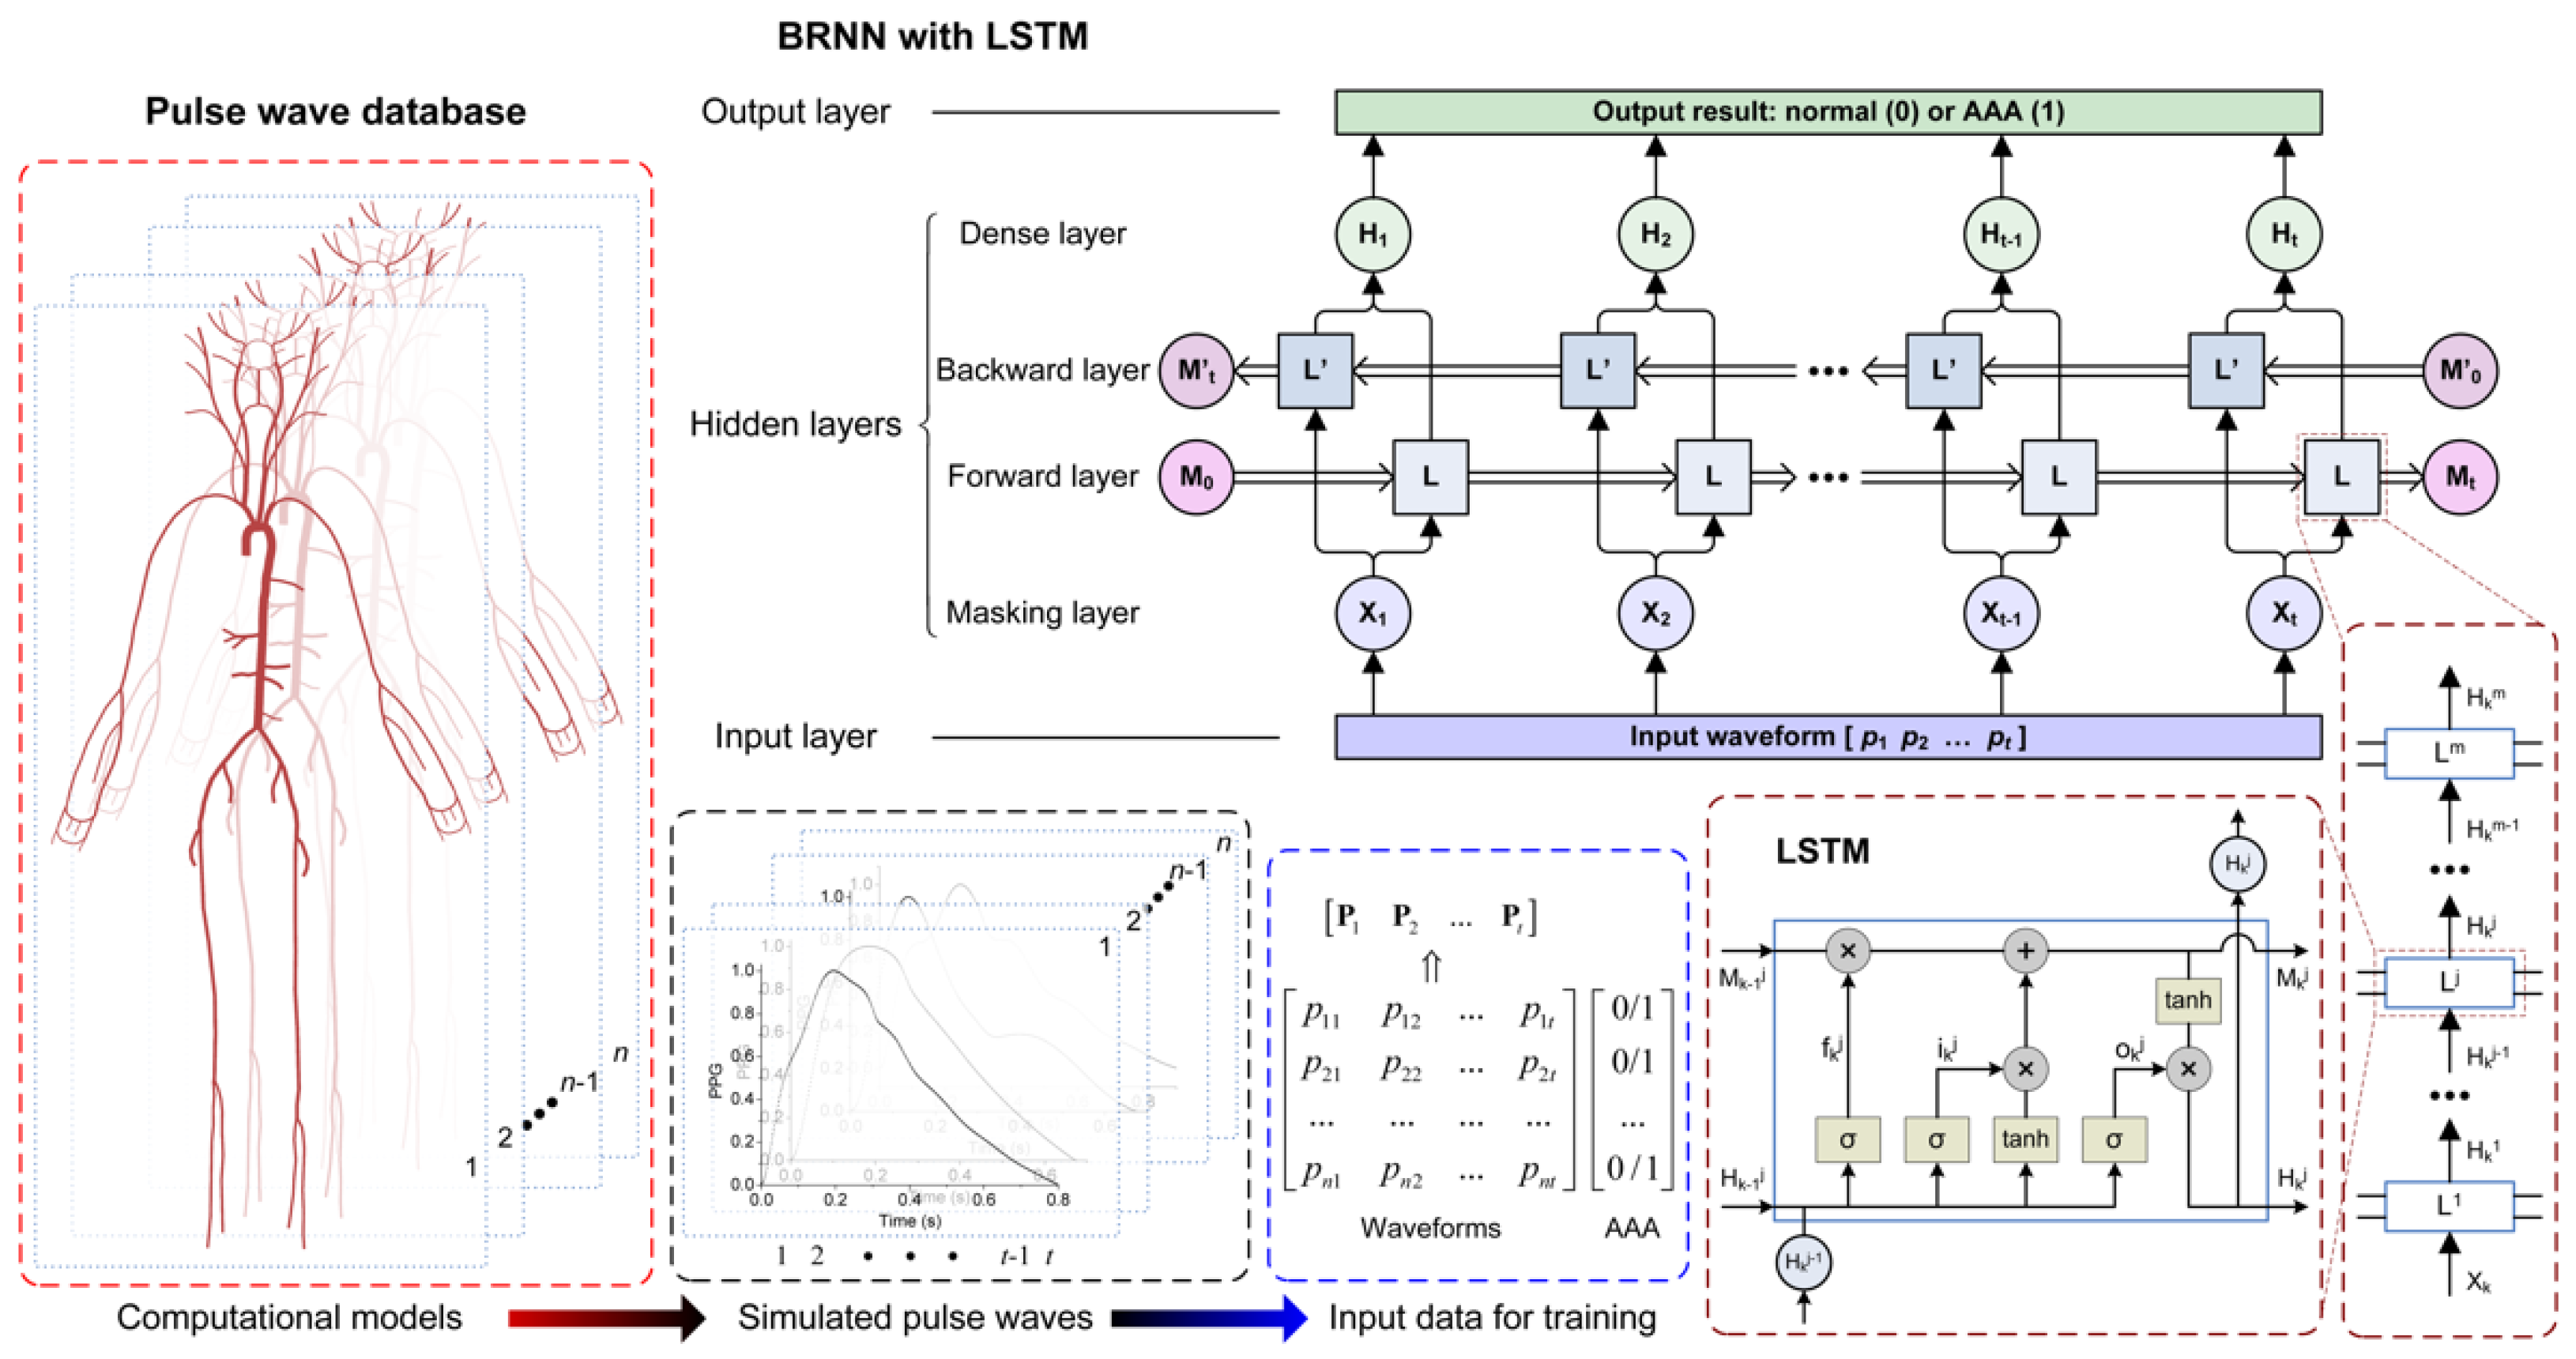
2.4. Machine Learning-Based Pulse Wave Analysis

2.4.1. Recurrent Neural Network

RNN is a machine learning architecture that is widely applied to handle time-series data in which the inputs at each time step include not only the input from the current time step, but also the output from the previous step [56]. For the purpose of improving the accuracy of prediction, bidirectional RNN (BRNN)—an advanced architecture—may be chosen when all time steps of the sequential input data are available [57]. Among the different types of nodes for RNN, the long short-term memory (LSTM) unit is one of the most suitable units for data with long duration, which is able to stop vanishing gradients by keeping track of dependencies between different time steps [58]. Accordingly, BRNN with LSTM was employed to perform the machine learning-based PW analysis in this study. Figure 3 shows a schematic of this machine learning architecture together with the workflow followed to train the machine learning model using the in silico PWs from the new database.
In the present machine learning architecture, first a batch of PWs were imported into the input layer, where the waves with short durations were extended to the duration of the longest wave by filling dummy values (i.e., the largest floating-point number that the system can support) at the end. Subsequently, the masking layer reacted to exclude the dummy values from being considered when the data were processed in the following layers. After the forward and backward layers processed the time-series data, a dense layer with an activation function (herein the sigmoid function) was used to estimate the output result. The forward and backward layers consisted of a series of LSTM units (see Figure 3), with the structure of each unit described as
f k j = σ U f j H k j 1 + W f j H k 1 j + b f j i k j = σ U i j H k j 1 + W i j H k 1 j + b i j o k j = σ U o j H k j 1 + W o j H k 1 j + b o j M k j = f k j M k 1 j + i k j tanh U M j H k j 1 + W M j H k 1 j + b M j H k j = o k j tanh M k j ,
where Hkj−1 and Hkj are the input and output, respectively, of the kth LSTM unit in the jth layer, and Mkj is the memory cell. U and W are the weights, and b is the bias. The subscripts f, i, and o represent the forget gate, input gate, and output gate, respectively. σ and tanh represent the sigmoid function and tanh function, respectively. The parameters of the present machine learning architecture are summarized in Table 3. This architecture was constructed using the open-source library TensorFlow 2.1 together with the high-level application programming interface Keras. The development of this architecture referred to a previous study as well as the corresponding online repository [59].

2.4.2. Training and Testing

PPG PWs in the digital arteries were extracted from the new database of in silico PWs to train and test the machine learning architecture (see Figure 3). The entire database included 10,935 subjects with (6561) and without (4374) an AAA, randomly split into a training (80%, 8748) and testing (20%, 2187) set. The infrarenal abdominal aorta was assigned a label condition of ‘0′ if an AAA was not present and ‘1′ if an AAA was present. The PPG PWs in the training set together with their corresponding conditions were employed in the training process. Subsequently, the trained machine learning model was tested on the testing set to evaluate its performance in the early detection of AAAs (i.e., classification of the normal (0) and AAA (1) conditions). Moreover, the trained machine learning model was further tested on a modified testing set which consisted of randomly varied PPG PWs obtained by superposing random variations (uniform distribution between −50% and 50%) to the first twenty harmonics of each PW. These variations reduced the similarity of the testing set to the training set and made the PWs more realistic by simulating the presence of measurement errors.

3. Results

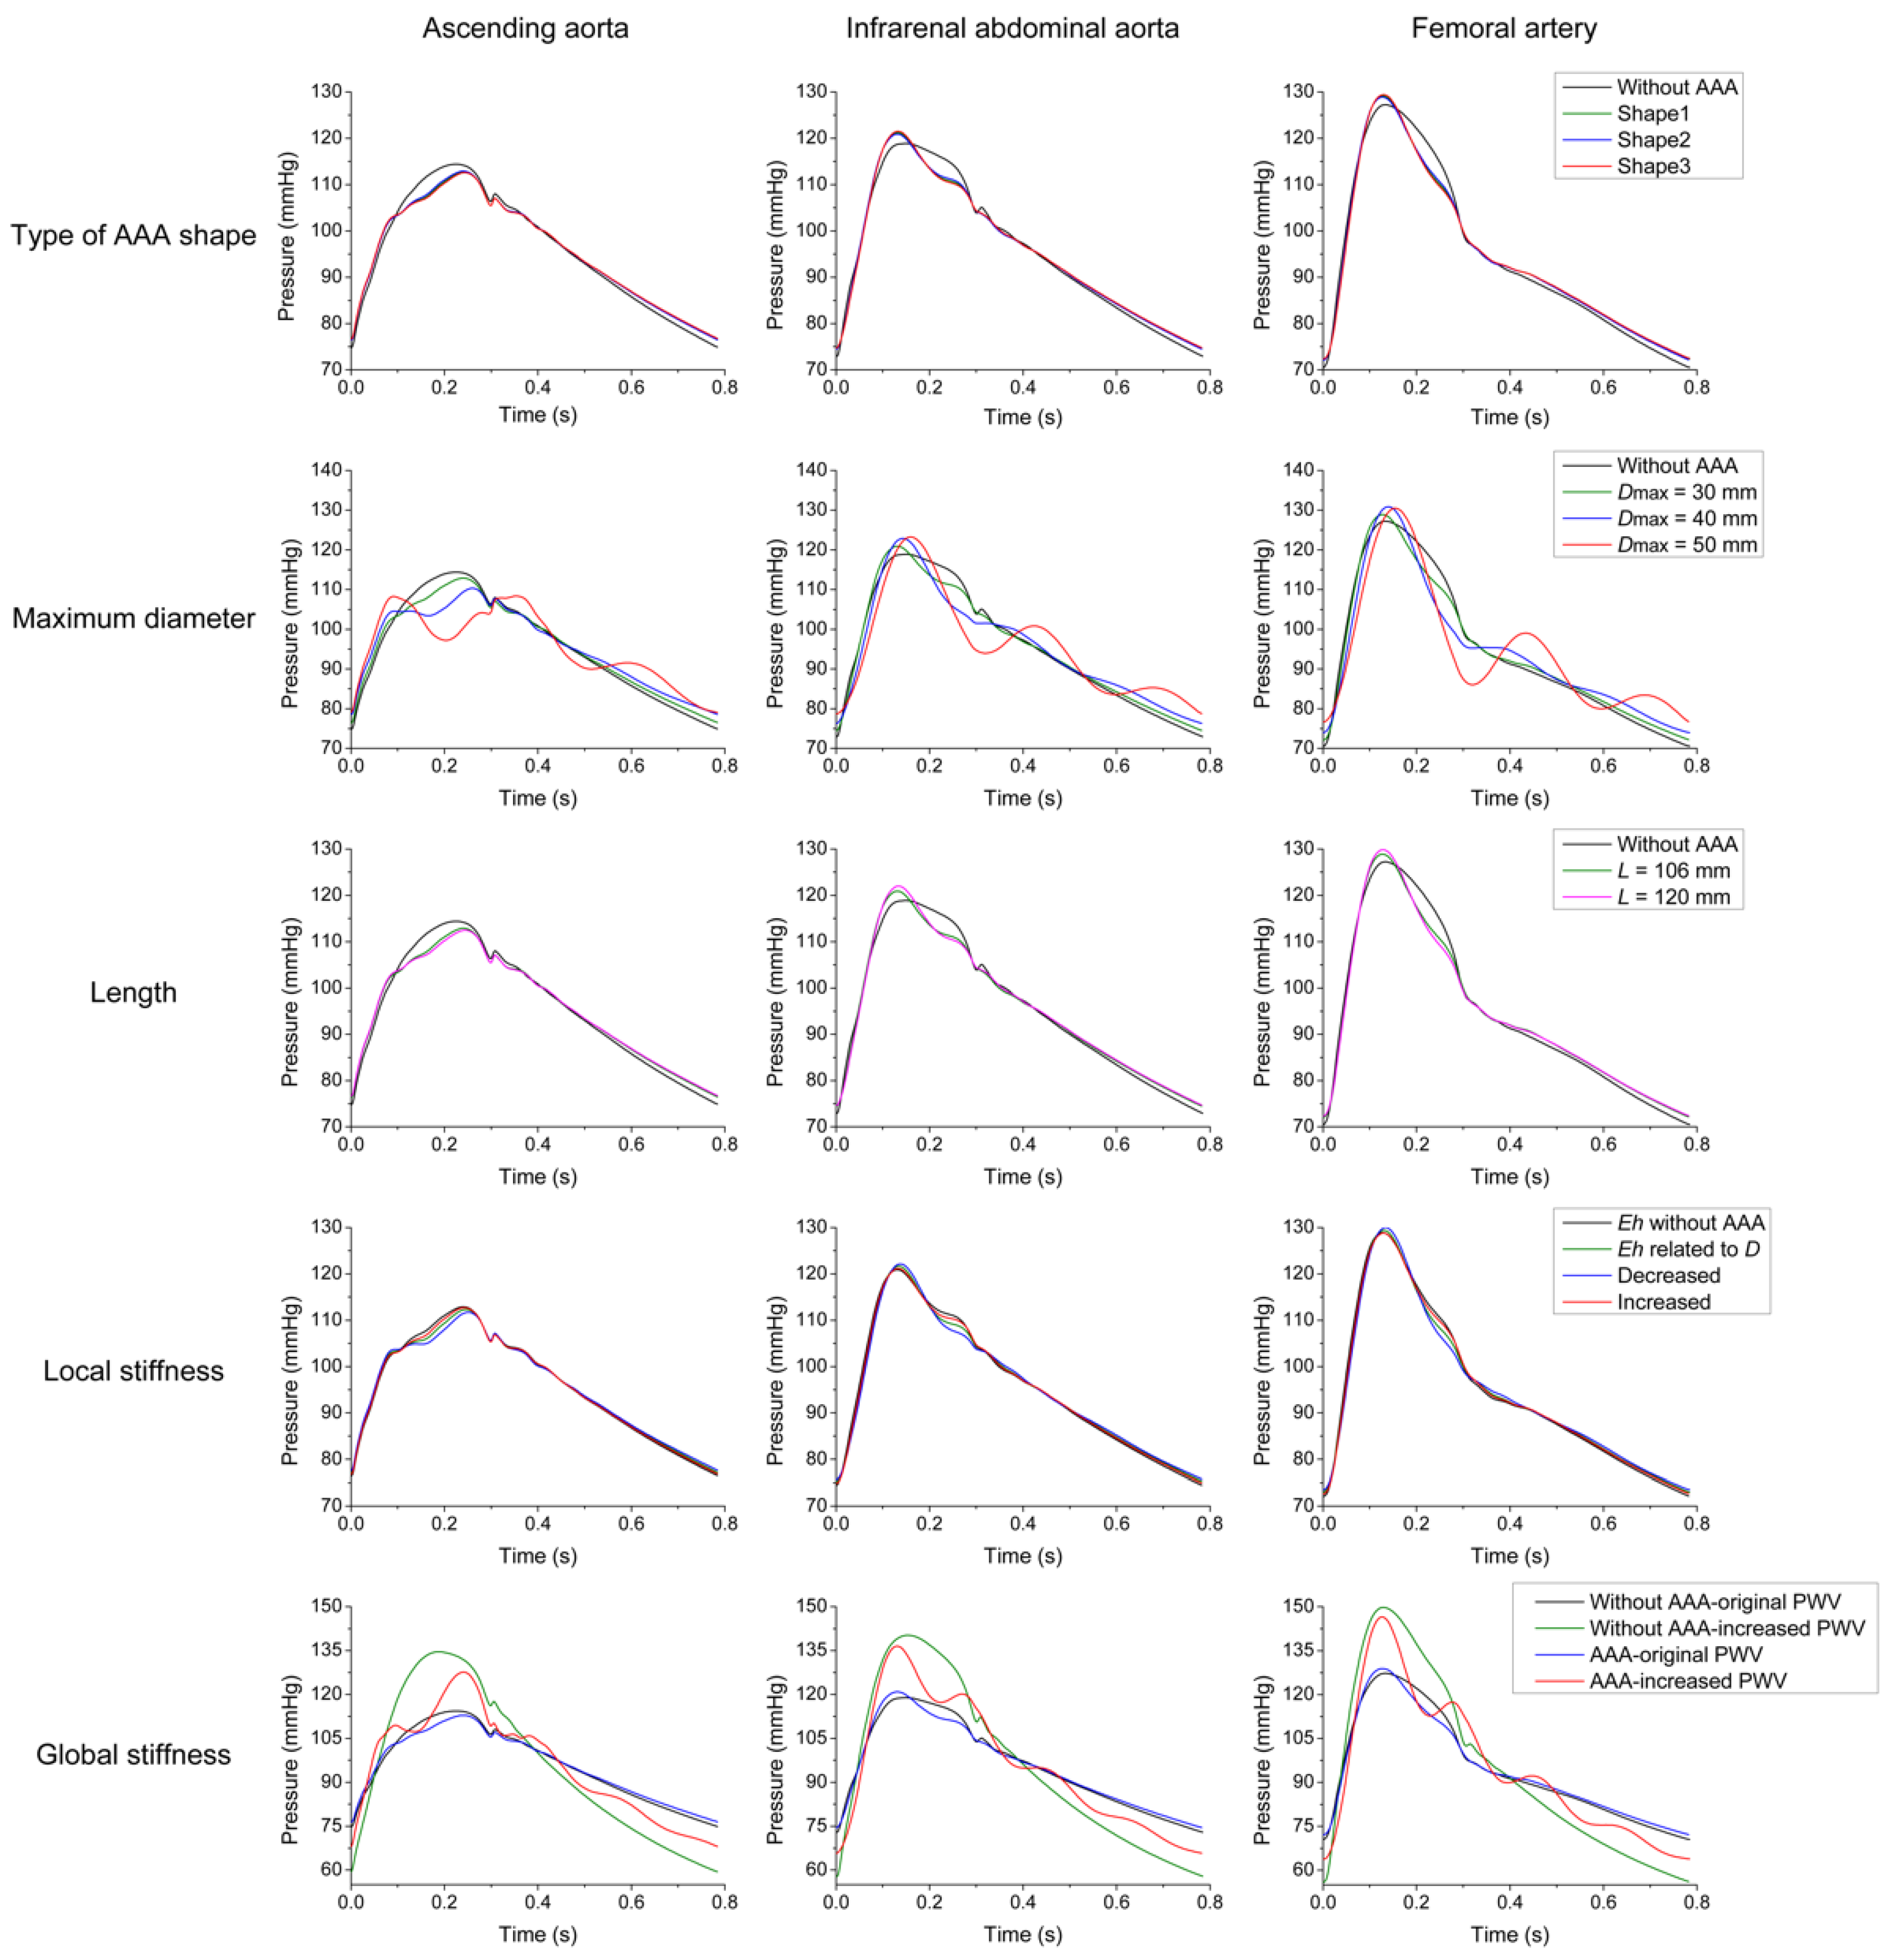
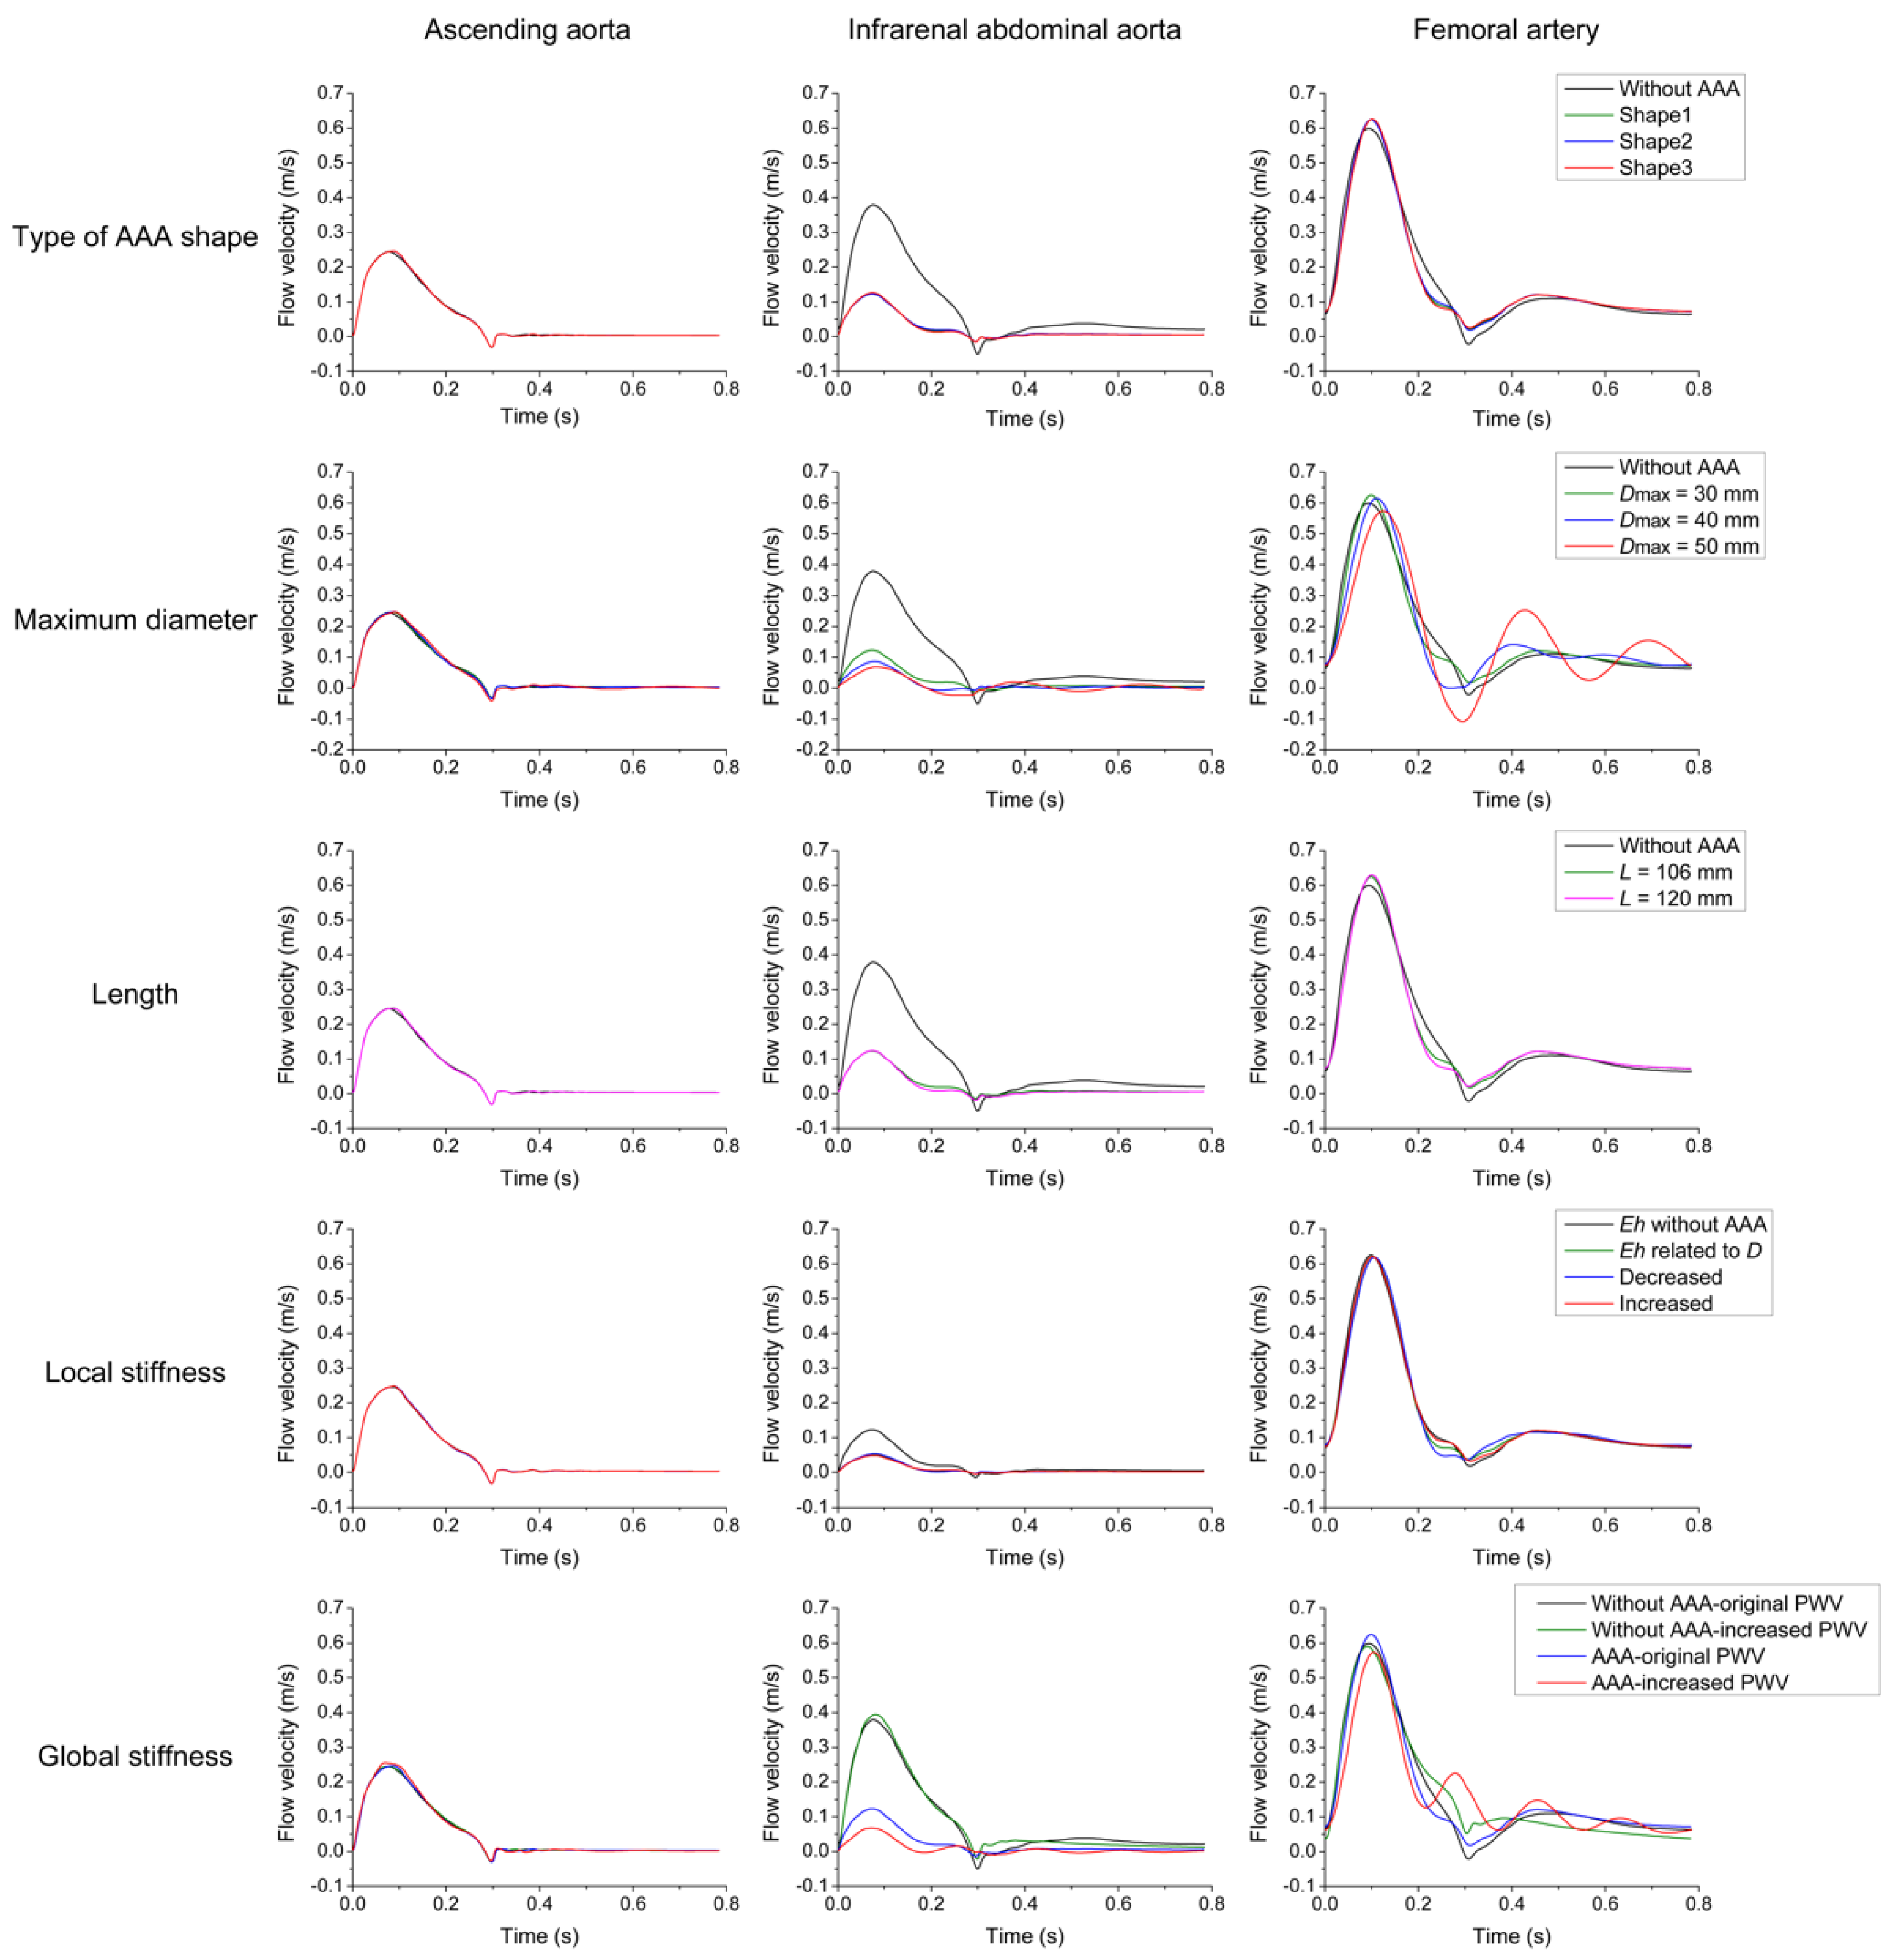
3.1. Parameter Sensitivity Analysis

Figure 4 shows the simulated pressure PWs in the infrarenal abdominal aorta, and an upstream (ascending aorta) and downstream (femoral artery) vessel with individual variations in the AAA-related parameters described in Section 2.2. The maximum AAA diameter was the dominant morphological feature affecting the PW shape in these three arteries, introducing oscillations to the baseline PW with their amplitudes increasing with the diameter size. In contrast, the type of AAA shape and AAA length only had a small influence on the simulated pulse waveforms (see the first three rows of Figure 4). Arterial stiffness also influenced pulse waveforms (see the last two rows of Figure 4). Although the AAA local stiffness only had a moderate influence, the global stiffness of the larger systemic arteries considerably affected PW morphology. The pulse pressure increased with the stiffening of the vascular wall in all one-dimensional model arteries (global stiffening) under both normal and AAA conditions (see the last row of Figure 4). Under AAA conditions, the increased pulse pressure combined with the oscillations introduced by the localized change in diameter in the infrarenal abdominal aorta.
The simulated flow velocity PWs at the same three arterial sites were also mainly affected by changes in maximum AAA diameter and overall stiffness (see Figure 5). However, only the infrarenal abdominal aorta and femoral artery were affected by these changes, since the velocity PW in the ascending aorta was determined primarily by the prescribed inflow waveform at the aortic root and the ascending aorta diameter, and neither was varied to simulate arterial haemodynamics with the presence of an AAA. Furthermore, the amplitude of the velocity PW in the infrarenal abdominal aorta was reduced by more than 50% for all AAA-related parameters, since the AAA increased the luminal cross-sectional area in that vessel without changing the flow rate.

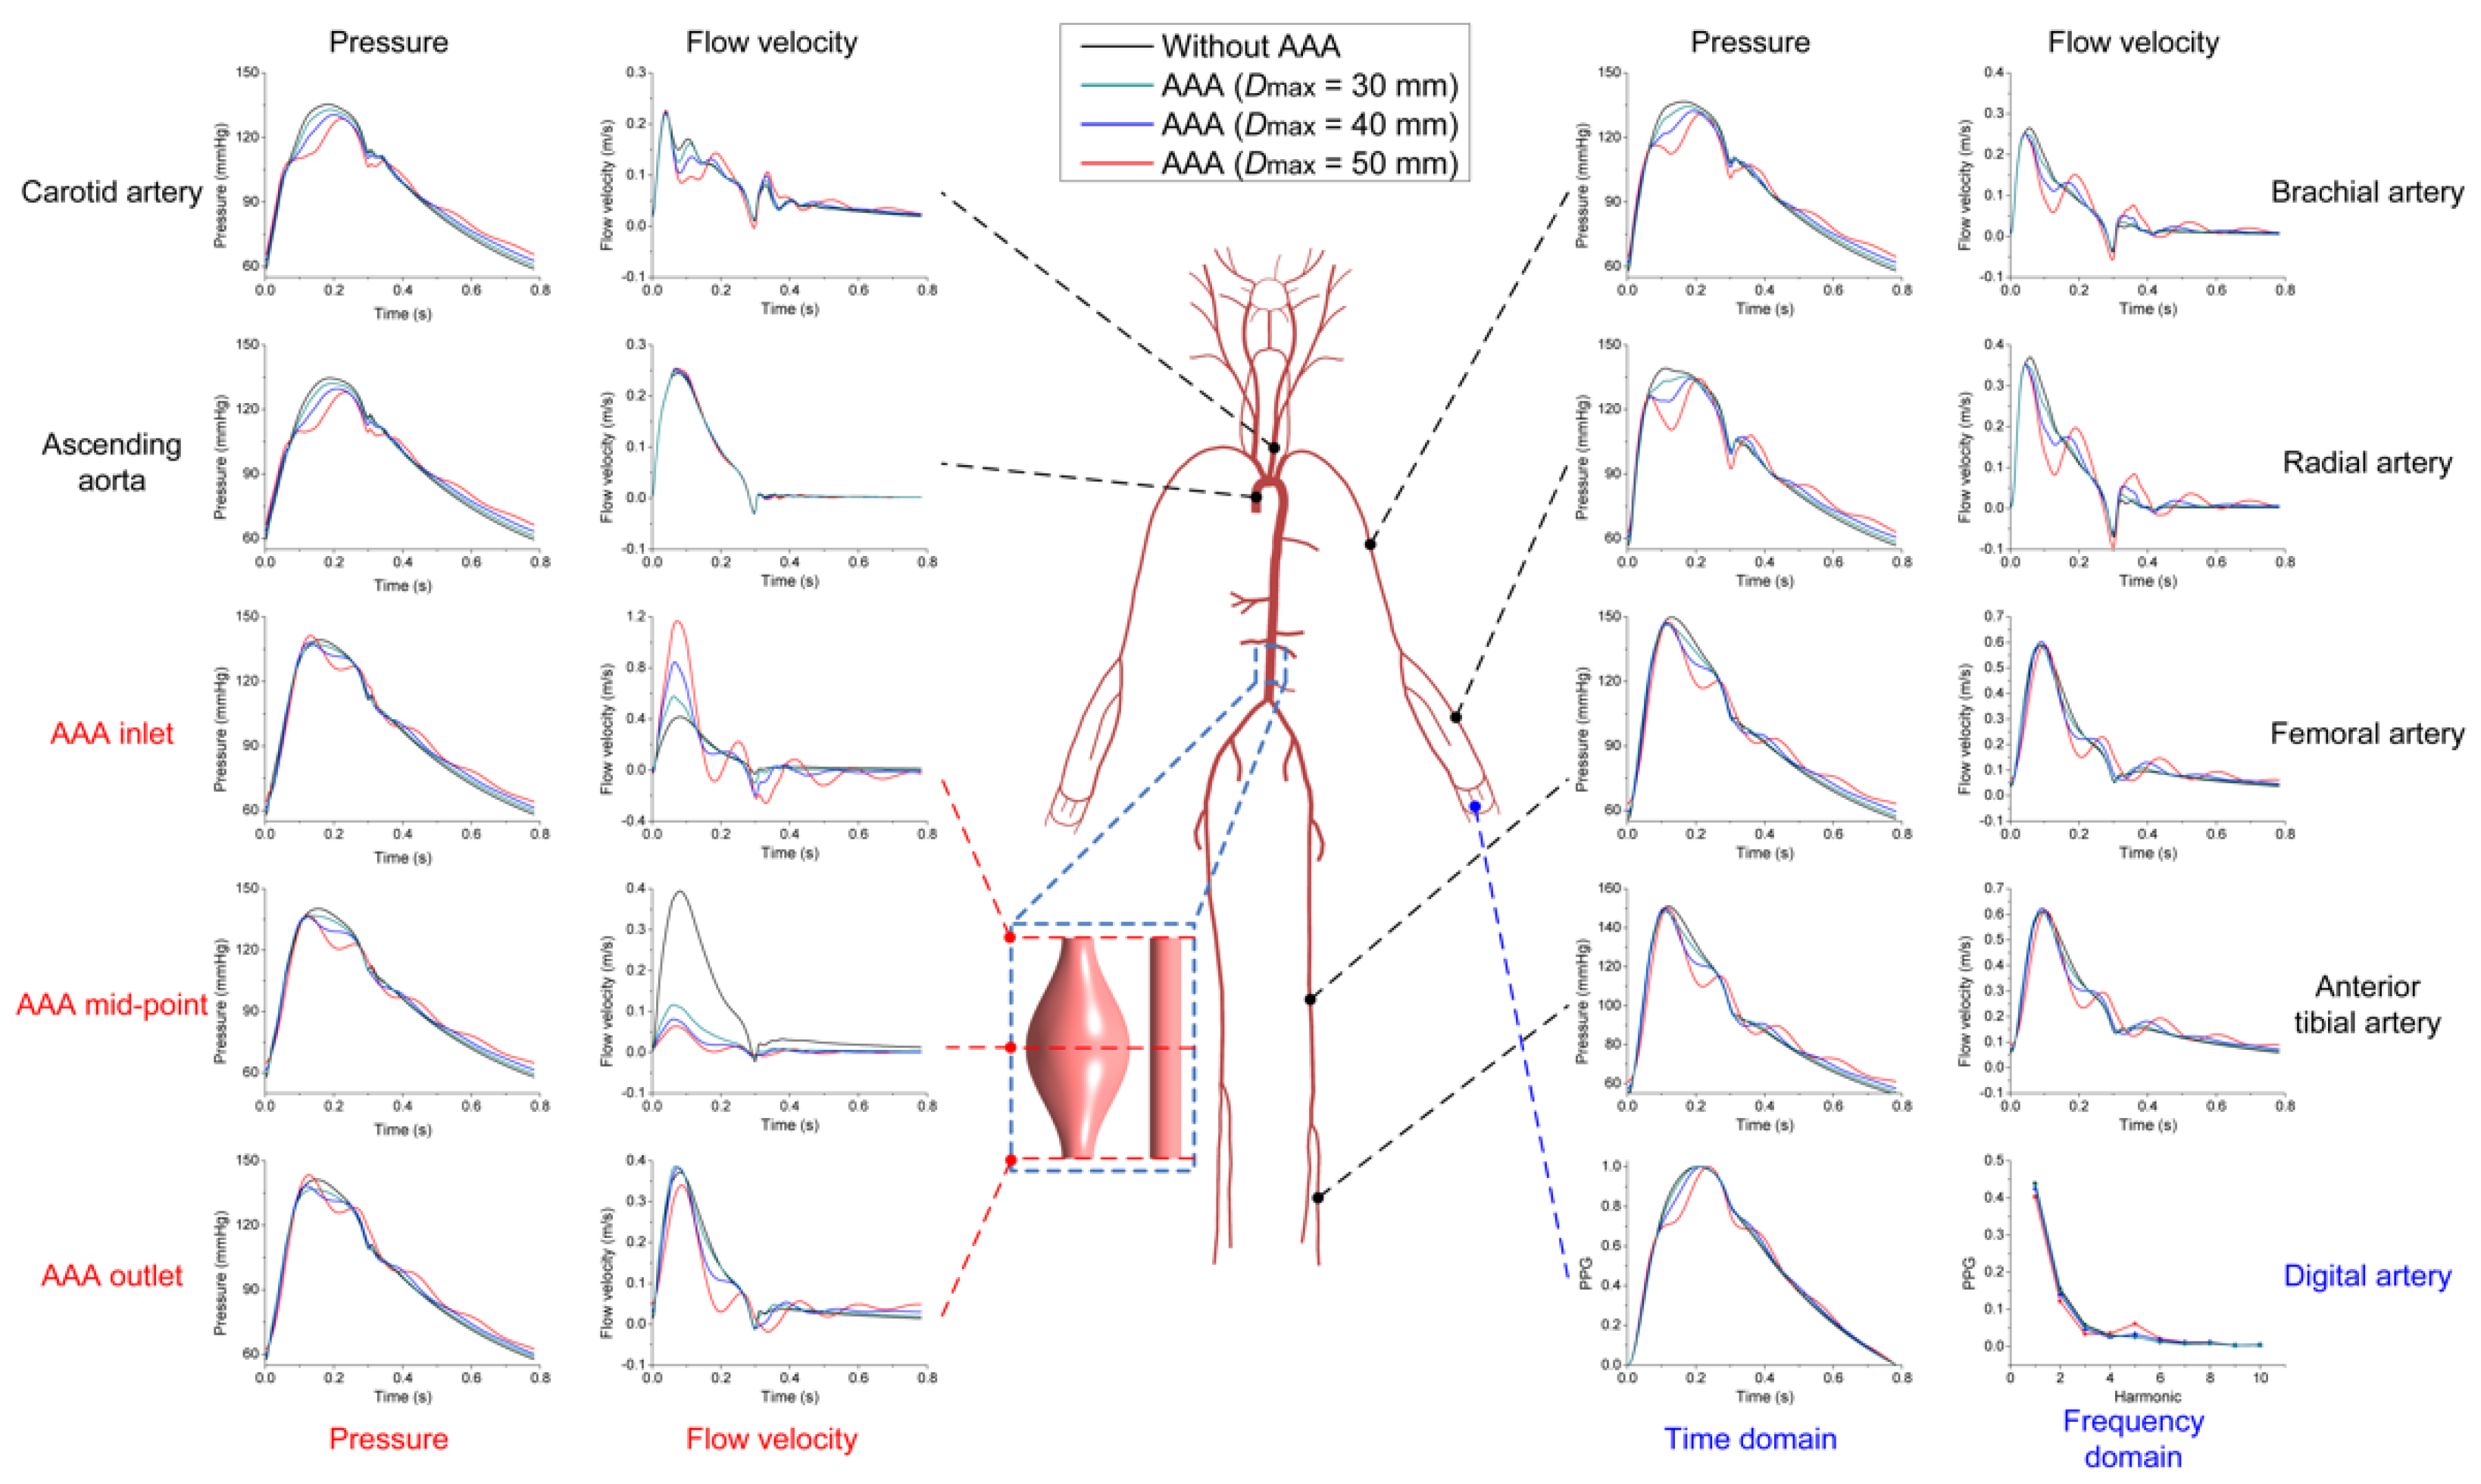
3.2. Effects of AAA on Pulse Waveforms and Comparison with the Literature

Figure 6 shows pressure, flow velocity and PPG PWs for the baseline 65-year-old subjects in the IGS and AAA subsets at various measurement sites. The presence of an AAA introduced oscillations to the PWs in the infrarenal abdominal aorta (where the AAA is located), as well as in other upstream and downstream arteries. The amplitudes of these oscillations increased with increasing maximum AAA diameter. Further comparison of the PPG PWs in the digital artery in the frequency domain revealed increasing discrepancies between the magnitudes of the 5th and the 6th harmonics with the increasing maximum AAA diameter. These findings suggest that PWs measured in peripheral sites, such as the digital artery in the finger, could be used to detect the presence of an AAA in clinical practice.
According to in vivo measurements reported by previous studies, the flow velocity PW in a normal infrarenal abdominal aorta has a triphasic waveform due to the highly resistive blood flow, while the presence of an AAA leads to a much slower and less resistive waveform [8]. These results are qualitatively comparable with the simulated velocity PWs in the middle of the infrarenal abdominal aorta shown in Figure 6. Moreover, in vitro measurements in a hydraulic bench model showed similar trends to the simulated results of the present study, such as the oscillations in the pressure PW in the ascending aorta in the presence of an AAA, and the increased magnitude and oscillations in the velocity PW at the inlet of the AAA [36].

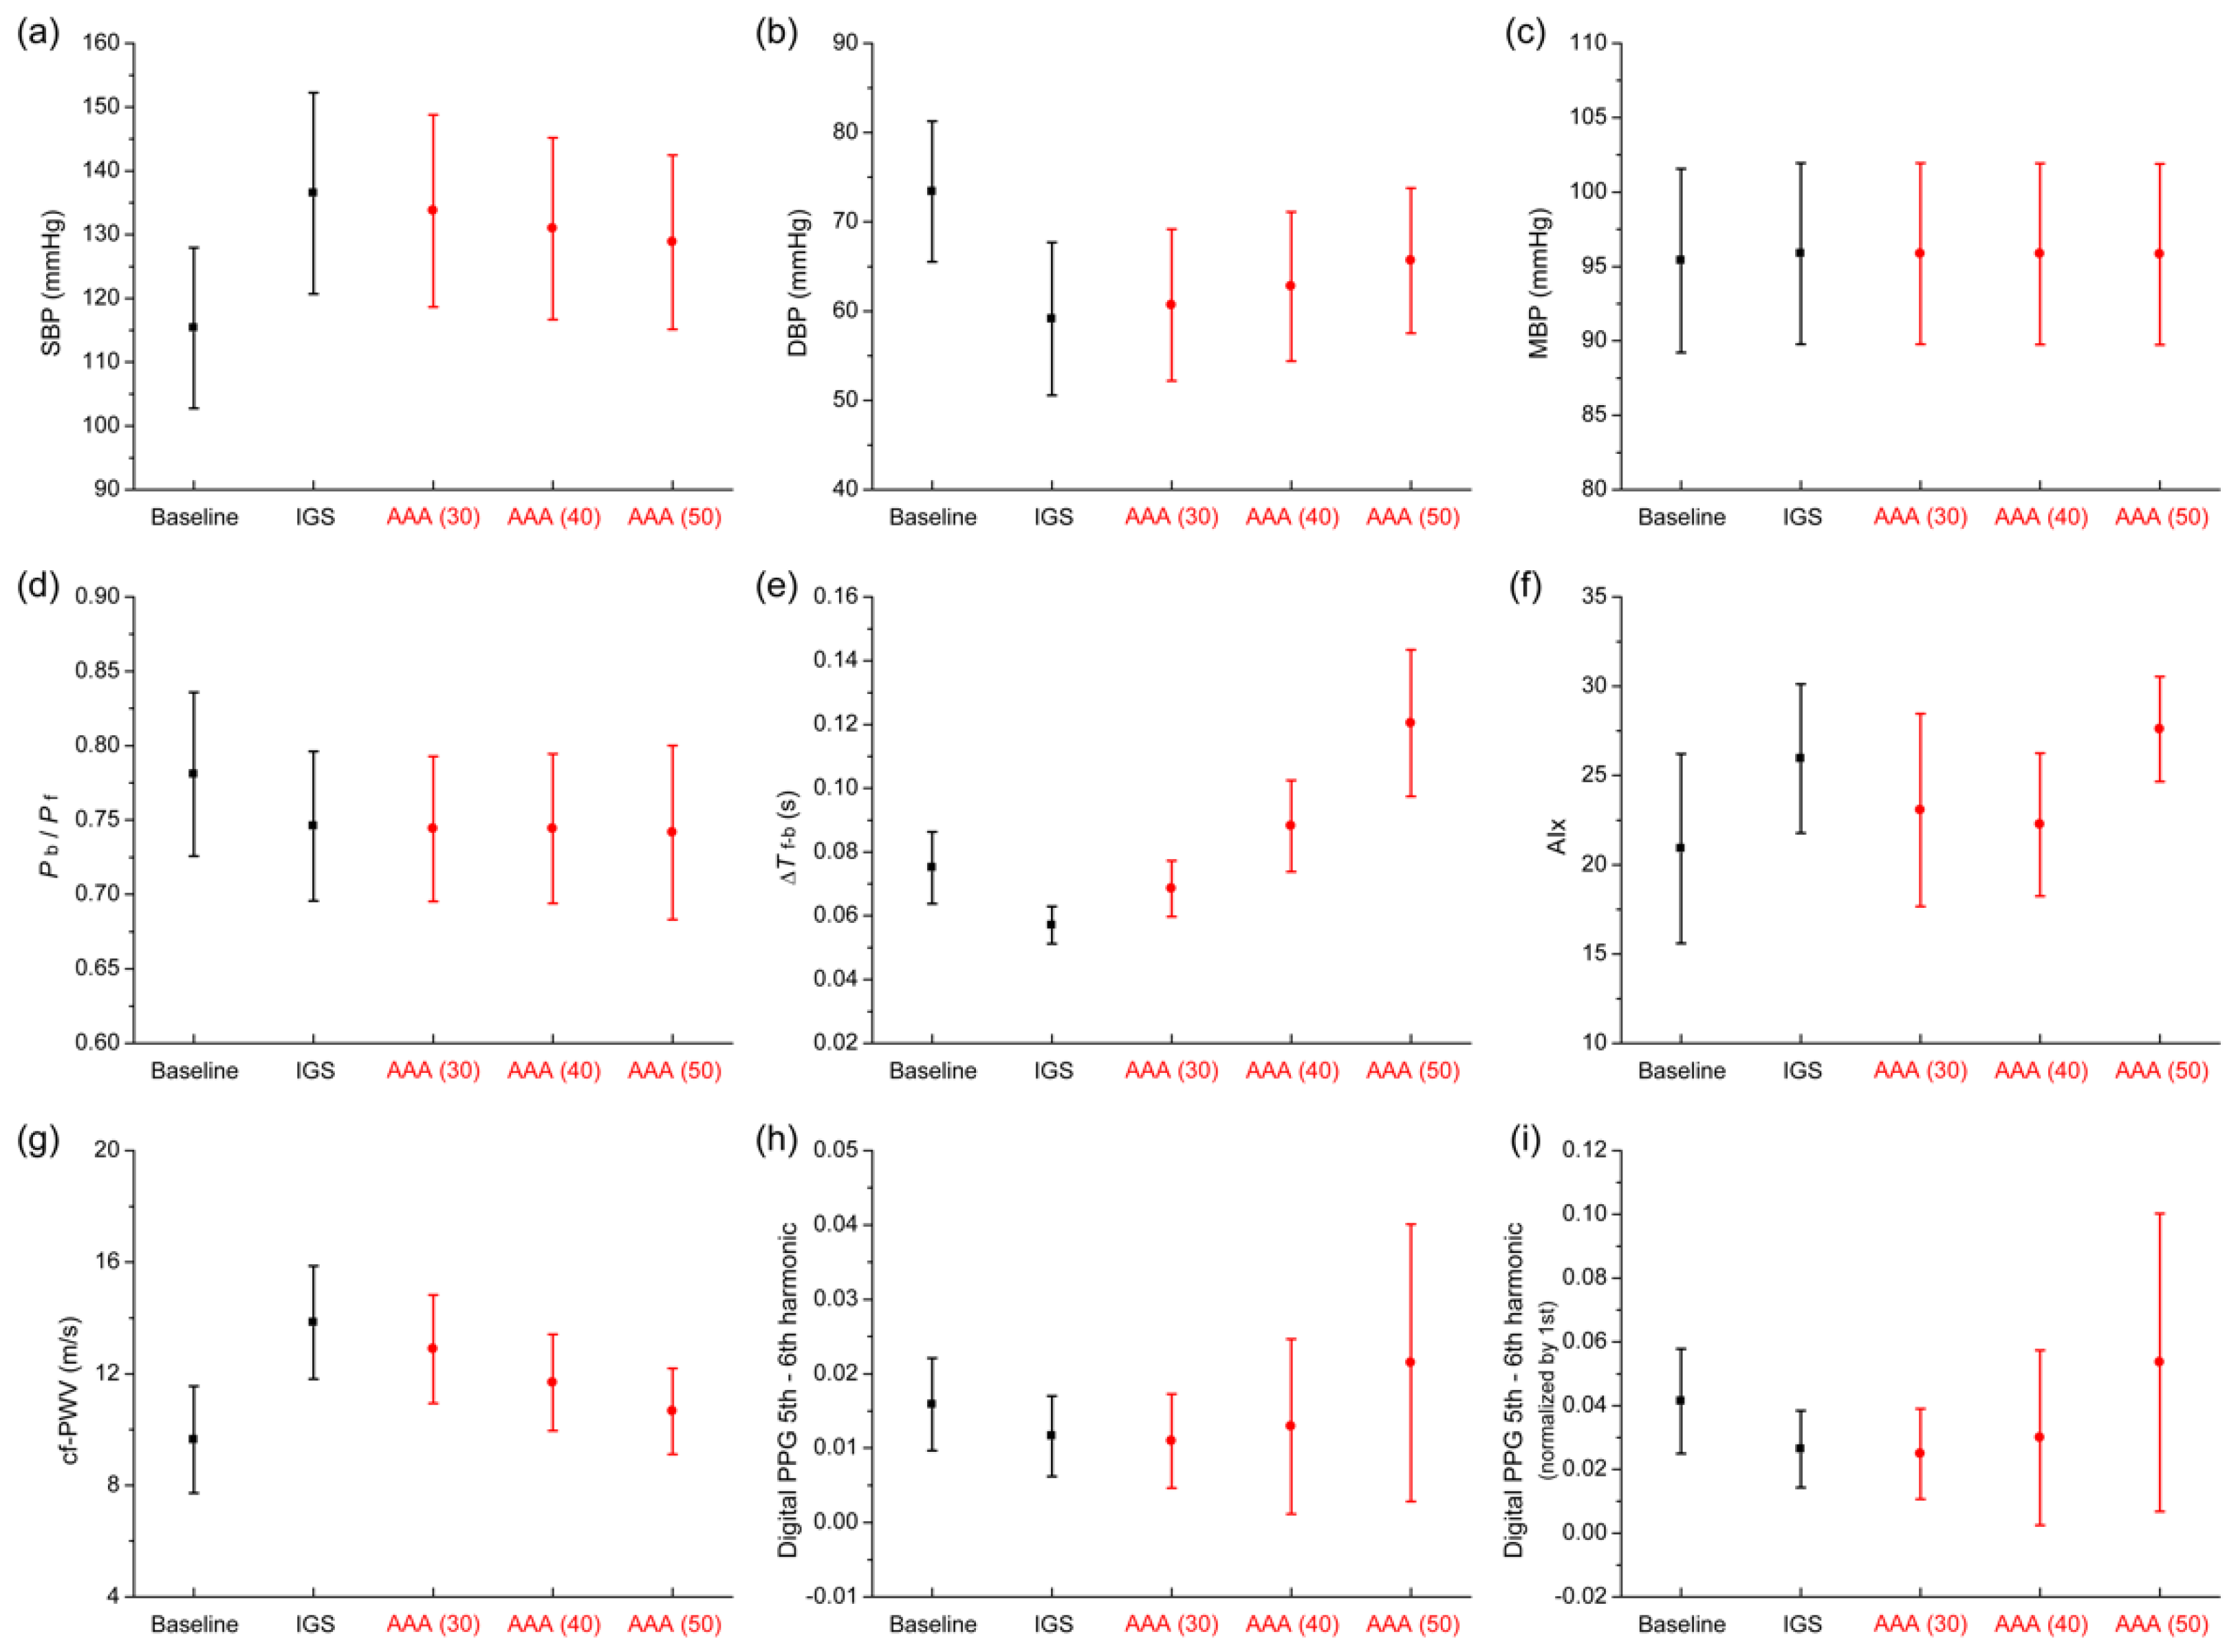
3.3. Comparison of Pulse Wave Indexes Extracted from the Pulse Wave Database

Figure 7 compares PW indexes obtained from pressure measurements in the ascending aorta (except for cf-PWV and digital PPG indexes) under normal conditions (baseline and IGS subsets) and with an AAA (AAA subset). These indexes were selected because they have been shown to differ in subjects with and without AAA in clinical studies [43,44,45]. The mean blood pressure (MBP) in the ascending aorta was similar between the two conditions, but the systolic blood pressure (SBP) increased in the IGS and AAA subsets and the diastolic blood pressure (DBP) decreased due to arterial wall stiffening increasing pulse pressure (Figure 7a–c), as well as carotid-femoral pulse wave velocity (Figure 7g). Moreover, although the wave reflection magnitude (Pb/Pf) was similar between the IGS and AAA subsets, the wave reflection time (ΔTf-b) increased significantly in the AAA condition (Figure 7d,e). The AIx did not show a clear trend, though it was considerably higher in the AAA subset with the largest AAA diameters than in the baseline subset (Figure 7f).
Indexes calculated from the peripheral PW were also considered in this study. The differences between the magnitudes of the 5th and the 6th harmonics of the PPG PWs in the digital artery, which showed a significant increase with the presence of an AAA in the baseline 65-year-old subject (see Figure 6, last plot), were compared among different subsets. As shown in Figure 7h,i, the mean value of the differences in magnitude were similar among different subsets, but the standard deviations of the AAA subset were relatively larger, indicating a wide range of values in the AAA subset. This result suggests that the difference between the magnitudes of the 5th and the 6th harmonics of the digital PPG PW (as well as the PW itself) was strongly influenced by various cardiovascular parameters in addition to the AAA size. Therefore, the detection of an AAA by individual analysis of PPG PW indexes is a challenging task.

3.4. AAA Early Detection Using Machine Learning

Figure 8 shows the confusion matrices and receiver operator characteristic (ROC) curves of the AAA prediction using both the original testing set (top) and the modified testing set with randomly varied PPG PWs (bottom). The trained machine learning model showed near to perfect performance when using the original set. The area under the curve (AUC) was approximately equal to 1, and almost all subjects were classified correctly (see top panels in Figure 8). When the modified testing set was employed (Figure 8, bottom), the resulting AUC could reach 0.928, suggesting that the trained machine learning model was competent in classifying normal and AAA conditions using digital PPG PWs that had less resemblance to the PWs of the training set.
Further analysis of the type of subjects in each condition of the confusion matrix revealed that misdiagnosis (i.e., false positive) usually occurred in older subjects (age 75: 89%, when using the original testing set; 53%, when using the modified testing set), while younger subjects with relatively smaller AAA were more likely to suffer from missed diagnosis (i.e., false negative) (see central column in Figure 8). Nonetheless, the ratio of misdiagnosis and missed diagnosis were overall low in the predicted results using both the original and modified testing sets (misdiagnosis: 9/853 (original), 117/853 (modified); missed diagnosis: 13/1334 (original), 176/1334 (modified)). These findings suggest that the machine learning model trained with a database of in silico PWs could be used for the early detection of AAAs in real subjects.

4. Discussion

We have provided a proof of concept for the feasibility of early detection of AAAs by machine learning-based pulse wave (PW) analysis. Given the high mortality of AAA rupture, early detection of AAAs is crucial for an effective treatment to reduce the risk of rupture. AAAs are often detected as incidental findings of medical imaging assessments which are costly and can only be performed at specialised centres. Analysis of PPG PWs, on the other hand, offers the possibility to screen the wider population, since these signals can be acquired by a wide range of ubiquitous devices such as smartphones, tablets, and fitness devices. Using a newly created database of in silico PWs in subjects with and without AAAs, we have demonstrated that AAA detection using individual PW indexes is a challenging task, but machine learning-based PW analysis is a more promising approach. By using a recurrent neural network, we have obtained a sensitivity of 86.8% and a specificity of 86.3% in AAA detection when tested in a modified dataset representative of a sample of subjects with and without AAAs with random noise added to their PPG PWs.
Our results also suggest that PW indexes may not be sufficient to detect the presence of an AAA. However, we have not conducted a comprehensive study involving all available PW indexes and the different methods for calculating them. For example, the AIx was only calculated using wave separation analysis from pressure and flow waveforms in the ascending aorta, but the calculation using the second or fourth derivative of the pressure waveform may be more convenient and improve the results of AAA detection [54]. In addition, the combination of multiple PW indexes may improve the ability to detect the presence of an AAA, which needs further research.
The database of in silico PWs was created using a physics-based computational blood flow model, which allowed us to study the interpretability of the machine learning results. The simulated AAAs in the virtual subjects of the database covered a range of AAA—from small to moderate—which enabled evaluation of the ability of the machine learning model to predict the presence of an AAA in its early stage of development. The size of an AAA is usually quantified by the maximum diameter which, according to the results of our parameter sensitivity analysis, is the major morphological factor influencing PWs. This finding is consistent with the fact that many computational model-based studies simulating PWs in the presence of AAAs have varied the AAA maximum diameter [10,33,36]. In addition, the virtual subjects in our new database had their global stiffness increased to make the simulated PWs more realistic. Many clinical studies have observed an increase in the overall stiffness of patients with an AAA [43,44,45], although this has not been considered in previous computational model-based studies investigating the influence of AAAs on PW propagation [10,33,34,35,36]. Our parameter sensitivity analysis has suggested that the global stiffness of large systemic arteries has a considerable effect on the discrepancies of the PWs under normal and AAA conditions, highlighting the importance of simulating the effect of increased global stiffness with AAAs. Moreover, the false positive and false negative results of the machine learning prediction were closely related to the age of the subject and AAA size, suggesting that these two factors should be considered to optimise the predictive power of machine learning algorithms. Lastly, although the PPG PW was used in the training and testing of the machine learning architecture used in this study, PWs measured along the arteries in the arm were similarly affected by the presence of an AAA. As a result, it is expected that any of these PWs could be used for AAA detection by machine learning-based PW analysis, although the PPG PW at the digital artery or radial artery may be easier to acquire in real subjects.
The findings of this study must be considered in the context of certain limitations. Firstly, the computational model used in the present study is a one-dimensional model rather than a three-dimensional model that should be more accurate in simulating blood flow in the presence of an AAA. Nonetheless, a recent study has demonstrated that one-dimensional modelling of the large arteries is accurate compared to three-dimensional modelling to simulate PW propagation across AAA [60]. Secondly, in patients with AAAs, calcification and intraluminal thrombus usually occur within the AAA, which change the stiffness (both the elastic modulus and wall thickness) of the AAA and significantly influence the distribution of AAA wall stresses [61,62,63]. However, one-dimensional modelling is not able to directly simulate calcification and intraluminal thrombus. In this study, the effects of calcification and intraluminal thrombus were described by increasing the local stiffness of AAAs, which was also the approach adopted by previous studies using one-dimensional modelling [10,35,36]. Lastly, although the variations of many influential cardiovascular parameters were considered to generate the present in silico PW database, the conditions of real subjects were not fully described since they are more complicated and not so systematic. The testing set was derived from the in silico PW database and in vivo measurements were not used, making our study a proof-of-concept. Further research is warranted to test the machine learning model trained in this study using PPG PWs measured in real subjects.
A well-trained and tested machine learning model would be a very useful mathematical tool for the early detection of AAAs by pulse wave analysis. The proliferation of commercial wearable devices that can accurately measure PPG signals on the wrist or finger offers an opportunity to screen the wider population for AAAs in daily life. A diagnosis of AAA should ultimately be confirmed by a medical imaging examination. However, AAA detection by PPG PW analysis may help improve AAA diagnosis by identifying those subjects with a potential AAA, thus paving the way for more effective treatment that reduces the current mortality rates.

Author Contributions

Conceptualization, T.W. and J.A.; methodology, T.W., W.J. and J.A.; data analysis, T.W., F.L. and J.A.; writing—original draft preparation, T.W.; writing—review and editing, J.A.; project administration, J.A. All authors have read and agreed to the published version of the manuscript.

Funding

This research was funded by the Wellcome EPSRC Centre for Medical Engineering at King’s College London [WT 203148/Z/16/Z], Department of Health through the National Institute for Health Research (NIHR) Cardiovascular MedTech Co-operative at Guy’s and St Thomas’ NHS Foundation Trust (GSTT), and the Ministry of Science and Higher Education of the Russian Federation within the framework of state support for the creation and development of World-Class Research Centers Digital biodesign and personalized healthcare [075–15–2020–926]. T.W. was funded by the China Scholarship Council [201906230032]. W.J. was funded by a King’s College London PGR International Scholarship. F.L. was funded by the National Natural Science Foundation of China [11972231]. J.A. was funded by the British Heart Foundation (BHF) [PG/15/104/31913].

Institutional Review Board Statement

Not applicable.

Informed Consent Statement

Not applicable.

Data Availability Statement

The data presented in this study are available in haemod.uk/aaa.

Conflicts of Interest

The authors declare no conflict of interest. The funders had no role in the design of the study; in the collection, analyses, or interpretation of data; in the writing of the manuscript, or in the decision to publish the results.

References

  1. Sakalihasan, N.; Limet, R.; Defawe, O.D. Abdominal aortic aneurysm. Lancet 2005, 365, 1577–1589. [Google Scholar] [CrossRef]
  2. Golledge, J.; Muller, J.; Daugherty, A.; Norman, P. Abdominal aortic aneurysm: Pathogenesis and implications for management. Arterioscler. Thromb. Vasc. Biol. 2006, 26, 2605–2613. [Google Scholar] [CrossRef] [Green Version]
  3. Scott, R.A.P.; Ashton, H.A.; Kay, D.N. Abdominal aortic aneurysm in 4237 screened patients: Prevalence, development and management over 6 years. Br. J. Surg. 1991, 78, 1122–1125. [Google Scholar] [CrossRef]
  4. Kent, K.C. Abdominal aortic aneurysms. N. Engl. J. Med. 2014, 371, 2101–2108. [Google Scholar] [CrossRef] [PubMed]
  5. Upchurch, G.R.; Schaub, T.A. Abdominal aortic aneurysm. Am. Family Physician 2006, 73, 1198–1204. [Google Scholar]
  6. Aggarwal, S.; Qamar, A.; Sharma, V.; Sharma, A. Abdominal aortic aneurysm: A comprehensive review. Exp. Clin. Cardiol. 2011, 16, 11–15. [Google Scholar]
  7. Wells, C.E.; Pugh, N.D.; Woodcock, J.P. Abdominal aortic aneurysm detection by common femoral artery Doppler ultrasound waveform analysis. J. Med. Eng. Technol. 2011, 35, 34–39. [Google Scholar] [CrossRef] [PubMed] [Green Version]
  8. Wood, M.M.; Romine, L.E.; Lee, Y.K.; Richman, K.M.; O’Boyle, M.K.; Paz, D.A.; Chu, P.K.; Pretorius, D.H. Spectral doppler signature waveforms in ultrasonography: A review of normal and abnormal waveforms. Ultrasound Q. 2010, 26, 83–99. [Google Scholar] [CrossRef]
  9. Elgendi, M. PPG Signal Analysis: An Introduction Using MATLAB®; CRC Press: Boca Raton, FL, USA, 2020. [Google Scholar]
  10. Chakshu, N.K.; Sazonov, I.; Nithiarasu, P. Towards Enabling a Cardiovascular Digital Twin for Human Systemic Circulation Using Inverse Analysis. Biomech. Model. Mechanobiol. 2020. [Google Scholar] [CrossRef] [PubMed]
  11. Tavallali, P.; Razavi, M.; Pahlevan, N.M. Artifcial intelligence estimation of carotid-femoral pulse wave velocity using carotid waveform. Sci. Rep. 2018, 8, 1014. [Google Scholar] [CrossRef] [PubMed] [Green Version]
  12. Biswas, D.; Everson, L.; Liu, M.; Panwar, M.; Verhoef, B.-E.; Patki, S.; Kim, C.H.; Acharyya, A.; Van Hoof, C.; Konijnenburg, M.; et al. CorNET: Deep learning framework for PPG-based heart rate estimation and biometric identification in ambulant environment. IEEE Trans. Biomed. Eng. 2019, 13, 282–291. [Google Scholar] [CrossRef] [PubMed]
  13. Jones, G.; Parr, J.; Nithiarasu, P.; Pant, S. Machine learning for detection of stenoses and aneurysms: Application in a physiologically realistic virtual patient database. arXiv 2021, arXiv:2103.00599. [Google Scholar]
  14. Charlton, P.H.; Harana, J.M.; Vennin, S.; Li, Y.; Chowienczyk, P.; Alastruey, J. Modelling arterial pulse waves in healthy ageing: A database for in silico evaluation of haemodynamics and pulse wave indexes. Am. J. Physiol. Heart Circulatory Physiol. 2019, 317, H1062–H1085. [Google Scholar] [CrossRef] [PubMed]
  15. Jones, G.; Parr, J.; Nithiarasu, P.; Pant, S. A physiologically realistic virtual patient database for the study of arterial haemodynamics. arXiv 2021, arXiv:2102.10655. [Google Scholar]
  16. Wang, T.; Liang, F.; Li, L.; Zhang, W.; Wang, G.; Wang, J.; Zhang, C.; Qi, X. A computational model-based study on the exchangeability of hepatic venous pressure gradients measured in multiple hepatic vein. Med. Eng. Phys. 2020, 84, 28–35. [Google Scholar] [CrossRef] [PubMed]
  17. Wang, T.; Liang, F.; Zhou, Z.; Qi, X. Global sensitivity analysis of hepatic venous pressure gradient (HVPG) measurement with a stochastic computational model of the hepatic circulation. Comput. Biol. Med. 2018, 97, 124–136. [Google Scholar] [CrossRef] [PubMed]
  18. Vilalta, G.; Nieto, F.; Vaquero, C.; Vilalta, J.A. Quantitative indicator of abdominal aortic aneurysm rupture risk based on its geometric parameters. World Acad. Sci. Eng. Technol. 2010, 70, 181–185. [Google Scholar]
  19. Giannoglou, G.; Giannakoulas, G.; Soulis, J.; Chatzizisis, Y.; Perdikides, T.; Melas, N.; Parcharidis, G.; Louridas, G. Predicting the risk of rupture of abdominal aortic aneurysms by utilizing various geometrical parameters revisiting the diameter criterion. Angiology 2006, 57, 487–494. [Google Scholar] [CrossRef]
  20. Li, Z.; Kleinstreuer, C. A new wall stress equation for aneurysm-rupture prediction. Ann. Biomed. Eng. 2005, 33, 209–213. [Google Scholar] [CrossRef]
  21. Venkatasubramaniam, A.K.; Fagan, M.J.; Mehta, T.; Mylankal, K.J.; Ray, B.; Kuhan, G.; Chetter, I.C.; McCollum, P.T. A comparative study of aortic wall stress using finite element analysis for ruptured and non-ruptured abdominal aortic aneurysms. Eur. J. Vasc. Endovasc. Surg. 2004, 28, 168–176. [Google Scholar]
  22. Lindquist Liljeqvist, M.; Hultgren, R.; Siika, A.; Gasser, T.C.; Roy, J. Gender, smoking, body size, and aneurysm geometry influence the biomechanical rupture risk of abdominal aortic aneurysms as estimated by finite element analysis. J. Vasc. Surg. 2017, 65, 1014–1022. [Google Scholar] [CrossRef] [PubMed] [Green Version]
  23. Volokh, K.Y.; Vorp, D.A. A model of growth and rupture of abdominal aortic aneurysm. J. Biomech. 2008, 41, 1015–1021. [Google Scholar] [CrossRef] [PubMed]
  24. Grytsan, A.; Watton, P.N.; Holzapfel, G.A. A thick-walled fluid–solid-growth model of abdominal aortic aneurysm evolution: Application to a patient-specific geometry. J. Biomech. Eng. 2015, 137, 031008. [Google Scholar] [CrossRef] [PubMed]
  25. Humphrey, J.D.; Holzapfel, G.A. Mechanics, mechanobiology, and modeling of human abdominal aorta and aneurysms. J. Biomech. 2012, 45, 805–814. [Google Scholar] [CrossRef] [Green Version]
  26. Figueroa, C.A.; Taylor, C.A.; Yeh, V.; Chiou, A.J.; Zarins, C.K. Effect of curvature on displacement forces acting on aortic endografts: A 3-dimensional computational analysis. J. Endovasc. Ther. 2009, 16, 284–294. [Google Scholar] [CrossRef] [Green Version]
  27. Gindre, J.; Bel-Brunon, A.; Kaladji, A.; Duménil, A.; Rochette, M.; Lucas, A.; Haigron, P.; Combescure, A. Finite element simulation of the insertion of guidewires during an EVAR procedure: Example of a complex patient case, a first steptoward patient-specific parameterized models. Int. J. Numer. Method Biomed. Eng. 2015, 31, e02716. [Google Scholar] [CrossRef]
  28. Casciaro, M.E.; Alfonso, M.A.; Craiem, D.; Alsac, J.M.; El-Batti, S.; Armentano, R.L. Predicting the effect on pulse wave reflection of different endovascular repair techniques in abdominal aortic aneurysm using 1D patient-specific models. Health Technol. 2016, 6, 173–179. [Google Scholar] [CrossRef]
  29. Fraser, K.H.; Meagher, S.; Blake, J.R.; Easson, W.J.; Hoskins, P.R. Characterization of an abdominal aortic velocity waveform in patients with abdominal aortic aneurysm. Ultrasound Med. Biol. 2008, 34, 73–80. [Google Scholar] [CrossRef]
  30. Taylor, C.A.; Cheng, C.P.; Espinosa, L.A.; Tang, B.T.; Parker, D.; Herfkens, R.J. In vivo quantification of blood flow and wall shear stress in the human abdominal aorta during lower limb exercise. Ann. Biomed. Eng. 2002, 30, 402–408. [Google Scholar] [CrossRef]
  31. Les, A.S.; Yeung, J.J.; Schultz, G.M.; Herfkens, R.J.; Dalman, R.L.; Taylor, C.A. Supraceliac and infrarenal aortic flow in patients with abdominal aortic aneurysms: Mean flows, waveforms, and allometric scaling relationships. Cardiovasc. Eng. Technol. 2010, 1, 39–51. [Google Scholar] [CrossRef]
  32. Wang, T.; Alastruey, J.; Liang, F. A computational model-based study on the effect of abdominal aortic aneurysm on pulse wave morphology. Artery Res. 2020, 26, S10–S11. [Google Scholar] [CrossRef]
  33. Sazonov, I.; Khir, A.W.; Hacham, W.S.; Boileau, E.; Carson, J.M.; van Loon, R.; Ferguson, C.; Nithiarasu, P. A novel method for non-invasively detecting the severity and location of aortic aneurysms. Biomech. Model. Mechanobiol. 2017, 16, 1225–1242. [Google Scholar] [CrossRef] [Green Version]
  34. Safaei, S. Simulating Blood Flow in an Anatomical Arterial Network; University of Auckland: Auckland, New Zealand, 2015. [Google Scholar]
  35. Low, K.; van Loon, R.; Sazonov, I.; Bevan, R.L.T.; Nithiarasu, P. An improved baseline model for a human arterial network to study the impact of aneurysms on pressure-flow waveforms. Int. J. Numer. Methods Biomed. Eng. 2012, 28, 1224–1246. [Google Scholar] [CrossRef] [PubMed]
  36. Swillens, A.; Lanoye, L.; De Backer, J.; Stergiopulos, N.; Verdonck, P.R.; Vermassen, F.; Segers, P. Effect of an abdominal aortic aneurysm on wave reflection in the aorta. IEEE Trans. Biomed. Eng. 2008, 55, 1602–1611. [Google Scholar] [CrossRef] [PubMed]
  37. Tong, J.; Cohnert, T.; Holzapfel, G.A. Diameter-related variations of geometrical, mechanical, and mass fraction data in the anterior portion of abdominal aortic aneurysms. Eur. J. Vasc. Endovasc. Surg. 2015, 49, 262–270. [Google Scholar] [CrossRef] [Green Version]
  38. Martufi, G.; Di Martino, E.S.; Amon, C.H.; Muluk, S.C.; Finol, E.A. Three-dimensional geometrical characterization of abdominal aortic aneurysms: Image-based wall thickness distribution. J. Biomech. Eng. 2009, 131, 061015. [Google Scholar] [CrossRef] [PubMed]
  39. Rodríguez, J.F.; Ruiz, C.; Doblaré, M.; Holzapfel, G.A. Mechanical stresses in abdominal aortic aneurysms influence of diameter, asymmetry, and material anisotropy. J. Biomech. Eng. 2008, 130, 021023. [Google Scholar] [CrossRef] [Green Version]
  40. Doyle, B.J.; Morris, L.G.; Callanan, A.; Kelly, P.; Vorp, D.A.; McGloughlin, T.M. 3D reconstruction and manufacture of real abdominal aortic aneurysms: From CT scan to silicone model. J. Biomech. Eng. 2008, 130, 034501. [Google Scholar] [CrossRef] [PubMed]
  41. Shum, J.; Martufi, G.; Di Martino, E.; Washington, C.B.; Grisafi, J.; Muluk, S.C.; Finol, E.A. Quantitative assessment of abdominal aortic aneurysm geometry. Ann. Biomed. Eng. 2011, 39, 277–286. [Google Scholar] [CrossRef] [Green Version]
  42. Kolipaka, A.; Illapani, V.S.P.; Kenyhercz, W.; Dowell, J.D.; Go, M.R.; Starr, J.E.; Vaccaro, P.S.; White, R.D. Quantification of abdominal aortic aneurysm stiffness using magnetic resonance elastography and its comparison to aneurysm diameter. J. Vasc. Surg. 2016, 64, 966–974. [Google Scholar] [CrossRef] [PubMed] [Green Version]
  43. Durmus, I.; Kazaz, Z.; Altun, G.; Cansu, A. Augmentation index and aortic pulse wave velocity in patients with abdominal aortic aneurysms. Int. J. Clin. Exp. Med. 2014, 7, 421–425. [Google Scholar]
  44. Kadoglou, N.P.E.; Papadakis, I.; Moulakakis, K.G.; Ikonomidis, I.; Alepaki, M.; Moustardas, P.; Lampropoulos, S.; Karakitsos, P.; Lekakis, J.; Liapis, C.D. Arterial stiffness and novel biomarkers in patients with abdominal aortic aneurysms. Regul. Pept. 2012, 179, 50–54. [Google Scholar] [CrossRef]
  45. Kadoglou, N.P.E.; Moulakakis, K.G.; Papadakis, I.; Ikonomidis, I.; Alepaki, M.; Lekakis, J.; Liapis, C.D. Changes in aortic pulse wave velocity of patients undergoing endovascular repair of abdominal aortic aneurysms. J. Endovasc. Ther. 2012, 19, 661–666. [Google Scholar] [CrossRef]
  46. Länne, T.; Sonesson, B.; Bergqvist, D.; Bengtsson, H.; Gustafsson, D. Diameter and compliance in the male human abdominal aorta: Influence of age and aortic aneurysm. Eur. J. Vasc. Surg. 1992, 6, 178–184. [Google Scholar] [CrossRef]
  47. Schriefl, A.J.; Zeindlinger, G.; Pierce, D.M.; Regitnig, P.; Holzapfel, G.A. Determination of the layer-specific distributed collagen fibre orientations in human thoracic and abdominal aortas and common iliac arteries. J. R. Soc. Interface 2012, 9, 1275–1286. [Google Scholar] [CrossRef]
  48. Shum, J.; Dimartino, E.S.; Goldhammer, A.; Goldman, D.H.; Acker, L.C.; Patel, G.; Ng, J.H.; Martufi, G.; Finol, E.A. Semiautomatic vessel wall detection and quantification of wall thickness in computed tomography images of human abdominal aortic aneurysms. Med. Phys. 2010, 37, 638–648. [Google Scholar] [CrossRef]
  49. Raghavan, M.L.; Kratzberg, J.; de Tolosa, E.M.C.; Hanaoka, M.M.; Walker, P.; da Silva, E.S. Regional distribution of wall thickness and failure properties of human abdominal aortic aneurysm. J. Biomech. 2006, 39, 3010–3016. [Google Scholar] [CrossRef]
  50. Martufi, G.; Satriano, A.; Moore, R.D.; Vorp, D.A.; Di Martino, E.S. Local quantification of wall thickness and intraluminal thrombus offer insight into the mechanical properties of the aneurysmal aorta. Ann. Biomed. Eng. 2015, 43, 1759–1771. [Google Scholar] [CrossRef] [PubMed]
  51. Di Martino, E.S.; Bohra, A.; Vande Geest, J.P.; Gupta, N.; Makaroun, M.S.; Vorp, D.A. Biomechanical properties of ruptured versus electively repaired abdominal aortic aneurysm wall tissue. J. Vasc. Surg. 2006, 43, 570–576. [Google Scholar] [CrossRef] [PubMed] [Green Version]
  52. Shum, J.; Xu, A.; Chatnuntawech, I.; Finol, E.A. A framework for the automatic generation of surface topologies for abdominal aortic aneurysm models. Ann. Biomed. Eng. 2011, 39, 249–259. [Google Scholar] [CrossRef] [PubMed]
  53. Gaddum, N.R.; Alastruey, J.; Beerbaum, P.; Chowienczyk, P.; Schaeffter, T. A technical assessment of pulse wave velocity algorithms applied to Non-invasive arterial waveforms. Ann. Biomed. Eng. 2013, 41, 2617–2629. [Google Scholar] [CrossRef]
  54. Segers, P.; Rietzschel, E.R.; De Buyzere, M.L.; De Bacquer, D.; Van Bortel, L.M.; De Backer, G.; Gillebert, T.C.; Verdonck, P.R. Assessment of pressure wave reflection: Getting the timing right! Physiol. Meas. 2007, 28, 1045–1056. [Google Scholar] [CrossRef] [PubMed]
  55. Westerhof, N.; Sipkema, P.; van den Bos, G.C.; Elzinga, G. Forward and backward waves in the arterial system. Cardiovasc. Res. 1972, 6, 648–656. [Google Scholar] [CrossRef]
  56. Schmidhuber, J. Deep learning in neural networks: An overview. Neural Netw. 2015, 61, 85–117. [Google Scholar] [CrossRef] [PubMed] [Green Version]
  57. Lipton, Z.C.; Berkowitz, J.; Elkan, C. A critical review of recurrent neural networks for sequence learning. Comput. Sci. 2015. Available online: http://arxiv.org/abs/1506.00019 (accessed on 4 May 2021).
  58. Hochreiter, S.; Schmidhuber, J. Long short-term memory. Neural Comput. 1997, 9, 1735–1780. [Google Scholar] [CrossRef] [PubMed]
  59. Jin, W.; Chowienczyk, P.; Alastruey, J. Estimating pulse wave velocity from the radial pressure wave using machine learning algorithms. medRxiv 2020. [Google Scholar] [CrossRef]
  60. Jin, W.; Alastruey, J. Arterial pulse wave propagation across stenoses and aneurysms: Assessment of one-dimensional simulations against three-dimensional simulations and in vitro measurements. J. R. Soc. Interface 2021, 18, 20200881. [Google Scholar] [CrossRef]
  61. Li, Z.-Y.; U-King-Im, J.; Tang, T.Y.; Soh, E.; See, T.C.; Gillard, J.H. Impact of calcification and intraluminal thrombus on the computed wall stresses of abdominal aortic aneurysm. J. Vasc. Surg. 2008, 47, 928–935. [Google Scholar] [CrossRef]
  62. Di Martino, E.S.; Vorp, D.A. Effect of variation in intraluminal thrombus constitutive properties on abdominal aortic aneurysm wall stress. Ann. Biomed. Eng. 2003, 31, 804–809. [Google Scholar] [CrossRef]
  63. Tong, J.; Cohnert, T.; Regitnig, P.; Holzapfel, G.A. Effects of age on the elastic properties of the intraluminal thrombus and the thrombus-covered wall in abdominal aortic aneurysms: Biaxial extension behaviour and material modelling. Eur. J. Vasc. Endovasc. Surg. 2011, 42, 207–219. [Google Scholar] [CrossRef] [Green Version]
Figure 1. The one-dimensional model of pulse wave propagation with a normal infrarenal abdominal aorta (left) and the parameter variations considered to simulate an AAA (right). These include (1) type of AAA shape, (2) AAA maximum diameter (Dmax), (3) AAA length (L), (4) AAA local stiffness (Eh; i.e., elastic modulus multiplied by wall thickness), and (5) global stiffness of the larger systemic arteries. The model contains the arterial segments making up the larger systemic arteries, an aortic inflow waveform prescribed at the aortic root, and lumped outflow boundary conditions at each terminal segment representing vascular beds.
Symmetry 13 00804 g001
Figure 2. Variations of model parameters used to construct the new database of in silico pulse waves. Panels (ah) show the variations of heart rate (HR), stroke volume (SV), left ventricular ejection time (LVET), infrarenal abdominal aortic diameter, mean arterial pressure (MAP), peripheral vascular resistance (PVR), AAA maximum diameter, and carotid-femoral pulse wave velocity (PWV), respectively. The AAA maximum diameter and increased PWV values shown in red were added to the original database [14] (with parameters shown in black) to simulate increased stiffness and AAAs. Panel (i) shows the PWV as a function of the arterial diameter for the baseline model of each age, in the baseline (black) and IGS/AAA (red) subsets.
Symmetry 13 00804 g002
Figure 3. Schematic of the bidirectional recurrent neural network (BRNN) with long short-term memory (LSTM) used for pulse wave analysis. Simulated PPG pulse waves (PWs) in n = 8748 virtual subjects were used as input data for training a BRNN with LSTM (see Equation (8) for the mathematical expressions of a LSTM unit) to predict the presence (output = 1) or not (output = 0) of an AAA. The BRNN contains input, output and hidden layers, each hidden layer consisting of masking, forward, backward, and dense layers. The forward and backward layers include a series of LSTM units. L and L′ represent the LSTM units in the forward and backward layers, respectively. M and M′ are the corresponding memory cells. X is the input data processed by masking layer for the LSTM units, and H is the output data for the dense layer. PPG PWs are described using discrete values p1, …, pt. The subscripts 1, …, t represent each time history point. Details about the symbols in the brown boxes describing LSTM units can be found in Equation (8).
Symmetry 13 00804 g003
Figure 4. Simulated pressure waveforms in the ascending aorta (left), infrarenal abdominal aorta (middle), and femoral artery (right) with individual variations in the AAA-related parameters indicated at the start of each row and illustrated in Figure 1.
Symmetry 13 00804 g004
Figure 5. Simulated flow velocity waveforms in the ascending aorta (left), infrarenal abdominal aorta (middle), and femoral artery (right) with individual variations in the AAA-related parameters indicated at the start of each row and illustrated in Figure 1.
Symmetry 13 00804 g005
Figure 6. Simulated pressure and flow velocity pulse waves at the infrarenal abdominal aorta (labelled in red) and other common measurement sites (labelled in black) for the baseline 65-year-old subject in the IGS subset (without AAA) and AAA subset (Dmax = 30 mm, Dmax = 40 mm, and Dmax = 50 mm). The PPG wave is shown in the digital artery in the time and frequency domains (labelled in blue).
Symmetry 13 00804 g006
Figure 7. Comparison of pulse wave indexes obtained in the baseline and increased global stiffness (IGS) subsets (in black) and the AAA subset with different AAA sizes (in red). SBP: systolic blood pressure (a); DBP: diastolic blood pressure (b); MBP: mean blood pressure (c); Pb/Pf: wave reflection magnitude (d); ΔTf-b: time delay between Pb and Pf (e); AIx: augmentation index (f); cf-PWV: carotid-femoral pulse wave velocity (g); difference between the magnitudes of the 5th and the 6th harmonics of the digital PPG pulse wave (h), and the same difference normalized by the magnitude of the 1st harmonic (i). Dots indicate mean values and error bars represent standard deviations. All indexes were calculated in the ascending aorta except for cf-PWV and digital PPG indexes.
Symmetry 13 00804 g007
Figure 8. Performance of the trained machine learning model for the early detection of AAAs. Test data (left), confusion matrix (middle), and ROC curve (right) when testing in the original (top) and modified (bottom) testing sets. The confusion matrices indicate the number of subjects in each condition together with the proportion of each age and AAA size (if applicable) in brown.
Symmetry 13 00804 g008
Table 1. Carotid-femoral pulse wave velocities measured in control cohorts of healthy subjects and in cohorts of patients with AAA.
Control (Number)AAA Patient (Number)Reference
10.0 m/s (20)14.8 m/s (18)[43]
10.03 m/s (42)12.99 m/s (108)[44]
7.97 m/s (31)13.11 m/s (48)[45]
9.33 m/s13.63 m/sMean value
Table 2. Elastic modulus and wall thickness of the normal infrarenal abdominal aorta and AAA.
SourceValueReference
Growth ratio of elastic modulus from normal to AAA
Measured by magnetic
resonance elastography
96.8%[42]
Calculated from the measured pressure and diameter49.6%[46]
73.2%Mean value
Normal wall thickness
Derived from clinical
measurements
1.4~1.5 mm[25]
1.39 mm[47]
1.4 mmMean value
AAA wall thickness
Derived from clinical
measurements
2 mm[37]
1.63 mm[48]
1.48 mm[49]
2.71 mm[50]
2.87 mm[51]
1.64 mm[52]
Used by previous model-based studies2 mm[21,40]
2 mmMean value
Table 3. Parameters assigned to the BRNN with LSTM.
ParameterValue
Number of LSTM units16
Batch size32
Epoch number256
OptimiserAdam
Cost functionBinary cross-entropy
Publisher’s Note: MDPI stays neutral with regard to jurisdictional claims in published maps and institutional affiliations.

