
Connecting Climate and Communicable Disease to Penta Helix Using Hierarchical Likelihood Structural Equation Modelling

 ,
, 
 ,
, 


Abstract
1. Introduction
2. Hierarchical Structural Equation Models (HSEMs)
- Inadmissible solution: This happens because variance-based SEMs are not covariance so that the singular matrix problem will never occur.
- Factor indeterminacy: Factor indeterminacy is a condition that causes latent variable scores that cannot be obtained. The sample size in traditional SEMs can be estimated as ten times the number of formative indicators (ignoring reflective indicators) [52,53,54]. Ten times the amounts of structural paths in the inner model and small sample sizes 30–50 or large samples over 200. In determining the sample size, the HSEM approach states that the strength of the analysis is based on the portion of the model that has the most considerable number of predictors. Minimum recommended ranges are from 30 to 100 cases. HSEMs consist of external relationships (outer models or measurement models) and internal relationships (inner models or structural models) [54]. The relationship is defined as two linear equations, namely the measurement model that unites the relationship of the latent variable with a group of explanatory variables and the structural model that is the relationship among the latent variables [51,52,55].
2.1. Inner Model
- The number of paths from the free latent variable to the non-free latent variable
- The number of latent variables
- Latent variable j-th
- Latent variable i-th
- Coefficient path of the i-th exogenous latent variable to the j-th endogenous latent variable
- Coefficient of the i-th endogenous latent variable to the j-th endogenous latent variable
- : Intercept
- Inner residual
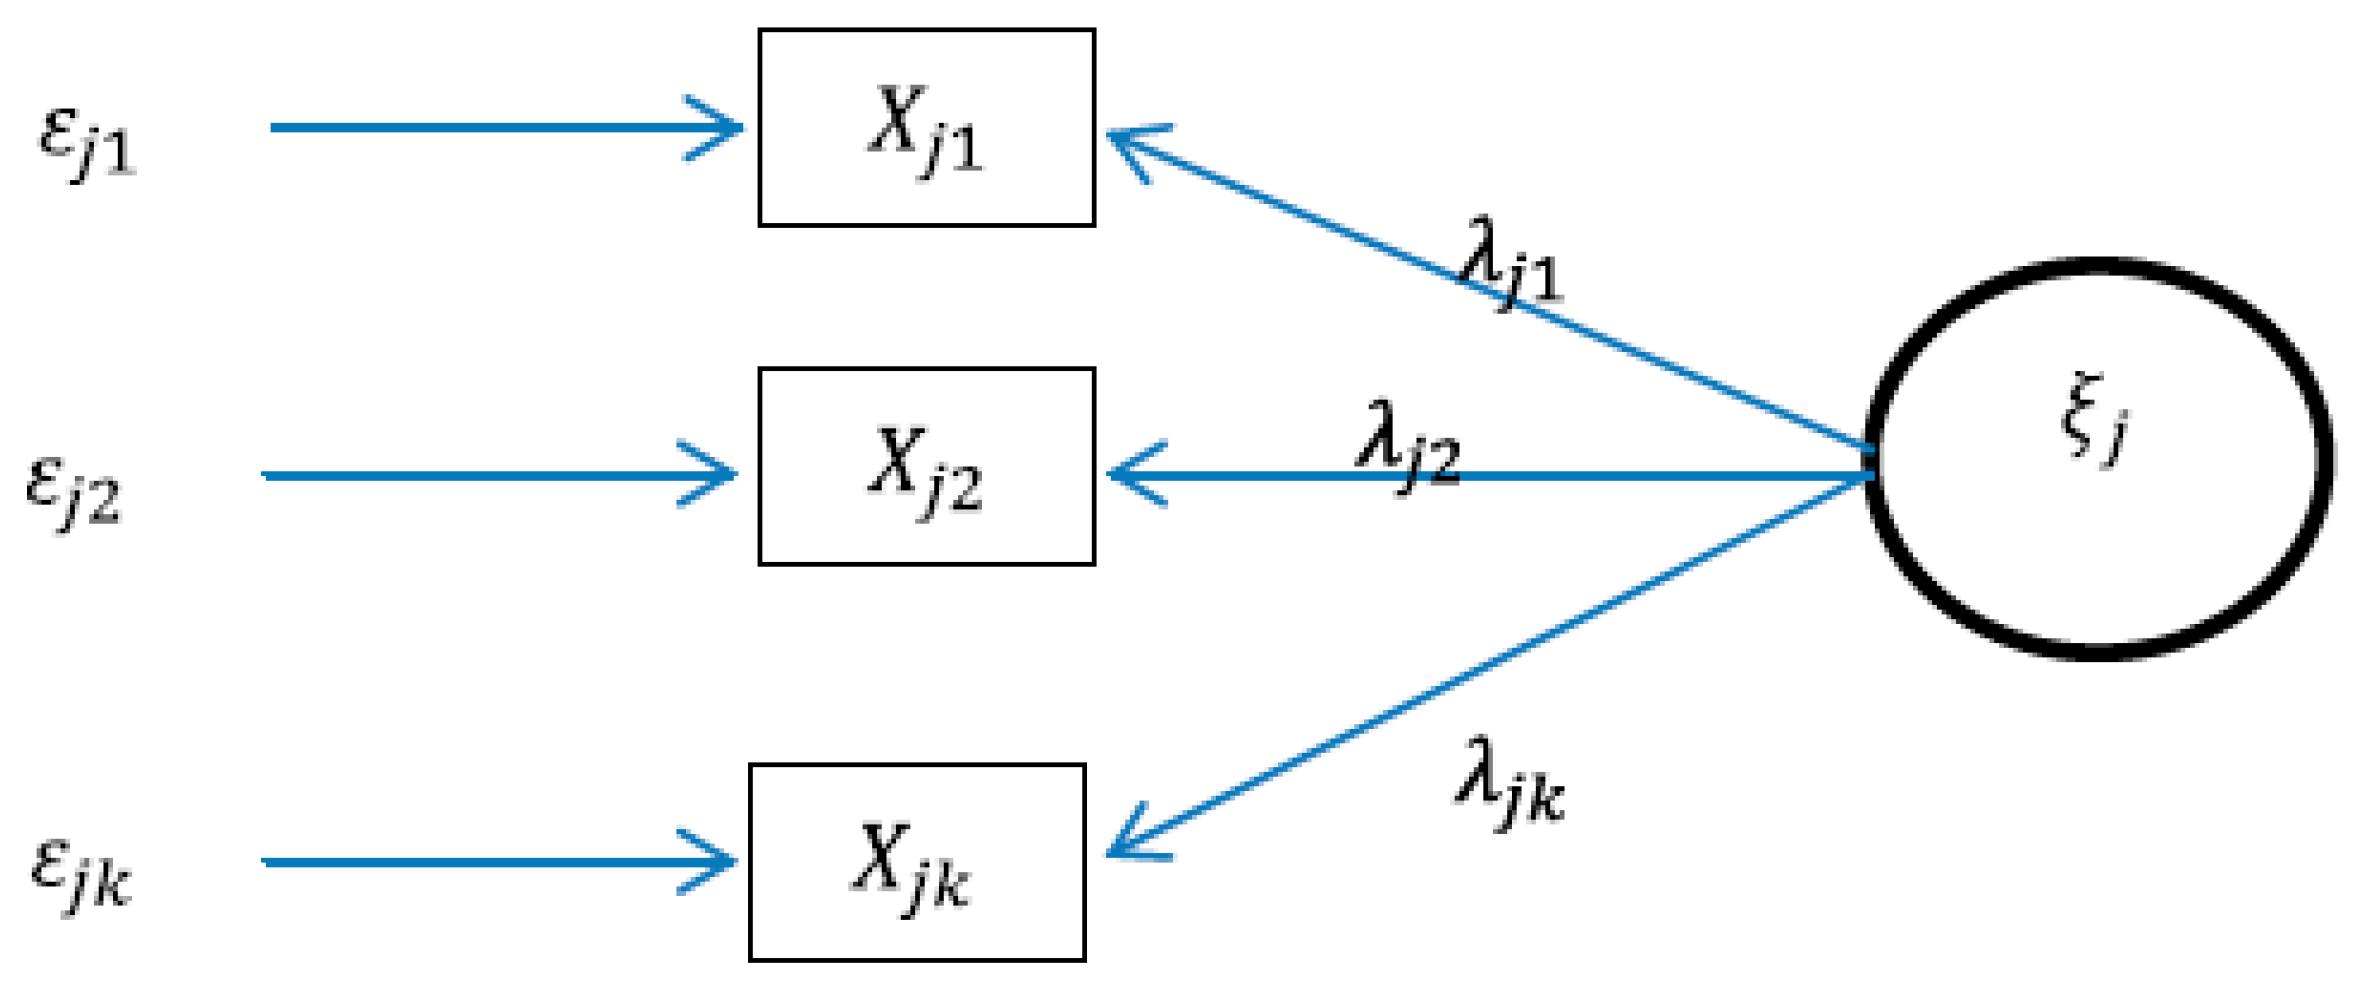
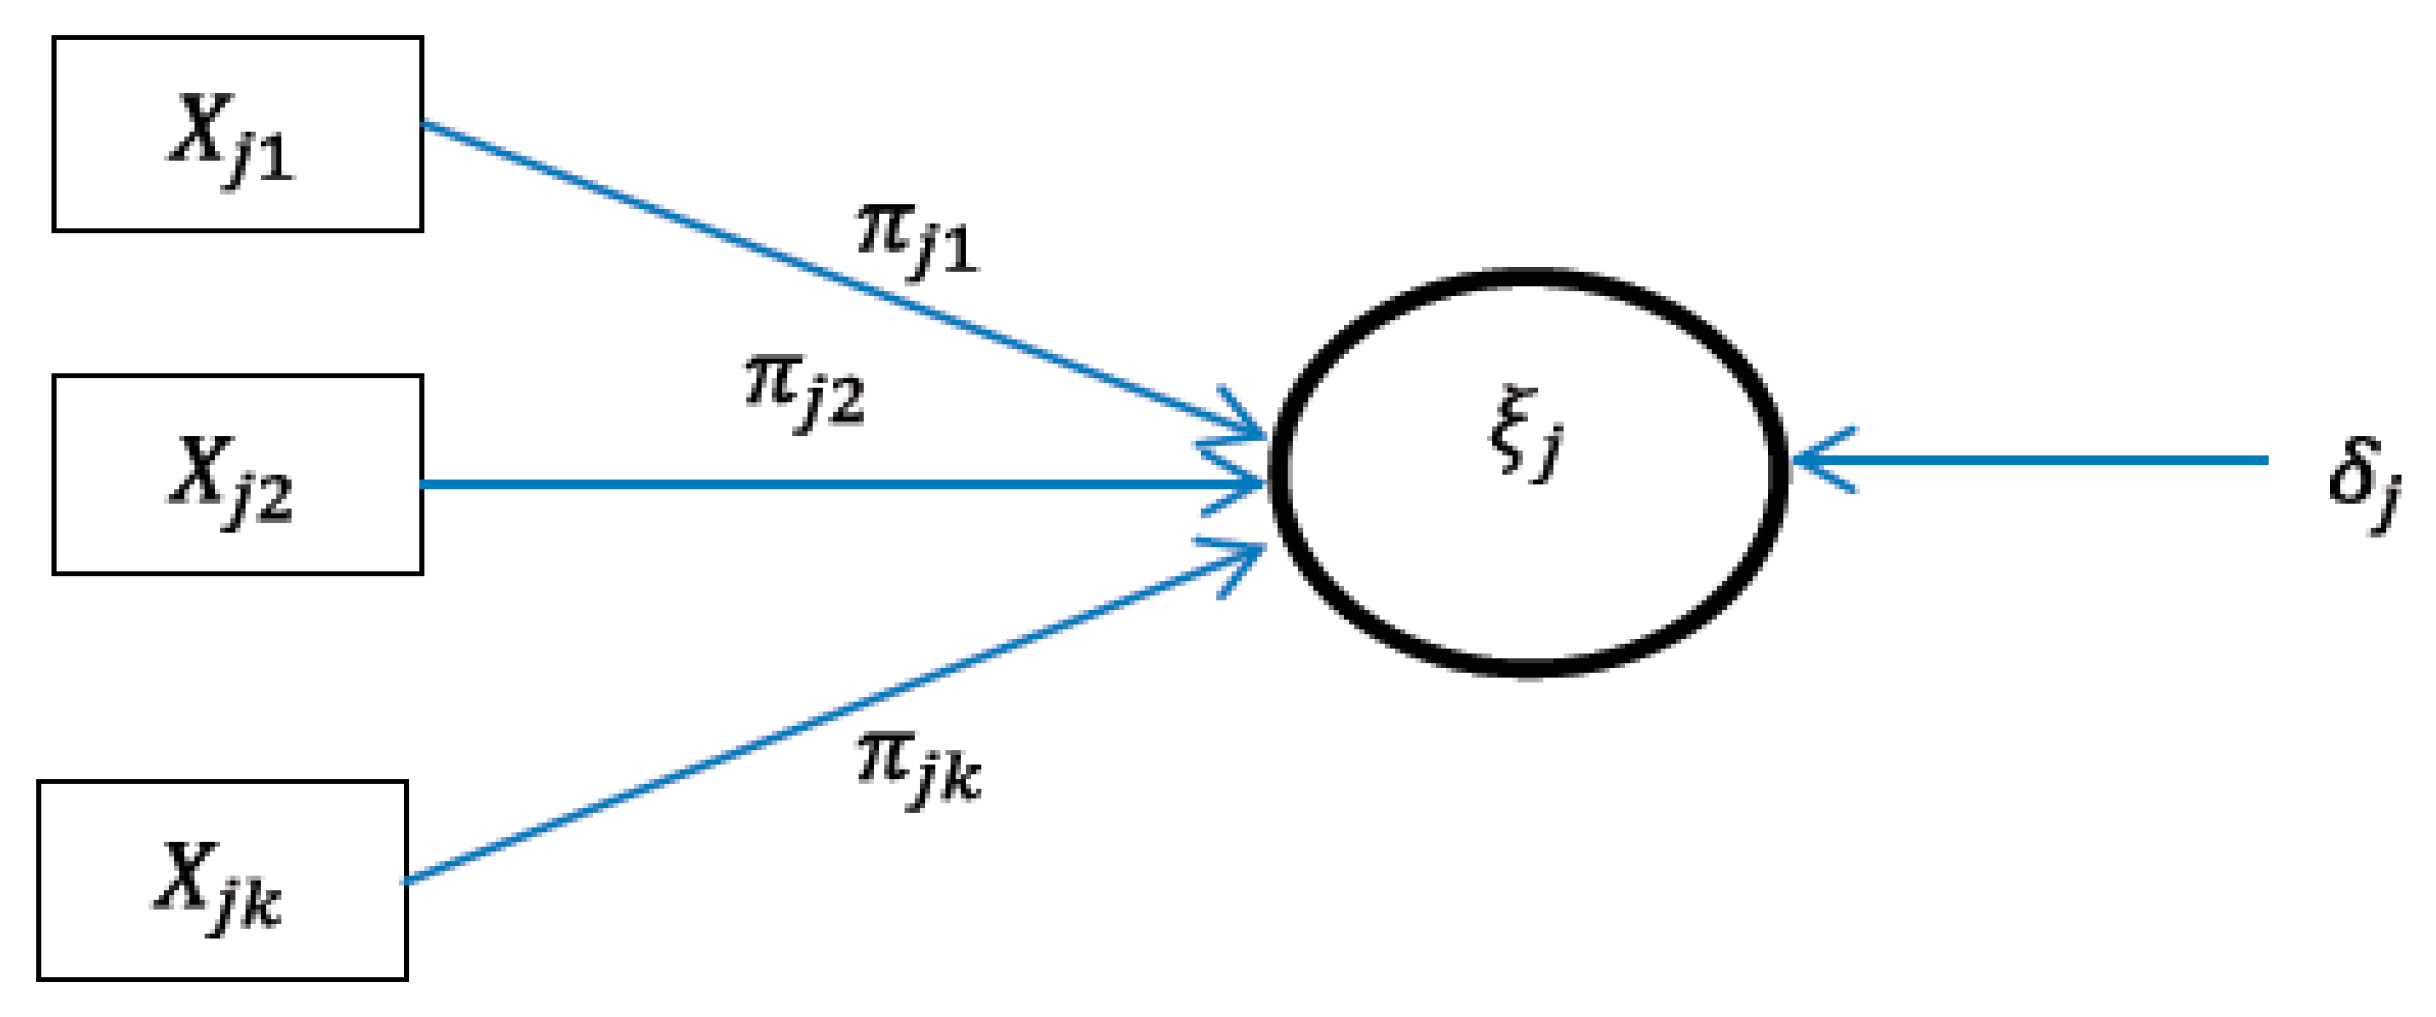
2.2. Outer Model
2.3. Reflective Relations
2.4. Formative Relations
3. Datasets and Results
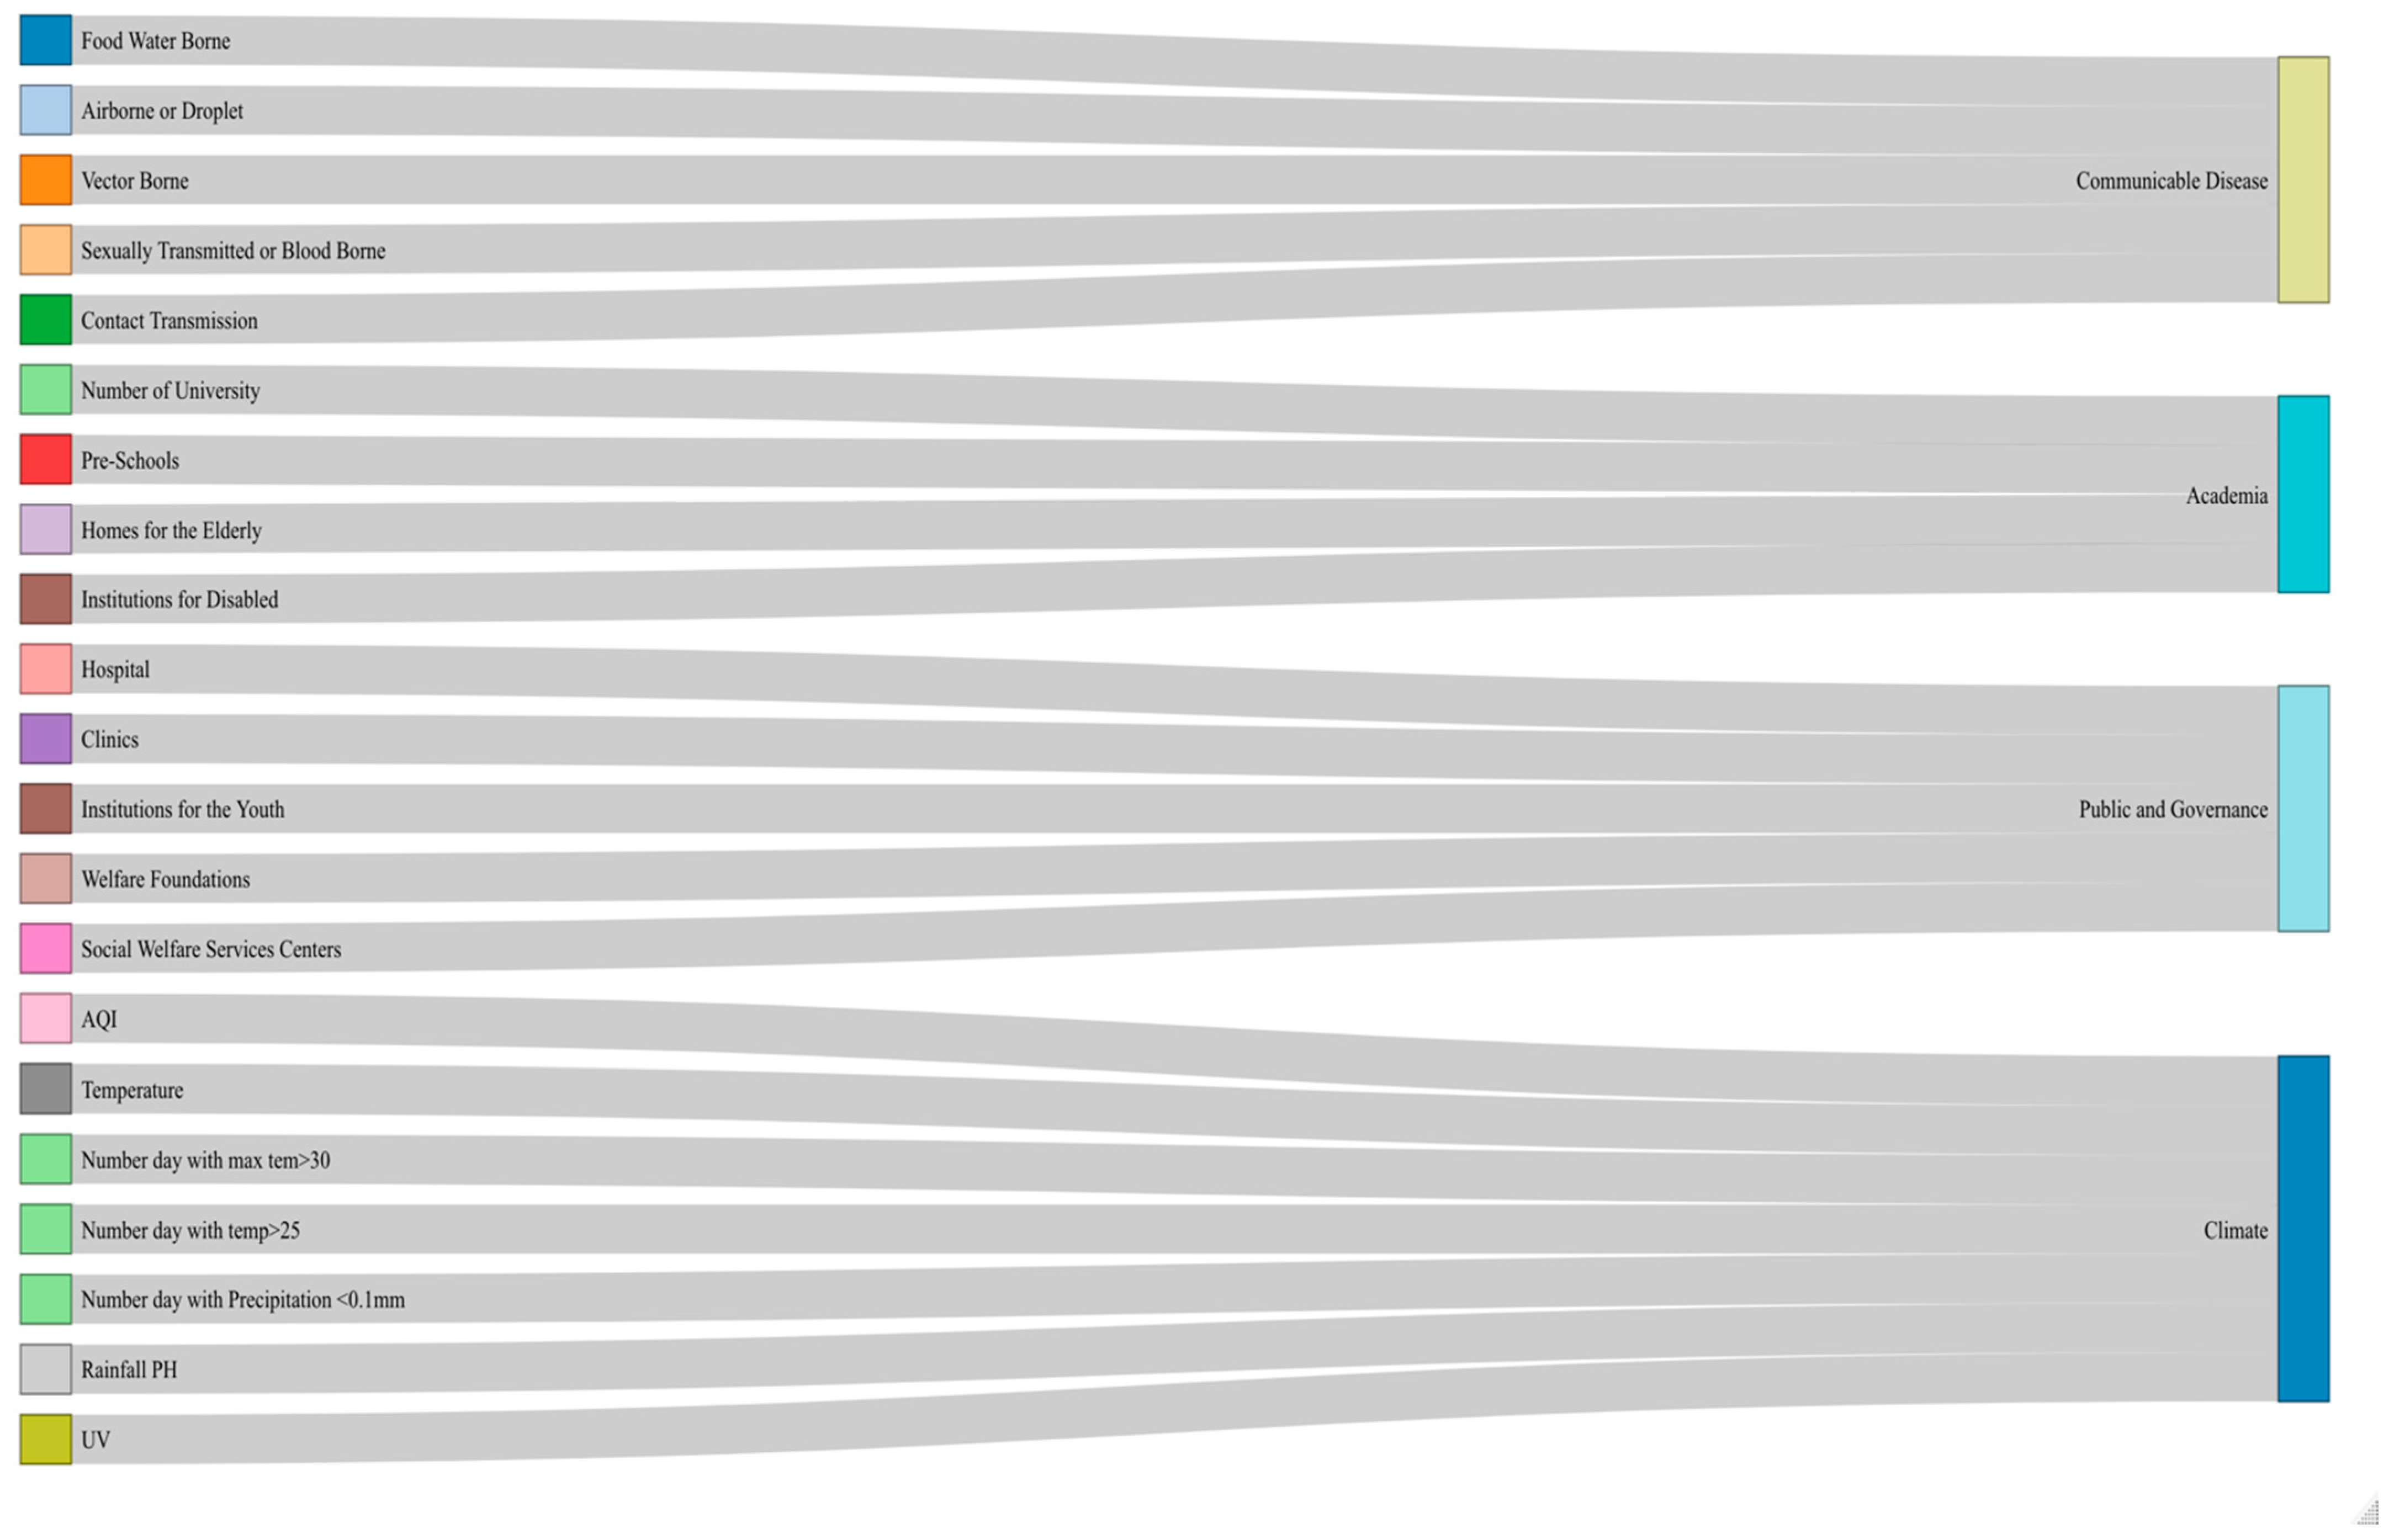
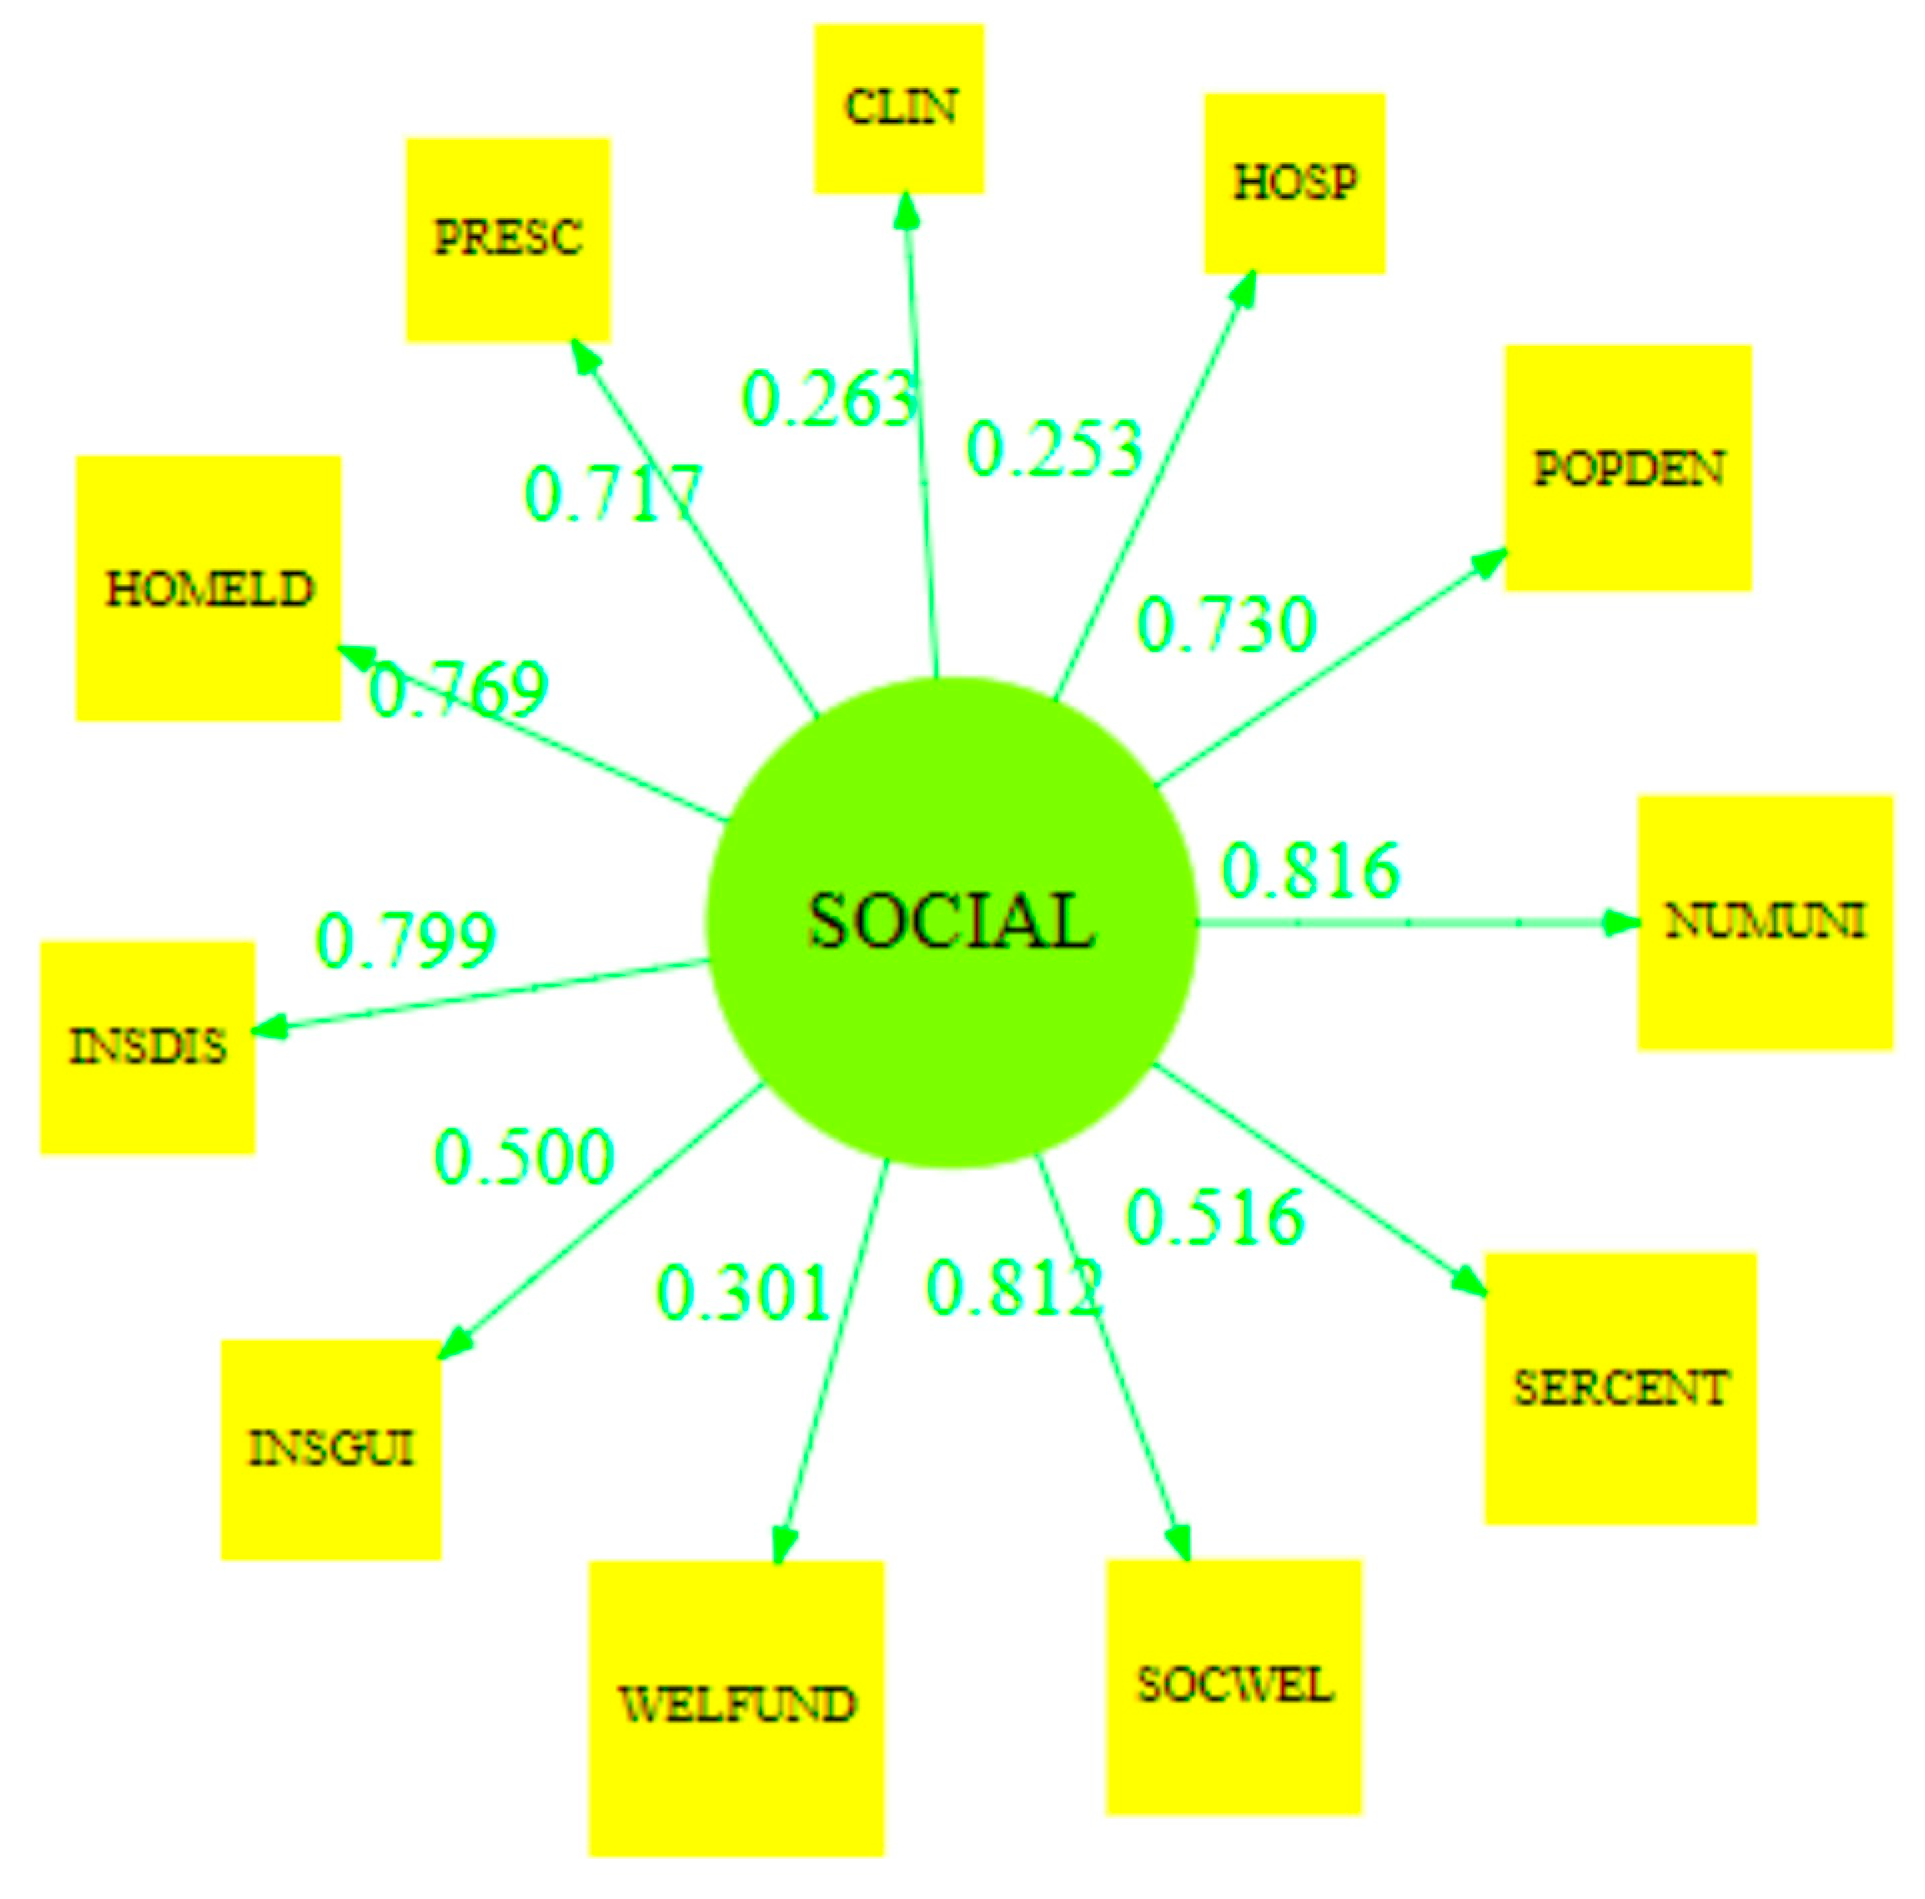
3.1. Synergy of Penta-Helix in Health Issues
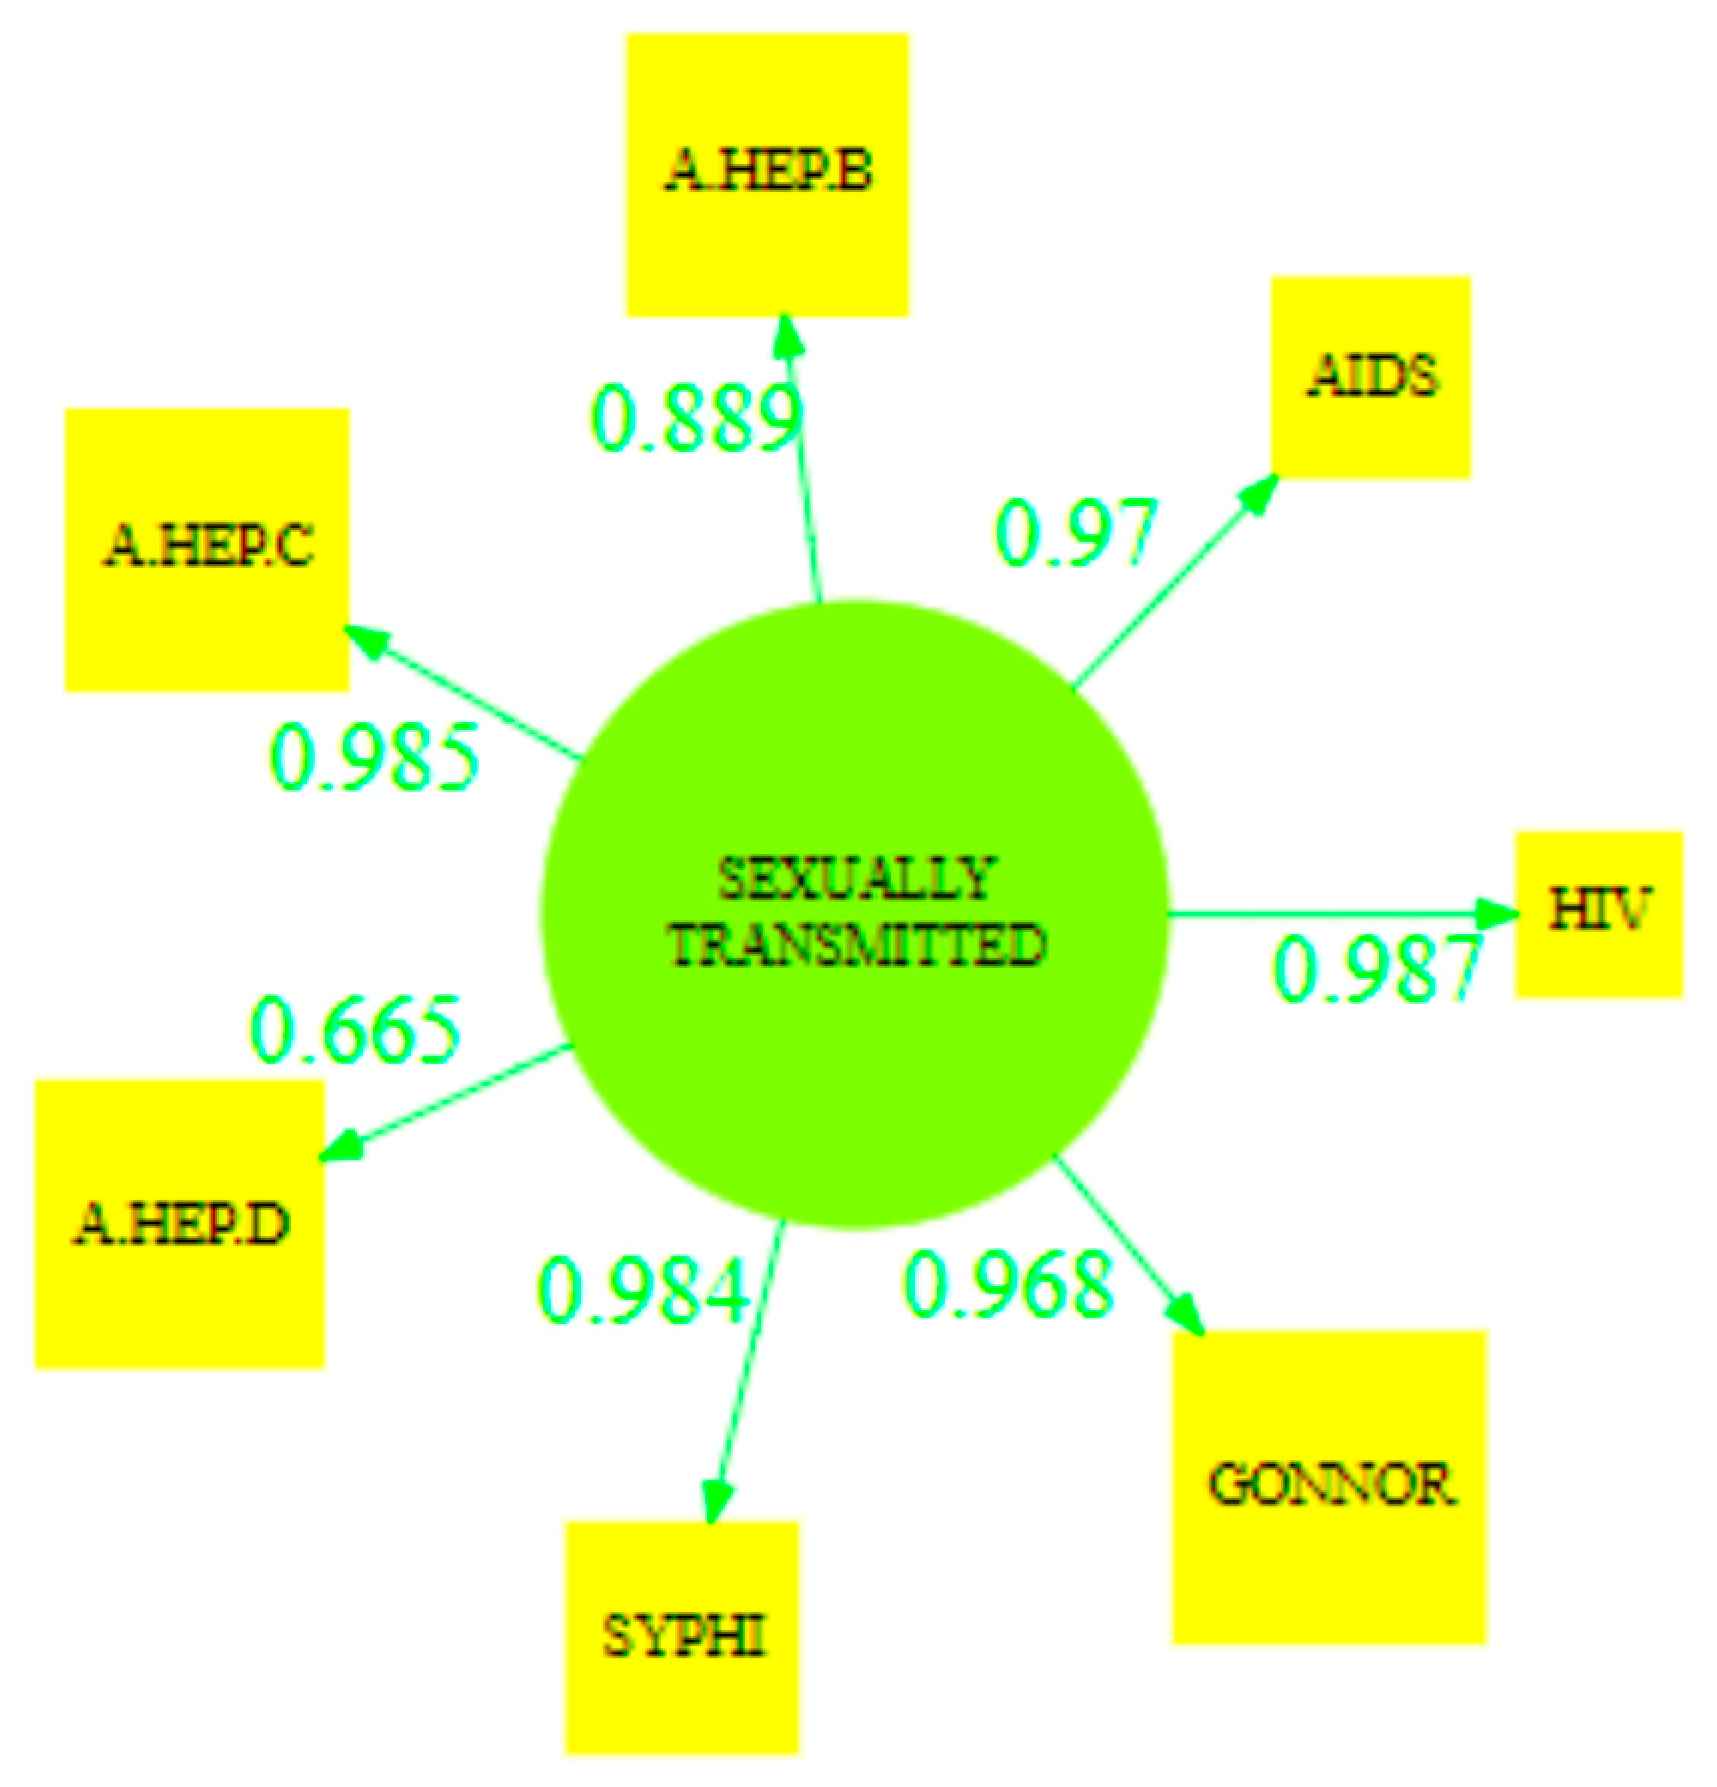
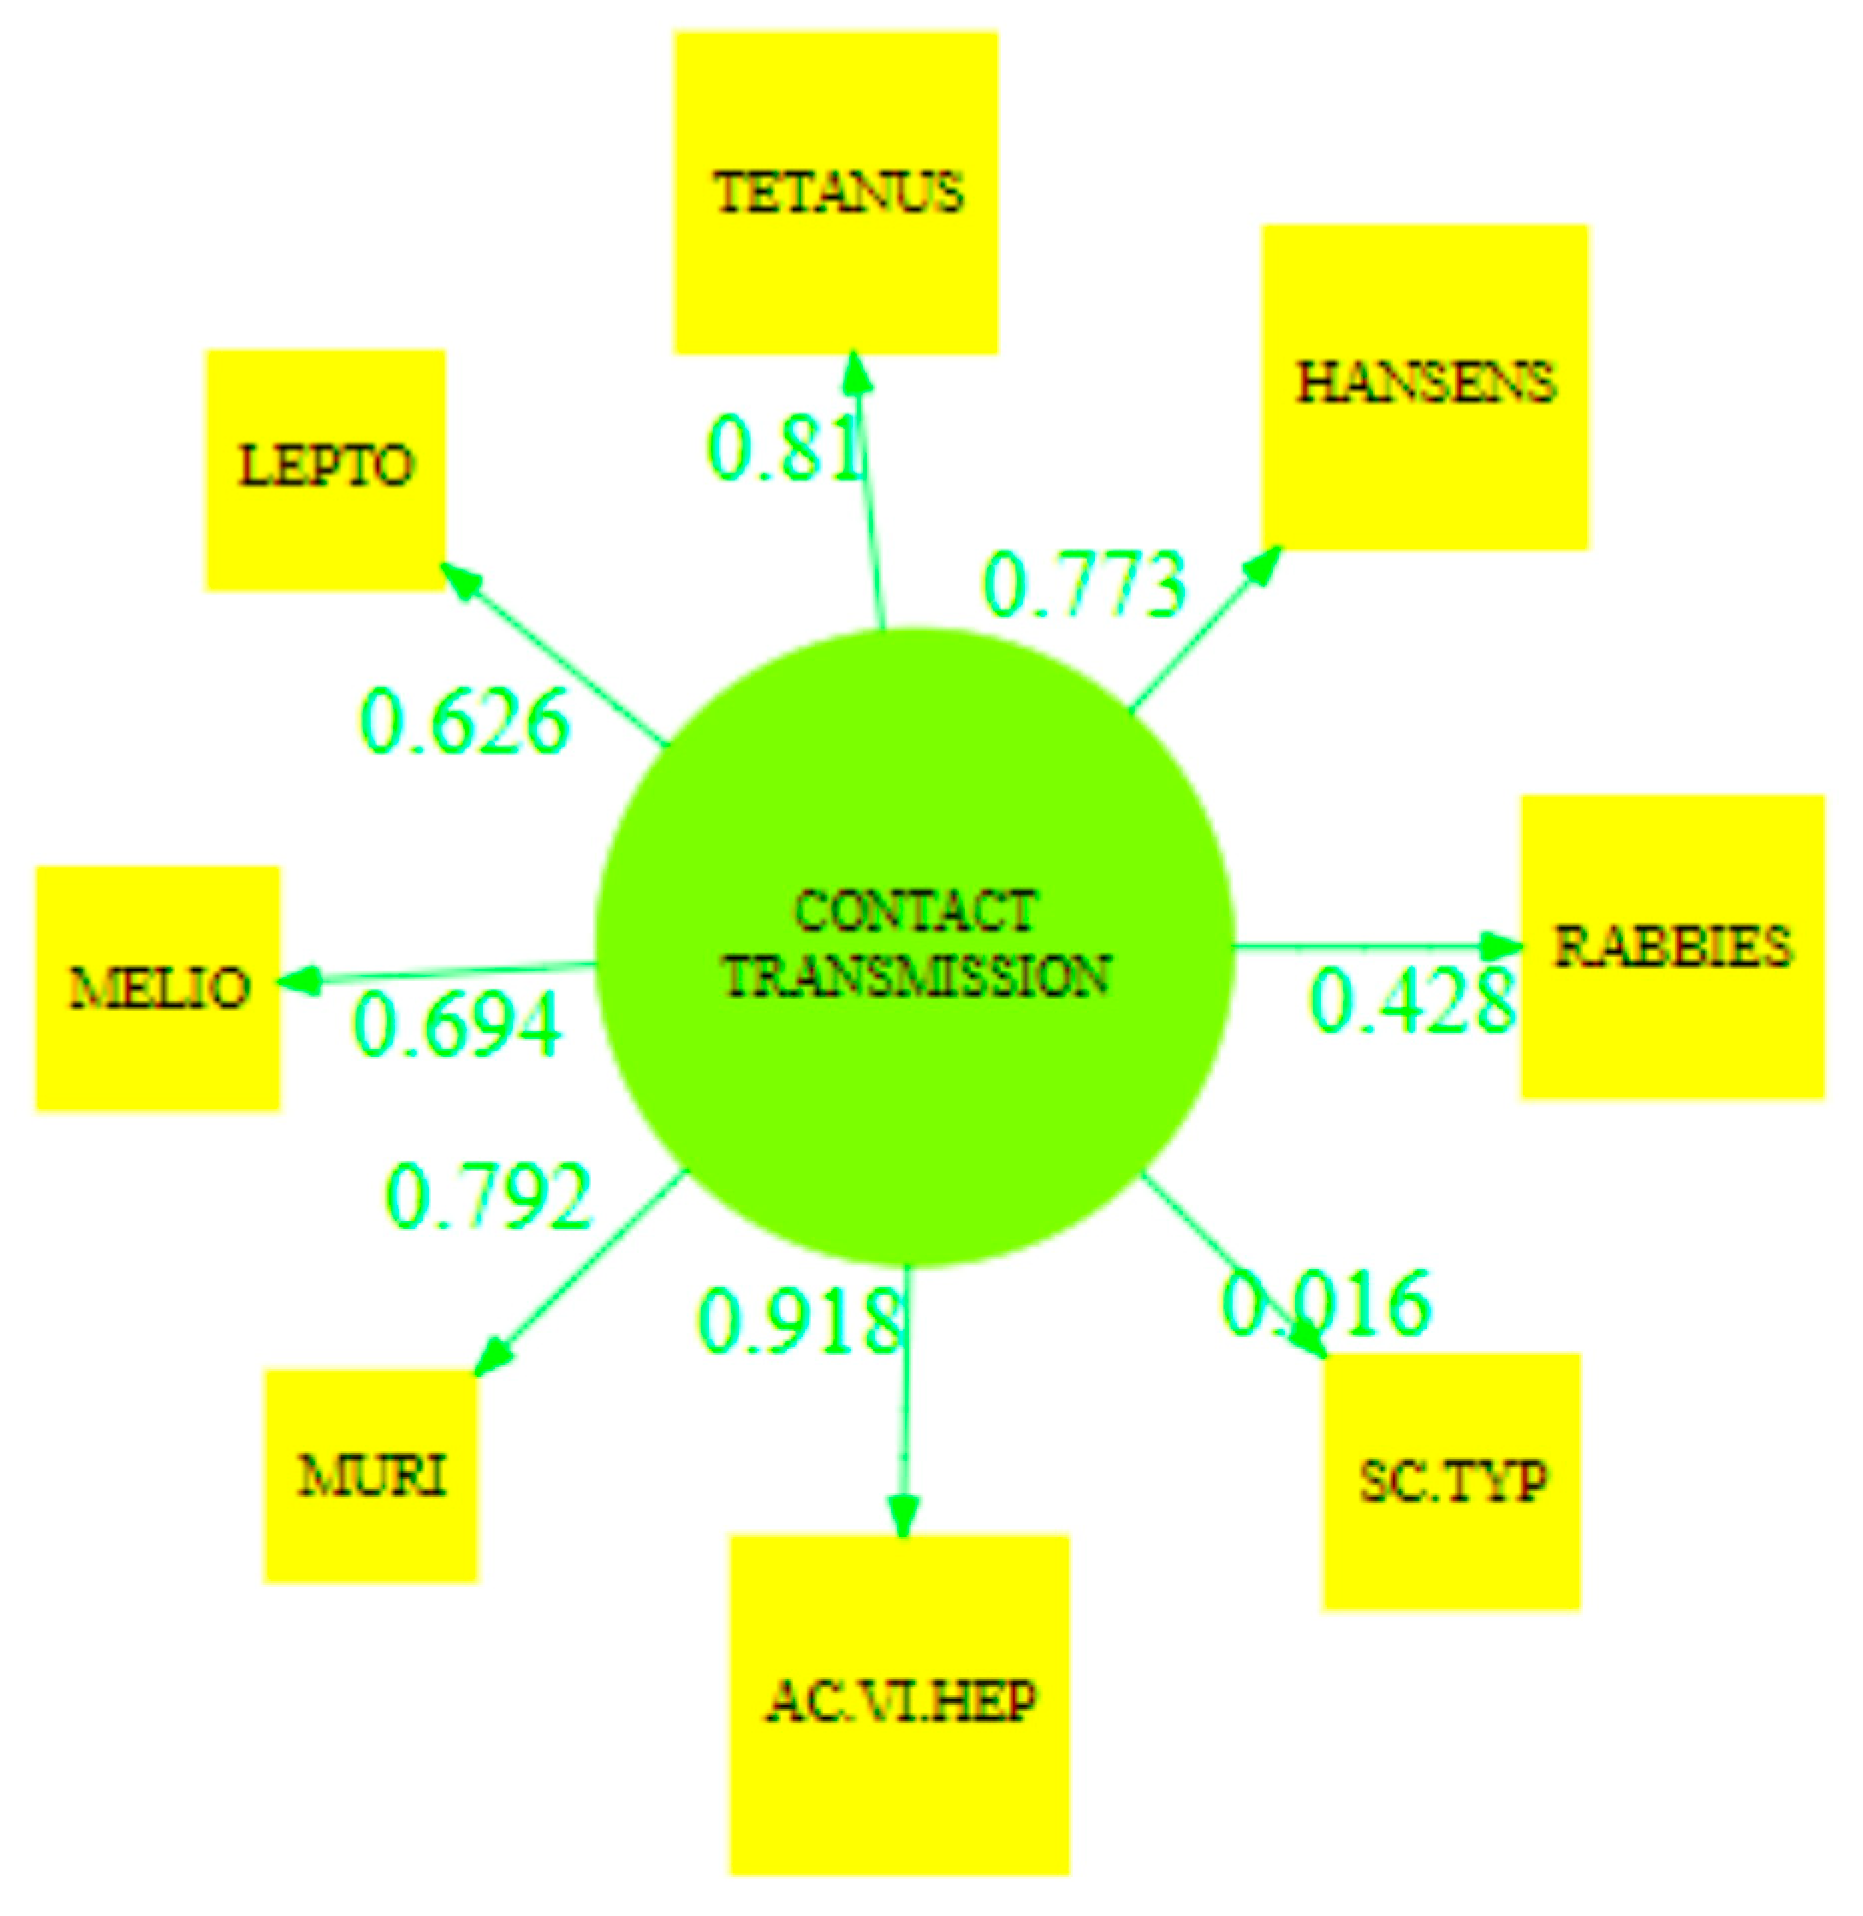
3.2. Communicable Disease
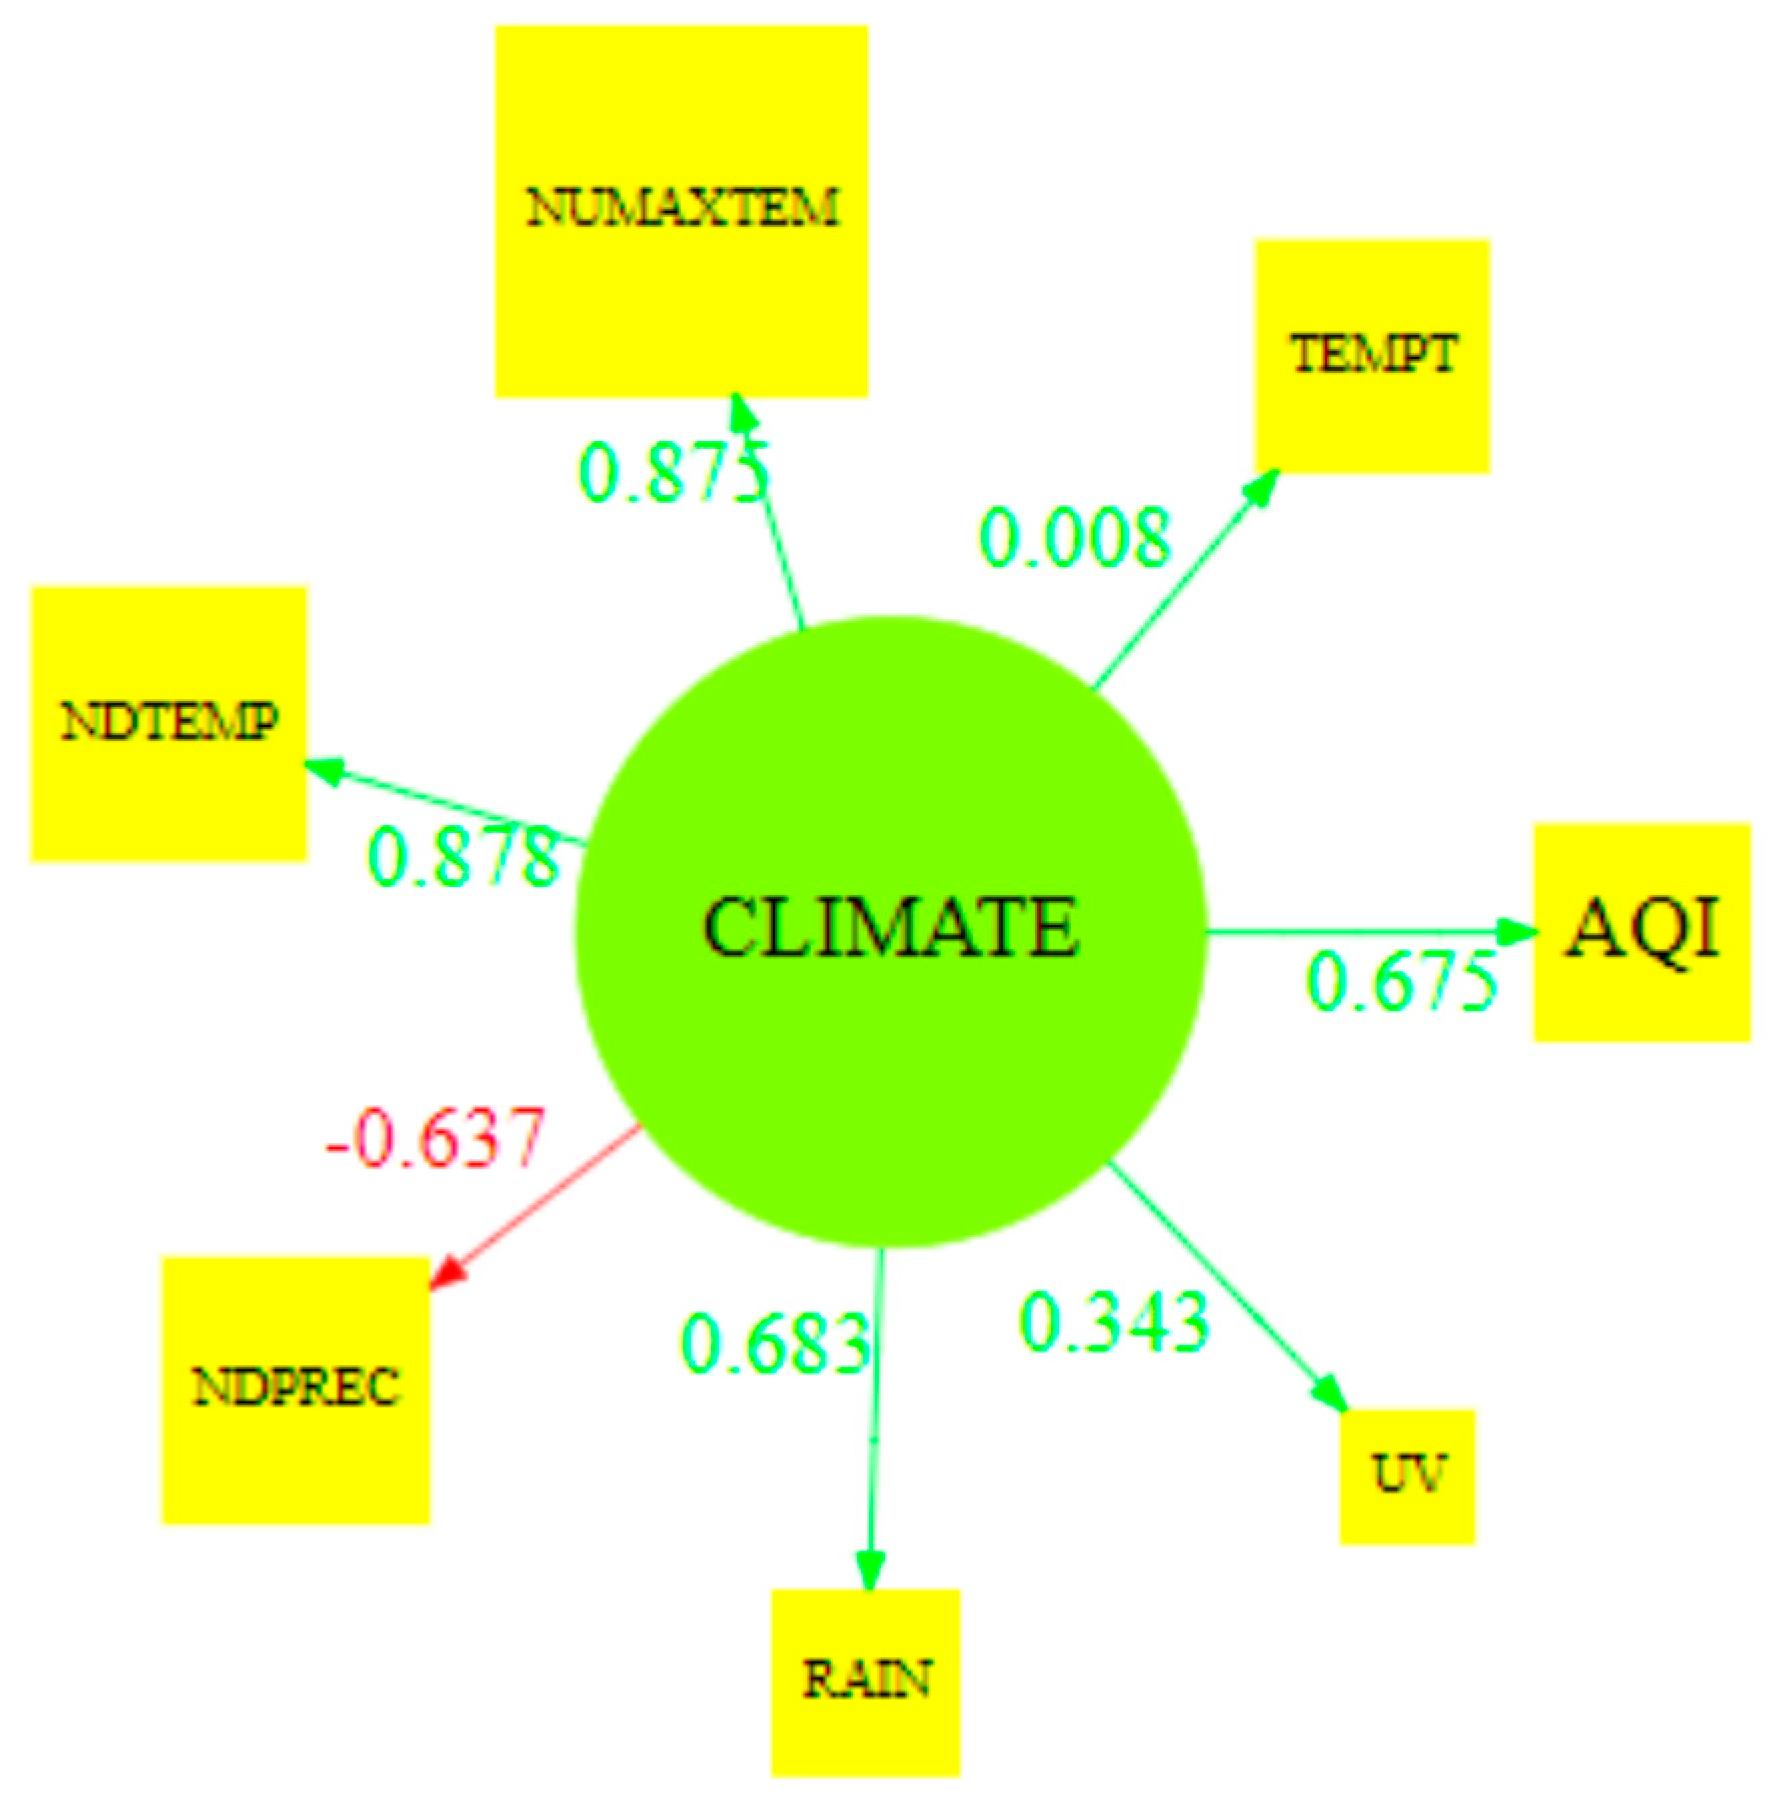
3.3. Communicable Disease against Climate
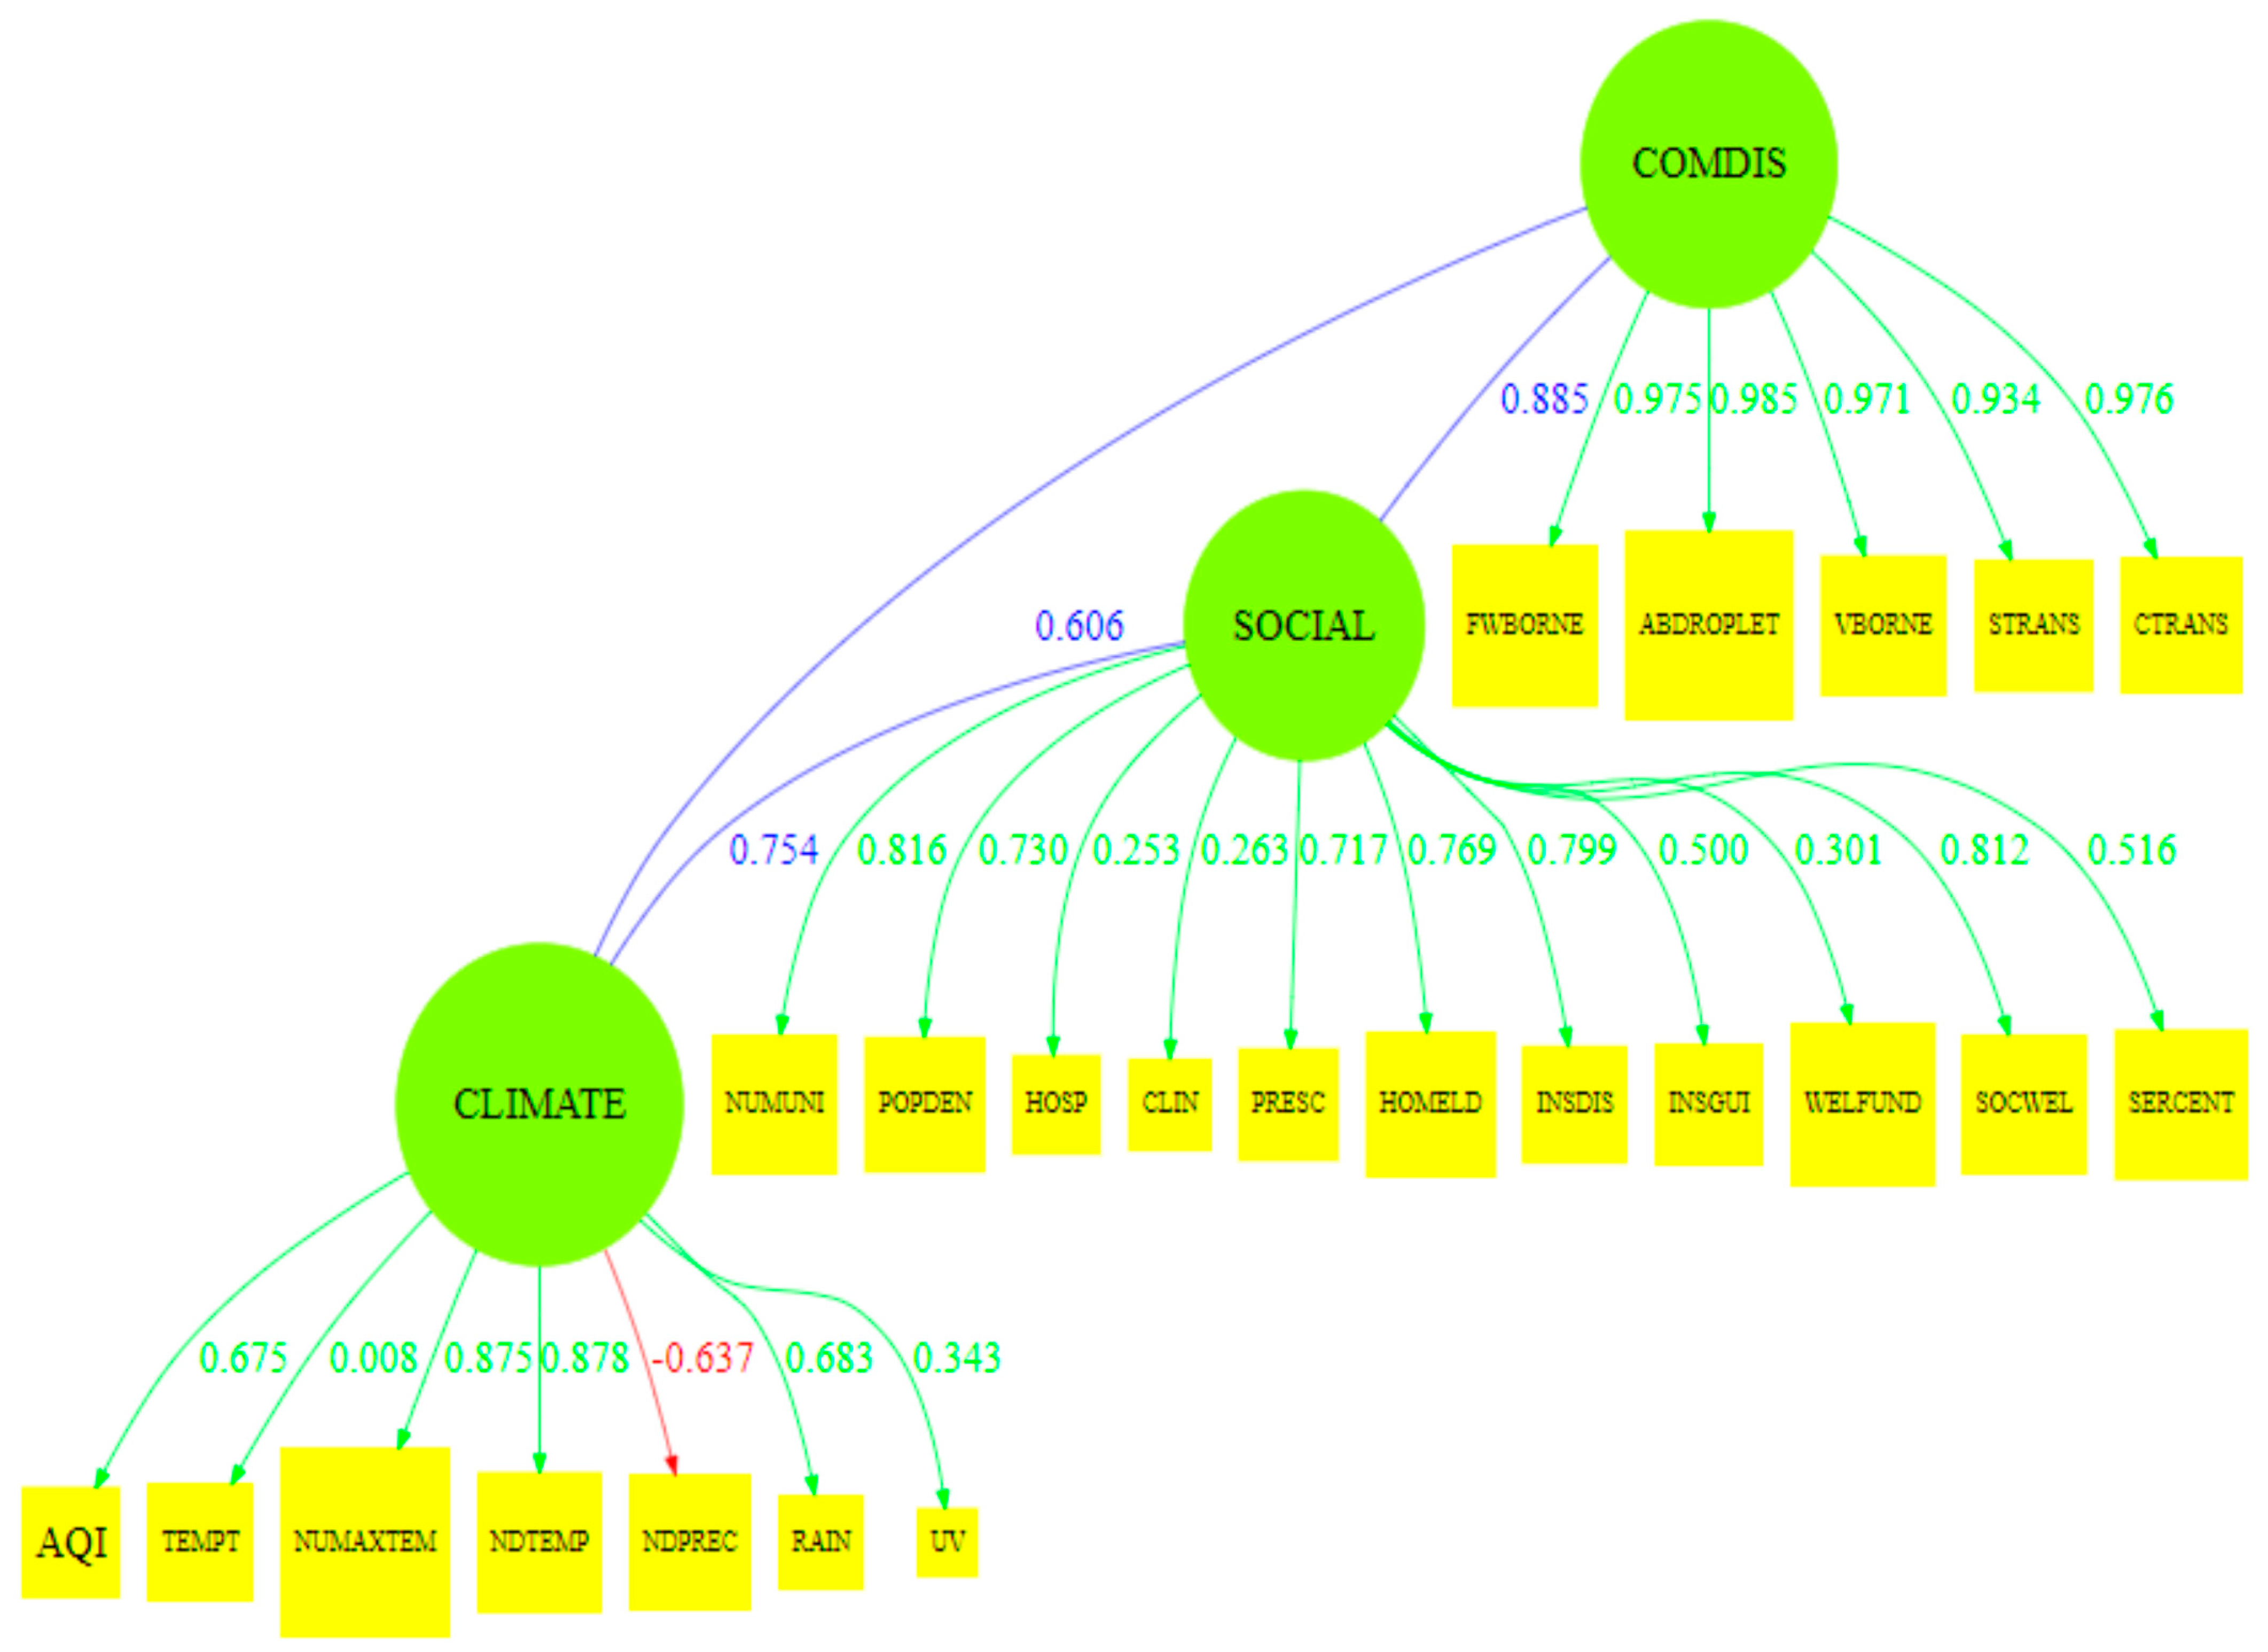
3.4. Model Construction
4. Conclusions
Author Contributions
Funding
Data Availability Statement
Conflicts of Interest
Appendix A
- Step 0: Outer Weight Initialization. At this stage, an initialization is made, which is to determine any arbitrary value for outer weight. To make it easier, the weights of all indicators are the same: . Indicators are scaled to have unit variance (mean = 0, variance = 1).
- Step 1: Outside Approximation. After the outer weight is estimated, the estimation of the measurement model is then performed, which illustrates that the latent variable is the sum of the multiplication of weights with indicators.
- Step 2: Determination of Inner Weight. The initial value of the latent variable has been obtained; then, recalculate the latent variable differently. The latent variable is considered a linear combination of other related latent variables.
- Step 3: Structural Model Estimation (Inside Approximation). After the inner weight is obtained, then estimation is made of the structural model.
- Step 4: Updating the Weight of the Measurement Model or Updating Outer Weight. The process of updating the weight of the measurement model is divided into two; first, for reflective indicators (mode A) and, second, formative (mode B).
References
- Fletcher, R.; Rammelt, C. Decoupling: A Key Fantasy of the Post-2015 Sustainable Development Agenda. Globalizations 2017, 14, 450–467. [Google Scholar] [CrossRef]
- World Health Organization. Health in 2015: From MDGs, Millennium Development Goals to SDGs, Sustainable Development Goals; World Health Organization: Geneva, Switzerland, 2015. [Google Scholar]
- Lim, S.S.; Allen, K.; Bhutta, Z.A.; Dandona, L.; Forouzanfar, M.H.; Fullman, N.; Gething, P.W.; Goldberg, E.M.; Hay, S.I.; Holmberg, M.; et al. Measuring the health-related Sustainable Development Goals in 188 countries: A baseline analysis from the Global Burden of Disease Study 2015. Lancet 2016, 388, 1813–1850. [Google Scholar] [CrossRef]
- Nilsson, M.; McCollum, D.; Echeverri, L.G.; Riahi, K.; Parkinson, S. A Guide to SDG Interactions: From Science to Implementation; International Council for Science: Paris, France, 2017. [Google Scholar]
- Opoku, A. SDG2030: A sustainable built environment’s role in achieving the post-2015 United Nations sustainable development goals. In Proceedings of the 32nd Annual ARCOM Conference, Manchester, UK, 5–7 September 2016. [Google Scholar]
- Akseer, N.; Lawn, J.E.; Keenan, W.; Konstantopoulos, A.; Cooper, P.; Ismail, Z.; Thacker, N.; Cabral, S.; Bhutta, Z.A. Ending preventable newborn deaths in a generation. Int. J. Gynecol. Obstet. 2015, 131, S43–S48. [Google Scholar] [CrossRef]
- Joint United Nations Programme on HIV/AIDS, UNAIDS 2017. Ending Aids Progress Towards the 90-90-90 Targets. Glob Aids Updat 2017. Available online: https://www.unaids.org/sites/default/files/media_asset/Global_AIDS_update_2017_en.pdf (accessed on 24 December 2020).
- Suthar, A.B.; Zachariah, R.; Harries, A.D. Ending tuberculosis by 2030: Can we do it? Int. J. Tuberc. Lung Dis. 2016, 20, 1148–1154. [Google Scholar] [CrossRef]
- Fitzpatrick, C.; Nwankwo, U.; Lenk, E.; de Vlas, S.J.; Bundy, D.A.P. An Investment Case for Ending Neglected Tropical Diseases. In Disease Control Priorities, 3rd ed.; Major Infectious Diseases; Woldbank Group: Washington, DC, USA, 2017; Volume 6. [Google Scholar]
- Radhakrishnan, S.K.; Layden, T.J.; Gartel, A.L. RNA interference as a new strategy against viral hepatitis. Virology 2004, 323, 173–181. [Google Scholar] [CrossRef] [PubMed]
- Caraka, R.E.; Yasin, H. Geographically Weighted Regression (GWR) Sebuah Pendekatan Regresi Geografis, 1st ed.; Mobius Graha Ilmu: Yogyakarta, Indonesia, 2017; Available online: www.rezzyekocaraka.com/book (accessed on 24 December 2020).
- Wetli, C. Pathology of Drug Abuse. In Drug Abuse Handbook, 2nd ed.; CRC Press: London, UK, 2006. [Google Scholar]
- Caraka, R.E.; Chen, R.C.; Yasin, H.; Pardamean, B.; Toharudin, T.; Wu, S.H. Prediction of Status Particulate Matter 2.5 using State Markov Chain Stochastic Process and HYBRID VAR-NN-PSO. IEEE Access 2019, 7, 161654–161665. [Google Scholar] [CrossRef]
- Akimoto, H. Global Air Quality and Pollution. Science 2003, 302, 1716–1719. [Google Scholar] [CrossRef] [PubMed]
- Rossati, A. Global warming and its health impact. Int. J. Occup. Environ. Med. 2017, 8, 7. [Google Scholar] [CrossRef] [PubMed]
- Hales, S.; Edwards, S.J.; Kovats, R.S. Impacts on health of climate extremes. Clim. Chang. Hum. Health Risks Responses 2003, 5, 79–102. [Google Scholar]
- Searle, K.; Gow, K. Do concerns about climate change lead to distress? Int. J. Clim. Chang. Strateg. Manag. 2010, 2, 362–379. [Google Scholar] [CrossRef]
- Tuangratananon, T.; Wangmo, S.; Widanapathirana, N.; Pongutta, S.; Viriyathorn, S.; Patcharanarumol, W.; Thin, K.; Nagpal, S.; Nuevo, C.E.L.; Padmawati, R.S.; et al. Implementation of national action plans on noncommunicable diseases, Bhutan, Cambodia, Indonesia, Philippines, Sri Lanka, Thailand and Vietnam. Bull. World Health Organ. 2019, 97, 129. [Google Scholar] [CrossRef]
- Caraka, R.E.; Lee, Y.; Kurniawan, R.; Herliansyah, R.; Kaban, P.A.; Nasution, B.I.; Gio, P.U.; Chen, R.C.; Toharudin, T.; Pardamean, B. Impact of COVID-19 large scale restriction on environment and economy in Indonesia. Glob. J. Environ. Sci. Manag. 2020, 6, 65–84. [Google Scholar]
- Lanckriet, G.; Cristianini, N. Learning the kernel matrix with semidefinite programming. J. Mach. Learn. Res. 2004, 5, 27–72. Available online: http://dl.acm.org/citation.cfm?id=1005334 (accessed on 24 December 2020).
- Capriotti, T. HIV/AIDS: An update for home healthcare clinicians. Home Healthc. Now 2018, 36, 348–355. [Google Scholar] [CrossRef]
- Snyder, J.E. Trend analysis of medical publications about LGBT persons: 1950–2007. J. Homosex. 2011, 2, 164–188. [Google Scholar] [CrossRef] [PubMed]
- Wilkinson, R.G. The epidemiological transition: From material scarcity to social disadvantage? Daedalus 1994, 123, 61–77. [Google Scholar]
- Chan, E.Y.Y.; Hung, H. Key Public Health Challenges for Health-EDRM in the Twenty-First Century: Demographic and Epidemiological Transitions. In Public Health and Disasters; Springer: Singapore, 2020; pp. 19–38. [Google Scholar]
- Li, L.; Zhang, Q.; Wang, X.; Zhang, J.; Wang, T.; Gao, T.L.; Duan, W.; Tsoi, K.K.F.; Wang, F.Y. Characterizing the Propagation of Situational Information in Social Media during COVID-19 Epidemic: A Case Study on Weibo. IEEE Trans. Comput. Soc. Syst. 2020, 7, 556–562. [Google Scholar] [CrossRef]
- Allen, L.N.; Nicholson, B.D.; Yeung, B.Y.T.; Goiana-da-Silva, F. Implementation of non-communicable disease policies: A geopolitical analysis of 151 countries. Lancet Glob. Health 2020, 8, e50–e58. [Google Scholar] [CrossRef]
- McDonald, K.; Maurer, B.J. Familial aortic valve disease: Evidence for a genetic influence? Eur. Heart J. 1989, 10, 676–677. [Google Scholar] [CrossRef] [PubMed]
- American Diabetes Association. Diagnosis and classification of diabetes mellitus. Diabetes Care 2009, 32 (Suppl. 1), S62–S67. [Google Scholar] [CrossRef]
- Dreyer, M. Type 1 diabetes. Diabetologe 2019. [Google Scholar] [CrossRef]
- Chen, R.C.; Caraka, R.E.; Arnita, N.E.G.; Pomalingo, S.; Rachman, A.; Toharudin, T.; Tai, S.K.; Pardamean, B. An End to End of Scalable Tree Boosting System. Sylwan 2020, 165, 1–11. [Google Scholar]
- Nugroho, N.T.; Herten, M.; Osada, N.; Sielker, S.; Torsello, G.B. Correlation Among Six Single Nucleotide Polymorphisms Related to Cell Survival, Inflammation and Lipoprotein Regulation for Abdominal Aortic Aneurysm Risk Factor. J. Vasc. Surg. 2018, 67, e232–e233. [Google Scholar] [CrossRef]
- Caraka, R.E.; Nugroho, N.T.; Tai, S.-K.; Chen, R.C.; Toharudin, T.; Pardamean, B. Feature Importance of The Aortic Anatomy on Endovascular Aneurysm Repair (EVAR) using Boruta and Bayesian MCMC. Commun. Math. Biol. Neurosci. 2020, 2020, 1–23. [Google Scholar]
- Lederle, F.A. The Aneurysm Detection and Management Study Screening Program. Arch. Intern. Med. 2000, 160, 1425–1430. [Google Scholar] [CrossRef]
- Virdis, A.; Giannarelli, C.; Fritsch Neves, M.; Taddei, S.; Ghiadoni, L. Cigarette Smoking and Hypertension. Curr. Pharm. Des. 2010, 16, 2518–2525. [Google Scholar] [CrossRef]
- Budiarto, A.; Febriana, T.; Suparyanto, T.; Caraka, R.E.; Pardamean, B. Health Assistant Wearable-Based Data Science System Model: A Pilot Study. In Proceedings of the 2018 International Conference Information Management Technology (ICIMTech), Jakarta, Indonesia, 3–5 September 2018; pp. 438–442. [Google Scholar]
- Zhang, M.; Li, J.; Sun, H. The Experience and Enlightenment of the Reform and Development of Higher Engineering Education in Taiwan. In Proceedings of the 3rd International Conference on Education, Economics and Management Research 2019, Singapore, 29–30 November 2019; pp. 349–351. [Google Scholar]
- Kao, C.; Pao, H.L. An evaluation of research performance in management of 168 Taiwan universities. Scientometrics 2009, 78, 261–277. [Google Scholar] [CrossRef]
- Hou, A.Y.C.; Hill, C.; Hu, Z.; Lin, L. What is driving Taiwan government for policy change in higher education after the year of 2016–in search of egalitarianism or pursuit of academic excellence? Stud. High Educ. 2020. [Google Scholar] [CrossRef]
- Yu, T.-K.; Lavallee, J.P.; Giusto BDi Chang, I.-C.; Yu, T.-Y. Risk perception and response toward climate change for higher education students in Taiwan. Environ. Sci. Pollut. Res. 2020, 27, 24749–24759. [Google Scholar] [CrossRef] [PubMed]
- Sudiana, K.; Sule, E.T.; Soemaryani, I.; Yunizar, Y. The development and validation of the Penta Helix construct. Bus. Theory Pract. 2020, 21, 136–145. [Google Scholar] [CrossRef]
- Dong, R.; Li, L.; Zhang, Q.; Cai, G. Information Diffusion on Social Media during Natural Disasters. IEEE Trans. Comput. Soc. Syst. 2018, 5, 265–276. [Google Scholar] [CrossRef]
- De Carvalho, P.P.S.; De Araújo Kalid, R.; Rodríguez, J.L.M. Evaluation of the city logistics performance through structural equations model. IEEE Access 2019, 7, 121081–121094. [Google Scholar] [CrossRef]
- Yusra, Y.; Agus, A. Online Food Delivery Service Quality: Does Personal Innovativeness Matter? Asia Proc. Soc. Sci. 2018, 2, 251–255. [Google Scholar] [CrossRef]
- Yusra, Y.; Agus, A. The influence of perceived service quality towards customer satisfaction and Loyalty in Airasia self check-in system. J. Soc. Sci. Res. 2018, 766–775. [Google Scholar] [CrossRef]
- Yusra, Y.; Agus, A. The influence of online food delivery service quality on customer satisfaction and customer loyalty: The role of personal innovativeness. J. Environ. Treat. Tech. 2020, 8, 6–12. [Google Scholar]
- Irfan, M.; Hassan, M.; Hassan, N. The effect of project management capabilities on project success in Pakistan: An empirical investigation. IEEE Access 2019, 7, 39417–39431. [Google Scholar] [CrossRef]
- Kurniawan, R.; Siagian, T.H.; Yuniarto, B.; Nasution, B.I.; Caraka, R.E. Construction of social vulnerability index in Indonesia using partial least squares structural equation modeling. Int. J. Eng. Technol. 2018, 7, 6131–6136. [Google Scholar]
- Binsawad, M.H. Corporate Social Responsibility in Higher Education: A PLS-SEM Neural Network Approach. IEEE Access 2020, 8, 29125–29131. [Google Scholar] [CrossRef]
- Gio, P.U.; Caraka, R.E. Membuat Berbagai Grafik Dengan Statcal-Visualization; Qiara Media: Provinsi Jawa Timur, Indonesia, 2020; ISBN 9786237925590. [Google Scholar]
- Sutiksno, D.U.; Gio, P.U.; Caraka, R.E.; Ahmar, A.S. Brief Overview of STATCAL Statistical Application Program. J. Phys. Conf. Ser. 2018, 1028, 012244. [Google Scholar] [CrossRef]
- Lee, Y.; Rönnegård, L.; Noh, M. Data Analysis Using Hierarchical Generalized Linear Models with R, 1st ed.Chapman and Hall/CRC: London, UK, 2017; Available online: https://doi.org/10.1201/9781315211060 (accessed on 24 December 2020).
- Jin, S.; Noh, M.; Lee, Y. H-Likelihood Approach to Factor Analysis for Ordinal Data. Struct. Equ. Model. Multidiscip. J. 2018, 25, 530–540. [Google Scholar] [CrossRef]
- Jin, S.; Noh, M.; Yang-Wallentin, F.; Lee, Y. Robust nonlinear structural equation modeling with interaction between exogenous and endogenous latent variables. Struct. Equ. Model. Multidiscip. J. 2021. [CrossRef]
- Jin, S. Essays on Estimation Methods for Factor Models and Structural Equation Models. Digital Comprehensive Summaries of Uppsala Dissertations from the Faculty of Social Sciences. Ph.D. Thesis, University of Uppsala, Uppsala, Swenden, 2015. [Google Scholar]
- Ketchen, D.J. A Primer on Partial Least Squares Structural Equation Modeling; Sage Publications: London, UK, 2013. [Google Scholar]
- Tenenhaus, M. Component-based structural equation modelling. Total Qual. Manag. 2008, 19, 871–886. [Google Scholar] [CrossRef]
- Noh, M.; Lee, Y.; Oud, J.H.L.; Toharudin, T. Hierarchical likelihood approach to non-Gaussian factor analysis. J. Stat. Comput. Simul. 2019, 89, 1555–1573. [Google Scholar] [CrossRef]
- Hui, F.K.C.; Warton, D.I.; Ormerod, J.T.; Haapaniemi, V.; Taskinen, S. Variational Approximations for Generalized Linear Latent Variable Models. J. Comput. Graph. Stat. 2017, 26, 35–43. [Google Scholar] [CrossRef]
- Leguina, A. A primer on partial least squares structural equation modeling (PLS-SEM). Int. J. Res. Method Educ. 2015, 38, 220–221. [Google Scholar] [CrossRef]
- Agustina, R.; Dartanto, T.; Sitompul, R.; Susiloretni, K.A.; Achadi, E.L.; Taher, A.; Wirawan, F.; Sungkar, S.; Sudarmono, P.; Shankar, A.H.; et al. Universal health coverage in Indonesia: Concept, progress, and challenges. Lancet 2019, 393, 75–102. [Google Scholar] [CrossRef]
- Dartanto, T.; Rezki, J.F.; Pramono, W.; Siregar, C.H.; Bintara, U.; Bintara, H. Participation of Informal Sector Workers in Indonesia’s National Health Insurance System. J. Southeast Asian Econ. 2016, 33, 317–342. [Google Scholar]
- Martini, L.; Tjakraatmadja, J.H.; Anggoro, Y.; Pritasari, A.; Hutapea, L. Triple Helix Collaboration to Develop Economic Corridors as Knowledge Hub in Indonesia. Procedia Soc. Behav. Sci. 2012, 52, 130–139. [Google Scholar] [CrossRef][Green Version]
- Gaillard, S.; Roche, L.; Deschênes, G.; Morin, D.; Vianey-Saban, C.; Acquaviva-Bourdain, C.; Nony, P.; Subtil, F.; Mercier, C.; Cochat, P.; et al. Collaboration between academics, small pharmaceutical company and patient organizations in the development of a new formulation of cysteamine in nephropathic cystinosis: A successful story. Therapies 2020, 75, 169–173. [Google Scholar] [CrossRef]
- Hagglund, K.J.; Deuser, W.E.; Buckelew, S.P.; Hewett, J.; Kay, D.R. Weather, beliefs about weather, and disease severity among patients with fibromyalgia. Arthritis Rheum. 1994, 7, 130–135. [Google Scholar] [CrossRef]
- Jackson, M.L.; Hart, G.R.; McCulloch, D.J.; Adler, A.; Brandstetter, E.; Fay, K.; Han, P.; Lacombe, K.; Lee, J.; Sibley, T.; et al. Effects of weather-related social distancing on city-scale transmission of respiratory viruses. medRxiv 2020, 5. [Google Scholar] [CrossRef]
- Nawaz, Z. Emerging Infectious Diseases and Flu, Coronavirus and Allergy. Emerg. Infect. Dis. Diagn. 2020, 2, 1–4. [Google Scholar]
- Hsih, W.H.; Cheng, M.Y.; Ho, M.W.; Chou, C.H.; Lin, P.C.; Chi, C.Y.; Liao, W.C.; Chen, C.Y.; Leong, L.Y.; Tien, N.; et al. Featuring COVID-19 cases via screening symptomatic patients with epidemiologic link during flu season in a medical center of central Taiwan. J. Microbiol. Immunol. Infect. 2020, 53, 459–466. [Google Scholar] [CrossRef] [PubMed]
- Skrondal, A.; Rabe-Hesketh, S. Some Applications of Generalized Linear Latent and Mixed Models in Epidemiology. Nor. Epidemiol. 2003, 13, 265–278. [Google Scholar]
- Herliansyah, R.; Fitria, I. Latent variable models for multi-species counts modeling in ecology. Biodivers. J. Biol. Divers. 2018, 19, 1871–1876. [Google Scholar] [CrossRef]
- Caraka, R.E.; Shohaimi, S.; Kurniawan, I.D.; Herliansyah, R.; Budiarto, A.; Sari, S.P.; Pardamean, B. Ecological Show Cave and Wild Cave: Negative Binomial Gllvm’s Arthropod Community Modelling. Procedia Comput. Sci. 2018, 135, 377–384. [Google Scholar] [CrossRef]
- Niku, J.; Hui, F.K.C.; Taskinen, S.; Warton, D.I. gllvm: Fast analysis of multivariate abundance data with generalized linear latent variable models in r. Methods Ecol. Evol. 2019, 10, 2173–2182. [Google Scholar] [CrossRef]
- Lee, Y.; Nelder, J.A. Hierarchical Generalized Linear Models. J. R. Stat. Soc. Ser. B 1996, 58, 619–656. [Google Scholar] [CrossRef]
- Jin, S.; Lee, Y. A review of h-likelihood and hierarchical generalized linear model. Wiley Interdiscip. Rev. Comput. Stat. 2020, e1527. [Google Scholar] [CrossRef]
- Caraka, R.E.; Lee, Y.; Chen, R.C.; Toharudin, T. Using Hierarchical Likelihood Towards Support Vector Machine: Theory and Its Application. IEEE Access 2020, 8, 194795–194807. [Google Scholar] [CrossRef]
- Lee, Y.; Noh, M. Package ‘dhglm’. Appl. Stat. 2015, 55, 139–185. [Google Scholar]
- Noh, M.; Ok, Y.J.; Na, M.H.; Ng, C.T. Analysis of degradation data using double hierarchical generalized linear model. Korean Data Inf. Sci. Soc. 2018, 29, 217–228. [Google Scholar]


| Latent Variable | Dillon–Goldstein’s rho |
|---|---|
| Climate | 0.640 |
| Social | 0.864 |
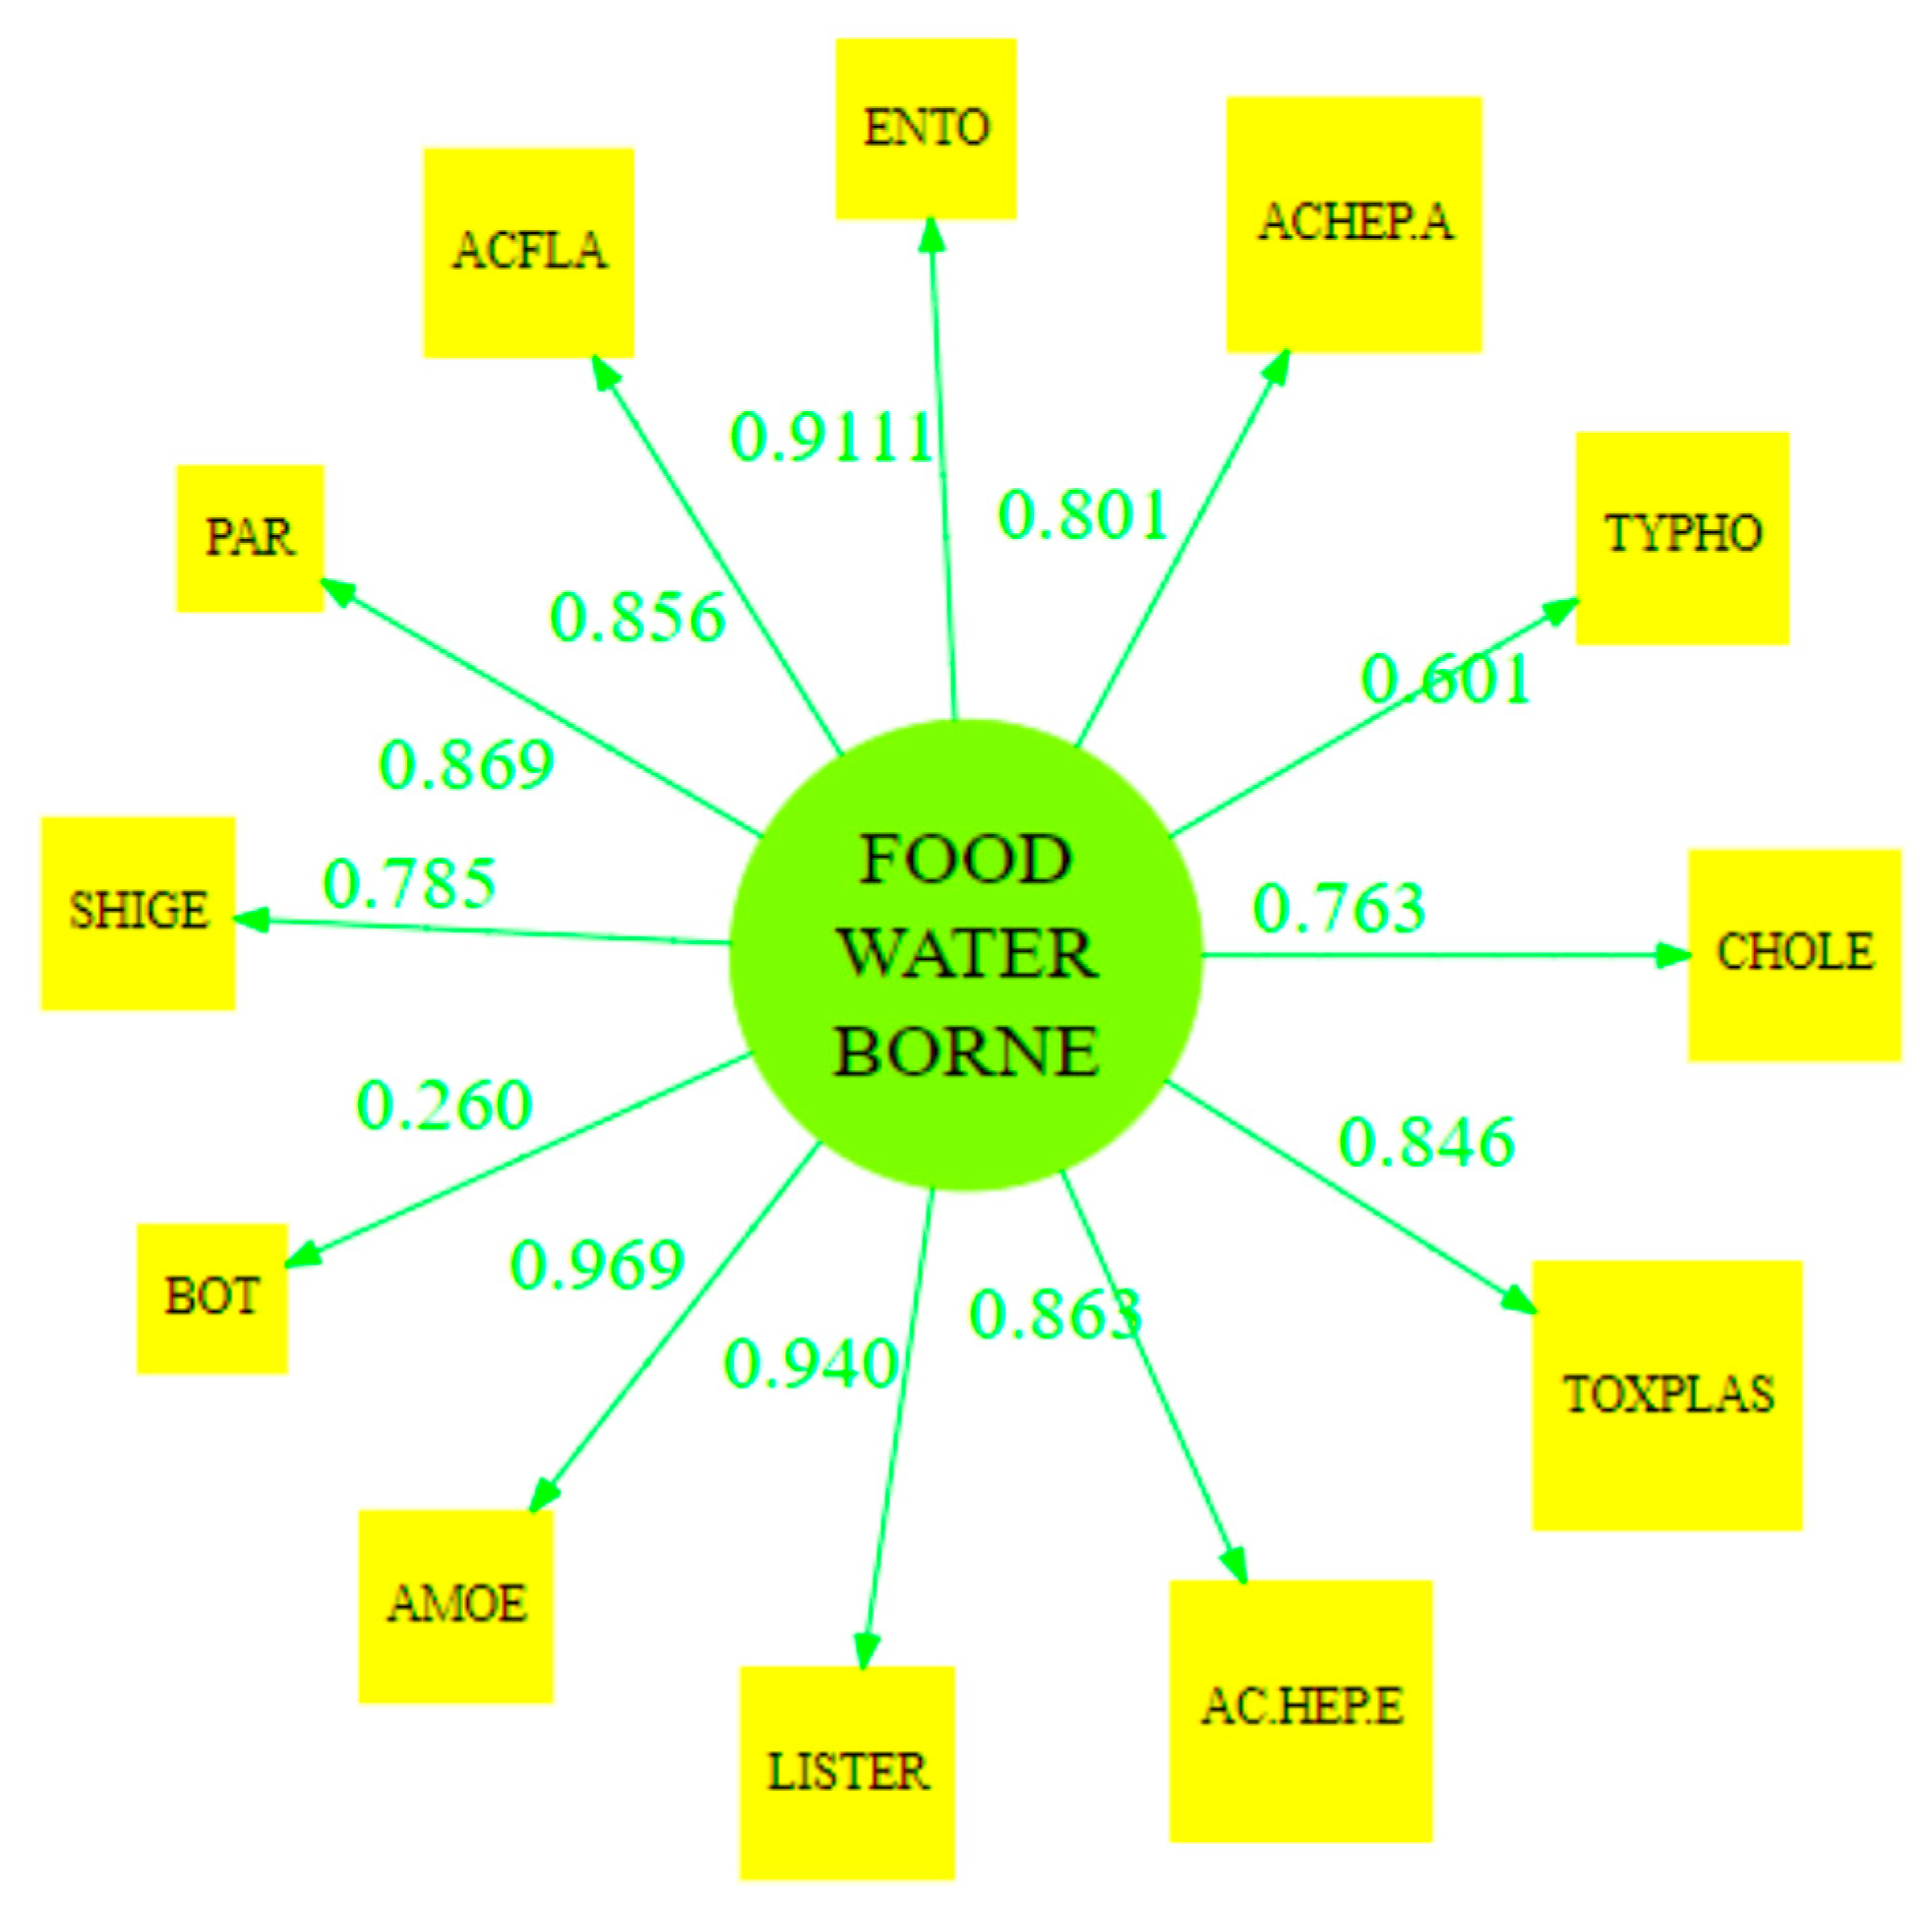
| Food Water Borne | 0.957 |
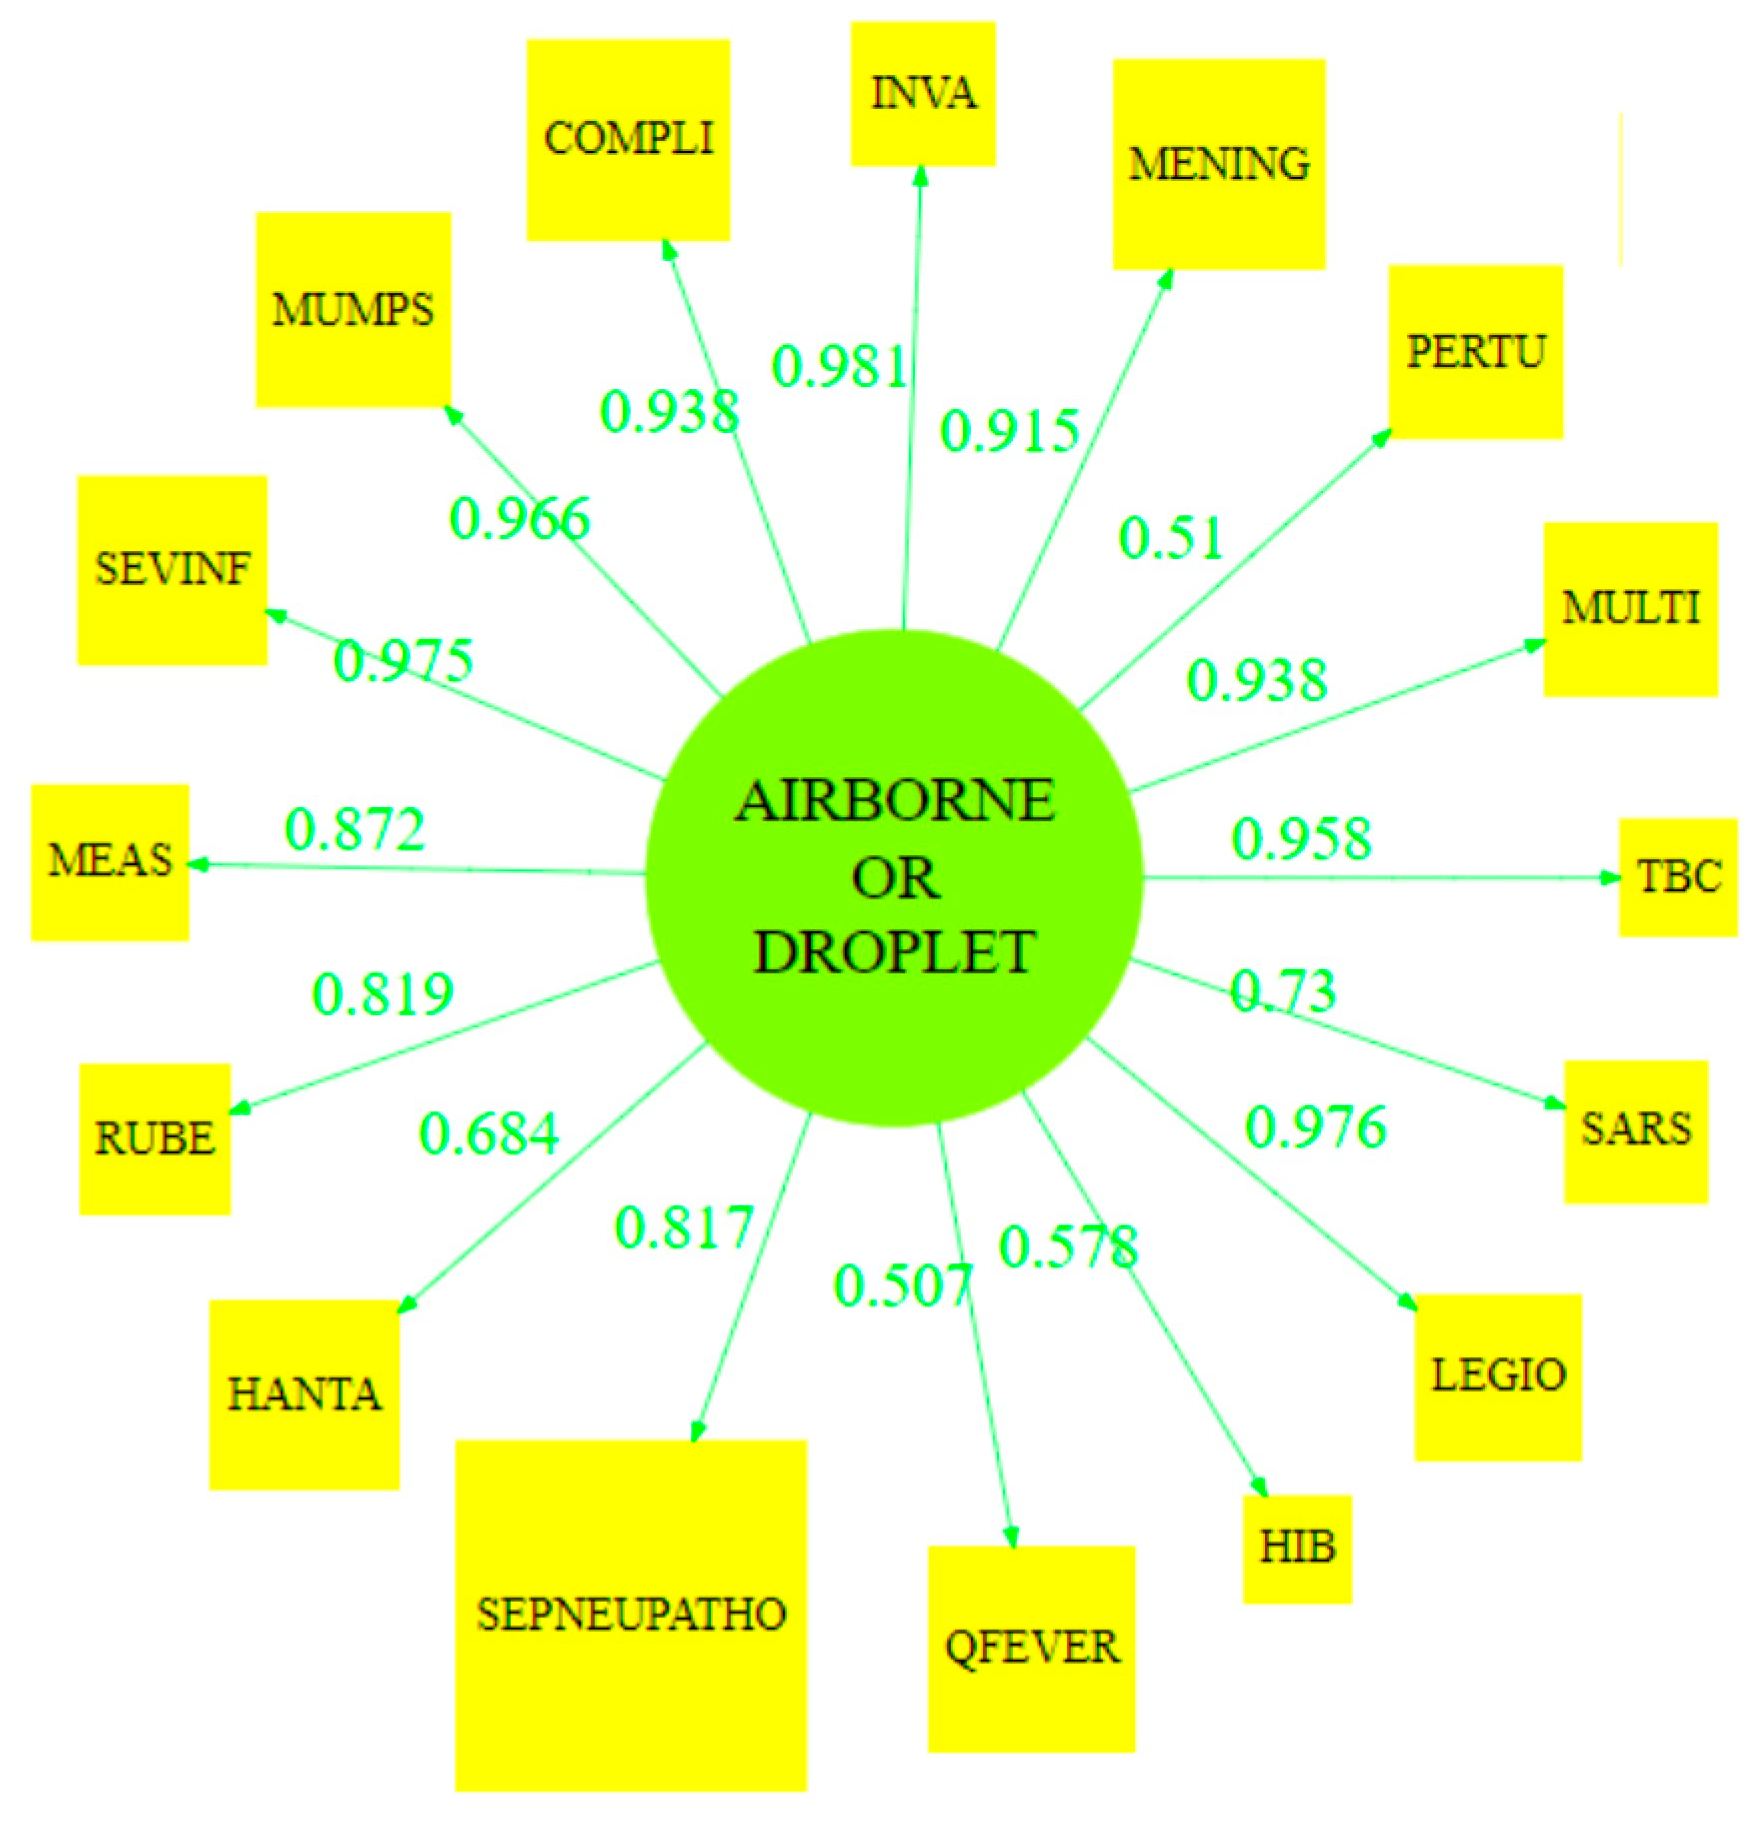
| Airborne or Droplet | 0.975 |
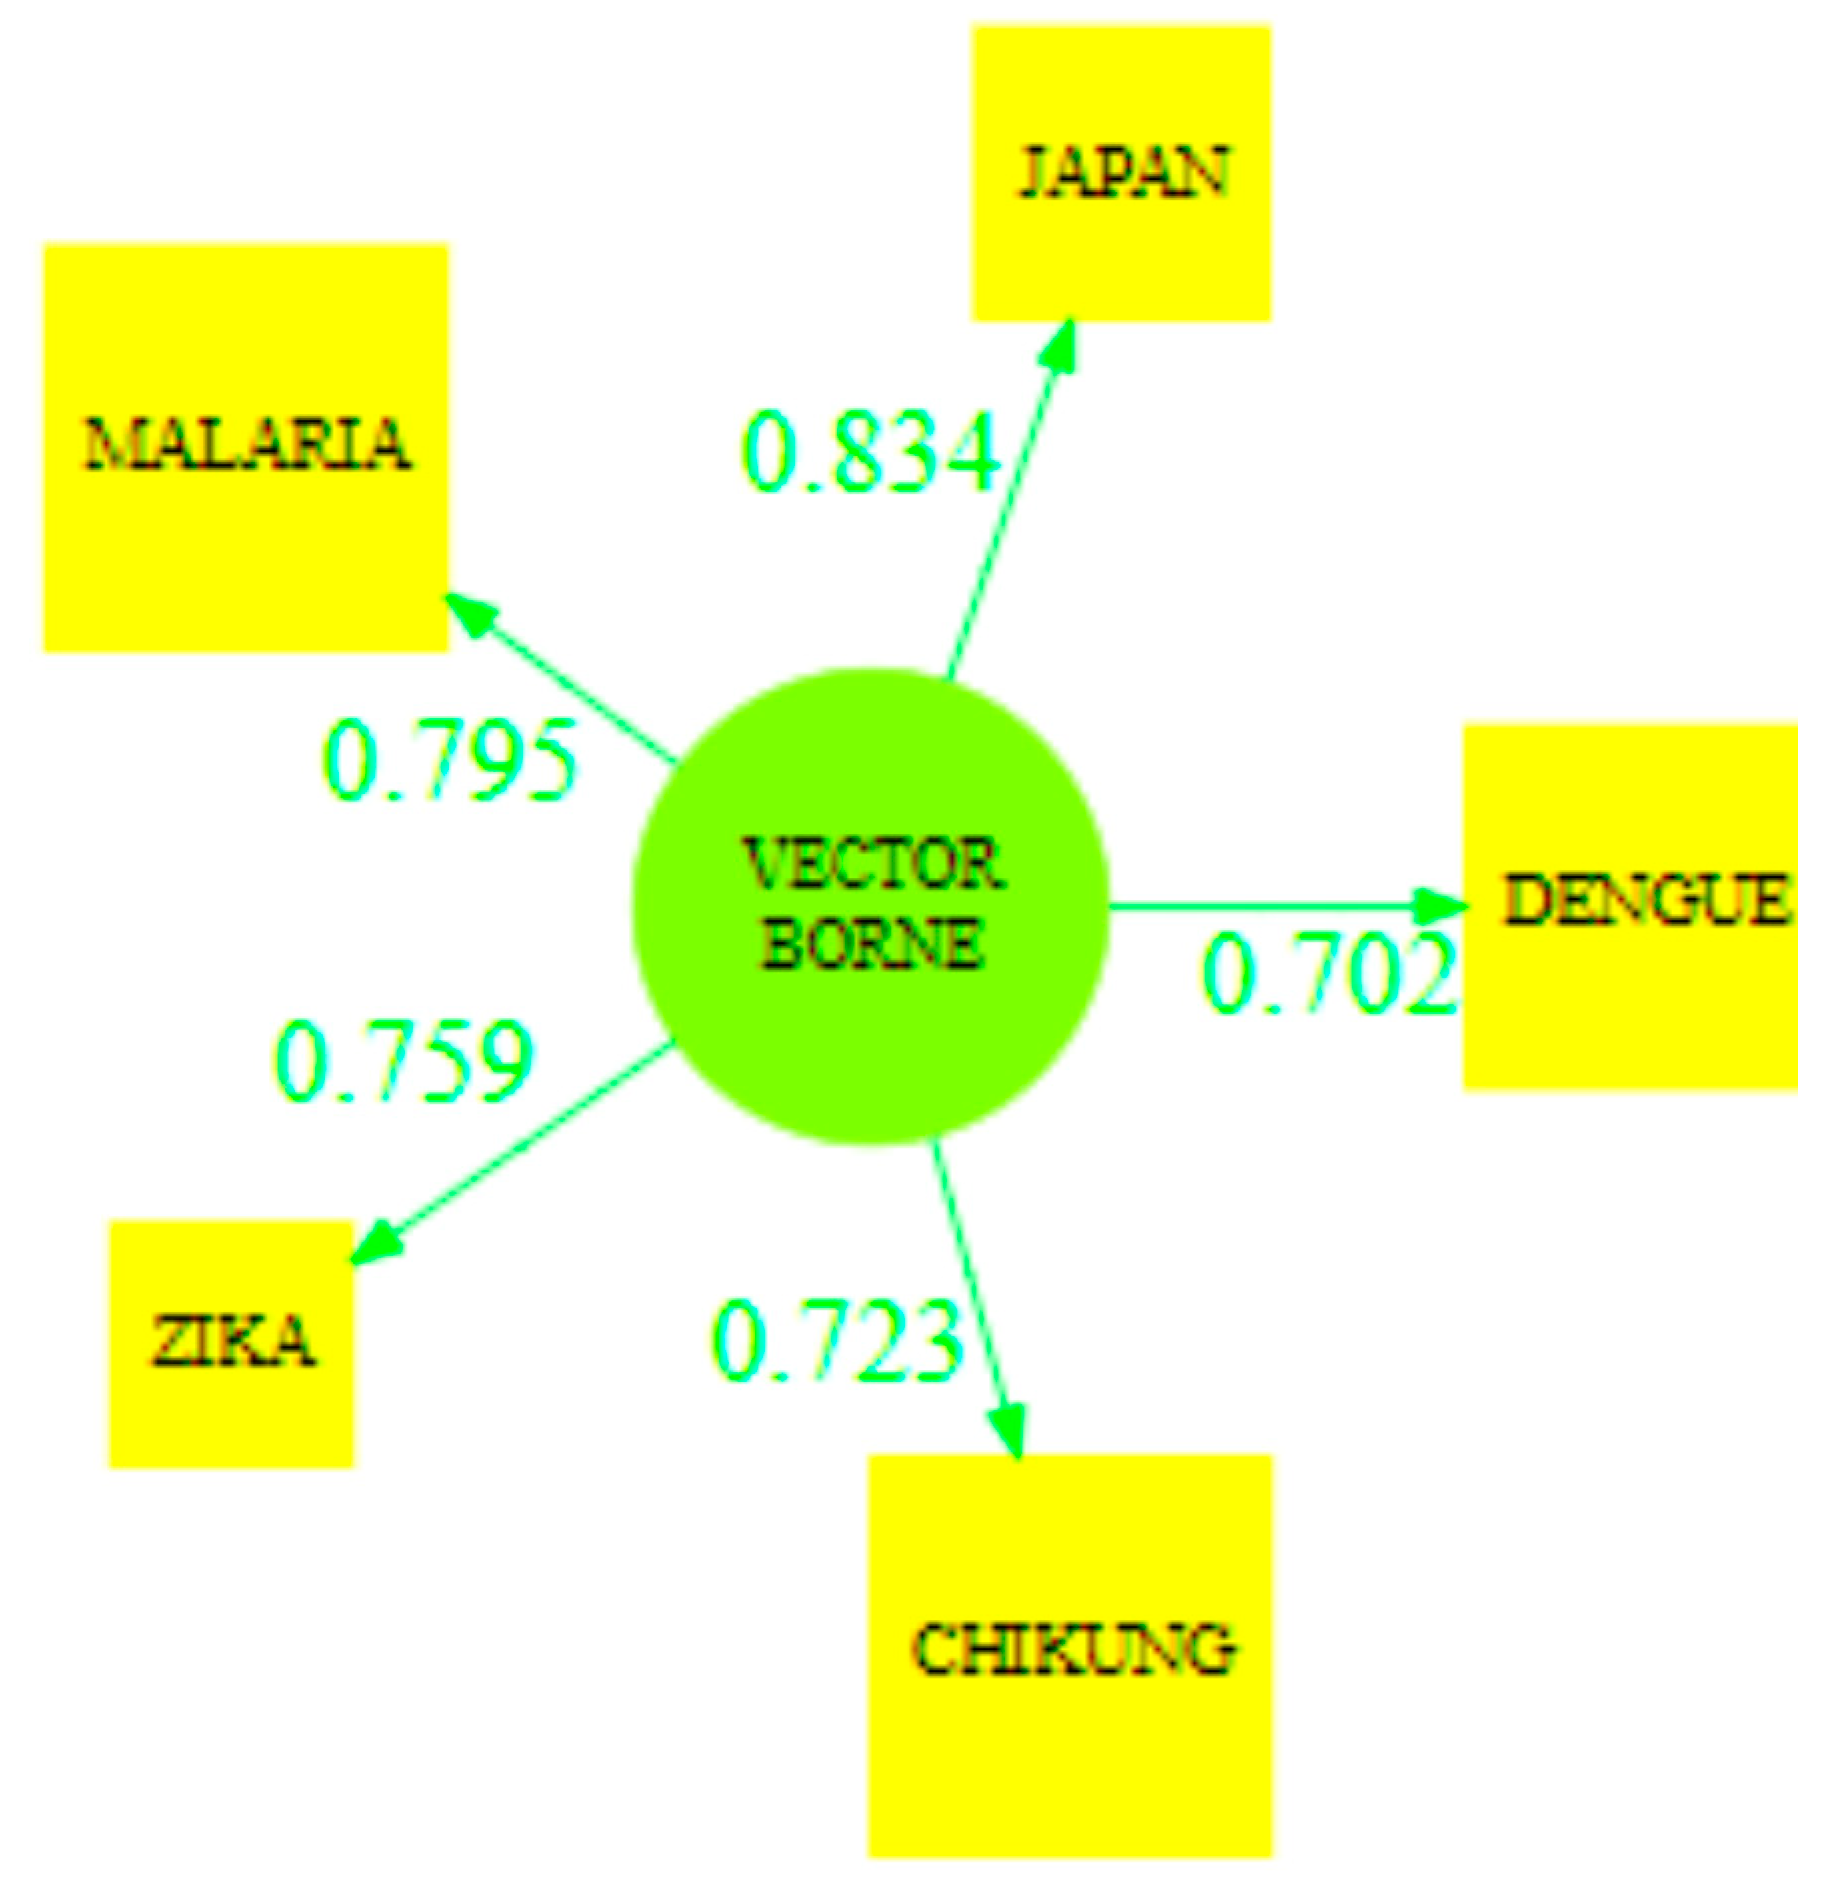
| Vector Borne | 0.886 |
| Sexually Transmitted or Blood Borne | 0.977 |
| Contact Transmission | 0.862 |
Publisher’s Note: MDPI stays neutral with regard to jurisdictional claims in published maps and institutional affiliations. |
© 2021 by the authors. Licensee MDPI, Basel, Switzerland. This article is an open access article distributed under the terms and conditions of the Creative Commons Attribution (CC BY) license (https://creativecommons.org/licenses/by/4.0/).
Share and Cite
Caraka, R.E.; Noh, M.; Chen, R.-C.; Lee, Y.; Gio, P.U.; Pardamean, B. Connecting Climate and Communicable Disease to Penta Helix Using Hierarchical Likelihood Structural Equation Modelling. Symmetry 2021, 13, 657. https://doi.org/10.3390/sym13040657
Caraka RE, Noh M, Chen R-C, Lee Y, Gio PU, Pardamean B. Connecting Climate and Communicable Disease to Penta Helix Using Hierarchical Likelihood Structural Equation Modelling. Symmetry. 2021; 13(4):657. https://doi.org/10.3390/sym13040657
Chicago/Turabian StyleCaraka, Rezzy Eko, Maengseok Noh, Rung-Ching Chen, Youngjo Lee, Prana Ugiana Gio, and Bens Pardamean. 2021. "Connecting Climate and Communicable Disease to Penta Helix Using Hierarchical Likelihood Structural Equation Modelling" Symmetry 13, no. 4: 657. https://doi.org/10.3390/sym13040657
APA StyleCaraka, R. E., Noh, M., Chen, R.-C., Lee, Y., Gio, P. U., & Pardamean, B. (2021). Connecting Climate and Communicable Disease to Penta Helix Using Hierarchical Likelihood Structural Equation Modelling. Symmetry, 13(4), 657. https://doi.org/10.3390/sym13040657