Abstract
Leaf area is among the most important leaf functional traits, and it determines leaf temperature and alters light harvesting. The calculation of individual leaf area is the basis of calculating the leaf area index (i.e., the total leaf area per unit ground area) that is directly associated with the ability of plants to intercept light for photosynthesis. It is valuable to provide a fast and reliable approach to measuring leaf area. Here, we examined the validity and calculation accuracy of the Montgomery equation (ME), which describes the area of a leaf as a product of leaf length, width and a specific coefficient referred to as the Montgomery parameter, MP. Using ME, we calculated leaf areas of different age groups of bamboo culms. For most broad-leaved plants, leaf area is proportional to the product of leaf length and width, and MP falls within a range of 1/2 to π/4, depending on leaf shape. However, it is unknown whether there is an intra-specific variation in MP resulting from age structure and whether such a variation can significantly reduce the predictability of ME in calculating leaf area. This is relevant as a population of perennial plants usually composes of different age groups. We used Moso bamboos as model as this species is of ecological and economic importance in southern China, and pure stands can cover six to seven plant age groups. We used five age groups of moso bamboo and sampled 260–380 leaves for each group to test whether ME holds true for each group and all groups combined, whether there are significant differences in MP among different age groups, and whether the differences in MP can lead to large prediction errors for leaf area. We observed that for each age group and all groups combined, there were significant proportional relationships between leaf area and the product of leaf length and width. There were small but significant differences in MP among the five age groups (MP values ranged from 0.6738 to 0.7116 for individual plant ages; MP = 0.6936 for all age groups combined), which can be accounted for by the minor intergroup variation of leaf shape (reflected by the leaf width/length ratio). For all age classes, MP estimated for the pooled data resulted in <4% mean absolute percentage error, indicating that the effect of variation in MP among different age groups was small. We conclude that ME can serve as a useful tool for accurate calculations of leaf area in moso bamboo independent of culm age, which is valuable for estimation of leaf area index as well as evaluating the productivity and carbon sequestration capacity of bamboo forests.
1. Introduction
The number of leaves and leaf area are important indices of whole plant carbon capture for plants [1,2,3]. Individual leaf area is affected not only by its spatial position in a plant but also by biological and environmental factors including plant age, competition, temperature, precipitation, etc. [4,5]. Leaf area also reflects the trade-off between the cost and benefit in support economics of plants [6], and it has a scaling relationship with the investments of dry mass needed to construct leaf photosynthetic apparatus, but also with investments to support the leaf in specific position in the canopy [7,8,9]. Saplings usually have a smaller scaling exponent of leaf mass vs. area than adults. This allows younger trees to have larger leaf area and grow faster to accumulate more dry material during the growth season [9,10,11]. The quotient of leaf dry mass and leaf area (LMA) is intimately associated with life forms of plants and climate, especially with precipitation and solar radiation [12,13].
In studies looking at dynamic changes in plant physiological activity and growth through plant ontogeny, leaf area usually needs be continuously measured. Thus, it is important to use a non-destructive approach for regular assessment of change in leaf area. In addition, the calculation of individual leaf area is the basis of total leaf area per plant, and the latter is directly related to the leaf area index (the total area per unit ground area) that is an important plant functional trait [14,15]. The leaf area index has been considered as an indicator of the amount of light interception of plants [16]. Although there exist some complex mathematical models developed for calculation of individual leaf area [17,18,19], application of these is not always practical. In fact, recent studies have demonstrated that a simple equation proposed by Montgomery [20] to describe a proportional relationship between leaf area (A) and the product of leaf length (L) and width (W) of corn (Zea mays), can serve as a general method to estimate leaf area for a large number of broad-leaved plants [21,22,23,24,25,26,27]. Shi et al. [24] found that the proportional equation proposed by Montgomery [20] (referred to further as the Montgomery equation, ME) was valid for calculation of A for a large number of woody plants and herbs belonging to the families Hamamelidaceae, Lauraceae, Magnoliaceae, Oleaceae, Poaceae and Rosaceae. However, the generality of ME for the calculation of A was somewhat uncertain considering that most species used by Shi et al. [24] had non-lobed leaf shapes. Yu et al. [27] choose 15 species of vines with diverse leaf shapes and further tested the validity of ME. With this diverse dataset they confirmed the broad applicability of ME across species with different leaf shapes. In addition, these two studies found that the proportionality coefficients (referred to as the Montgomery parameter, MP) for A vs. LW relationships fell in a narrow range of 1/2 to π/4, i.e., the two ends of this range correspond to triangular and elliptic leaves. On the other hand, use of linear dimensions, L and W for the prediction of A depends on leaf shape, i.e., on the extent of variation in the W/L ratio [28]. Shi et al. [25] choose 101 bamboo species, cultivars, forms and varieties with 90–110 leaves for each taxon to test the influence of the variation in W/L ratio on the goodness of fit of on a log-log plot. The shape of the leaves of different bamboo taxa is very similar, and the difference in leaf shape has been proved to reflect the variation in W/L ratio [29]. In fact, the shape of bamboo leaves can be described by using a two-parameter polar coordinate equation [3,18,30]. Shi et al. [25] found that the prediction errors in A derived from the relationship were strongly correlated with the coefficient of variation in the W/L ratio for 101 datasets of bamboo taxa (r = 0.949; p < 0.01). The estimated MP values fell into a range of 0.62 to 0.78. However, the above studies have largely neglected the possible influence of the intraspecific variation in MP on the prediction errors of leaf area using ME.
Natural or semi-natural plant population are composed of individuals of different ages [31]. The age structure of a population can affect the photosynthetic capacity and productivity of forests to a large degree [32,33,34]. If old age groups account for a larger proportion of stand basal area, the productivity of this stand per unit stand leaf area is lower than that of a younger stand with an equivalent leaf area [35]. Also, the culm age has been demonstrated to significantly affect the anatomical characteristics (the length, double-wall thickness and lumen diamater of the fiber) of a bamboo plant [36]. However, whether culm age can affect the shape of bamboo leaves and the measurment of leaf area has not been studied.
Moso bamboo (Phyllostachys edulis (Carriere) J. Houzeau), is a widely distributed early-successional species in subtropical regions of East Asia, especially in China [37]. Moso bamboo is an economically important species with a broad use in landscape, industrial, and daily life [38]. Large areas of moso bamboo forests have contributed greatly to local ecology and economical development in southern China [39,40]. It is economcially and physically feasible to use moso bamboo as a substitute of woody resources due to its excellent bio-mechanical characteristics and fibre properties [39,41,42].
Moso bamboo forests typically consist of several age groups that can be up to 12 to 14 years old [43]. This plant usually forms shoots every second year, but fertilization can result in continuous formation of bamboo shoots [39]. This means that moso bamboo forests can include up to 6–7 age groups. Bamboo leaves are perennial, but their life span has not been studied extensively. Although Shi et al. [25] studied 101 bamboo taxa, the influence of the intra-specific variation in plant age on the calculation accuracy of ME was largely ignored.
In this study, we measured leaf characteristics of bamboo leaves of five age groups to explore: (1) whether ME holds for the leaves of each age group; (2) if ME holds true, whether there are significant differences in the estimated MP values among the five age groups; (3) if the differences of the estimated MP values are significant, whether these differences are large enough to warrant use different MP values to estimate leaf area of plants of different age. Understanding age-specific variation in MP is relevant as in natural conditions, it is often not possible to estimate plant age; however, when the age effects are large, this could result in overly large errors in use of ME for estimation of leaf area.
2. Materials and Methods
2.1. Site Description
The study site is located in Purple Mountain of Nanjing, Jiangsu Province, China (118°49′2″ E, 32°4′17″ N), where moso bamboo plantations date back to 1992. By 2009, due to poor management, including lack of weed removal in the early growth stage, lack of thinning and fertilizer addition, moso bamboo had become ecologically and economically unimportant at the study site. Between 2011–2014, site management was radically changed to improve the mean individual biomass of moso bamboo. The management practices included: (1) regular weed removal in May and July; (2) use of compound fertilizers in June and September, and cake fertilizers in November/December; (3) thinning of bamboo plantations in December of 2012 and 2014 and in January of 2011 and 2013. From 2015 on, new bamboo shoots were not cut off again, and no fertilizers were used. In 2016, moso bamboo forests had grown better, and the mean (±SE) culm diameter at breast height (DBH) was 9.19 ± 1.49 cm, significantly larger than mean DBH in previous years (= 8.5 ± 1.54 cm) (p = 0.0238 < 0.05).
Every year some culms of bamboo shoots were marked by a water-resistant marker at every year, allowing reliable identification of the age of bamboo shoots (see Figure 1 for details). At the time of leaf sampling in early August 2020, there were five age groups of moso bamboo that had grown in 2014, 2015, 2016, 2018 and 2020. Years 2017 and 2019 were left out, because it was difficult to find bamboo culms developed in these years.
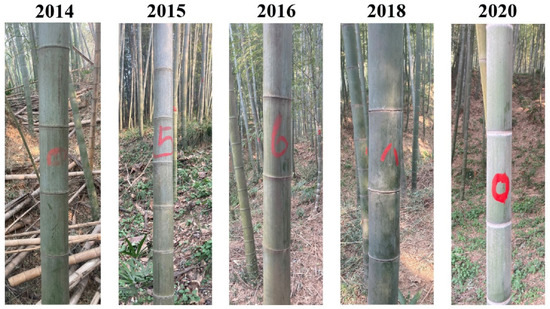
Figure 1.
Examples of the five age groups of moso bamboo culms in Purple Mountain, Nanjing of China.
2.2. Leaf Collection and Image Processing
We sampled 260–480 leaves from 5–10 individuals for each age group on 3 August 2020. Leaves grown in the lower canopy of each individual were taken randomly from a pool of different-aged leaves to obtain a representative leaf sample for each bamboo age group. For bamboo grown in 2020, all leaves taken were new leaves formed in that year. Fresh leaves were wrapped in wet paper, enclosed in transparent plastic self-sealing bags (28 cm × 20 cm) and transported to the laboratory for the measurements.
The leaves were scanned with an Epson scanner (V550, Epson, Batam, Indonesia) at a 600 dpi resolution. Scanned images were used to measure leaf width (W), length (L), and area (A) using our developed MATLAB (version ≥ 2009a) procedure and R script (based on R version 4.0.2) [30,44,45]. The raw data of leaf area, length, and width of the five groups of moso bamboo can be found in the online Supplementary Table S1.
2.3. Statistical Analyses
We tested the significance of differences in W, L, W/L ratio, and A between the age groups by ANOVA followed by the Tukey’s Honest Significant Difference (HSD) test at 0.05 significant level [46].
The Montgomery equation (ME) was fitted to the data:
where MP denotes the Montgomery parater. To stablilize the variance of the response variable [24,25,27], we used the log-transformation of both sides of Equation (1):
which can be rewritten as:
where the intercept a is the log-transformation of MP. A least-squares fit to the data was used to estimate the intercept for the data of each age group.
The root-mean-square error (RMSE) was used to measure the goodness of fit for leaf area (A), which equals:
where n represents the sample size, i.e., the number of leaves; the subscript i represents the i-th leaf; represents the predicted value, and the observed value. In addition, the scaling relationships between L and A, and between W and A were fitted using the log-transformed data to check whether the two one-dimensional leaf measures (L and W) have similar goodness of fit in scaling relationships with A.
Here, , , and are the parameters to be fitted. RMSE values were used to compare the two scaling relationships.
To test the significance of the difference between any two groups in the estimated MP values, a bootstrap percentile method was used to calculate the 95% confidence intervals (CI) of the differences between two groups of replicates of MP [47,48]. If CI includes 0, there is no significant difference; alternatively, the MP values are significantly different.
To measure the influence of the intra-specific varition in MP on the calculation error of A, we estimated the mean absolute percentage error (MAPE in %) of n leaves using the fitted MP value:
3. Results
Mean leaf width (W), length (L), W/L ratio, and area differed among several plant age groups (Figure 2), but there was no clear relationship with plant age. Group 2014 had the largest leaf width, length, and area, but its mean W/L ratio was lower than that of group 2018. Although group 2016 had the second largest mean leaf width and area and the largest mean leaf length (having no significant difference with that of group 2014), its mean W/L ratio was the second smallest among the five age groups.
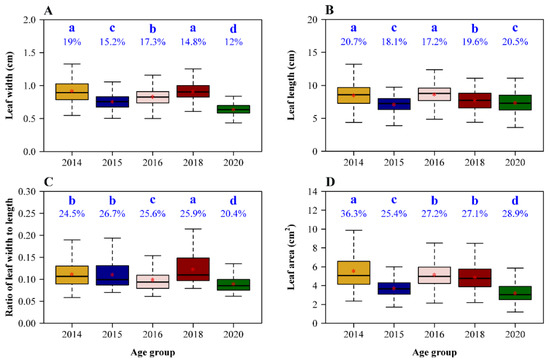
Figure 2.
Comparisons of leaf widths (A), lengths (B), leaf width/length ratios (C), and area (D) among the five age groups of moso bamboo. The medians were represented by the bold segments in the boxes; the means were represented by red stars close to the medians. The percentages on the whiskers of the boxes in the four panels represent the coefficients of variation (in %) of the corresponding response variable. The same letters above the percentages represent no significant differences; different letters above the percentages represent significant differences.
The Montgomery equaiton (ME) was confirmed to be valid for each plant age group, and the RMSE values for all the five age groups and all groups combined were all smaller than 0.04 (Figure 3), indicating a good fit for each group and all groups combined. The estimated MP values including the corresponding 95% confidence intervals (CIs) for all groups ranged from 0.67 to 0.72 (Figure 3). The pooled data of the five age groups also showed a good fit (with RMSE = 0.04 and r2 = 0.9892). For each group, the RMSE value of ME was lower than that of the scalings of A vs. L and A vs. W (Table 1). This means that using two linear leaf dimensions, L and W, for calculation of A was superior to the use of only either L or W. The RMSE value of the scaling of A vs. L was smaller than that of A vs. W, indicating that L had a stronger scaling relationship with A than W. This reflects a smaller range of variation in W in different-sized leaves than in L (which were refelcted by the coefficients of variation shown in Figure 2A,B).
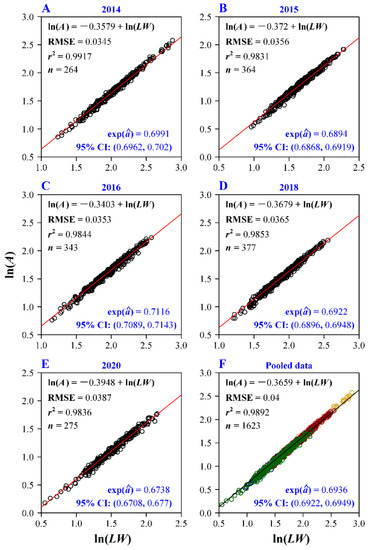
Figure 3.
Fitted results of the Montgomery equation (ME) for the five age groups and their pooled data on a log-log plot. The root-mean-square error (RMSE), the coefficient of determination (r2), the sample size (n, i.e., the number of data points), the estimate of the Montgomery parameter (i.e., exp()) and the corresponding 95% confidence intervals (CI) were showed in each panel. Different colors represent the data of different age groups.

Table 1.
Comparison of the goodness of fit for three models of calculating leaf area.
Comparison of estimated MP values among plant ages indicated that group 2016 had the largest, and group 2020 the smallest MP (Figure 4). The MP values for 2015 and 2018 groups did not differ. When using the MP value for the pooled data, which was 0.6936, there were small changes in the mean absolute precentage errors (MAPE2) for groups 2014, 2015 and 2018 compared with the mean absolute precentage errors (MAPE1) obtained when MP was individually fitted to each plant age group (Table 2). Large differences among MAPE2 and MAPE1 were observed for groups 2016 and 2020, but for both groups MAPE2 values were smaller than 4%. Given that the MP value based on the pooled data resulted in <4% mean absolute percentage error, reliable leaf area calculation does not require application of separate fiting equations for different plant age groups.
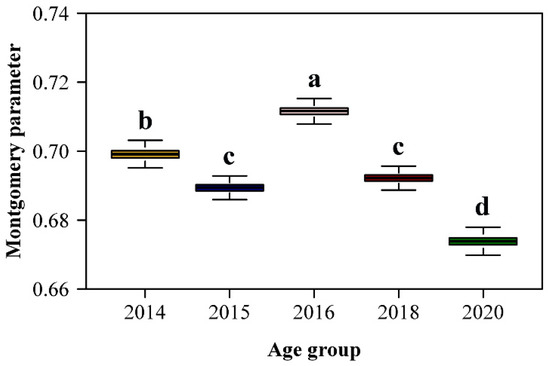
Figure 4.
Comparison of the estimated Montgomery parameters (MP) among the five age groups of moso bamboo. The letters above the whiskers of the boxes were used to show the significance of the difference in the estimates of MP between any two age groups. The replicates of MP for each group were obtained using 4000 bootstrapping iterations.
Table 2.
Mean absolute percentage errors for the calculation of leaf area of moso bamboo.
4. Discussion
Previous studies have shown that the prediction accuracy based on the scaling of leaf area (A) vs. leaf width (W) is usually lower than that of A vs. leaf length (L) [24,49]. Our results show that relative to W, L has a stronger scaling relaitionship with A, which is in accordence with those of previous studies (Table 1). The difference in the scaling relationships between two leaf one-dimensional measures and A reflected a difference of the W/L ratio. Leaf shape can be well quantified by its fractal dimension and the W/L ratio, and there was a significant correlation between the two indices [50]. Although leaf shape does not directly determine leaf size, it can largely affect the Montgomery parameter (MP) [27]. This means that the calculation of A largely depends on leaf shape. The leaf shapes of bamboo leaves have been demonstrated to be well described by a two-parameter polar coordinate equation [3,51]. The two parameters in the polar coordinate equation can be re-expressed by L and W, and regardless of the variation in the W/L ratio the theortical A based on that polar coordinate equaiton has been demonstrated to be proporional to the product of L and W, which is exactly the same as the Montgomery equation [30,45]. However, the mean W/L ratios and their extents of variation were not completely proportional (Figure 2C), which resulted in the differences in the estimated MP values (Figure 4).
In our study site, the management patterns of moso bamboo forests were not equal across the different years, which should have influenced the mean individual biomass of moso bamboo. In addition, the individual positions of moso bamboo and inter-annual differences in temperature and precipitation can also cause the differences in the mean individual biomass [52]. Leaf biomass scales with the aboveground biomass of plants [53], which further affects mean leaf size and shape. However, these differences did not lead to large calculation errors of leaf area among different age groups. The estimated MP value for all groups combined was equal to 0.6936 that is approximate to the value 0.696 estimated from pooling the data of the 101 bamboo species, cultivars, forms, and varieties reported in Shi et al. [25]. Thus, we consider that a single MP value exists for calculating leaf area not only for moso bamboo of different ages but also probably for other bamboo species of different ages. At least, the mean absolute percentage errors for leaf area did not exceed 4% for each age group investigated here, using 0.6936 from pooling the data of the five age groups to calculate leaf area for each group. De Swart et al. [23] studied the influence of plant age on the calculation of A based on two leaf one-dimensional measures (i.e., L and W) of Capsicum annuum. They found that ME can fit leaf area well but it cannot account for the changes of leaf shape for the plants of different days after sowing (i.e., different plant ages). They recommend introducing two additional items (W2 and W) to ME, i.e., where k0, k1 and k2 are constants to be fitted, to render the calculation of A to be independent from plant age. However, the two additional parameters (i.e., k1 and k2) only increased r2 from 0.993 (ME) to 0.995 (the three-parameter equation). In general, to add one or more additional parameter(s) in a model can increase the goodness of fit, but it also adds the complexity of the model. Their conclusion that the prediction accuracy of ME is dependent of plant age might be problematic, only using the coefficient of determination without considering the trade-off between the goodness of fit and the complexity of a model [54]. Our study showed that the values of mean W do not show a linear increase or decrease or a parabolic change with plant age increasing (Figure 2A). Thus, the parameters k1 and k2 proposed by de Swart et al. [23] are meaningless to show the influence of the temporal variation in leaf width on the calculation of A.
5. Conclusions
In summary, we tested whether there is a significant difference in the Montgomery parameter (MP), which is a proportionality coefficient of leaf area vs. the product of leaf length and width, among the five age groups of moso bamboo that grew together at the same site. The differences in MP were significant between groups, but those did not largely increase the prediction errors of leaf area for all age groups. The mean absolute percentage errors of the five age groups were smaller than 4%, when we used the estimate of MP from fitting the pooled data of the five age groups to recalculate leaf area for each group. For all groups, the increased mean absolute percentage errors did not exceed 1% when replacing the MP values from each group with MP from all groups combined. We also compared MP obtained by fitting the pooled data of the five groups of moso bamboo (MP = 0.694) with the value of MP obtained by fitting the pooled data of the 101 bamboo taxa (MP = 0.696, reported in [25]). These two values are very similar and not significantly different. This means that the proportional relationships between leaf area and the product of leaf length and width for bamboo leaves vary little and the differences in the estimated proportionality coefficients can be neglected when calculating the areas of bamboo leaves. However, whether the conclusions apply to the leaves of different geographical populations of the same plant species merits further investigation since there is evidence that climate can significantly influence leaf shape [55].
Supplementary Materials
The following are available online at https://www.mdpi.com/2073-8994/13/3/369/s1, Table S1: Leaf measures of the five age groups of moso bamboo culms.
Author Contributions
P.S., Ü.N. and J.M. designed this experiment; R.W. carried out the experiment; L.H. and P.S. wrote the initial draft; Ü.N. and J.S. revise the manuscript. All authors have read and agreed to the published version of the manuscript.
Funding
This research itself received no external funding; J.M. was supported by the Economic Research Center of State Forestry and Grassland Administration of China (grand number: JYC2020-YN01); J.S. acknowledges funding by the Deutsche Forschungsgemeinschaft (DFG, German Research Foundation; ground number: SCHR 1672/1-1).
Institutional Review Board Statement
Not applicable.
Informed Consent Statement
Not applicable.
Data Availability Statement
The data can be found in the online Supplementary Table S1 of this study.
Acknowledgments
We are thankful to Lina Dong, Xuchen Guo, Yabing Jiao, Mengdi Liu, Yirong Li for participating in the leaf sampling work.
Conflicts of Interest
The authors declare no conflict of interest.
References
- Küppers, M. Ecological significance of above-ground architectural patterns in woody plants: A question of cost-benefit relationships. Trends Ecol. Evol. 1989, 4, 375–379. [Google Scholar] [CrossRef]
- Sack, L.; Melcher, P.J.; Liu, W.H.; Middleton, E.; Pardee, T. How strong is intracanopy leaf plasticity in temperate deciduous trees? Am. J. Bot. 2006, 93, 829–839. [Google Scholar] [CrossRef]
- Shi, P.; Xu, Q.; Sandhu, H.S.; Gielis, J.; Ding, Y.; Li, H.; Dong, X. Comparison of dwarf bamboos (Indocalamus sp.) leaf parameters to determine relationship between spatial density of plants and total leaf area per plant. Ecol. Evol. 2015, 5, 4578–4589. [Google Scholar] [CrossRef]
- England, J.R.; Attiwill, P.M. Changes in leaf morphology and anatomy with tree age and height in the broadleaved evergreen species, Eucalyptus regnans F. Muell. Trees Struct. Funct. 2006, 20, 79–90. [Google Scholar] [CrossRef]
- Wright, I.J.; Dong, N.; Maire, V.; Prentice, I.C.; Westoby, M.; Díaz, S.; Gallagher, R.V.; Jacobs, B.F.; Kooyman, R.; Law, E.A.; et al. Global climatic drivers of leaf size. Science 2017, 357, 917–921. [Google Scholar] [CrossRef] [PubMed]
- Niinemets, Ü.; Portsmuth, A.; Tena, D.; Tobias, M.; Valladares, F. Do we underestimate the importance of leaf size in plant economics? Disproportionate scaling of support costs within the spectrum of leaf physiognomy. Ann. Bot. 2007, 100, 283–303. [Google Scholar] [CrossRef] [PubMed]
- Milla, R.; Reich, P.B. The scaling of leaf area and mass: The cost of light interception increases with leaf size. Proc. R. Soc. Biol. Sci. 2007, 274, 2109–2114. [Google Scholar] [CrossRef] [PubMed]
- Niklas, K.J.; Cobb, E.D.; Niinemets, Ü.; Reich, P.B.; Sellin, A.; Shipley, B.; Wright, I.J. ‘Diminishing returns’ in the scaling of functional leaf traits across and within species groups. Proc. Natl. Acad. Sci. USA 2007, 104, 8891–8896. [Google Scholar] [CrossRef]
- Liu, M.; Niklas, K.J.; Niinemets, Ü.; Hölscher, D.; Chen, L.; Shi, P. Comparison of the scaling relationships of leaf biomass versus surface area between spring and summer for two deciduous tree species. Forests 2020, 11, 1010. [Google Scholar] [CrossRef]
- Niinemets, Ü.; Kull, O. Effects of light availability and tree size on the architecture of assimilative surface in the canopy of Picea abies: Variation in needle morphology. Tree Physiol. 1995, 15, 307–315. [Google Scholar] [CrossRef]
- Niinemets, Ü.; Kull, O. Effects of light availability and tree size on the architecture of assimilative surface in the canopy of Picea abies: Variation in shoot structure. Tree Physiol. 1995, 15, 791–798. [Google Scholar] [CrossRef]
- Niinemets, Ü. Global-scale climatic controls of leaf dry mass per area, density, and thinness in trees and shrubs. Ecology 2001, 82, 453–469. [Google Scholar] [CrossRef]
- Poorter, H.; Niinemets, Ü.; Poorter, L.; Wright, I.J.; Villar, R. Causes and consequences of variation in leaf mass per area (LMA): A meta-analysis. New Phytol. 2009, 182, 565–588. [Google Scholar] [CrossRef]
- Yun, T.; Cao, L.; An, F.; Chen, B.; Xue, L.; Li, W.; Pincebourde, S.; Smith, M.J.; Eichhorn, M.P. Simulation of multi-platform LiDAR for assessing total leaf area in tree crowns. Agric. For. Meteorol. 2019, 276–277, 107610. [Google Scholar] [CrossRef]
- Chen, X.; Yun, T. Individual tree crown segmentation directly from UAV-borne LiDAR data using the PointNet of deep learning. Forests 2021, 12, 131. [Google Scholar] [CrossRef]
- Firman, D.M.; Allen, E.J. Relationship between light interception, ground cover and leaf area index in potatoes. J. Agric. Sci. 1989, 113, 355–359. [Google Scholar] [CrossRef]
- Dornbusch, T.; Watt, J. A comparative analysis of leaf shape of wheat, barley and maize using an empirical shape model. Ann. Bot. 2011, 107, 865–873. [Google Scholar] [CrossRef] [PubMed]
- Lin, S.; Zhang, L.; Reddy, G.V.P.; Hui, C.; Gielis, J.; Ding, Y.; Shi, P. A geometrical model for testing bilateral symmetry of bamboo leaf with a simplified Gielis equation. Ecol. Evol. 2016, 6, 6798–6806. [Google Scholar] [CrossRef] [PubMed]
- Wang, Y.; Jin, G.; Shi, B.; Liu, Z. Empirical models for measuring the leaf area and leaf mass across growing periods in broadleaf species with two life histories. Ecol. Indic. 2019, 102, 289–301. [Google Scholar] [CrossRef]
- Montgomery, E.G. Correlation Studies in Corn, Annual Report No.24; Nebraska Agricultural Experimental Station: Lincoln, NB, USA, 1911; pp. 108–159. [Google Scholar]
- Jani, T.C.; Misra, D.K. Leaf area estimation by linear measurements in Ricinus communis. Nature 1966, 212, 741–742. [Google Scholar] [CrossRef]
- Palaniswamy, K.M.; Gomez, K.A. Length-width method for estimating leaf area of rice. Agron. J. 1974, 66, 430–433. [Google Scholar] [CrossRef]
- De Swart, E.A.M.; Groenwold, R.; Kanne, H.J.; Stam, P.; Marcelis, L.F.M.; Voorrips, R.E. Non-destructive estimation of leaf area for different plant ages and accessions of Capsicum annuum L. J. Hortic. Sci. Biotech. 2004, 79, 764–770. [Google Scholar] [CrossRef]
- Shi, P.; Liu, M.; Ratkowsky, D.A.; Gielis, J.; Su, J.; Yu, X.; Wang, P.; Zhang, L.; Lin, Z.; Schrader, J. Leaf area-length allometry and its implications in leaf shape evolution. Trees Struct. Funct. 2019, 33, 1073–1085. [Google Scholar] [CrossRef]
- Shi, P.; Li, Y.; Niinemets, Ü.; Olson, E.; Schrader, J. Influence of leaf shape on the scaling of leaf surface area and length in bamboo plants. Trees Struct. Funct. 2021, in press. [Google Scholar] [CrossRef]
- He, J.; Reddy, G.V.P.; Liu, M.; Shi, P. A general formula for calculating surface area of the similarly shaped leaves: Evidence from six Magnoliaceae species. Glob. Ecol. Conserv. 2020, 23, e01129. [Google Scholar] [CrossRef]
- Yu, X.; Shi, P.; Schrader, J.; Niklas, K.J. Nondestructive estimation of leaf area for 15 species of vines with different leaf shapes. Am. J. Bot. 2020, 107, 1481–1490. [Google Scholar] [CrossRef]
- Dolph, G.E. The effect of different calculational techniques on the estimation of leaf area and the construction of leaf size distributions. Bull. Torrey Bot. Club 1977, 104, 264–269. [Google Scholar] [CrossRef]
- Lin, S.; Niklas, K.J.; Wan, Y.; Holscher, D.; Hui, C.; Ding, Y.; Shi, P. Leaf shape influences the scaling of leaf dry mass vs. area: A test case using bamboos. Ann. For. Sci. 2020, 77, 11. [Google Scholar] [CrossRef]
- Shi, P.; Ratkowsky, D.A.; Li, Y.; Zhang, L.; Lin, S.; Gielis, J. General leaf-area geometric formula exists for plants—Evidence from the simplified Gielis equation. Forests 2018, 9, 714. [Google Scholar] [CrossRef]
- Caswell, H.; Salguero-Gómez, R. Age, stage and senescence in plants. J. Ecol. 2013, 101, 585–595. [Google Scholar] [CrossRef] [PubMed]
- Niinemets, Ü. Stomatal conductance alone does not explain the decline in foliar photosynthetic rates with increasing tree age and size in Picea abies and Pinus sylvestris. Tree Physiol. 2002, 22, 515–535. [Google Scholar] [CrossRef]
- Steppe, K.; Niinemets, Ü.; Teskey, R.O. Tree size- and age-related changes in leaf physiology and their influence on carbon gain. In Size- and Age-Related Changes in Tree Structure and Function; Meinzer, F.C., Lachenbruch, B., Dawson, T.E., Eds.; Springer: Berlin, Germany, 2011; pp. 235–253. [Google Scholar]
- Bielczynski, L.W.; Łącki, M.K.; Hoefnagels, I.; Gambin, A.; Croce, R. Leaf and plant age affects photosynthetic performance and photoprotective capacity. Plant Physiol. 2017, 175, 1634–1648. [Google Scholar] [CrossRef]
- Ryan, M.G.; Binkley, D.; Fownes, J.H. Age-related decline in forest productivity: Pattern and process. Adv. Ecol. Res. 1997, 27, 213–262. [Google Scholar]
- Xiang, E.; Guo, Y.; Yang, S.; Liu, X.; Tian, G.; Ma, J.; Shang, L. Variations in the anatomical characteristics of Bambusa pervariabilis culms with age and height. For. Prod. J. 2020, 70, 72–78. [Google Scholar]
- Shi, P.; Preisler, H.K.; Quinn, B.K.; Zhao, J.; Huang, W.; Röll, A.; Cheng, X.; Li, H.; Hölscher, D. Precipitation is the most crucial factor determining the distribution of moso bamboo in Mainland China. Glob. Ecol. Conser. 2020, 22, e00924. [Google Scholar] [CrossRef]
- Liese, W.; Köhl, M. Bamboo: The Plant and Its Uses; Springer: Heidelberg, Germany, 2015. [Google Scholar]
- Zhou, F.C. Silviculture of Bamboo Forests; China Agriculture Press: Beijing, China, 1998. (In Chinese) [Google Scholar]
- Cheng, X.F.; Shi, P.J.; Hui, C.; Wang, F.S.; Liu, G.H.; Li, B.L. An optimal proportion of mixing broad-leaved forest for enhancing the effective productivity of moso bamboo. Ecol. Evol. 2015, 5, 1576–1584. [Google Scholar] [CrossRef] [PubMed]
- Zheng, R. Technical analysisi of industrial utilization of Phyllostachys pubescens. J. Bamboo Res. 1998, 17, 1–9, (In Chinese with English Abstract). [Google Scholar]
- Wang, Q.; Liu, X.E.; Yang, S. Predicting density and moisture content of Populus xiangchengensis and Phyllostachys edulis using the X-ray computed tomography technique. For. Prod. J. 2020, 70, 193–199. [Google Scholar]
- Sandhu, H.S.; Shi, P.; Yang, Q. Intraspecific spatial niche differentiation: Evidence from Phyllostachys edulis. Acta Ecol. Sin. 2013, 33, 287–292. [Google Scholar] [CrossRef]
- R Core Team. R: A Language and Environment for Statistical Computing; R Foundation for Statistical Computing: Vienna, Austria, 2020; Available online: https://www.R-project.org/ (accessed on 1 July 2020).
- Su, J.; Niklas, K.J.; Huang, W.; Yu, X.; Yang, Y.; Shi, P. Lamina shape does not correlate with lamina surface area: An analysis based on the simplified Gielis equation. Glob. Ecol. Conserv. 2019, 19, e00666. [Google Scholar] [CrossRef]
- Hsu, J.C. Multiple Comparisons: Theory and Methods; Chapman and Hall/CRC: New York, NY, USA, 1996. [Google Scholar]
- Efron, B.; Tibshirani, R.J. An Introduction to the Bootstrap; Chapman and Hall/CRC: New York, NY, USA, 1993. [Google Scholar]
- Sandhu, H.S.; Shi, P.; Kuang, X.; Xue, F.; Ge, F. Applications of the bootstrap to insect physiology. Fla. Entomol. 2011, 94, 1036–1041. [Google Scholar] [CrossRef]
- Verwijst, T.; Wen, D.Z. Leaf allometry of Salix viminalis during the first growing season. Tree Physiol. 1996, 16, 655–660. [Google Scholar] [CrossRef] [PubMed]
- Shi, P.; Yu, K.; Niinemets, Ü.; Gielis, J. Can leaf shape be represented by the ratio of leaf width to length? Evidence from nine species of Magnolia and Michelia (Magnoliaceae). Forests 2021, 12, 41. [Google Scholar] [CrossRef]
- Gielis, J. A generic geometric transformation that unifies a wide range of natural and abstract shapes. Am. J. Bot. 2003, 90, 333–338. [Google Scholar] [CrossRef]
- Wang, P.; Lin, S.; Fan, T.; Zhang, Y.; Li, F.; Fan, M.; Fang, S.; Wang, F.; Dong, L.; Shi, P. Relationship between the mean diameter of breast height (DBH) and the number per unit area of moso bamboo in Zijin (Purple) Mountain. J. Anhui Agric. Sci. 2018, 46, 106–108, (In Chinese with English Abstract). [Google Scholar]
- Enquist, B.J.; Niklas, K.J. Global allocation rules for patterns of biomass partitioning in seed plants. Science 2002, 295, 1517–1520. [Google Scholar] [CrossRef] [PubMed]
- Spiess, A.-N.; Neumeyer, N. An evaluation of R squared as an inadequate measure for nonlinear models in pharmacological and biochemical research: A Monte Carlo approach. BMC Pharmacol. 2010, 10, 6. [Google Scholar] [CrossRef]
- Peppe, D.J.; Royer, D.L.; Cariglino, B.; Oliver, S.Y.; Newman, S.; Leight, E.; Enikolopov, G.; Fernandez-Burgos, M.; Herrera, F.; Adams, J.M.; et al. Sensitivity of leaf size and shape to climate: Global patterns and paleoclimatic applications. New Phytol. 2011, 190, 724–739. [Google Scholar] [CrossRef] [PubMed]


Publisher’s Note: MDPI stays neutral with regard to jurisdictional claims in published maps and institutional affiliations. |
© 2021 by the authors. Licensee MDPI, Basel, Switzerland. This article is an open access article distributed under the terms and conditions of the Creative Commons Attribution (CC BY) license (http://creativecommons.org/licenses/by/4.0/).