Abstract
Feature-based pedestrian detection method is currently the mainstream direction to solve the problem of pedestrian detection. In this kind of method, whether the appropriate feature can be extracted is the key to the comprehensive performance of the whole pedestrian detection system. It is believed that the appearance of a pedestrian can be better captured by the combination of edge/local shape feature and texture feature. In this field, the current method is to simply concatenate HOG (histogram of oriented gradient) features and LBP (local binary pattern) features extracted from an image to produce a new feature with large dimension. This kind of method achieves better performance at the cost of increasing the number of features. In this paper, Choquet integral based on the signed fuzzy measure is introduced to fuse HOG and LBP descriptors in parallel that is expected to improve accuracy without increasing feature dimensions. The parameters needed in the whole fusion process are optimized by a training algorithm based on genetic algorithm. This architecture has three advantages. Firstly, because the fusion of HOG and LBP features is parallel, the dimensions of the new features are not increased. Secondly, the speed of feature fusion is fast, thus reducing the time of pedestrian detection. Thirdly, the new features after fusion have the advantages of HOG and LBP features, which is helpful to improve the detection accuracy. The series of experimentation with the architecture proposed in this paper reaches promising and satisfactory results.
1. Introduction
Pedestrian detection is the key technology of intelligent transportation [1,2,3]. In addition, the core technologies included in pedestrian detection are also indispensable for other applications, such as, robotics, video surveillance and behavior prediction [4,5,6]. In recent years, researchers have proposed many different pedestrian detection methods and successfully applied them in commercial and military fields [7,8,9,10,11]. Feature based pedestrian detection method is the mainstream method at present. Although they are different in the processing of raw data and the training of classifier, they basically follow the similar path as shown in Figure 1. The input of this path is the original image in the form of pixel representation, while the output includes a set of rectangular borders with different sizes. Each rectangular border corresponds to a pedestrian identified in the image. A typical pedestrian detection scheme mainly includes three steps: selection of detection region, extraction of feature and classification of detection region.
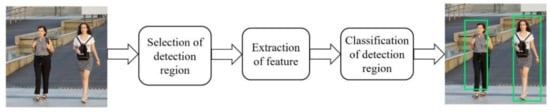
Figure 1.
Pipeline of a general feature-based pedestrian detection.
In the stage of selection of detection region, the input is usually the original image, and the output is a group of regions with different sizes and ratios. Sliding window method is the simplest method among all the region selection algorithms. It can be used to obtain regions with multiple proportions and aspect ratios. As the number of candidate regions has a great influence on the speed of the whole pedestrian detection system, more complicated approaches analyze the original images in advance to filter out the regions in which no target objects are believed to contain, and therefore the number of candidate regions to be tested is reduced.
For the extraction of features, the input is the candidate region that may or may not contain a pedestrian, and the output is a feature vector in the form of real-valued or binary-valued. The criteria of which features should be extracted are whether they can classify pedestrians and non-pedestrians. Feature extraction can be clustered as single and multifeature extraction, respectively. Single features typically include HOG (histogram of oriented gradient) [12], LBP (local binary pattern) [13] and Haar-like [14], while the representatives of multifeature are HOG-LBP [15], HOG-Harr-like [16] and HOG-SIFT (scale-invariant feature transform) [17,18].
In the stage of classification of detection region, the main task is to identify whether there is a human shape in the candidate region. The feature vector obtained in the feature extraction stage for a candidate detection region is input into the classifier, and a binary label is output after classification calculation to indicate whether the area is positive (that means containing pedestrian) or negative (that means not containing pedestrian). The classical classifier comprises SVM (support vector machine) [19,20], AdaBoost [21,22] and CNN (convolutional neural network) [23,24].
Compared to the methods of multi-component combination, the implementation process and structure of feature-based methods of pedestrian detection is relatively simple. When using different feature methods, it does not need to change the original architecture and consequently guarantees better portability. The critical steps of the feature-based pedestrian detection pipeline mentioned above are feature extraction and region classification. Therefore, a novel and efficient feature extraction algorithm is essential, and which inspires the origin of this paper.
HOG [12] is widely considered as one of the best features to obtain edge or local shape information. It has achieved great success in target recognition and detection [25,26,27]. In [28], Zhu et al. integrate the cascade rejections method to accelerate the HOG extraction process in human detection. In [29], HOG-DOT algorithm with L1 normalization technique and SVM is used. Although this method can get good TPR (true positive rate), its FPR (false positive rate) is very high. HOG using discrete wavelet transform is proposed in [30], but its detection rate is not high, only 85.12%. In [31], selective gradient self-similarity (SGSS) feature is applied for feature extraction with HOG. The addition of SGSS significantly improves the accuracy of pedestrian detection, and the detection ability of cascade structure based on AdaBoost is better than linear SVM or HIKSVM.
It should be noted that the performance of HOG is poor in the background clustered with noisy edges. In such a situation, LBP [32] can play a very good complementary role. LBP feature has been widely used in different applications and has presented satisfactory performance in face recognition. It is a very effective feature to distinguish images because of its invariance to monotonic gray level changes and high efficiency of computation.
Based on the above reasons, it is natural to think that the combination of edge/local shape information with texture information can capture the appearance of pedestrians more efficiently. In [15], aiming at the problem of partial occlusion, a feature descriptor based on serial fusion of HOG and LBP features is proposed. Although the detection rate has been improved, the detection efficiency is sacrificed owing to the increase of dimension. In [33], Jiang et al. also use concatenation method to combine HOG and LBP features to for a new feature vector, and then send it to XGBoost (eXtreme Gradient Boosting) classifier. Therefore, the problem of sacrificing detection efficiency to improve detection accuracy still exists. In the feature fusion of pedestrian detection, the current mainstream method is to concatenate several features in series. This approach may raise two problems. First, serial feature concatenation leads to an extreme increase of the number of features for the whole image being processed and consequently affects the processing speed. Secondly, the processing method of concatenating features does not consider the possible interaction between features and the possible impact of this interaction on the final classification decision. Therefore, the current feature fusion based on concatenation cannot be regarded as the feature fusion in a strict sense.
In this paper, Choquet integral based on the fuzzy measure is applied to realize the parallel fusion of HOG and LBP feature descriptors. This methodology is expected to improve the detection accuracy without increasing the feature dimension. The Choquet integral based on fuzzy measure is a very effective feature fusion method. When it is applied to the fusion problem, the fuzzy measure in the integral can well reflect the importance of each feature to the fusion target and the influence of the interaction among features on the fusion target. At the same time, it may help us to mine the possible interaction between different pedestrian descriptors, which has a positive research significance for the development of pedestrian detection technology.
The procedure of pedestrian detection based on the parallel fusion of HOG and LBP features is demonstrated in Figure 2. Here, HOG features and histogram of LBP descriptors of each cell are extracted from original image, respectively. They are parallelly fused by Choquet integral with its internal parameters, i.e., values of fuzzy measure, being optimized by a genetic algorithm. This fusion results in a new set of features, called parallel-HOG-HOLBP (histogram of gradient—histogram of local binary patterns), which is consequently transmitted to SVM for classification.
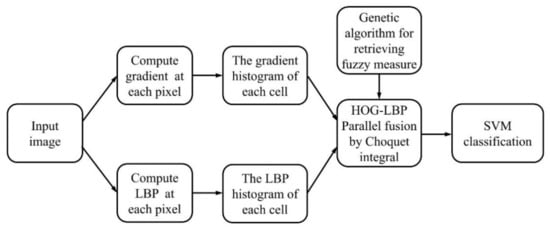
Figure 2.
The demonstration of parallel fusion of HOG (histogram of oriented gradient) and LBP (local binary pattern) features.
The intervention of Choquet integral makes the two features (HOG and LBP) merge in parallel. The resulting feature, parallel-HOG-HOLBP, not only contains the original advantages of HOG and LBP, but also avoids the unavoidable dimension disaster in traditional serial fusion. Genetic algorithm is used to optimize the interval coefficients of fuzzy measure in Choquet integral. It is a more rational way to retrieve these parameters through a global optimization algorithm compared to through trial and error method. We designed a series of experiments to verify the effectiveness of the proposed method. The experimental results show that the proposed method has better comprehensive performance than the existing methods.
The organizational structure of this paper is as follows. In Section 2, typical features used in this paper are presented. Aggregation of feature fusion based on Choquet integral is introduced in Section 3. An adaptive algorithm based on genetic algorithm is implemented in Section 4 to optimize the internal coefficients of fuzzy measure in Choquet integral. In Section 5, experimental results and analysis are demonstrated. Finally, Section 6 summarizes and prospects this paper.
2. Features Realignment
When using Choquet integral to fuse two kinds of features in parallel, the fused features should have the same dimension. Therefore, this section discusses the mechanism of feature realignment of HOG and LBP features.
2.1. Histogram of Oriented Gradient Feature Extraction
HOG feature calculates the distribution of gradient in local image, so it can describe the edge or local shape information of object well. A typical HOG feature extraction process includes four steps:
- Standardize gamma space and color space.In order to reduce the influence of illumination, the whole image needs to be normalized. In the texture intensity of the image, the local surface exposure contributes a large proportion, so this kind of compression can effectively reduce the local shadow and illumination changes of the image. As the color information has little effect, the original RGB image is usually converted to a gray image, and the gamma correction is used to normalize it by formulawhere represents the intensity of the pixel at coordinates , and represents the parameter of gamma correction. Generally, the value of is set to .
- Calculate image gradient.The gradient of horizontal direction and the gradient of vertical direction are, respectively, calculated for the normalized image.The gradient value and gradient direction of each pixel are calculated from the gradient of the two directions, respectively.
- Construct the histogram of gradient direction for each cell.The image is divided into several cells, as shown in Figure 3a, each cell is pixels. The gradient direction of 360 degrees is divided into nine ranges averagely (Figure 3b), and the histogram corresponding to these nine bins is constructed to count the gradient information of the pixels. The horizontal axis of the histogram is the nine bins in gradient directions, while the height of each bin is the superposition of the gradient value of those pixels whose gradient directions belong to the bin.
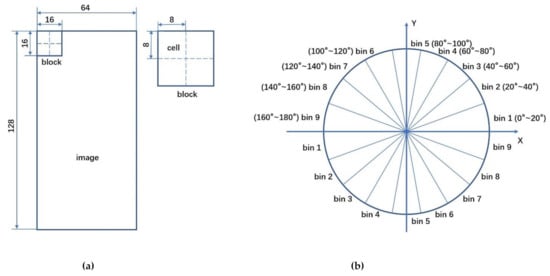 Figure 3. Illustration of HOG feature extraction: (a) cells and blocks of HOG feature; (b) nine ranges of gradient direction in 360 degrees.
 - Construct the HOG feature for an image.Each cell gets a 9-dimensioanl vector. As shown in Figure 3a, four adjacent cells constitute a block, and the vectors of four cells in a block are connected in serial to obtain a 36-dimensional vector. The block is used to scan the image with the scanning step as a cell. Finally, the vectors of all blocks are connected in serial to get the HOG feature of the image. For example, for an image, every pixel constitutes a cell and every cells constitute a block. As each cell has nine features, there are features in each block. Taking eight pixels as the step size, there will be seven scanning windows in the horizontal direction and 15 scanning windows in the vertical direction. In other words, images have features.
2.2. Histogram of LBP Descriptor
The LBP descriptor shows the difference of gray-level between a pixel in center and its neighbor pixels in a specific size region. If we denote the gray value of a pixel as , then the LBP value of this pixel is a decimal calculated by
where
Here, is the number of neighbor pixels around the center pixel. Figure 4 shows an LBP feature extraction process with and radius as 1.
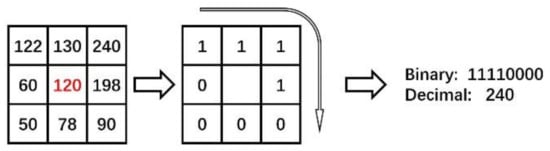
Figure 4.
LBP feature extraction process with K = 8 and radius as 1.
In order to fuse HOG and LBP in parallel by Choquet integral, the two features extracted from a candidate image should have the same dimension. Referring to the construction method of HOG features, we realign the LBP feature for the candidate image. The gradient value and gradient direction of LBP value for each pixel are calculated, respectively. The gradient direction of 360 degrees is divided into nine ranges averagely and the histogram corresponding to these nine bins is constructed to count the gradient information of each cell. The horizontal axis of the histogram is the nine bins in gradient directions, while the height of each bin is the superposition of the gradient value of those pixels whose gradient directions belongs to the bin, as shown in Figure 5. Similarly, for an image, a new feature vector with length 3780 is constructed. We called this new feature vector histogram of local binary patterns (HOLBP).
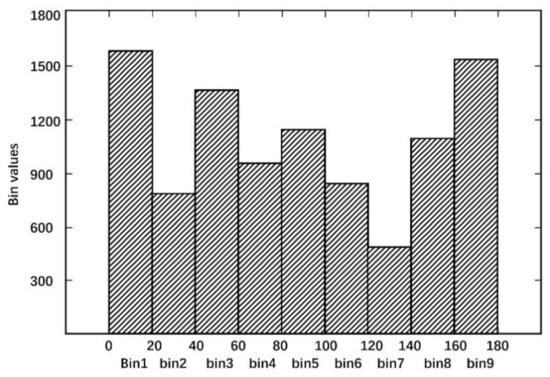
Figure 5.
Histogram of local binary patterns in a cell.
3. Feature Fusion in Parallel by Choquet Integral
Since the dimensions of HOG and HOLBP are consistent, it is possible to fuse these two feature descriptors in parallel. In this paper, Choquet integral based on fuzzy measure [34,35] is utilized as an aggregation tool to perform the fusion task.
3.1. Signed Fuzzy Measure
Denote as a set of feature attributes being considered. The set of all the subsets of is called the power set of and is denoted by .
Definition 1.
A signed fuzzy measure is a set functionwith.
A signed fuzzy measure assigns a real value for each single element and each possible combination of elements in . If we regard the elements in set as a set of features to be fused, then the signed fuzzy measure values corresponding to each feature and the signed fuzzy measure values corresponding to each possible combination of each feature can be clearly explained as their influence on the fusion target. Due to the non-additivity of the signed fuzzy measure, the influence of any combination of features to be fused on the fusion target is not the simple sum of their respective influences. Therefore, the signed fuzzy measure defined on set has interpretable physical meaning, indicating the possible interaction between the features to be fused.
A signed fuzzy measure has advantages of describing the individual and joint contribution rates from features to be fused toward the fusion target flexibly. A signed fuzzy measure is called subadditive if it satisfies whenever , while a signed fuzzy measure is called super-additive if it satisfies whenever and .
3.2. Choquet Integral as Aggregation Tool
Definition 2.
Letbe a signed fuzzy measure defined on. For a real-valued function, its Choquet integral is defined as
whereis a set whose elements have their function values greater or equal to, .
The values of for each element are denoted as , , , . To calculate the value of a Choquet integral with a given function , they are usually sorted in a nondecreasing order such as . Here, is a certain permutation of . Then, the value of the Choquet integral can be obtained by
where .
In real programming, it is inconvenient to perform such a sorting operation in Equation (9). Actually, the value of the Choquet integral of with respect to can be calculated as a linear form as follows.
in which
The definition of Choquet integral shows that it is actually a mapping from n-dimensional space to a real value, so it is usually regarded as a powerful tool to aggregate different features, and the result of aggregation are furthermore to be used for the solution of data classification or regression problems.
3.3. Feature Fusion by Choquet Integral
For a sliding window, each corresponding singleton dual of HOG feature and HOLBP feature constructs a set of feature attributes, denoted as . A real-valued function is defined on by assigning and the numerical value of the corresponding singleton of HOG feature and HOLBP feature, respectively. A signed fuzzy measure is defined on to describe the influence of each individual feature as well as each possible combination of features to the fusion target. Since , in this case, three values of are required to be set, that is, , and . Figure 6 illustrates the process of feature fusion of HOG and HOLBP by Choquet integral.
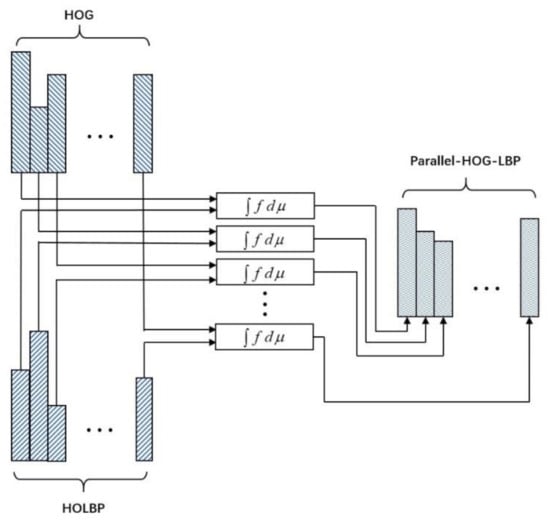
Figure 6.
Feature fusion of HOG and HOLBP by Choquet integral.
4. Pedestrian Detection Framework with Parameters Retrieved by Genetic Algorithm
To accomplish the parallel feature fusion between HOG and HOLBP via Choquet integral based on signed fuzzy measure, a series of interval parameters, i.e., , and , need to be retrieved. Of course, we can use trial and error method to predict the values of these parameters. However, a more scientific way is to retrieve these parameters through a global optimization algorithm.
As shown in Figure 7, genetic algorithm is an adaptive optimization algorithm which can ensure global search. It includes the process of initialization of new generation, evaluation of each individual of population, selection, reproduction (crossover), and mutation.
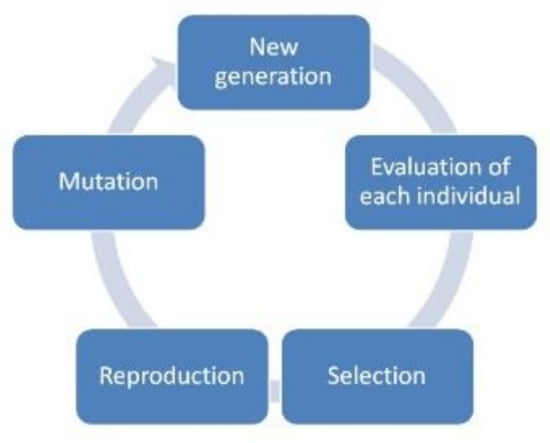
Figure 7.
Mind mapping of a genetic algorithm.
4.1. Parameters Retrieving under Genetic Algorithm Framework
In the genetic algorithm of parameter retrieving, each individual of a chromosome represents a set of signed fuzzy measures. Due to binary coding, each chromosome is composed of 30 genes (10 genes corresponding to a parameter to be optimized). The value of each gene is a binary number. Each chromosome is decoded as three real values between 0 and 1, corresponding to the normalized value of , and . The fitness value of each chromosome is evaluated by the AUC (area under curve) of ROC (receiver operating characteristic) curve. Since the probability that a chromosome in a population can be selected to generate offspring depends on its fitness value, the pedestrian detection parameter optimization algorithm based on genetic algorithm takes the maximum AUC as the criterion to optimize.
Figure 8 shows the process diagram of parameter retrieving process based on a GA structure under the application of pedestrian detection. The algorithm starts with a randomly generated initialization population. Each individual of chromosome in the population is decoded into a set of values, which is actually a representation of a specific signed fuzzy measure. Typical HOG feature extraction and HOLBP feature construction presented in Section 2 are performed. The two sets of features are fused by the Choquet integral with respect to the specific signed fuzzy measure represented by the corresponding individual chromosome in the current population. The fusion results are a new set of features, called parallel-HOG-HOLBP, which is consequently transmitted to SVM for classification. The same process is done for each sliding window of the images in INRIA data set [36]. AUC is calculated from the ROC curve which is constructed for each individual of the population.
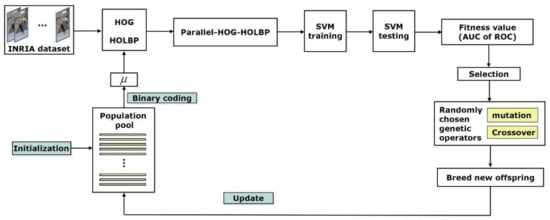
Figure 8.
Algorithm frame parameter retrieval based on GA.
The value of AUC is used to evaluate the fitness value of the chromosome being considered. Then, a tournament selection is conducted. Better individuals (with higher AUC values) have more opportunities to perform several randomly chosen genetic operators to produce offspring. The population is updated by the newly created offspring. This process is repeated until the number of individuals generated exceeds the preset maximum size of population. In the process of program iteration, in order to keep the global search space, some special operations are used when the best fitness value remains unchanged for successive generations (the default value is 20). The individuals in the original population are divided into three parts according to the ascending order of fitness value. The excellent individuals in the first part are all retained, the individuals in the second part produce new offspring by random mutation, and the individuals in the third part are randomly replaced by the new individuals produced by previous genetic operations. As a result, the population is updated and the program continues to iterate.
4.2. Classifier Training
Each chromosome corresponds to a signed fuzzy measure. Based on each signed fuzzy measure, a Choquet integral fuses HOG and LBP features in a candidate image, and the generated parallel-HOG-HOLBP features are sent to an SVM classifier to evaluate the performance of the chromosome according to the classification results on a set of testing images.
Based on the principle of structural risk minimization, support vector machine has a very powerful ability in dealing with nonlinear problems. The algorithm uses learning samples to find an optimal hyperplane in high-dimensional space, so as to separate different samples from two groups. First, the parallel-HOG-HOLBP features of positive and negative samples are calculated as input of the SVM classifier. Then the final decision function is calculated as
where is a nonlinear mapping from the input space to a high-dimensional feature space. is optimal in the sense of maximizing the distance between the hyper-plane and the nearest point . The following equation is usually used to solve optimization problem mentioned above.
where is a slack variable, which corresponds to the vertical distance from each wrongly classified sample point to the corresponding boundary hyperplane. Parameter is the penalty coefficient. The larger this parameter is, the more severe the penalty is.
In this paper, INRIA data set [36] is selected as the training set to train SVM classifier, because INRIA data set is a benchmark data set which is widely used in pedestrian detection. We extract positive samples from INRIA training set according to the pedestrian coordinates marked in the dataset, and construct negative samples from the training set by randomly cropping. After extraction, the training set being used consists of 2416 positive samples and 12,180 negative samples from the INRIA dataset. The parameters of SVM classifier are shown in Table 1.

Table 1.
The running parameters of SVM classifier algorithm.
4.3. Classifier Training and Evaluation Criterion
To evaluate the classifier constructed by each chromosome in the current iteration, 1126 positive samples and 453 negative samples are extracted from the INRIA testing set. For each chromosome, a confusion matrix is summarized by four indicators, as shown in Figure 9. The indicators represent four situations:
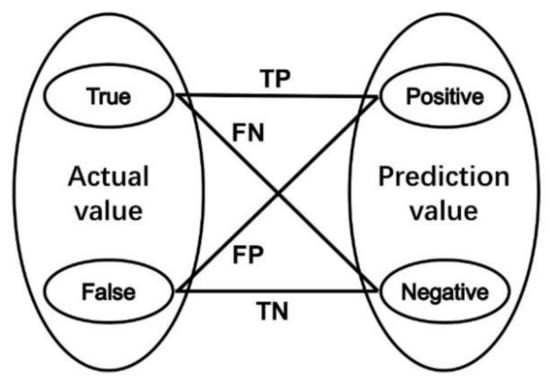
Figure 9.
Interpretation chart of indicators in confusion matrix.
- The actual value is true, and the classifier assigns it to be positive (True Positive = TP);
- The actual value is true, and the classifier assigns it to be negative (False Negative = FN);
- The actual value is false, and the classifier assigns it to be positive (False Positive = FP);
- The actual value is false, and the classifier assigns it to be negative (False Negative = TN).
Three new indicators are sequentially calculated. They are
and
Here, indicator precision and indicator recall describe the classifier’s correct predictions as a percentage of all results, where indicator F1 Score takes into account that the destination of optimization is to find the best combination of precision and recall. In our algorithm, indicator F1 Score is utilized as the fitness value of each chromosome in iterations.
5. Experimental Results and Analysis
5.1. Data Construction
This paper uses INRIA pedestrian data sets to construct a training set and testing set. We extract positive samples from INRIA training set according to the pedestrian coordinates marked in the dataset, and construct negative samples from the training set by randomly cropping. After construction, the training set consists of 2416 positive samples and 12,180 negative samples, where the testing set consists of 1126 positive samples and 453 negative samples.
5.2. Experimental Results and Analysis
In order to validate the performance of parallel-HOG-HOLBP features and relevant GA-based pedestrian detection algorithm proposed in this paper, four classifiers with different combinations of features are selected to be tested on the same set of testing set. They are:
- SVM classifier with HOG features, denoted as HOG-SVM;
- SVM classifier with serial fusion of HOG and LBP features, denoted as HOG-LBP-SVM;
- SVM classifier with parallel-HOG-HOLBP features whose fusion parameters are set by experience, denoted as HOG-HOLBP-SVM;
- SVM classifier with parallel-HOG-HOLBP features whose fusion parameters are optimized by GA process, denoted as HOG-HOLBP-GA-SVM.
The experimental results of HOG-SVM and HOG-LBP-SVM are expressed as confusion matrices shown in Table 2 and Table 3.
Table 2.
Confusion matrix of HOG-SVM.
Table 3.
Confusion matrix of HOG-LBP-SVM.
Using Choquet integral to fuse HOG and HOLBP in parallel, suitable values of signed fuzzy measure are extracted because they are the essential parameters in Choquet integral. Their values directly affect the effectiveness of the subsequent pedestrian detection. In experiments of HOG-HOLBP-SVM, 10 groups of signed fuzzy measure are chosen by experience. Their performances are validated by F1 scores and shown in Figure 10. The F1 score reaches the best result with and . HOG-HOLBP-SVM experiment based on this best combination is conducted and the detection results are expressed as the confusion matrix shown in Table 4.
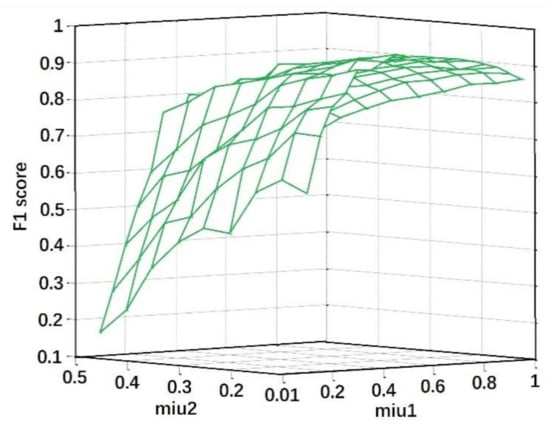
Figure 10.
The results of 10 trials for different combinations of signed fuzzy measure in HOG-HOLBP-SVM.
Table 4.
Confusion matrix of HOG-HOLBP-SVM.
Keeping the dataset unchanged, the GA-based feature fusion and pedestrian detection algorithm (HOG-HOLBP-GA-SVM) is used as a classifier for training and testing. Parameters of the signed fuzzy measure of Choquet integral to accomplish the feature fusion in parallel are optimized by the genetic algorithm during the iteration process, as explained in Section 4.1.
Under the premise of the same running parameters of genetic algorithm, HOG-HOLBP-GA-SVM was run for 10 trials. The results of these 10 trials are recorded in Table 5, in which the minimum fitness value, the maximum fitness value and the average value at the end of each trial are recorded in the corresponding rows of each run. As shown in Table 5, among the 10 randomly generated trials, Trial 3 gives the best optimization result, that is, at the end of running, the maximum fitness value reaches 0.9758. In Trial 3, an optimization set of parameters is obtained at the end of iteration. The standard deviations of the three measurements for the 10 trials are also shown in the bottom row of Table 5. The optimization process of trial 3 is shown in Table 6. The confusion matrix of HOG-HOLBP-GA-SVM experiment on this trial is shown in Table 7. For the remaining trials, HOG-HOLBP-GA-SVM can also reach into the nearby space of the optimized point. This shows that HOG-HOLBP-GA-SVM has a satisfactory performance on the efficiency and effectiveness.
Table 5.
Results of 10 trials in the experiments of HOG-HOLBP-GA-SVM.
Table 6.
Optimization process of values of trial 3 in the series experiments on HOG-HOLBP-GA-SVM.
Table 7.
Confusion matrix of HOG-HOLBP-GA-SVM.
To compare the performance of four classifiers, the results in the confusion matrix (Table 2, Table 3, Table 4 and Table 7) are converted to three indicators, i.e., precision, recall and F1 score. The experimental results of four methods are shown in Table 8, where precision, recall, F1 score, and feature extraction time are reported. As shown in Table 8, three indicators of detection rate of the two parallel feature fusion methods (HOG-HOLBP-SVM and HOG-HOLBP-GA-SVM) are superior to those of HOG-SVM and serial feature fusion method (HOG-LBP-SVM). In addition, there is an obvious slowdown in the feature extraction time, from 88.285 and 131.854 ms per frame to 10.075 and 10.126 ms per frame, respectively. The reduction of execution time shows that the parallel feature fusion algorithm has better real-time performance than the serial feature fusion algorithm. Figure 11 shows the comparison from the precision, recall and F1 score of the four algorithms on testing set and a summary of performance comparison among four algorithms is depicted in Figure 12.
Table 8.
Performance evaluation of four classifiers.
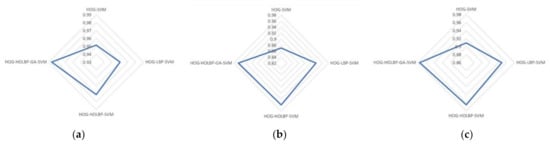
Figure 11.
Performance comparison among four algorithms on the testing set: (a) comparison from precision; (b) comparison from recall; (c) comparison from F1 score.
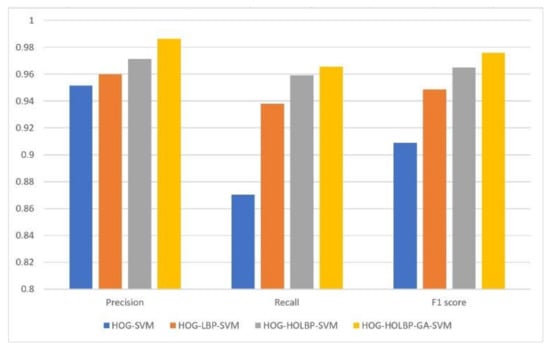
Figure 12.
Summary of performance comparison among four algorithms.
A ROC (receiver operating characteristic) curve was drawn with false positive rate as horizontal coordinate and true positive rate as vertical coordinate to estimate the influence of sample distribution on the performance of the algorithm.
The larger the area surrounded by the ROC curve, the better the performance of the classifier. Figure 13 shows the corresponding ROC curves of HOG feature, HOG-LBP feature, HOG-HOLBP feature, and HOG-HOLBP-GA feature with SVM being used as classifiers, respectively. It can be seen that HOG-HOLBP-GA-SVM classifier has better performance than other classifiers apparently.
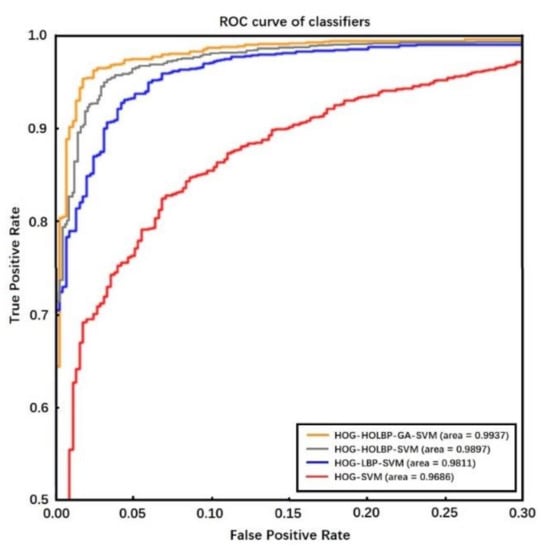
Figure 13.
The ROC curves of classifiers.
In addition, according to the detection results of each algorithm, FPPI (false positive per image) curves are drawn, respectively. FPPI curve represents the average number of correct retrievals in each image, and its value is closer to the practical application of the classifier. The lower the curve in the graph, the stronger the performance of the corresponding model. The seven FPPI curves shown in Figure 14 compare the proposed pedestrian detection algorithms with other popular pedestrian detection algorithms. It can be seen from the figure that HOG-HOLBP-GA-SVM classifier has achieved good performance.
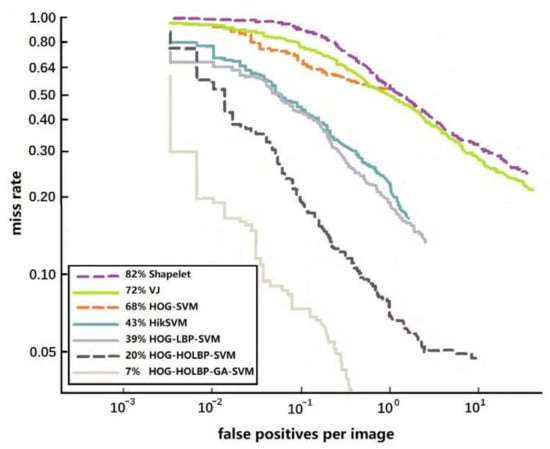
Figure 14.
The FPPI curves of pedestrian detection algorithms.
6. Conclusions
The key issues of pedestrian detection are to extract efficient features so as to accomplish detection correctly and promptly. This paper attempted to present a novel parallel framework and solve these problems with Choquet integral being involved. The intervention of Choquet integral makes the two features (HOG and LBP) merge in parallel. The resulting feature, parallel-HOG-HOLBP, not only contains the original advantages of HOG and LBP, but also avoids the unavoidable dimension disaster in traditional serial fusion. Genetic algorithm is used to retrieve the interval parameters of fuzzy measure in Choquet integral. It is a more rational way to retrieve these parameters through a global optimization algorithm compared to through trial and error method. We conducted extensive experiments to demonstrate that the proposed method has more effective characteristics compared with the original methods. Our research reveals that feature fusion in parallel is an effective and promising way to improve pedestrian detection performance.
Author Contributions
Conceptualization, R.Y. and Y.W.; methodology, R.Y.; software, Y.X.; validation, L.Q. and Q.L.; formal analysis, R.Y.; investigation, Y.X.; resources, L.Q.; data curation, Q.L.; writing—original draft preparation, R.Y.; writing—review and editing, Y.W. and Y.X.; visualization, L.Q.; supervision, R.Y.; project administration, R.Y.; funding acquisition, R.Y. All authors have read and agreed to the published version of the manuscript.
Funding
This research was funded by National Natural Science Foundation of China, grant numbers 61773266, 61873170 and U1813225, and by Science and Technology Research and Development Foundation of Shenzhen, grant numbers JCYJ20170818144254033, JCYJ20190808112605503 and JCYJ20190808144607400. The APC was funded by National Natural Science Foundation of China, grant number 61773266.
Institutional Review Board Statement
Not applicable.
Informed Consent Statement
Not applicable.
Data Availability Statement
Not applicable.
Conflicts of Interest
The authors declare no conflict of interest.
References
- Zhao, Z.; Zheng, P.; Xu, S. Object detection with deep learning: A review. IEEE Trans. Neural Netw. Learn. Syst. 2019, 30, 3212–3232. [Google Scholar] [CrossRef] [PubMed]
- Dollar, P.; Wojek, C.; Schiele, B.; Perona, P. Pedestrian detection: An evaluation of the state of the art. IEEE Trans. Pattern Anal. Mach. Intell. 2012, 34, 743–761. [Google Scholar] [CrossRef] [PubMed]
- Dollar, P.; Appel, R.; Belongie, S.; Perona, P. Fast feature pyramids for object detection. IEEE Trans. Pattern Anal. Mach. Intell. 2014, 36, 1532–1545. [Google Scholar] [CrossRef] [PubMed]
- Liu, S.Y.; Guo, H.Y.; Hu, J.G.; Zhao, X.; Tang, M. A novel data augmentation scheme for pedestrian detection with attribute preserving GAN. Neurocomputing 2020, 401, 123–132. [Google Scholar] [CrossRef]
- Severino, J.V.B.; Zimmer, A.; Brandmeier, T.; Freire, R.Z. Pedestrian recognition using micro Doppler effects of radar signals based on machine learning and multi-objective optimization. Expert Syst. Appl. 2019, 136, 304–315. [Google Scholar] [CrossRef]
- Liu, W.; Liao, S.; Ren, W.; Hu, W.; Yu, Y. High-level Semantic Feature Detection: A New Perspective for Pedestrian Detection. CVPR 2019, 5187–5196. [Google Scholar]
- Cao, Z.; Simon, T.; Wei, S.-E. Realtime multi-person 2D pose estimation using part affinity fields. CVPR 2017, 2017, 1302–1310. [Google Scholar]
- Yang, Z.; Nevatia, R. A multi-scale cascade fully convolutional network face detector. In Proceedings of the 23rd International Conference on Pattern Recognition, Cancun, Mexico, 4–8 December 2016; IEEE Computer Society Press: New York, NY, USA, 2016; pp. 633–638. [Google Scholar]
- Sumi, A.; Santha, T. Frame level difference (FLD) features to detect partially occluded pedestrian for ADAS. J. Sci. Ind. Res. 2019, 78, 831–836. [Google Scholar]
- Yan, Y.C.; Ni, B.B.; Liu, J.X.; Yang, X.K. Multi-level attention model for person re-identification. Pattern Recognit. Lett. 2019, 127, 156–164. [Google Scholar] [CrossRef]
- Li, G.; Yang, Y.; Qu, X. Deep Learning Approaches on Pedestrian Detection in Hazy Weather. IEEE Trans. Ind. Electron. 2020, 10, 8889–8899. [Google Scholar] [CrossRef]
- Dalal, N.; Triggs, W. Histograms of Oriented Gradients for Human Detection. CVPR 2005, 1, 886–893. [Google Scholar]
- Ojala, T.; Pietikäinen, M.; Harwood, D. Performance evaluation of texture measures with classification based on Kullback discrimination of distributions. In Proceedings of the 12th IAPR International Conference on Pattern Recognition, Jerusalem, Israel, 9–13 October 1994; IEEE Computer Society Press: New York, NY, USA, 1994; Volume 1, pp. 582–585. [Google Scholar]
- Zhang, S.; Bauckhage, C.; Cremers, A.B. Informed Haar-like features improve pedestrian detection. CVPR 2014, 947–954. [Google Scholar]
- Wang, X.; Han, T.X.; Yan, S. An HOG-LBP human detector with partial occlusion handling. In Proceedings of the 2009 IEEE 12th International Conference on Computer Vision, Lisbon, Portugal, 5–8 February 2009; IEEE: New York, NY, USA, 2009; pp. 32–39. [Google Scholar]
- Wei, Y.; Tian, Q.; Guo, J. Multi-vehicle detection algorithm through combining Harr and HOG features. Math. Comput. Simul. 2019, 155, 130–145. [Google Scholar] [CrossRef]
- Yang, Z.; Kurita, T. Improvements of local descriptors in HOG/SIFT by BOF approach. IEICE Trans. Inf. Syst. 2014, E96-D, 1293–1303. [Google Scholar] [CrossRef]
- Wang, L.; Guo, C.; Liu, J.; Meng, D. A novel learning-balsed frame pooling method for event detection. Signal Process. 2017, 140, 45–52. [Google Scholar] [CrossRef]
- Alonso, I.P.; Fernández-Llorca, D.; Sotelo, M.A.; Bergasa, L.M.; Revenga, P.A.; Nuevo, J.; Ocaña, M.; Garrido, M.Á.G. Combination of feature extraction methods for SVM pedestrian detection. IEEE Trans. Intell. Transp. Syst. 2007, 8, 292–307. [Google Scholar] [CrossRef]
- Bilal, M.; Hanif, M.S. High performance real-time pedestrian detection using light weight features and fast cascaded kernel SVM classification. J. Signal Process. Syst. 2019, 91, 117–129. [Google Scholar] [CrossRef]
- Cao, J.; Pang, Y.; Li, X. Leaning multilayer channel features for pedestrian detection. IEEE Trans. Image Process. 2017, 26, 3210–3220. [Google Scholar] [CrossRef]
- Li, G.; Zong, C.; Liu, G.; Zhu, T. Application of convolutional neural network (CNN)-Adaboost algorithm in pedestrian detection. Sens. Mater. 2020, 32, 1997–2006. [Google Scholar] [CrossRef]
- He, Y.-Q.; Qin, Q.; Josef, V. A pedestrian detection method using SVM and CNN multistage classification. J. Inf. Hiding Multimed. Signal Process. 2018, 9, 51–60. [Google Scholar]
- Kim, J.H.; Batchuluun, G.; Park, K.R. Pedestrian detection based on faster R-CNN in nighttime by fusing deep convolutional features of successive images. Expert Syst. Appl. 2018, 114, 15–33. [Google Scholar] [CrossRef]
- Albiol, A.; Monzo, D.; Martin, A.; Sastre, J.; Albiol, A. Face recognition using HOG-EBGM. Pattern Recognit. 2008, 29, 1537–1543. [Google Scholar] [CrossRef]
- Tudor, B. Pedestrian detection and tracking using temporal differencing and HOG features. Comput. Electr. Eng. 2014, 40, 1072–1079. [Google Scholar]
- Hoang, V.-D.; Le, M.-H.; Jo, K.-H. Hybrid cascade boosting machine using variant scale blocks HOG features for pedestrian detection. Neurocomputing 2014, 135, 357–366. [Google Scholar] [CrossRef]
- Zhu, Q.; Yeh, M.C.; Cheng, K.T. Fast human detection using a cascade of histograms of oriented gradients. CVPR 2006, 2, 1491–1498. [Google Scholar]
- Maggiani, L.; Bourrsset, C.; Quinton, J.C.; Berry, F.; Sérot, J. Bio-inspired heterogeneous architecture for real-time pedestrian detection applications. J. Real Time Image Process. 2018, 14, 535–548. [Google Scholar] [CrossRef]
- Hong, G.S.; Kim, B.G.; Hwang, Y.S.; Kwon, K.K. Fast multi-featured pedestrian detection algorithm based on histogram of oriented gradient using discrete wavelet transform. Multimed. Tools Appl. 2015, 75, 15229–15245. [Google Scholar] [CrossRef]
- Wu, S.; Payeur, R.P. Improving pedestrian detection with selective gradient self-similarity feature. Pattern Recognit. 2015, 48, 2364–2376. [Google Scholar] [CrossRef]
- Ojala, T.; Pietikäinen, M.; Harwood, D. A Comparative Study of Texture Measures with Classification Based on Feature Distributions. Pattern Recognit. 1996, 29, 51–59. [Google Scholar] [CrossRef]
- Jiang, Y.; Tong, G.; Yin, H.; Xiong, N. A pedestrian detection method based on genetic algorithm for optimize XGBoost training parameters. IEEE Access 2019, 7, 118310–118321. [Google Scholar] [CrossRef]
- Wang, Z.; Klir, G.K. Fuzzy Measure Theory; Plenum Press: New York, NY, USA, 1992. [Google Scholar]
- Wang, Z.; Yang, R.; Leung, K.-S. Nonlinear Integrals and Their Applications in Data Mining; World Scientific: Singapore, 2010. [Google Scholar]
- INRIA Data Set. Available online: http://pascal.inrialpes.fr/data/human/ (accessed on 20 November 2020).


Publisher’s Note: MDPI stays neutral with regard to jurisdictional claims in published maps and institutional affiliations. |
© 2021 by the authors. Licensee MDPI, Basel, Switzerland. This article is an open access article distributed under the terms and conditions of the Creative Commons Attribution (CC BY) license (http://creativecommons.org/licenses/by/4.0/).