
An Assessment of the Hopping Strategy and Inter-Limb Asymmetry during the Triple Hop Test: A Test–Retest Pilot Study

 , ,
, ,  ,
, 

Abstract
:1. Introduction
2. Materials and Methods
2.1. Experimental Design
2.2. Participants
2.3. Procedures
3. Statistical Analysis
4. Results
5. Discussion
6. Conclusions
Author Contributions
Funding
Institutional Review Board Statement
Informed Consent Statement
Conflicts of Interest
References
- Bishop, C.; Abbott, W.; Brashill, C.; Read, P.; Lake, J.; Turner, A. Jumping asymmetries are associated with speed, change of direction speed, jump performance in elite academy soccer players. J. Strength Cond. Res. 2021. published ahead of print. [Google Scholar] [CrossRef]
- Loturco, I.; Pereira, L.; Reis, V.; Bishop, C.; Zanetti, V.; Alcaraz, P.; Freitas, T.; McGuigan, M. Power training in elite young soccer players: Effects of using loads above or below the optimum power zone. J. Sports Sci. 2020, 38, 1416–1422. [Google Scholar] [CrossRef] [PubMed]
- Cormack, S.; Newton, R.; McGuigan, M.; Doyle, T. Reliability of measures obtained during single and repeated countermovement jumps. Int. J. Sports Physiol. Perform. 2008, 3, 131–144. [Google Scholar] [CrossRef] [PubMed] [Green Version]
- Gathercole, R.; Sporer, B.; Stellingwerff, T.; Sleivert, G. Alternative countermovement-jump analysis to quantify acute neuromuscular fatigue. Int. J. Sports Physiol. Perform. 2015, 10, 84–92. [Google Scholar] [CrossRef]
- Bishop, C.; Read, P.; Chavda, S.; Jarvis, P.; Turner, A. Using unilateral strength, power and reactive strength tests to detect the magnitude and direction of asymmetry: A test retest design. Sports 2019, 7, 58. [Google Scholar] [CrossRef] [PubMed] [Green Version]
- Bishop, C.; Turner, A.; Maloney, S.; Lake, J.; Loturco, I.; Bromley, T.; Read, P. Drop jump asymmetry is associated with reduced sprint and change-of-direction speed performance in adult female soccer players. Sports 2019, 7, 29. [Google Scholar] [CrossRef] [Green Version]
- King, E.; Richter, C.; Franklyn-Miller, A.; Daniels, K.; Wadey, R.; Moran, R.; Strike, S. Whole-body biomechanical differences between limbs exist 9 months after ACL reconstruction across jump/landing tasks. Scand J. Med. Sci. Sports 2018, 28, 2578. [Google Scholar] [CrossRef]
- Koo, T.; Li, M. A guideline of selecting and reporting intraclass correlation coefficients for reliability research. J. Chiro Med. 2016, 15, 155–163. [Google Scholar] [CrossRef] [Green Version]
- Kotsifaki, A.; Korakakis, V.; Whiteley, R.; Van Rossom, S.; Jonkers, I. Measuring only hop distance during single leg hop testing is insufficient to detect deficits in knee function after ACL reconstruction: A systematic review and meta-analysis. Brit. J. Sports Med. 2020, 54, 139–153. [Google Scholar] [CrossRef]
- Noyes, F.; Barber, S.; Mangine, R. Abnormal lower limb symmetry determined by function hop tests after anterior cruciate ligament rupture. Am. J. Sports Med. 1991, 19, 513–518. [Google Scholar] [CrossRef]
- Rohman, E.; Steubs, J.; Tompkins, M. Changes in involved and uninvolved limb function during rehabilitation after anterior cruciate ligament reconstruction: Implications for limb symmetry index measures. Am. J. Sports Med. 2015, 43, 1391–1398. [Google Scholar] [CrossRef]
- Read, P.; Oliver, J.; De Ste Croix, M.; Myer, G.; Lloyd, R. A review of field-based assessments of neuromuscular control and their utility in male youth soccer players. J. Strength Cond. Res. 2019, 33, 283–299. [Google Scholar] [CrossRef]
- Cuthbert, M.; Comfort, P.; Ripley, N.; McMahon, J.; Evans, M.; Bishop, C. Unilateral vs. bilateral hamstring strength assessments: Comparing reliability and inter-limb asymmetry in female soccer players. J. Sports Sci. 2021. published ahead of print. [Google Scholar] [CrossRef]
- Fort-Vanmeerhaeghe, A.; Mila-Villarroel, R.; Pujol-Marzo, M.; Arboix-Alio, J.; Bishop, C. Higher vertical jumping asymmetries and lower physical performance are indicators of increased injury incidence in youth team-sport athletes. J. Strength Cond. Res. 2021. published ahead of print. [Google Scholar]
- Grindem, H.; Snyder-Mackler, L.; Moksnes, H.; Engebretsen, L.; Risberg, M. Simple decision rules can reduce re-injury risk by 84% after ACL reconstruction: The Delaware-Oslo ACL cohort study. Br. J. Sports Med. 2016, 50, 804–808. [Google Scholar] [CrossRef]
- Webster, K.; Hewett, T. What is the evidence for and validity of return-to-sport testing after anterior cruciate ligament reconstruction surgery? A systematic review and meta-analysis. Sports Med. 2019, 49, 917–929. [Google Scholar] [CrossRef]
- Gathercole, R.; Sporer, B.; Stellingwerff, T.; Sleivert, G. Comparison of the capacity of different jump and sprint field tests to detect neuromuscular fatigue. J. Strength Cond. Res. 2015, 29, 2522–2531. [Google Scholar] [CrossRef] [PubMed]
- Bishop, C.; Abbott, W.; Brashill, C.; Read, P.; Loturco, I.; Beato, M.; Turner, A. Effects of pre-season strength training on bilateral and unilateral jump performance, the bilateral deficit in Premier League academy soccer players. Prof. Strength Cond. J. 2021. published ahead of print. [Google Scholar]
- Harry, J.; Barker, L.; Paquette, M. A joint power approach to define countermovement jump phases using force platforms. Med. Sci. Sports Exerc. 2020, 52, 993–1000. [Google Scholar] [CrossRef] [PubMed]
- Lake, J.; Mundy, P.; Comfort, P.; McMahon, J.; Suchomel, T.; Carden, P. Concurrent validity of a portable force plate using vertical jump force-time characteristics. J. Appl. Biomech. 2018, 34, 410–413. [Google Scholar] [CrossRef]
- McMahon, J.; Lake, J.; Ripley, N.; Comfort, P. Vertical jump testing in rugby league: A rationale for calculating take-off momentum. J. Appl. Biomech. 2020, 36, 370–374. [Google Scholar] [CrossRef]
- Bishop, C.; Read, P.; McCubbine, J.; Turner, A. Vertical and horizontal asymmetries are related to slower sprinting and jump performance in elite youth soccer players. J. Strength Cond. Res. 2021, 35, 56–63. [Google Scholar] [CrossRef] [Green Version]
- Dos’Santos, T.; Thomas, C.; Jones, P.; Comfort, P. Asymmetries in single and triple hop are not detrimental to change of direction speed. Trainology 2017, 6, 35–41. [Google Scholar] [CrossRef] [Green Version]
- Lockie, R.; Callaghan, S.; Berry, S.; Cooke, E.; Jordan, C.; Luczo, T.; Jeffriess, M. Relationship between unilateral jumping ability and asymmetry on multidirectional speed in team-sport athletes. J. Strength Cond. Res. 2014, 28, 3557–3566. [Google Scholar] [CrossRef] [Green Version]
- Helme, M.; Tee, J.; Emmonds, S.; Low, C. Does lower-limb asymmetry increase injury risk in sport? A systematic review. Phys. Ther. Sport 2021, 49, 204–213. [Google Scholar] [CrossRef] [PubMed]
- Herrington, L.; Ghulam, H.; Comfort, P. Quadriceps strength and functional performance after anterior cruciate ligament reconstruction in professional soccer players at time of return to sport. J. Strength Cond. Res. 2021, 35, 769–775. [Google Scholar] [CrossRef] [PubMed] [Green Version]
- Kryitsis, P.; Bahr, R.; Landreau, P.; Miladi, R.; Witvrouw, E. Likelihood of ACL graft rupture: Not meeting six clinical discharge criteria before return to sport is associated with a four times greater risk of rupture. Brit. J. Sports Med. 2016, 50, 946–951. [Google Scholar] [CrossRef] [PubMed]
- Bishop, C.; Read, P.; Chavda, S.; Jarvis, P.; Brazier, J.; Bromley, T.; Turner, A. Magnitude or direction? Seasonal variation of interlimb asymmetry in elite academy soccer players. J. Strength Cond. Res. 2021. published ahead of print. [Google Scholar] [CrossRef]
- Lockie, R.; Jeffriess, M.; Schultz, A.; Callaghan, S. Relationship between absolute and relative power with linear and change-of-direction speed in junior American football players from Australia. J. Aust. Strength Cond. 2014, 20, 4–12. [Google Scholar]
- Walter, S.; Eliasziw, M.; Donner, A. Sample size and optimal designs for reliability studies. Stats Med. 1998, 17, 101–110. [Google Scholar] [CrossRef]
- Jeffreys, I. Warm-up revisited: The RAMP method of optimizing warm-ups. Prof. Strength Cond. J. 2007, 6, 12–18. [Google Scholar]
- Munro, A.; Herrington, L. Between-session reliability of four hop tests and the agility T-test. J. Strength Cond. Res. 2011, 25, 1470–1477. [Google Scholar] [CrossRef]
- Jarvis, P.; Turner, A.; Chavda, S.; Bishop, C. The acute effects of heavy sled towing on subsequent sprint acceleration performance. J. Trainol. 2017, 6, 18–25. [Google Scholar] [CrossRef] [Green Version]
- Lloyd, R.; Oliver, J.; Kember, L.; Myer, G.; Read, P. Individual hop analysis and reactive strength ratios provide better discrimination of ACL reconstructed limb deficits than triple hop for distance scores in athletes returning to sport. Knee 2020, 27, 1357–1364. [Google Scholar] [CrossRef] [PubMed]
- Dalleau, G.; Belli, A.; Viale, F.; Lacour, J.; Bourdin, M. A simple method for field measurements of leg stiffness in hopping. Int. J. Sports Med. 2004, 25, 170–176. [Google Scholar] [PubMed]
- Bishop, C.; Lake, J.; Loturco, I.; Papadopoulos, K.; Turner, A.; Read, P. Interlimb asymmetries: The need for an individual approach to data analysis. J. Strength Cond. Res. 2021, 35, 695–701. [Google Scholar] [CrossRef]
- Bishop, C.; Read, P.; Lake, J.; Chavda, S.; Turner, A. Inter-limb asymmetries: Understanding how to calculate differences from bilateral and unilateral tests. Strength Cond. J. 2018, 40, 1–6. [Google Scholar] [CrossRef] [Green Version]
- Exell, T.; Irwin, G.; Gittoes, M.; Kerwin, D. Implications of intra-limb variability on asymmetry analyses. J. Sports Sci. 2012, 30, 403–409. [Google Scholar] [CrossRef] [PubMed]
- Viera, A.; Garrett, J. Understanding the interobserver agreement: The kappa statistic. Fam. Med. 2005, 37, 360–363. [Google Scholar]
- Rhea, M. Determining the magnitude of treatment effects in strength training research through the use of the effect size. J. Strength Cond. Res. 2004, 18, 918–920. [Google Scholar]


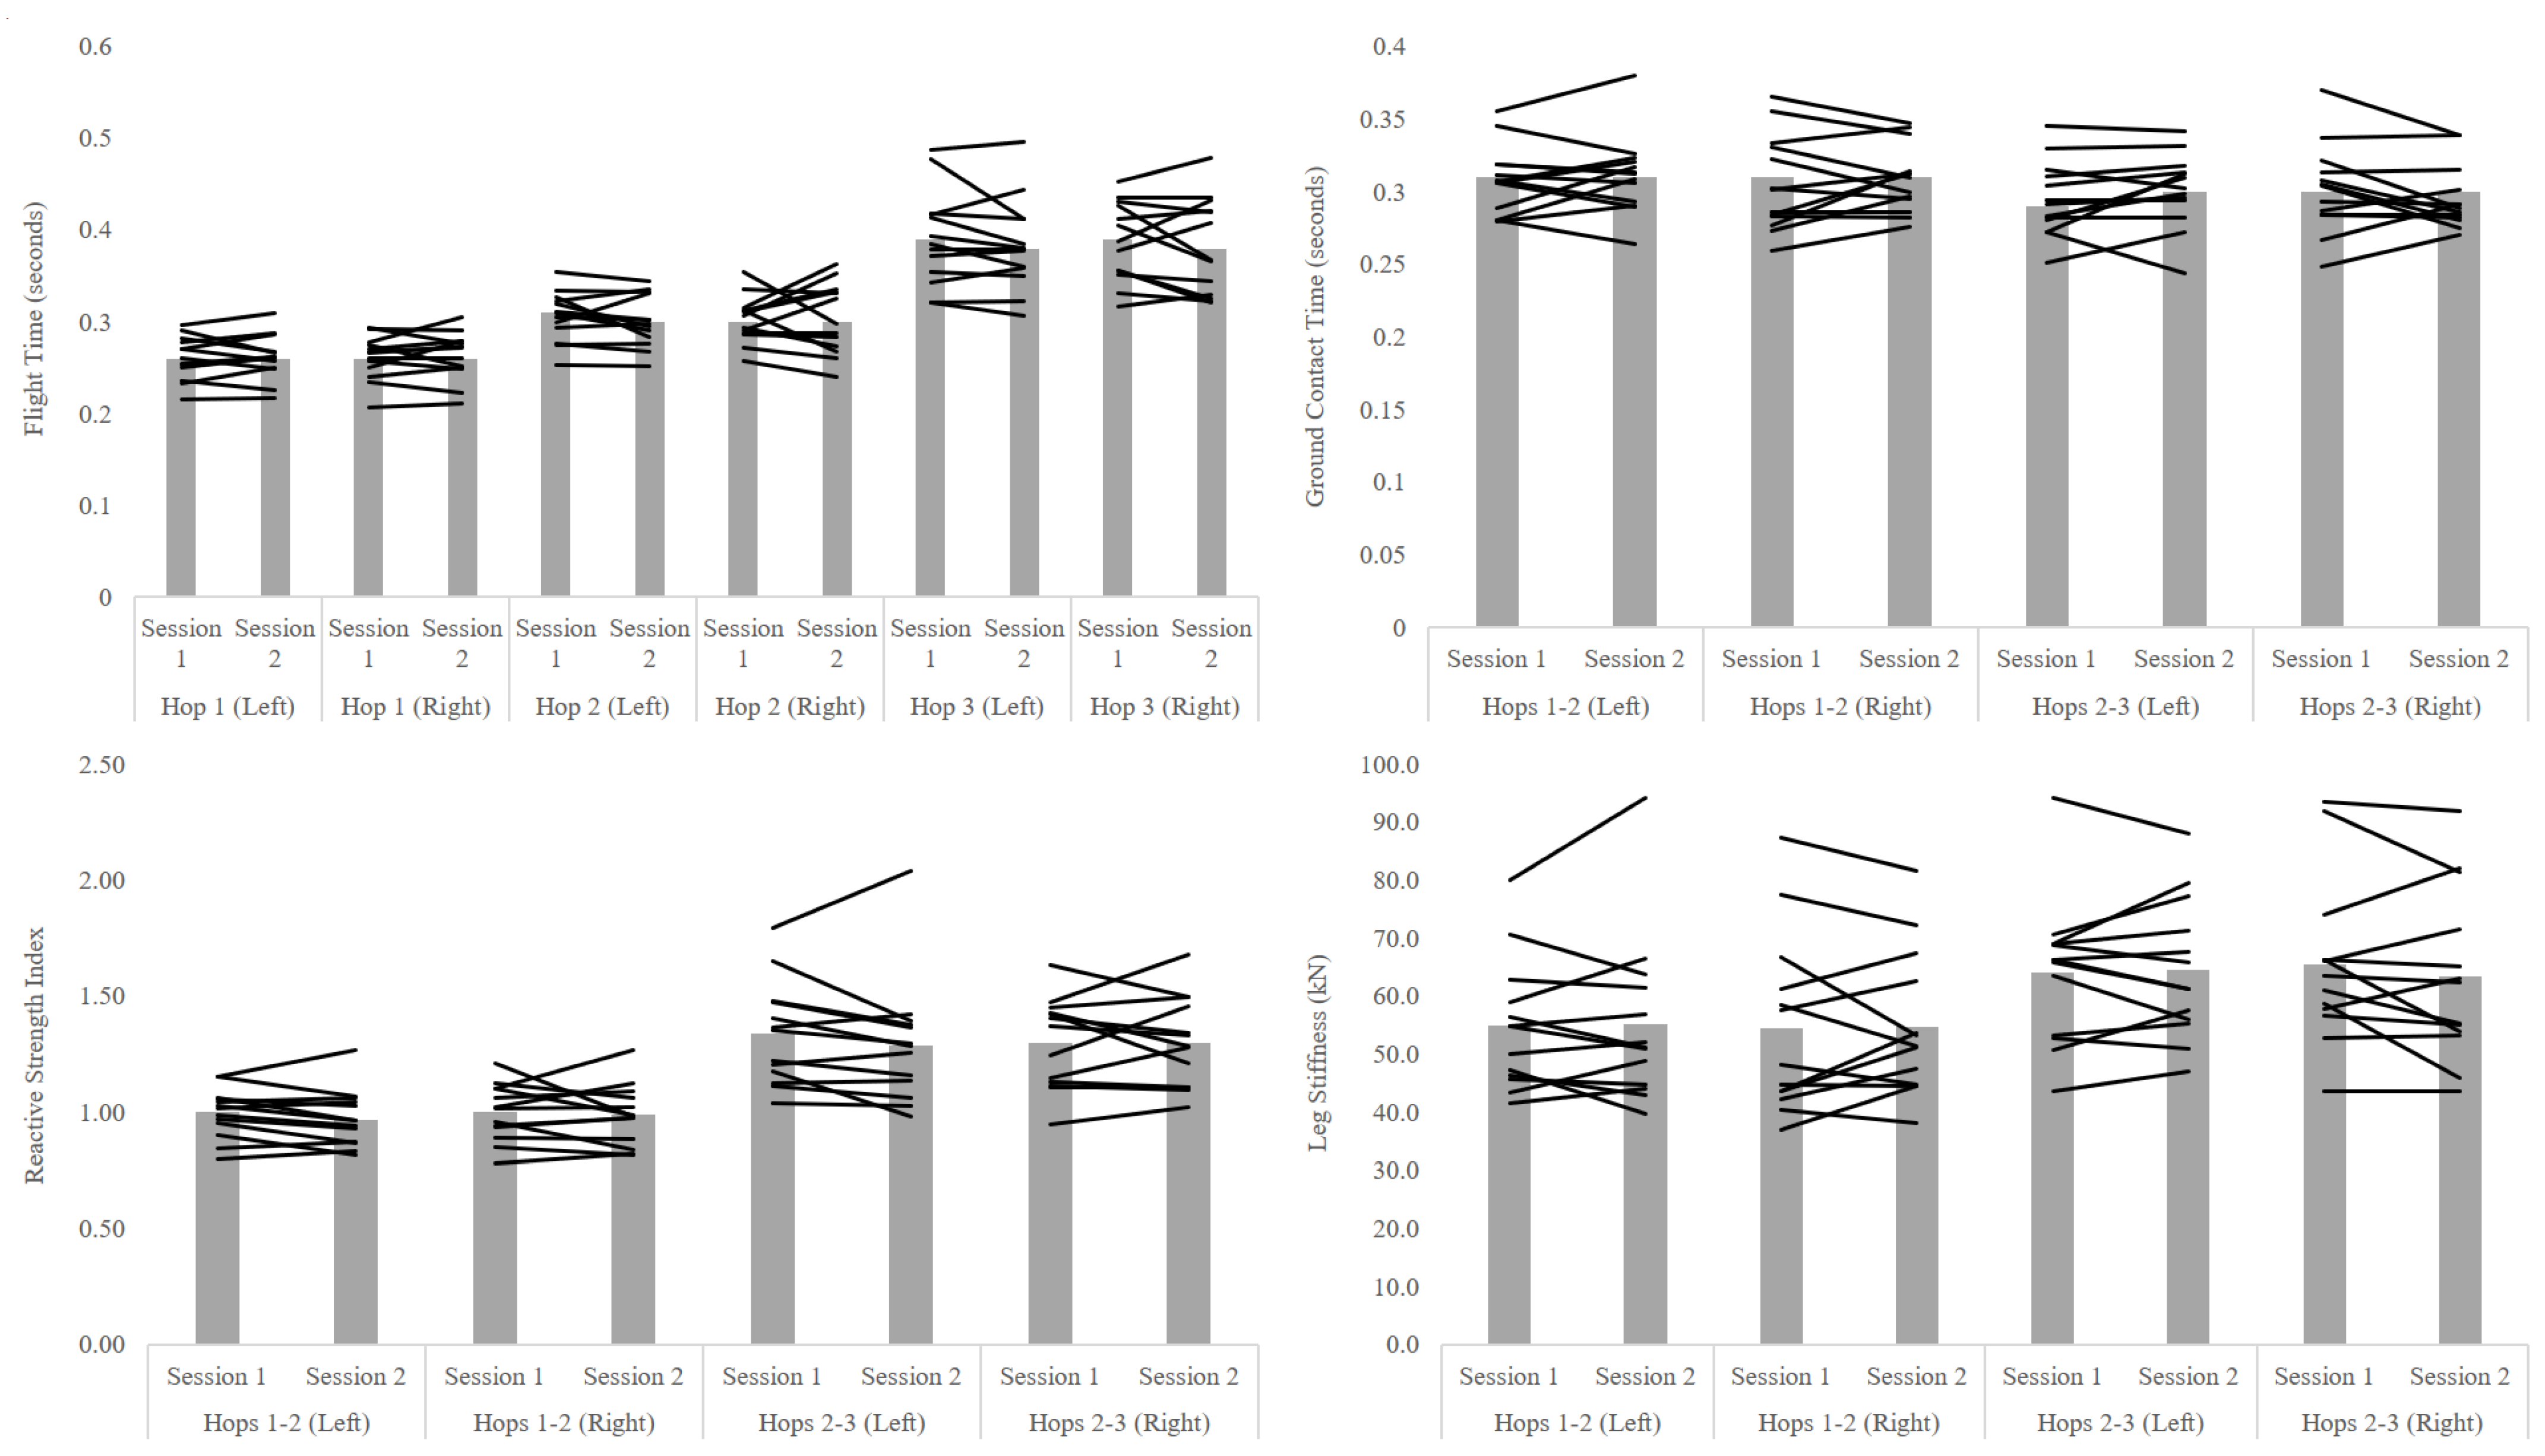
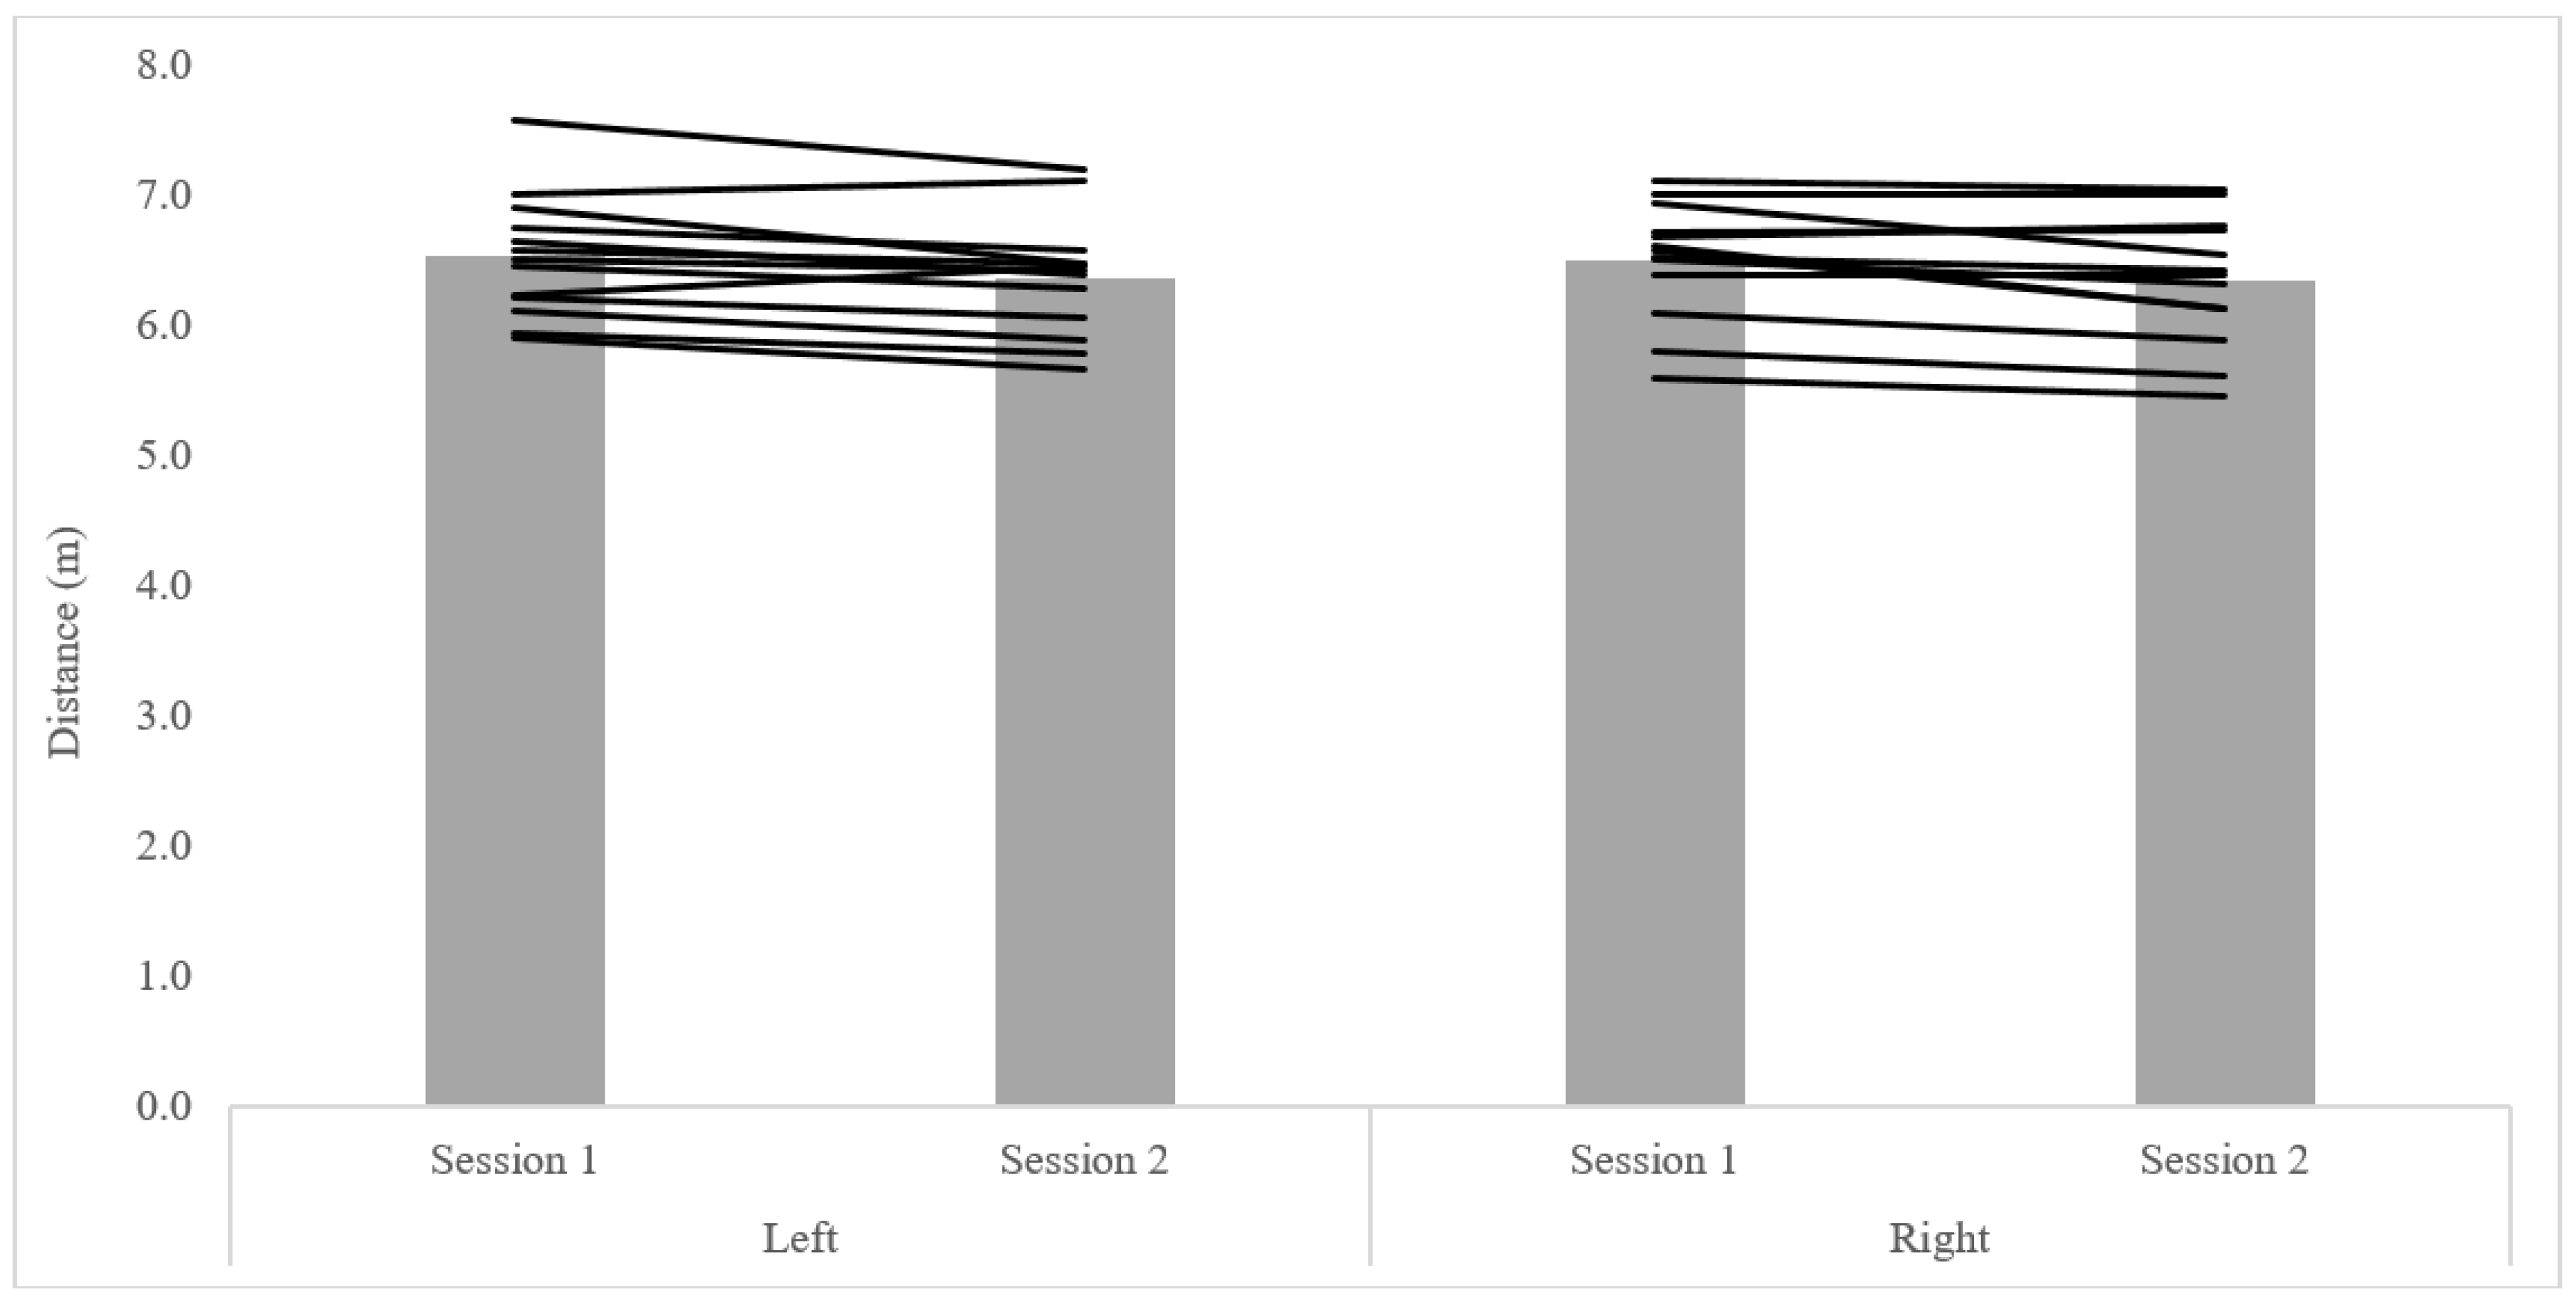
| Test Variable | Session 1 | Session 2 | Hedges’s g (95% CI) |
|---|---|---|---|
| Total Distance (m) | |||
| Left | 6.53 ± 0.47 | 6.37 ± 0.45 | −0.34 (−0.99, 0.31) |
| Right | 6.50 ± 0.45 | 6.34 ± 0.50 | −0.33 (−0.98, 0.32) |
| Flight Time (s): | |||
| Hop 1 (L) | 0.26 ± 0.02 | 0.26 ± 0.02 | 0.00 (−0.65, 0.65) |
| Hop 1 (R) | 0.26 ± 0.02 | 0.26 ± 0.03 | 0.00 (−0.65, 0.65) |
| Hop 2 (L) | 0.31 ± 0.03 | 0.30 ± 0.03 | −0.32 (−0.97, 0.33) |
| Hop 2 (R) | 0.30 ± 0.03 | 0.30 ± 0.04 | 0.00 (−0.65, 0.65) |
| Hop 3 (L) | 0.39 ± 0.05 | 0.38 ± 0.05 | −0.19 (−0.84, 0.45) |
| Hop 3 (R) | 0.39 ± 0.04 | 0.38 ± 0.05 | −0.21 (−0.86, 0.43) |
| Ground Contact Time (s): | |||
| Hops 1−2 (L) | 0.31 ± 0.02 | 0.31 ± 0.03 | 0.00 (−0.65, 0.65) |
| Hops 1−2 (R) | 0.31 ± 0.03 | 0.31 ± 0.02 | 0.00 (−0.65, 0.65) |
| Hops 2−3 (L) | 0.29 ± 0.03 | 0.30 ± 0.03 | 0.32 (−0.33, 0.97) |
| Hops 2−3 (R) | 0.30 ± 0.03 | 0.30 ± 0.02 | 0.00 (−0.65, 0.65) |
| Reactive Strength Index: | |||
| Hops 1−2 (L) | 1.00 ± 0.11 | 0.97 ± 0.12 | −0.25 (−0.90, 0.40) |
| Hops 1−2 (R) | 1.00 ± 0.12 | 0.99 ± 0.13 | −0.08 (−0.72, 0.57) |
| Hops 2−3 (L) | 1.34 ± 0.22 | 1.29 ± 0.27 | −0.20 (−0.84, 0.45) |
| Hops 2−3 (R) | 1.30 ± 0.20 | 1.30 ± 0.19 | 0.00 (−0.65, 0.65) |
| Leg Stiffness (kN*m−1): | |||
| Hops 1−2 (L) | 54.85 ± 11.21 | 55.20 ± 14.39 | 0.03 (−0.62, 0.67) |
| Hops 1−2 (R) | 54.51 ± 15.45 | 54.81 ± 12.63 | 0.02 (−0.62, 0.67) |
| Hops 2−3 (L) | 64.15 ± 12.49 | 64.57 ± 11.96 | 0.03 (−0.61, 0.68) |
| Hops 2−3 (R) | 65.56 ± 14.17 | 63.45 ± 14.66 | −0.14 (−0.79, 0.50) |
| Test Variable | Session 1 | Session 2 | Between-Session | |||
|---|---|---|---|---|---|---|
| CV (%) | ICC (95% CI) | CV (%) | ICC (95% CI) | CV (%) | ICC (95% CI) | |
| Total Distance: | ||||||
| Left | 2.7 | 0.92 (0.80, 0.98) | 2.56 | 0.94 (0.88, 0.99) | 2.26 | 0.95 (0.90, 0.99) |
| Right | 2.82 | 0.90 (0.79, 0.97) | 2.32 | 0.92 (0.83, 0.98) | 2.03 | 0.94 (0.89, 0.99) |
| Flight Time: | ||||||
| Hop 1 (L) | 5.42 | 0.71 (0.45, 0.87) | 4.38 | 0.74 (0.50, 0.89) | 3.26 | 0.86 (0.67, 0.95) |
| Hop 1 (R) | 3.94 | 0.86 (0.71, 0.94) | 4.34 | 0.82 (0.63, 0.92) | 3.15 | 0.84 (0.62, 0.94) |
| Hop 2 (L) | 6.91 | 0.60 (0.30, 0.82) | 6.66 | 0.55 (0.23, 0.79) | 3.03 | 0.81 (0.57, 0.93) |
| Hop 2 (R) | 6.8 | 0.55 (0.23, 0.79) | 7.39 | 0.82 (0.63, 0.92) | 5.76 | 0.55 (0.12, 0.80) |
| Hop 3 (L) | 7.34 | 0.69 (0.41, 0.86) | 6.43 | 0.77 (0.54, 0.90) | 2.92 | 0.91 (0.78, 0.97) |
| Hop 3 (R) | 6.89 | 0.66 (0.38, 0.85) | 6.67 | 0.82 (0.64, 0.93) | 4.51 | 0.83 (0.61, 0.93) |
| Ground Contact Time: | ||||||
| Hops 1−2 (L) | 6.36 | 0.58 (0.27, 0.81) | 5.8 | 0.72 (0.46, 0.88) | 3.68 | 0.77 (0.49, 0.91) |
| Hops 1−2 (R) | 4.93 | 0.82 (0.63, 0.93) | 5.23 | 0.64 (0.35, 0.84) | 3.8 | 0.79 (0.52, 0.92) |
| Hops 2−3 (L) | 5.2 | 0.61 (0.31, 0.82) | 5.83 | 0.63 (0.33, 0.83) | 3.3 | 0.79 (0.53, 0.92) |
| Hops 2−3 (R) | 5.72 | 0.77 (0.54, 0.90) | 4.8 | 0.53 (0.22, 0.77) | 3.8 | 0.76 (0.46, 0.90) |
| Reactive Strength Index: | ||||||
| Hops 1−2 (L) | 7.44 | 0.61 (0.31, 0.82) | 6.59 | 0.77 (0.55, 0.90) | 4.13 | 0.87 (0.68, 0.95) |
| Hops 1−2 (R) | 6.48 | 0.71 (0.45, 0.87) | 8.43 | 0.65 (0.36, 0.84) | 5.26 | 0.70 (0.36, 0.88) |
| Hops 2−3 (L) | 8.24 | 0.67 (0.39, 0.85) | 8.46 | 0.84 (0.67, 0.93) | 5.22 | 0.89 (0.73, 0.96) |
| Hops 2−3 (R) | 7.51 | 0.82 (0.64, 0.93) | 9.04 | 0.68 (0.41, 0.86) | 5.34 | 0.80 (0.55, 0.92) |
| Leg Stiffness: | ||||||
| Hops 1−2 (L) | 10.67 | 0.78 (0.57, 0.91) | 10.3 | 0.86 (0.71, 0.94) | 5.96 | 0.90 (0.76, 0.96) |
| Hops 1−2 (R) | 9.6 | 0.90 (0.78, 0.96) | 8.07 | 0.92 (0.82, 0.97) | 8.07 | 0.89 (0.73, 0.96) |
| Hops 2−3 (L) | 9.57 | 0.76 (0.52, 0.90) | 8.05 | 0.80 (0.60, 0.92) | 5.12 | 0.91 (0.78, 0.97) |
| Hops 2−3 (R) | 10.25 | 0.77 (0.55, 0.90) | 7.65 | 0.85 (0.68, 0.94) | 5.65 | 0.91 (0.78, 0.97) |
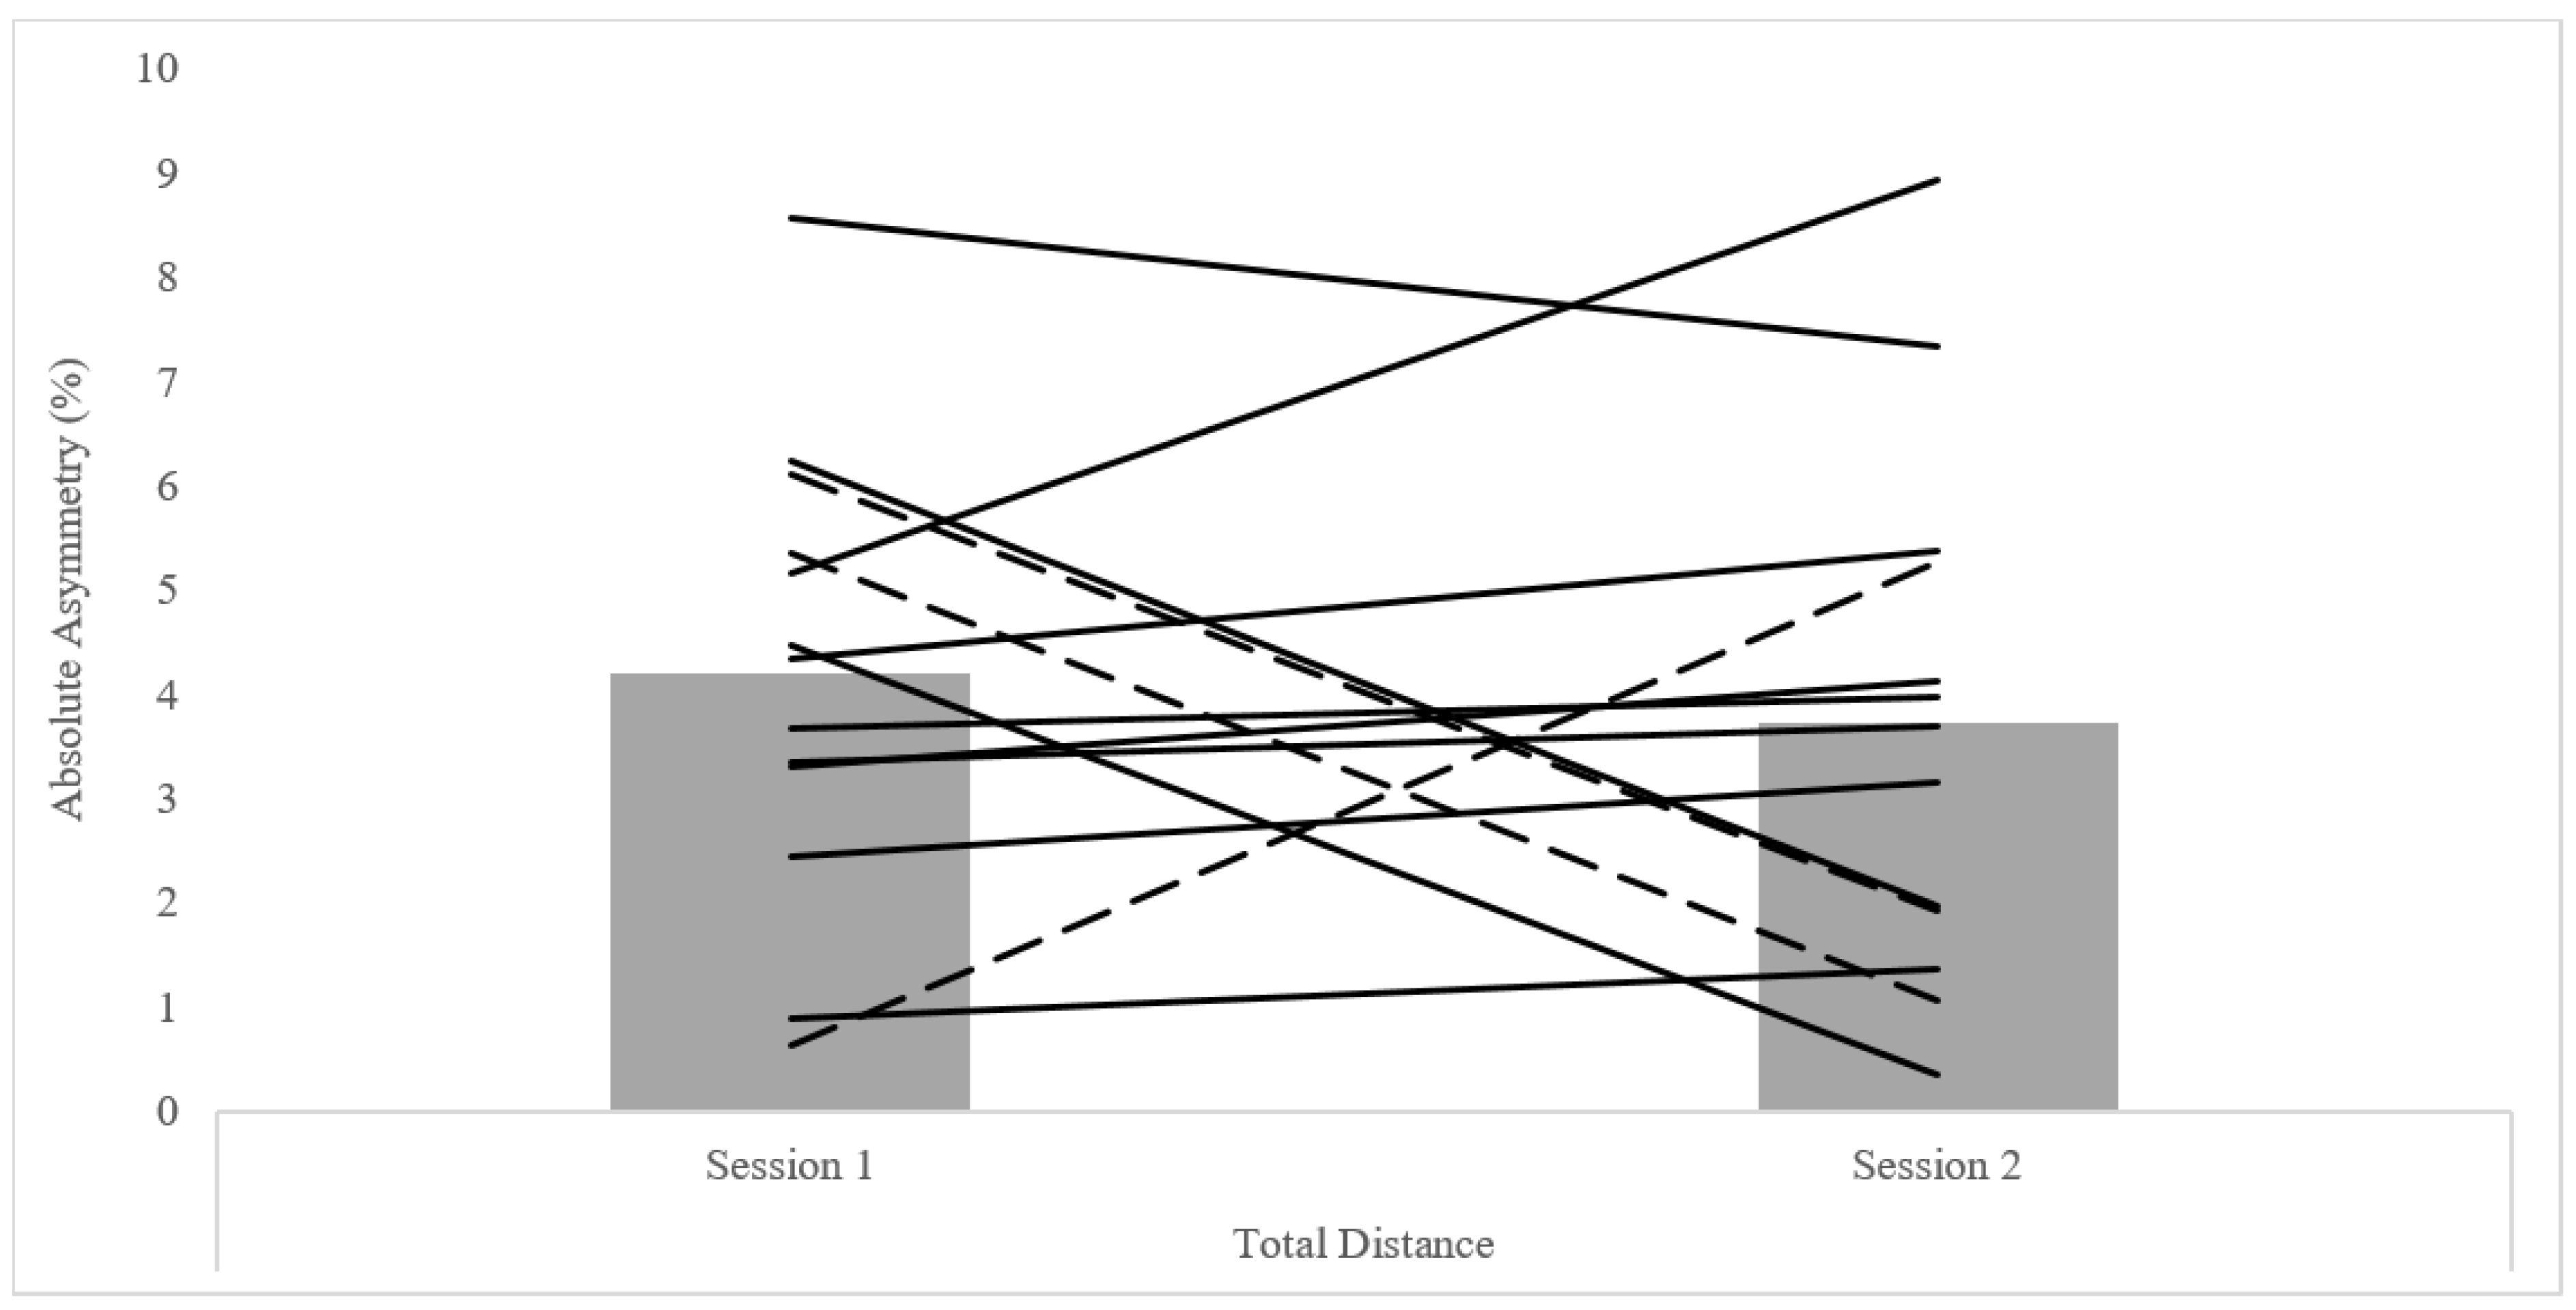
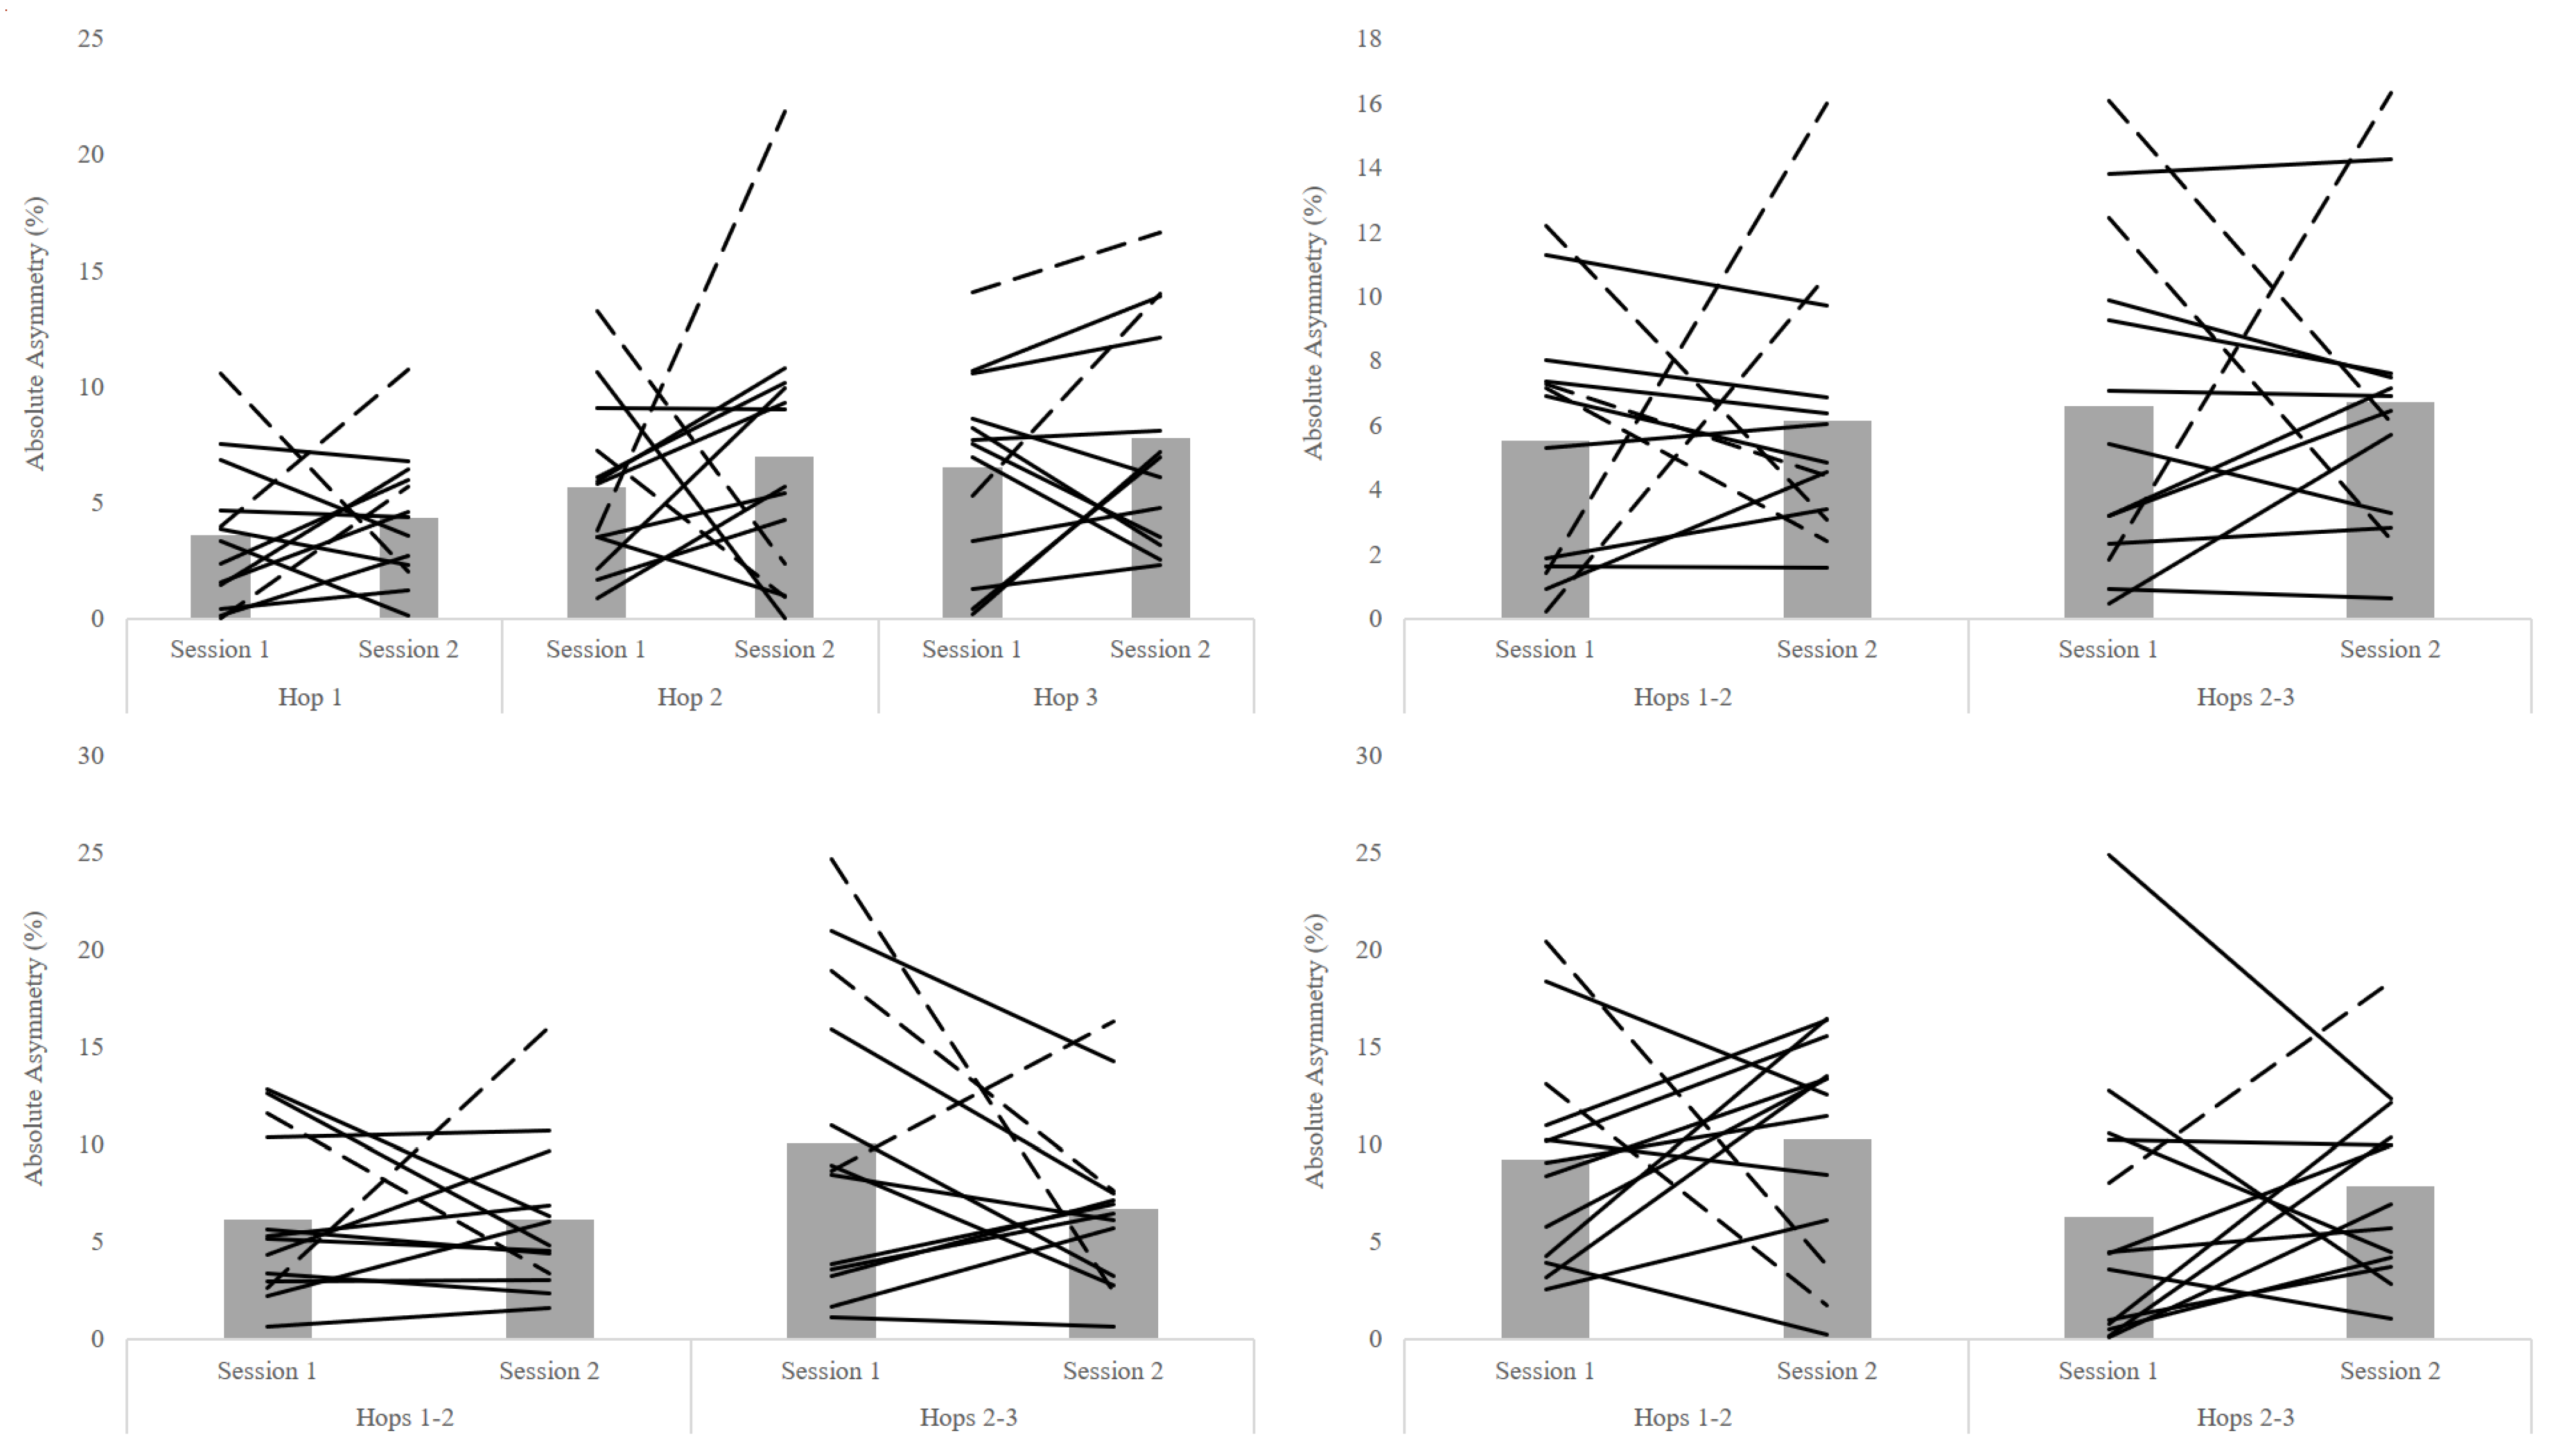
| Asymmetry Variable | Session 1 (%) | Session 2 (%) | Hedges’s g (95% CI) | Kappa (Descriptor) |
|---|---|---|---|---|
| Total Distance: | 4.20 ± 2.20 | 3.73 ± 2.52 | −0.19 (−0.84, 0.45) | 0.38 (fair) |
| Flight Time: | ||||
| Hop 1 | 3.59 ± 3.17 | 4.34 ± 2.83 | 0.24 (−0.41, 0.89) | 0.69 (substantial) |
| Hop 2 | 5.65 ± 3.67 | 6.97 ± 5.91 | 0.26 (−0.39, 0.91) | 0.07 (slight) |
| Hop 3 | 6.52 ± 4.26 | 7.79 ± 4.86 | 0.27 (−0.38, 0.92) | −0.10 (poor) |
| Ground Contact Time: | ||||
| Hops 1−2 | 5.50 ± 3.98 | 6.15 ± 3.99 | 0.16 (−0.49, 0.80) | 0.37 (fair) |
| Hops 2−3 | 6.60 ± 5.24 | 6.70 ± 4.43 | 0.02 (−0.63, 0.67) | 0.15 (slight) |
| Reactive Strength Index: | ||||
| Hops 1−2 | 6.13 ± 4.23 | 8.66 ± 6.83 | 0.43 (−0.22, 1.08) | 0.07 (slight) |
| Hops 2−3 | 10.09 ± 7.80 | 11.80 ± 7.48 | 0.22 (−0.43, 0.86) | 0.39 (fair) |
| Leg Stiffness: | ||||
| Hops 1−2 | 9.26 ± 5.59 | 10.23 ± 5.60 | 0.17 (−0.48, 0.81) | 0.07 (slight) |
| Hops 2−3 | 6.28 ± 7.10 | 7.85 ± 4.86 | 0.25 (−0.40, 0.90) | −0.10 (poor) |
Publisher’s Note: MDPI stays neutral with regard to jurisdictional claims in published maps and institutional affiliations. |
© 2021 by the authors. Licensee MDPI, Basel, Switzerland. This article is an open access article distributed under the terms and conditions of the Creative Commons Attribution (CC BY) license (https://creativecommons.org/licenses/by/4.0/).
Share and Cite
Davey, K.; Read, P.; Coyne, J.; Jarvis, P.; Turner, A.; Brazier, J.; Šarabon, N.; Jordan, M.J.; Bishop, C. An Assessment of the Hopping Strategy and Inter-Limb Asymmetry during the Triple Hop Test: A Test–Retest Pilot Study. Symmetry 2021, 13, 1890. https://doi.org/10.3390/sym13101890
Davey K, Read P, Coyne J, Jarvis P, Turner A, Brazier J, Šarabon N, Jordan MJ, Bishop C. An Assessment of the Hopping Strategy and Inter-Limb Asymmetry during the Triple Hop Test: A Test–Retest Pilot Study. Symmetry. 2021; 13(10):1890. https://doi.org/10.3390/sym13101890
Chicago/Turabian StyleDavey, Kyle, Paul Read, Joseph Coyne, Paul Jarvis, Anthony Turner, Jon Brazier, Nejc Šarabon, Matthew J. Jordan, and Chris Bishop. 2021. "An Assessment of the Hopping Strategy and Inter-Limb Asymmetry during the Triple Hop Test: A Test–Retest Pilot Study" Symmetry 13, no. 10: 1890. https://doi.org/10.3390/sym13101890
APA StyleDavey, K., Read, P., Coyne, J., Jarvis, P., Turner, A., Brazier, J., Šarabon, N., Jordan, M. J., & Bishop, C. (2021). An Assessment of the Hopping Strategy and Inter-Limb Asymmetry during the Triple Hop Test: A Test–Retest Pilot Study. Symmetry, 13(10), 1890. https://doi.org/10.3390/sym13101890