Abstract
Recently, 360° content has emerged as a new method for offering real-life interaction. Ultra-high resolution 360° content is mapped to the two-dimensional plane to adjust to the input of existing generic coding standards for transmission. Many formats have been proposed, and tremendous work is being done to investigate 360° videos in the Joint Video Exploration Team using projection-based coding. However, the standardization activities for quality assessment of 360° images are limited. In this study, we evaluate the coding performance of various projection formats, including recently-proposed formats adapting to the input of JPEG and JPEG 2000 content. We present an overview of the nine state-of-the-art formats considered in the evaluation. We also propose an evaluation framework for reducing the bias toward the native equi-rectangular (ERP) format. We consider the downsampled ERP image as the ground truth image. Firstly, format conversions are applied to the ERP image. Secondly, each converted image is subjected to the JPEG and JPEG 2000 image coding standards, then decoded and converted back to the downsampled ERP to find the coding gain of each format. The quality metrics designed for 360° content and conventional 2D metrics have been used for both end-to-end distortion measurement and codec level, in two subsampling modes, i.e., YUV (4:2:0 and 4:4:4). Our evaluation results prove that the hybrid equi-angular format and equatorial cylindrical format achieve better coding performance among the compared formats. Our work presents evidence to find the coding gain of these formats over ERP, which is useful for identifying the best image format for a future standard.
1. Introduction
Technology development and social demand have caused rapid progress in virtual reality (VR) applications. VR content is also called 360° content, or omnidirectional content, which covers 360° horizontal and 180° vertical. These contents are spherical in nature, providing the user with an extraordinary experience of navigating a captured scene of the real world in every direction. Many devices have recently been supplied for VR, including Oculus Rift, HTC VIVE, Sony PlayStation VR, and Samsung GearVR. For immersive visual experiences, a high resolution and high frame rate (e.g., 8K at 90 frames per second) are expected, and therefore, the file size of the content tends to be very large. This requires extensive resources for storage and bandwidth and causes transmission delays. Additionally, 360° content distribution is expected to push the current storage and network capacities to their limits. Most head-mounted displays (HMDs) currently available on the market provide up to ultra high-definition (UHD) display resolution. As these devices usually provide a 110° field-of-view, 4K resolution is being widely accepted as a minimum functional resolution for the full 360° planar signal. However, HMDs with 4K or 8K display resolution already appear on the market. Thus, 360° planar signals with 12K or higher resolution will have to be efficiently stored and transmitted, and soon [1].
For a 360° view and an immersive experience, the demand for high-resolution 360° content is high, and therefore, improving the compression efficiency of the content is an urgent demand. However, there is no suitable encoding technique for 360° content. Thus, mapping the spherical content to a 2D plane is a common choice. The Joint Video Exploration Team (JVET) of ITU-T SG16 WP3 and ISO/IEC JTC1/SC29/WG11 also suggested to use existing coding systems for efficient compressions such as the H.264/AVC video coding standard [2] and high-efficiency video coding (HEVC) standard [3]. This activity significantly affects the development of VR applications. Several 360° coding methods have been proposed in this context, and these can be categorized into three groups, based on existing coding standards. The first type is projection-based coding [4], which projects the spherical content on a two-dimensional plane. The second type is an optimization-based coding method [5] that improves the coding efficiency based on the features of the content. The third type is called a region-of-interest (ROI)-based coding method [5], and improves the coding efficiency of the content by transmitting a portion of the content in high quality based on a corresponding user ROI, and the rest in lower quality. The JVET was established in October 2015 to explore the recent advances and create a future coding standard called the versatile video codec (VVC), or H.266. The essential consideration is to find an optimal way for the efficient compression of these contents. The JVET invited interested parties from the industry, and many formats have been proposed so far. These formats are normally criticized over the artifacts introduced by the format conversion. Each format has its own merits and demerits, and different formats may introduce different artifacts [4] such as redundant samples, shape distortion, and discontinuous boundaries, which reduce the coding efficiency. Some areas are oversampled in these formats and are then criticized for causing the encoding to waste many bits. Thus, various mapping methods have been proposed [6,7,8,9] with less distortion and pixel wasting. Many companies are developing more efficient 360° video and image compression methods, delivery systems, and products. Some preliminary 360° image and video services are already provided on several major image and video platforms, such as Facebook and YouTube. Typical formats include Equirectangular (ERP), which is the most widely used format, because it is intuitive and easy to generate [10], and cubemap (CMP), which maps the scene onto six faces of a cube and rearranges and packs the data for conversion into the coding geometry [11]. No matter which format is used, the encoding process will not be done in the spherical domain. An inverse mapping operation should be applied at the display side to convert back to the display geometry. So far, thirteen formats, ACP, AEP, CISP, CMP, EAC, equal-area projection (EAP), ECP, ERP, HEC, octahedron projection (OHP), RSP, segmented sphere projection (SSP), and truncated square pyramid (TSP), are proposed, and JVET is investigating the effects of various formats on the coding performance. It is also common in the industry to support multiple formats, as they provide a more personalized experience to users. Taking into account the aforementioned industry’s needs, the omnidirectional media format (OMAF) standard supports the cubemap format. These formats may be useful for efficient compression and for use in the gaming industry and 360° services such as maps, museum tours, and architectural scenes.
To assess the performance of these formats and compression technologies for the 360° content or to develop new algorithms, it is essential to evaluate the existing methods accurately. This study focuses on finding the effects of coding efficiency and provides an overview of the quality evaluation framework for various 360° image formats. The framework is designed to generate various formats of 360° image by the format conversion considered as a primary aspect of the proposed framework. The quality can be measured at different points in the processing workflow, and using different objective quality metrics (OQMs) to evaluate the impact on OQMs of various formats and codecs, the results are analyzed.
The standardization activities of quality performance for ranking these formats for a future image coding standard are limited. The existence of the numerous formats proposed so far influences a business’s choice of configuration for their work or research, so there is a need to produce evidence of selecting the best format from among the state-of-the-art formats. The main contributions can be summarized as follows:
- We aim to find the coding efficiency of various formats for the 360° image when the ERP image is given.
- We evaluate JPEG and JPEG 2000 as widely used image coding standards in two subsampling modes (4:4:4 and 4:2:0).
- We consider the downsampled ERP as the ground truth image in our evaluation. Format conversion is applied to the downsampled ERP to find the coding gain of other formats.
- We consider the recently proposed formats of equi-angular projection (EAC), equatorial cylindrical projection (ECP), and hybrid equi-angular projection (HEC).
- We evaluate outcomes using quality metrics designed for 360° content and conventional 2D metrics and analyze their effects.
- We evaluate both codec-level distortions and end-to-end (E2E) distortions.
- We choose the image sizes recommended by a common test condition (CTC) of JVET [12].
The remainder of this paper is organized as follows. Section 2 introduces a brief overview of projection formats, objective quality metrics, and related works. Section 3 presents our proposed framework for the evaluation of 360° image projection formats. Section 4 presents the experimental setup, datasets, and evaluation results, followed by a discussion. Finally, Section 5 concludes the paper with future research directions.
2. Related Works
A testing procedure on the exploration of coding efficiency of different formats for videos (especially) is carried out in [13]. The framework is based on the coding performance of projection formats, as shown in Figure 1. Before encoding the image or video, it passes through steps A to F. First, the content is captured by covering the scene in all directions via an array of cameras, and the content is stitched to achieve the spherical view in high resolution. The content is projected on a two-dimensional plane (also known as “conversion to coding geometry”) and packed to use the generic image or video coding frameworks. The content is encoded and then decoded, and an inverse operation is performed, shown as F’ to A’. Quality metrics designed for 360° are used at two levels, i.e., for codec distortion measurement between F and F’, and for E2E distortion measurement between B and B’. More detail on the projection formats is preferentially referred to in [4,14,15].
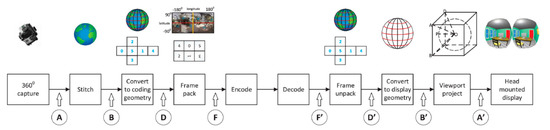
Figure 1.
360° image processing workflow [13].
A projection-based coding technique projects the spherical content onto the 2D plane and uses a generic coding standard for the subsequent compression. Projection formats introduced in the JVET activities include adjusted cubemap projection (ACP), adjusted equal-area projection (AEP), CMP, EAC, ECP, ERP, rotated sphere projection (RSP), compact icosahedron projection (CISP), and HEC. HEC was originally called the modified cubemap projection (MCP) but was changed to HEC because it was based on EAC format. ERP and cubemap are famous formats in the industry. An ERP image maps the sphere to a 2D rectangle by stretching the pixels in the latitude direction to construct a rectangle, which has severe effects for the north and south pole of the sphere insofar as bandwidth consumption. In contrast, CMP maps the sphere on the six faces of a cube, which can mitigate geometry distortions caused by scaling. Therefore, the CMP can achieve a higher coding efficiency than the ERP. ACP [16], EAC [17], and HEC [18,19] are modified versions of CMP. Mapping the sphere on the cube faces results in the edge getting more pixels than the face of the cube, and this oversampling problem is resolved in ACP and EAC. Further, a more uniform sample is provided in HEC using the EAC. AEP is a modification of conventional ERP, and EAP was proposed to solve the oversampling problem in ERP. EAP guarantees that the area in the 2D plane is equal to the original sphere’s area [20]. EAP was replaced by AEP [21] to improve the compression performance and avoid the visual quality problem around the poles caused by the conventional EAP format. ERP and EAP are the two most original formats that were derived from the map projection. Thus, the compression efficiency is not a key factor to be considered [4]. ECP is a modified version of the cylindrical projection format [22]. It has no distortion along the equator, but distortion increases rapidly toward the poles. Unlike ERP, it preserves the scale of vertical objects, e.g., buildings, which is important for architectural scenes. CISP was proposed by Samsung and is known as a patch-based format that decreases the oversampling at the cost of discontinuous boundaries [4]. RSP was proposed by Go Pro Inc. [4] to improve coding efficiency, and in RSP, the original sphere is rotated before projection. This format unfolds the sphere under two different rotation angles and stitches them together like the surface of a baseball.
Evaluation of 360° videos using projection-based coding techniques was carried out by Z. Chen et al. [4]. A number of formats and quality evaluation methods were reviewed, where the various orientation of omnidirectional video research was opened. Different formats introduce different artifacts, such as redundant samples, shape distortions, and discontinuous boundaries, which reduce the coding efficiency. It is reported that ACP outperforms other formats, as far as the coding efficiency of the HEVC test model (HM)/HEVC [23] is concerned. Recently, new formats have been proposed by Qualcomm and MediaTek, i.e., ECP and HEC, and it is reported in the JVET that HEC shows better coding efficiency, as it has a more uniform sampling [19]. A scalable 360° coding technique is reported in the literature, as ROI-based coding can save approximately 75% in average bitrate, with no significant decrease in quality. The viewer’s point of view (POV) is encoded in high quality, and the non-POV area is encoded in low quality based on the ERP format, leading to high bitrate savings [5].
Quality assessment is a critical issue for 360° content. Because the content is rendered on the sphere after decoding for human watching, the traditional peak signal-to-noise ratio (PSNR) does not reflect the actual quality. Many experiments indicate that the structural similarity index (SSIM) is more consistent with a subjective quality evaluation than PSNR [24,25]. The use of global OQMs such as PSNR and SSIM directly in the planar mode is straightforward; however, they give the same importance to the different parts of the 360° content, which differ from classical images. The 360° content has different viewing probabilities, and probably different importance [26]. A good OQM should correlate well with the perceived distortion of a human [9]. A study on the quality metrics for 360° content reports that PSNR-related quality measures correlate well with the subjective quality [27]. Weighted spherical PSNR (WS-PSNR) was introduced by Sun et al. [28] and does not need to remap the plane; instead, it evaluates the distortion by the weights of the sampling rate.
Meanwhile, Zakharchenko et al. introduced a metric that remaps the 360° content to Craster parabolic projection PSNR (CPP-PSNR) in order to compare different geometrical representations [29]. The metric can be used for cross-format quality measurement, i.e., if the reference is 8K and the query image is 4K or in different format. However, in the proposed metric, the correlation analysis with the subjective scores is not provided. In addition, E. Upenik et al. [30] reported that quality metrics designed for 360° content do not outperform the metrics designed for conventional 2D images, such as SSIM and visual information fidelity (VIF). Another metric spherical structural similarity (SSSIM) index [31] designed especially for the 360° content based on the SSIM OQM was proposed, and made an attempt to measure the quality based on the standard SSIM. Investigations have been conducted regarding the concept that subjects consistently prefer looking at the center of the front region of the 360° content [32]. However, dependencies on the content of the video still exist. Two subjective and two objective metrics were proposed for assessing the quality, named overall difference mean opinion score, vectorized difference mean opinion score, non-content based PSNR, and CPP-PSNR. In general, all of the above metrics address the problems of the traditional metrics.
Today, a vital issue towards the development of perceptual optimized OQM is the lack of a common quality 360° dataset. A study on the subjective quality evaluation of the compressed VR images reported that the multiscale SSIM (MS-SSIM) and analysis of distortion distribution SSIM (ADD-SSIM) models led to high correlation with human visual perception [33]. A subjective 360° content database is provided [34] for quality assessment (QA) for coding applications based on subjective ratings and a differential mean opinion score (DMOS). Another 360° content database is provided, including 16 source images and 528 compressed ones [35], and can be used to facilitate future research work on a coding application.
3. Evaluation Framework
A framework is proposed for the research purpose of exploring the compression effect of various projection formats, as shown in Figure 2. We aim to find the format that offers a better performance in terms of legacy JPEG [36] and JPEG 2000 [37] formats when the ERP (ground truth) image is given, by using OQMs. The framework is useful for 360° services where several formats are used as per user interest, to see the detailed view of the scene in the various field of views (FOVs). In addition, the E2E distortion is measured, as many services use the conventional ERP format as a major format. An inverse mapping is applied to reconstruct the ERP image to attain the spherical view at the decoder side. Other formats can be used for efficient coding and more precise packing. The framework can be summarized as follows:
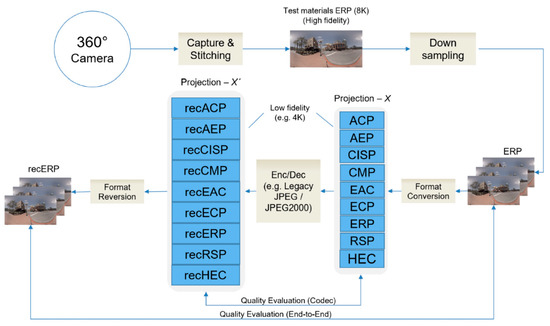
Figure 2.
Proposed evaluation framework.
- Test materials are provided in high-resolution, e.g., 8K, in ERP format commonly used by a 360° camera. The 360° camera captures several images from sensors covering 360°, then they are stitched into 3D sphere and unfolded to an ERP image.
- The high-fidelity test material is downsampled to ERP 4K (3328 × 1664) size, as this format is widely used in the industry. Since all formats except the ERP format need to go through the format conversion step, which is a lossy process that affects the quality of the content, the downsampling process is applied to eliminate the unfair bias among the ERP and other formats.
- The ERP material is converted to other formats. We denote this by Projection-X with the sizes described in Table 1, as suggested by the common test conditions (CTC) of JVET. Here, W means the width of the image, and H means the height. Eight formats of Projection-X are generated from the ERP format as a reference image for evaluating coding performances.
 Table 1. Resolution of projection formats.
 - Projection-X is subjected to the input of well-known image coding standards, such as legacy JPEG (4:4:4 and 4:2:0 subsampling) and JPEG 2000 (4:2:0 and 4:4:4 subsampling), with quantization parameters (QP) ranging from 30 to 95 for legacy JPEG and from 0.05 to 0.95 for JPEG 2000, with a 5-step difference. The images are then decoded.
- The decoded image denoted by Projection-X’ is a query image for calculating distortions at the codec level.
- We evaluate the codec level quality distortion of all formats between Projection-X and Projection-X’ to reduce the unfair bias toward the native ERP formats [38]. All of the other formats except ERP go through the format conversion step before encoding. Thus the ERP format obtains a favorable bias among the other formats.
- We revert all the formats to the ERP format denoted by recERP to calculate the E2E quality distortions.
- We evaluate the E2E quality difference between EPR and recERP using OQMs, because EPR is commonly used in the industry.
4. Results and Discussion
This section provides a brief overview of the datasets used, the selection of quality metrics, and evaluation results, followed by a discussion.
4.1. Experimental Setup
Figure 3 presents the datasets used for the evaluation, which contain various scenes, including indoor, outdoor, day, night, landscape, and architecture scenes. The sequences (a–d) are provided by JVET [39] and captured using a GoPro Omni rig, i.e., a synchronized camera array with six GoPro Hero4 Black cameras with sizes 8K (8192 × 4096). Kolor Autopano Video Pro is used to stitch the sequence, (e) and (f) are sample images captured with Insta360 Pro our laboratory camera, and (g–j) are sample images captured with Insta360 Pro [40] with sizes 8K (7680 × 3840). No encoding is done after stitching; therefore, all of the stitched content is provided in the uncompressed raw YUV format. Our selected sample images are the recommended sample images provided in the CTC of JVET.
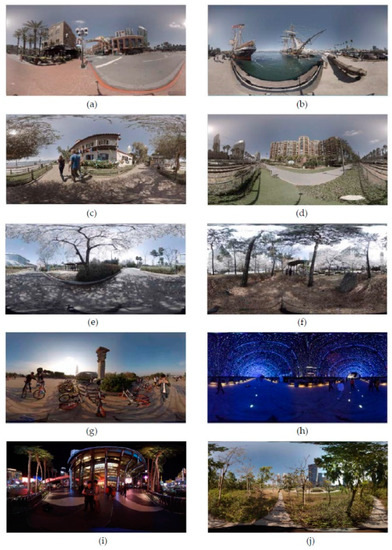
Figure 3.
(a–d) are sample images provided by JVET [39] with size (8192 × 4096), (e,f) are sample images captured with Insta360 Pro our laboratory camera with size (7680 × 3840), and (g–j) are sample image of [40] with size (7680 × 3840) taken with Insta360 Pro.
Selection of quality metrics is a crucial part of 360° quality assessment. Subjective quality assessment is more favorable for QA; however, OQM is a fast and reliable method to assess the quality performance. It can be verified by the machine, and, unlike subjective tests, is independent from each user’s perspective. We used PSNR, SSIM, VIF, and WS-PSNR as the major metrics for the evaluation. PSNR is chosen because it is the most widely used metric for quality evaluation in image processing. Previous studies on quality metrics show that PSNR-related quality measures correlate well with subjective quality [27]. WS-PSNR was also chosen because experts proposed to improve the conventional PSNR for omnidirectional images. It was claimed that the uniformly weighted calculation adopted in PSNR could not provide a correct measurement of objective quality for 360° images. To correctly measure the distortion in the observation space, the quality should be evaluated spherically. Therefore, in WS-PSNR, the error of each pixel on the projection plane is multiplied by a weight, to ensure that the equivalent spherical area in the observation space has the same influence on the distortion measurements.
Additionally, E. Upenik et al. [30] reported that quality metrics designed for 360° content do not outperform the metrics designed for conventional 2D images, so we use both the advanced and conventional quality metrics. Additionally, ADD-SSIM [41] and PSIM [42] have been proposed; those have led to high correlation with the human perception for the 360° content [33]. SSIM and VIF are measured to consider an important aspect of human perception of the spatial relationship between the pixels [43] and to find the fidelity of the content [44], respectively.
The 360Lib software is used for format conversion [45]. The library supports various formats, including ACP, AEP, CISP, CMP, EAC, ECP, ERP, RSP, and HEC, and it can also change the coding face of the image, including frame packing configurations for CMP. The ERP format is selected as an anchor format, as suggested by CTC of JVET [12].
4.2. Evaluation Results and Discussion
Owing to the rapid use of the 360° content, it is evident that VR technology has a large space for the application. However, there still exist large bandwidth consumption and storage obstacles. As compared to the traditional ERP, CMP-related formats and the ECP format have achieved significant gains. However, there still exists a contradiction between OQMs. Codec performance is measured for all the formats under consideration and eliminates the bias toward the native format. All other formats except ERP need to go through one format conversion step (that is, to convert from the native format to the coding format). Because the format conversion step introduces loss, the native format always gets a favorable bias, as it does not have to suffer the format conversion loss [38]. E2E distortion is measured between the ERP and recERP, as ERP is commonly used.
Table 2, Table 3, Table 4 and Table 5 show the results for legacy JPEG (4:2:0 and 4:4:4) for both the codec level distortion measurement and E2E measurement, respectively. Table 6, Table 7, Table 8 and Table 9 show the results for JPEG 2000 (4:2:0 and 4:4:4) for the codec level distortion measurement and E2E measurement, respectively. The Bjøntegaard delta (BD) rate is calculated [46] under the six OQMs: WS-PSNR, PSNR, SSIM, VIF, ADD-SSIM, and PSIM. Negative BD-rate values indicate the bitrate saving with respect to the reference (ERP). The evaluation results can be summarized as follows:
Table 2.
Comparison for Legacy JPEG (4:2:0) (average values of ten images) CODEC in terms of BD bit rate saving (in percentage).
Table 3.
Comparison for Legacy JPEG (4:2:0) (average values of ten images) End-to-End (E2E) in terms of BD bit rate saving (in percentage).
Table 4.
Comparison for Legacy JPEG (4:4:4) (average values of ten images) CODEC in terms of BD bit rate saving (in percentage).
Table 5.
Comparison for Legacy JPEG (4:4:4) (average values of ten images) E2E in terms of BD bit rate saving (in percentage).
Table 6.
Comparison for JPEG 2000 (4:2:0) (average values of ten images) CODEC in terms of BD bit rate saving (in percentage).
Table 7.
Comparison for JPEG 2000 (4:2:0) (average values of ten images) E2E in terms of BD bit rate saving (in percentage).
Table 8.
Comparison for JPEG 2000 (4:4:4) (average values of ten images) CODEC in terms of BD bit rate saving (in percentage).
Table 9.
Comparison for JPEG 2000 (4:4:4) (average values of ten images) E2E in terms of BD bit rate saving (in percentage).
- Legacy JPEG: We evaluate the performance of formats for both YUV 4:2:0 and YUV 4:4:4 subsampling. The codec performance of YUV 4:2:0 for legacy JPEG is shown in Table 2 and shows a significant gain over the conventional ERP format. The HEC format outperforms other formats. The E2E measurement for YUV 4:2:0 is shown in Table 3, where the gain is observed using WS-PSNR metrics. However, for the conventional metrics, no gain is observed. The same results shown in Table 4 and Table 5 are obtained for YUV 4:4:4 subsampling.
- JPEG 2000: The effect of coding efficiency for JPEG 2000 is observed as the same. Table 6 shows the codec performance in YUV 4:2:0 subsampling, which shows the gain over conventional ERP. The ECP format outperforms other formats. However, for the E2E measurement for YUV 4:2:0 shown in Table 7, the WS-PSNR shows the gain, but the conventional metrics do not show the gain. The same results are shown in Table 8 and Table 9 and are obtained for YUV 4:4:4 subsampling.
- On the average, for both YUV (4:2:0 and 4:4:4) subsampling modes, the HEC showed a 25% gain over traditional ERP for codec-level distortion measurement on legacy JPEG using WS-PSNR, and 10%, 7%, 4%, 7%, and 7%, gains for the PSNR, SSIM, VIF, ADD-SSIM, and PSIM metrics, respectively. At the E2E distortion measurement, the WS-PSNR metric showed a 9% gain over the tradition ERP format, whereas the other metrics did not show the gain. In contrast, for JPEG 2000, the ECP format showed 23%, 5%, 2%, 2%, 1%, and 1% gains over the ERP format in the codec level using WS-PSNR, PSNR, SSIM, VIF, ADD-SSIM, and PSIM metrics, respectively. However, at E2E distortion measurement, the WS-PSNR and VIF metrics showed 5% and 3% gain over ERP format, whereas the PSNR and SSIM metrics did not show the gain.
We need to note that a study for the 360° video using HMD reported that equal-area projection format shows improvement in bitrate saving over the ERP [47]. JVET has also investigated tremendous work for the 360° video and summarized the performance of projection formats, showing that hybrid angular cubemap using adaptive frame packing shows better performance adopting the input of VVC test model using E2E WS-PSNR [48]. Moreover, it is reported that the optimal format is highly content dependent for 360° videos [38] using the HM. However, the dependency of coding gain on the content is almost negligible in our evaluation as far as the coding gain of legacy JPEG and JPEG 2000 image coding is concerned.
Another study reported that the ACP format outperforms the other selected formats [4]. However, the recently proposed formats by Qualcomm and MediaTek, i.e., the ECP and HEC formats, show better performance as far as the coding efficiencies of legacy JPEG and JPEG 2000 are concerned.
Overall, we can say that the HEC and ECP formats showed a significant gain at the codec level over the traditional ERP using OQMs. However, at the E2E distortion measurement level, the WS-PSNR metric showed the gain over the conventional ERP format, whereas the other metrics did not show the gain. It is basically due to the additional format conversion and because the WS-PSNR adjusts the measurements to a spherical space, as described in Section 3.
5. Conclusions
This study evaluated 360° image projection formats as adapted to the input of legacy JPEG and JPEG 2000 images when a ground truth image is given. Various formats are generated from the ERP format. Nine state-of-the-art formats were selected for our evaluation: ACP, AEP, CISP, CMP, EAC, ECP, ERP, RSP, and HEC. We propose an evaluation framework that reduces the bias toward the ERP format by employing six OQMs: WS-PSNR, PSNR, SSIM, VIF, ADD-SSIM, and PSIM. Selected sample images have attributes that show the perceptual image quality. We conclude that the ERP format, which is currently a commonly used format in the industry, is not appropriate for coding performance. HEC and ECP were found to be the best formats from among the selected state-of-the-art formats and showed a significant gain over ERP formats at the codec level. However, there still exists a contradiction between OQMs at E2E distortion-level measurement.
Currently, the evaluation has been conducted for still images. In the future, we plan to focus on the following three research directions.
- (1)
- Extending our research for videos should prove interesting.
- (2)
- Designing a quality metric for the 360° content that correlates well with the perceived distortion of a human would be interesting for many researchers.
- (3)
- It would also be a valuable contribution to the community to have a comprehensive set of subjective tests. The subjective test can be carried out in two directions: the distortion introduced to the content due to the format conversion step for adjusting to the input of existing coding standard and the distortions caused to the content due to the codec.
Author Contributions
Conceptualization, I.H. and O.-J.K.; methodology, I.H.; validation, O.-J.K. and S.C.; data curation, I.H. and S.C.; writing—original draft preparation, I.H.; writing—review and editing, O.-J.K. and S.C.; visualization, I.H.; supervision, O.-J.K.; project administration, S.C.; funding acquisition, O.-J.K. All authors have read and agreed to the published version of the manuscript.
Funding
This research was funded by the Institute of Information & communications Technology Planning & Evaluation (IITP), grant number 2017-0-01667.
Institutional Review Board Statement
Not applicable.
Informed Consent Statement
Not applicable.
Data Availability Statement
Restrictions apply to the availability of these data. Data was obtained from JVET and Insta360. They are available at https://jvet-experts.org/ and https://www.insta360.com/kr/product/insta360-pro/ with the permission of JVET and Insta 360, respectively.
Acknowledgments
This work was supported by the Institute of Information & communications Technology Planning & Evaluation (IITP) grant funded by the Korean government (MSIT) (No. 2017-0-01667, Development of next-generation 360° image/video format).
Conflicts of Interest
The authors declare no conflict of interest.
References
- Simone, F.; Frossard, P.; Brown, C.; Birkbeck, N.; Adsumilli, B. Omnidirectional video communications: New challenges for the quality assessment community. VQEG eLetter 2017, 3, 18–24. [Google Scholar]
- Wiegand, T.; Sullivan, G.J.; Bjontegaard, G.; Luthra, A. Overview of the H. 264/AVC video coding standard. IEEE Trans. Circ. Syst. Video Technol. 2003, 13, 560–576. [Google Scholar] [CrossRef]
- Sullivan, G.J.; Ohm, J.-R.; Han, W.-J.; Wiegand, T. Overview of the high efficiency video coding (HEVC) standard. IEEE Trans. Circ. Syst. Video Technol. 2012, 22, 1649–1668. [Google Scholar] [CrossRef]
- Chen, Z.; Li, Y.; Zhang, Y. Recent advances in omnidirectional video coding for virtual reality: Projection and evaluation. Signal Process. 2018, 146, 66–78. [Google Scholar] [CrossRef]
- Liu, D.; An, P.; Ma, R.; Zhan, W.; Ai, L. Scalable omnidirectional video coding for real-time virtual reality applications. IEEE Access 2018, 6, 56323–56332. [Google Scholar] [CrossRef]
- Fu, C.-W.; Wan, L.; Wong, T.-T.; Leung, C.-S. The rhombic dodecahedron map: An efficient scheme for encoding panoramic video. IEEE Trans. Multimed. 2009, 11, 634–644. [Google Scholar]
- Li, J.; Wen, Z.; Li, S.; Zhao, Y.; Guo, B.; Wen, J. Novel tile segmentation scheme for omnidirectional video. In Proceedings of the 2016 IEEE International Conference on Image Processing (ICIP), Phoenix, AZ, USA, 25–28 September 2016; pp. 370–374. [Google Scholar]
- Park, G.-H. Method and Apparatus for Encoding and Decoding an Icosahedron Panorama Image. Google Patents WO2006016781A1, 13 August 2005. [Google Scholar]
- Yu, M.; Lakshman, H.; Girod, B. Content adaptive representations of omnidirectional videos for cinematic virtual reality. In Proceedings of the 3rd International Workshop on Immersive Media Experiences, Brisbane, QLD, Australia, 26–30 October 2015; pp. 1–6. [Google Scholar]
- Snyder, J.P. Flattening the Earth: Two Thousand Years of Map Projections; University of Chicago Press: Chicago, IL, USA, 1997. [Google Scholar]
- Greene, N. Environment mapping and other applications of world projections. IEEE Comp. Graph. Appl. 1986, 6, 21–29. [Google Scholar] [CrossRef]
- Hanhart, P.; Boyce, J.; Choi, K.; Lin, J. JVET Common Test Conditions and Evaluation Procedures for 360 Video. In Proceedings of the Meeting Report of the 14th Meeting of the Joint Video Experts Team (JVET), Geneva, Switzerland, 19–27 March 2018; Joint Video Exploration Team of ITU-T SG16 WP3 and ISO/IEC JTC1/SC29/WG11; ITU: Geneva, Switzerland, 2018. [Google Scholar]
- Hanhart, P.; He, Y.; Ye, Y.; Boyce, J.; Deng, Z.; Xu, L. 360-degree video quality evaluation. In Proceedings of the 2018 Picture Coding Symposium (PCS), San Francisco, CA, USA, 24–27 June 2018; pp. 328–332. [Google Scholar]
- Brown, C. Bringing Pixels Front and Center in VR Video. 2019, Volume 19. Available online: https://blog.google/products/google-ar-vr/bringing-pixels-front-and-center-vr-video/ (accessed on 25 November 2020).
- Kuzyakov, E.; Pio, D. Next-Generation Video Encoding Techniques for 360 Video and VR. Available online: https://engineering.fb.com/2016/01/21/virtual-reality/next-generation-video-encoding-techniques-for-360-video-and-vr/ (accessed on 25 November 2020).
- Coban, M.; Van der Auwera, G.; Karczewicz, M. AHG8: Adjusted cubemap projection for 360-degree video. In Proceedings of the Meeting Report of the 8th Meeting of the Joint Video Experts Team (JVET), Macao, China, 18–24 October 2017; Joint Video Exploration Team of ITU-T SG16 WP3 and ISO/IEC JTC1/SC29/WG11; ITU: Geneva, Switzerland, 2017. [Google Scholar]
- Zhou, M. AHG8: A study on Equi-Angular Cubemap projection (EAC). In Proceedings of the Meeting Report of the 8th Meeting of the Joint Video Experts Team (JVET), Macao, China, 18–24 October 2017; Joint Video Exploration Team of ITU-T SG16 WP3 and ISO/IEC JTC1/SC29/WG11; ITU: Geneva, Switzerland, 2017; pp. 13–21. [Google Scholar]
- Duanmu, F.; He, Y.; Xiu, X.; Hanhart, P.; Ye, Y.; Wang, Y. Hybrid cubemap projection format for 360-degree video coding. In Proceedings of the 2018 Data Compression Conference, Snowbird, UT, USA, 27–30 March 2018; p. 404. [Google Scholar]
- Lee, Y.; Lin, J.; Chang, S.; Ju, C. CE13: Modified Cubemap Projection in JVET-J0019 (Test 5). In Proceedings of the Meeting Report of the 11th Meeting of the Joint Video Experts Team (JVET), Ljubljana, Slovenia, 10–18 July 2018; Joint Video Exploration Team of ITU-T SG16 WP3 and ISO/IEC JTC1/SC29/WG11, JVET-K0131; ITU: Geneva, Switzerland, 2018. [Google Scholar]
- Zhou, M. AHG8: A study on quality impact of line re-sampling rate in EAP. In Proceedings of the Meeting Report of the 5th Meeting of the Joint Video Experts Team (JVET), Geneva, Switzerland, 12–20 January 2017; Joint Video Exploration Team of ITU-T SG16 WP3 and ISO/IEC JTC1/SC29/WG11; ITU: Geneva, Switzerland, 2017. [Google Scholar]
- Ye, Y.; Alshina, E.; Boyce, J. JVET-G1003: Algorithm description of projection format conversion and video quality metrics in 360lib version 4. In Proceedings of the Meeting Report of the 8th Meeting of the Joint Video Experts Team (JVET), Macao, China, 18–24 October 2019; Joint Video Exploration Team of ITU-T SG16 WP3 and ISO/IEC JTC1/SC29/WG11; ITU: Geneva, Switzerland, 2017. [Google Scholar]
- Van der Auwera, G.; Karczewicz, M. AHG8: Equatorial cylindrical projection for 360-degree video. In Proceedings of the Meeting Report of the 8th Meeting of the Joint Video Experts Team (JVET), Macao, China, 18–24 October 2017; Joint Video Exploration Team of ITU-T SG16 WP3 and ISO/IEC JTC1/SC29/WG11; ITU: Geneva, Switzerland, 2017. [Google Scholar]
- HEVC Test Model. Available online: https://hevc.hhi.fraunhofer.de/svn/svn_HEVCSoftware/ (accessed on 24 November 2020).
- Li, Q.; Lin, W.; Fang, Y. No-reference quality assessment for multiply-distorted images in gradient domain. IEEE Signal Process. Lett. 2016, 23, 541–545. [Google Scholar] [CrossRef]
- Wang, Z.; Li, Q. Information content weighting for perceptual image quality assessment. IEEE Trans. Image Process. 2010, 20, 1185–1198. [Google Scholar] [CrossRef] [PubMed]
- Azevedo, R.G.d.A.; Birkbeck, N.; De Simone, F.; Janatra, I.; Adsumilli, B.; Frossard, P. Visual distortions in 360-degree videos. arXiv 2019, arXiv:1901.01848. [Google Scholar] [CrossRef]
- Tran, H.T.; Pham, C.T.; Ngoc, N.P.; Pham, A.T.; Thang, T.C. A study on quality metrics for 360 video communications. IEICE Trans. Inform. Syst. 2018, 101, 28–36. [Google Scholar] [CrossRef]
- Sun, Y.; Lu, A.; Yu, L. Weighted-to-spherically-uniform quality evaluation for omnidirectional video. IEEE Signal Process. Lett. 2017, 24, 1408–1412. [Google Scholar] [CrossRef]
- Zakharchenko, V.; Choi, K.P.; Park, J.H. Quality metric for spherical panoramic video. In Proceedings of Optics and Photonics for Information Processing X; SPIE: Bellingham, WA, USA, 2016. [Google Scholar]
- Upenik, E.; Rerabek, M.; Ebrahimi, T. On the performance of objective metrics for omnidirectional visual content. In Proceedings of the 2017 Ninth International Conference on Quality of Multimedia Experience (QoMEX), Erfurt, Germany, 31 May–2 June 2017; pp. 1–6. [Google Scholar]
- Chen, S.; Zhang, Y.; Li, Y.; Chen, Z.; Wang, Z. Spherical structural similarity index for objective omnidirectional video quality assessment. In Proceedings of the 2018 the IEEE International Conference on Multimedia and Expo (ICME), San Diego, CA, USA, 23–27 July 2018; pp. 1–6. [Google Scholar]
- Xu, M.; Li, C.; Chen, Z.; Wang, Z.; Guan, Z. Assessing visual quality of omnidirectional videos. IEEE Trans. Circ. Syst. Video Technol. 2018, 29, 3516–3530. [Google Scholar] [CrossRef]
- Sun, W.; Gu, K.; Zhai, G.; Ma, S.; Lin, W.; Le Calle, P. CVIQD: Subjective quality evaluation of compressed virtual reality images. In Proceedings of the 2017 IEEE International Conference on Image Processing (ICIP), Beijing, China, 17–20 September 2017; pp. 3450–3454. [Google Scholar]
- Zhang, Y.; Wang, Y.; Liu, F.; Liu, Z.; Li, Y.; Yang, D.; Chen, Z. Subjective panoramic video quality assessment database for coding applications. IEEE Trans. Broadcast. 2018, 64, 461–473. [Google Scholar] [CrossRef]
- Sun, W.; Gu, K.; Ma, S.; Zhu, W.; Liu, N.; Zhai, G. A large-scale compressed 360-degree spherical image database: From subjective quality evaluation to objective model comparison. In Proceedings of the 2018 IEEE 20th international workshop on multimedia signal processing (MMSP), Vancouver, BC, Canada, 29–31 August 2018; pp. 1–6. [Google Scholar]
- JPEG XT Reference Software. Available online: https://jpeg.org/jpegxt/software.html/ (accessed on 24 November 2020).
- JPEG 2000 Reference Software. Available online: https://jpeg.org/jpeg2000/software.html/ (accessed on 24 November 2020).
- Xiu, X.; He, Y.; Ye, Y.; Vishwanath, B. An evaluation framework for 360-degree video compression. In Proceedings of the 2017 IEEE Visual Communications and Image Processing (VCIP), St. Petersburg, Russia, 10–13 December 2017; pp. 1–4. [Google Scholar]
- Asbun, E.; He, Y.; He, Y.; Ye, Y. AHG8: InterDigital test sequences for virtual reality video coding. In Proceedings of the Meeting Report of the 4th Meeting of the Joint Video Experts Team (JVET), Chengdu, China, 15–21 October 2016; Joint Video Exploration Team of ITU-T SG16 WP3 and ISO/IEC JTC1/SC29/WG11; ITU: Geneva, Switzerland, 2016. [Google Scholar]
- Insta360 Pro. Available online: https://www.insta360.com/product/insta360-pro/ (accessed on 25 November 2020).
- Gu, K.; Wang, S.; Zhai, G.; Lin, W.; Yang, X.; Zhang, W. Analysis of distortion distribution for pooling in image quality prediction. IEEE Trans. Broadcast. 2016, 62, 446–456. [Google Scholar] [CrossRef]
- Gu, K.; Li, L.; Lu, H.; Min, X.; Lin, W. A fast reliable image quality predictor by fusing micro-and macro-structures. IEEE Trans. Ind. Electron. 2017, 64, 3903–3912. [Google Scholar] [CrossRef]
- Wang, Z.; Bovik, A.C.; Sheikh, H.R.; Simoncelli, E.P. Image quality assessment: From error visibility to structural similarity. IEEE Tran. Image Process. 2004, 13, 600–612. [Google Scholar] [CrossRef] [PubMed]
- Sheikh, H.R.; Bovik, A.C. A visual information fidelity approach to video quality assessment. In Proceedings of the First International Workshop on Video Processing and Quality Metrics for Consumer Electronics, Scottsdale, AZ, USA, 23–25 January 2005; p. 2. [Google Scholar]
- Ye, Y.; Alshina, E.; Boyce, J. Algorithm Descriptions of Projection Format Conversion and Video Quality Metrics in 360Lib (Version 5), Document JVET-H1004. In Proceedings of the Meeting Report of the 8th Meeting of the Joint Video Experts Team (JVET), Macao, China, 18–24 October 2017; Joint Video Exploration Team of ITU-T SG16 WP3 and ISO/IEC JTC1/SC29/WG11; ITU: Geneva, Switzerland, 2017. [Google Scholar]
- Bjøntegaard, G. Calculation of average PSNR differences between RD-curves (VCEG-M33). In Proceedings of the VCEG Meeting (ITU-T SG16 Q. 6), Austin, TX, USA, 2–4 April 2001; pp. 2–4. [Google Scholar]
- Yu, M.; Lakshman, H.; Girod, B. A framework to evaluate omnidirectional video coding schemes. In Proceedings of the 2015 IEEE International Symposium on Mixed and Augmented Reality, Fukuoka, Japan, 29 September–3 October 2015; pp. 31–36. [Google Scholar]
- Hanhart, P.; Lin, J. Summary report on projection formats. In Proceedings of the Meeting Report of the 11th Meeting of the Joint Video Experts Team (JVET), Ljubljana, Slovenia, 10–18 July 2018; Joint Video Exploration Team of ITU-T SG16 WP3 and ISO/IEC JTC1/SC29/WG11; ITU: Geneva, Switzerland, 2018. [Google Scholar]


Publisher’s Note: MDPI stays neutral with regard to jurisdictional claims in published maps and institutional affiliations. |
© 2021 by the authors. Licensee MDPI, Basel, Switzerland. This article is an open access article distributed under the terms and conditions of the Creative Commons Attribution (CC BY) license (http://creativecommons.org/licenses/by/4.0/).