


Abstract
Companies can perform their freight distribution in three different ways. The first concept, the in-house concept, represents the use of a company’s own resources and knowledge to organize transportation from the production to retailers or from the warehouse to customers. The opposite concept is to outsource distribution activities by hiring third-party logistics providers. The third concept represents a combination of the previous two. Although the arguments in favor of outsourcing can be found in the literature, an appropriate selection of a freight distribution concept is specific for each company and depends on many evaluation criteria and their symmetrical roles. This paper presents a methodology that can be used by companies that need to choose their freight distribution concept. An advanced extension of the Additive Ratio ASsessment (ARAS) method is developed to solve the freight distribution concept selection problem. To illustrate the implementation of the proposed methodology, a tire manufacturing company from the Czech Republic is taken as a case study. However, the proposed picture fuzzy ARAS method is general and can be used by any other company. To validate the novel picture fuzzy ARAS method, a comparative analysis with the nine existing state-of-the-art picture fuzzy multi-criteria decision-making methods is provided.
1. Introduction
The study of the methods of physical connection between producers of goods and customers has been an intriguing topic since ancient times. Carrying out freight distribution activities in a proper way is of crucial importance for companies. The internal benefits of freight distribution are improved business operations, cost reduction, brand building, etc. On the other hand, its external benefits affect a broader economy, society, and environment. Some companies perform distribution activities by themselves, while others engage third-party logistics (3PL) providers. Determining how to select a freight distribution concept (FDC) is a matter of importance. The term FDC can refer to the choice of transport mode in distribution activities [1]. In this paper, FDC refers to the organizational issue, i.e., whether a company should organize the distribution on its own or outsource.
This paper aims to propose a methodology that can support FDC decision-making. The proposed methodology will suggest one of the following alternatives: investing in a company’s own transport fleet, employing a 3PL provider, or using a combined approach. It should be kept in mind that there is no unique solution that fits all companies, i.e., the preferable solution is based on the characteristics of the company considered.
Logistics companies operate in a changeable and uncertain environment [2,3,4,5,6]. They are increasingly confronted with complexity in the situations where decision-making is needed. Besides, FDC selection is a complex multidisciplinary problem. It requires numerous factors to be taken into consideration. The knowledge from various fields such as operational research, forecasting, statistics, and economics should be used to solve this problem. Selecting an appropriate FDC is a multi-criteria decision-making (MCDM) problem that demands expert opinions. Its goal is to find the best freight distribution alternative that satisfies some predetermined criteria and sub-criteria. However, the freight distribution concept selection problem includes some imprecise, uncertain, and inconsistent information. Typically, the experts are not completely familiar with features of all criteria and freight distribution alternatives due to their distinct education, field of expertise, position, and experience. Therefore, they may abstain or refuse to provide evaluations for the criteria and/or alternatives. Unfortunately, the available MCDM methods for outsourcing logistics do not take into account such abstention or refusal.
Picture fuzzy sets (PFSs) are advanced fuzzy sets that are characterized by degrees of positive, neutral, negative, and refusal membership [7,8]. PFSs allow experts to handle vague information with ease [9]. PFS-based MCDM models are suitable in cases when expert opinions include more answers; i.e., yes, abstain, no, and refusal [8]. Voting can be a good example of such cases. As a result, PFSs are realistic and accurate for describing uncertain information in the FDC selection problem.
The Additive Ratio ASsessment (ARAS) method is a new MADM technique, introduced by Zavadskas and Turskis [10] and Zavadskas et al. [11]. The ARAS method helps decision-makers to assess the performance of alternatives as well as the ratio of each alternative to the ideal alternative [12]. It aims to select the best alternative based on several criteria, and the final ranking of alternatives is made by determining the utility degree of each alternative [13]. Its numerous applications are the result of its straightforward, direct, and easy-to-follow steps, which yield reasonable and acceptable ranking results [14]. Its concept has a profound logic [12]. Unfortunately, there has been no work extending the ARAS method with PFSs to solve MADM problems in the literature.
This study presents an advanced extension of the ARAS method to tackle decision-making issues in real-life situations. For the first time, a picture fuzzy set based MCDM approach is used for solving transportation problems. The criteria and sub-criteria for solving the freight distribution concept selection problem are distinguished. The proposed method is applied to the freight distribution concept selection problem for a tire manufacturing company in the Czech Republic. The experts’ assessments for the criteria, sub-criteria, and freight distribution alternatives are represented by PFSs so that their attitudes can be expressed precisely and information loss can be mitigated. The comparative analysis with the nine existing state-of-the-art picture fuzzy MCDM methods is provided to validate the novel picture fuzzy ARAS method. Finally, the Spearman’s rank correlation coefficients between the developed picture fuzzy ARAS method and the available PFS-based MCDM methods are calculated to check the consistency.
The paper is organized in the following manner: Section 2 presents a review of related research. Section 3 details the used methodology and the development of the picture fuzzy ARAS method. A case study is described in Section 4. Section 5 provides the case study results and discussions. Section 6 offers the conclusions of the work.
2. Literature Review
The literature review is organized into two subsections to provide better insights into the concepts underlying this research and more clearly address the contributions of this study. The first subsection explores the existing research methods used to solve the corresponding issues in the field of outsourcing logistics. The second subsection investigates the available applications of the ARAS method.
2.1. Research Methods for Analyzing the Freight Distribution Concept
Logistics outsourcing refers to a business activity where a company employs an external partner to carry out logistics services. This phenomenon, as confirmed in the literature [15,16], has been attracting growing attention over the past few decades, and this trend is continuing. As organizations place more focus on their core activities, they examine the possibilities of contracting with 3PL providers in order to reduce costs, save time, and improve the quality of products and services. Logistics outsourcing mainly includes transport, packaging, warehousing, and documentation manipulation. According to Rao and Young [17], the most dominant factors that influence organizations’ decisions to outsource all or some of their functions to third parties are the cost/service trade-offs and quality of information systems. Bhatnagar et al. [18] emphasized that various cost-saving opportunities, increased supply chain flexibility, and improved logistics efficiency could be realized by logistics outsourcing with professional help from third-party logistics (3PL) service providers. However, there are also arguments against outsourcing. Kremic et al. [19] noticed that certain hidden costs could outweigh any short-term financial benefits from outsourcing. Besides, Handley [20] emphasized that when companies made outsourcing decisions, they would inevitably encounter the consequence of internal capability erosion, changing their internal structure. Therefore, a decision to outsource is not so simple; it should be based on the consideration of many influencing factors, making it suitable to be considered as a multi-criteria decision-making problem. To accurately describe this MCDM problem, it is very useful to analyze the examples from the literature that contribute to solving the considered task.
Considering the literature published in the last decade, a good theoretical basis was set by Bajec and Jakomin [21]. They proposed a make-or-buy decision process methodology through the following stages: planning, evaluation, internal costs, and performance analysis. Pirannejad et al. [22] used the ANP method for solving public problems in terms of outsourcing governmental logistic functions. Liou and Chuang [23] considered the outsourcing provider selection problem by using the DEMATEL, ANP, and VIKOR methods. Cheng and Lee [24] used the ANP method in solving the problem of outsourcing reverse logistics of high-tech manufacturing firms. In their study, the ANP was used to calculate the most appropriate 3PL alternative as well as to find the relative importance of reverse logistics service requirements.
Aktas et al. [25] proposed a descriptive research model to estimate the outsourcing perception of the companies operating in different business areas in Turkey. Based on the statistical analyses, considering 299 companies in Finland, Solakivi et al. [26] found that cost savings together with flexibility and customer service were the major motives for outsourcing. The outsourcing provider selection problem was considered in a real case of a Taiwanese company [27]. The DEMATEL and ANP approach was used to solve the problem. Rezaeisaray et al. [28] researched the pipe manufacturing industry and proposed a combination of MCDM methods to solve the outsourcing-supplier selection problem. Chen et al. [29] carried out a study concerning the evaluation and selection of the best outsourcing service country in East and Southeast Asia by using an AHP approach. Kahraman et al. [30] applied the fuzzy AHP-TOPSIS approach to evaluate outsourcing manufacturers. Arif and Jawab [31] considered the impact of the outsourcing strategy on logistics performances. Pedregosa et al. [32] investigated the determinants of success in transport services outsourcing in Europe by applying the partial least squares simultaneous equation models (PLS-SEM).
Hwang and Kim [33] compared the effects of in-house and outsourced logistics services on supply chain agility and organizational performance using structural equation modeling. Wan et al. [34] implemented a fuzzy-set qualitative comparative analysis (fsQCA) to examine the drivers of outsourcing decisions in China. Bucovetchi et al. [35] proposed several key performance indicators to assess whether logistics or outsourcing is the best option for business performance. Zarbakhshnia et al. [36] integrated a fuzzy AHP method and grey multiobjective optimization by ratio analysis (MOORA-G) for evaluating reverse logistics 3PL providers. Kiani et al. [37] utilized a fuzzy MCDM approach for prioritizing outsourceable activities in universities. They combined the AHP, SAW, TOPSIS, and VIKOR methods. Vazifehdan and Darestani [38] evaluated the outsourcing components in the petrochemical industry. Sayed et al. [39] applied an inductive case study approach to explore the impact of outsourcing versus in-house concepts. Mokrini and Aouam [40] evaluated risks of healthcare logistics outsourcing by using the combination of fuzzy AHP, TOPSIS, and PROMETHEE methods. Tavana et al. [41] considered the reverse logistics outsourcing problem by using integrated intuitionistic fuzzy AHP and SWOT methods. Wu et al. [42] extended the VIKOR method under the linguistic environment to investigate the supplier selection problem in the nuclear power industry. A structured overview of the considered literature is shown in Table 1.
Table 1.
Summary of the available models for the freight distribution concept (FDC) selection problem.
2.2. Applications of the ARAS Method
Although the ARAS method is a new approach in the MCDM literature, it has been applied in various areas (Table 2).
Table 2.
Summary of the available applications of the additive ratio assessment (ARAS) method.
Tupenaite et al. [43] utilized the ARAS method to evaluate alternatives for built and human environment renovation. Turskis and Zavadskas [44] developed the fuzzy ARAS method for locating logistics centers. The AHP method was used to determine crisp criteria weights. Turskis and Zavadskas [45] presented the grey ARAS method to solve the supplier selection problem. Zavadskas et al. [11] applied the ARAS method to find the most appropriate and safe foundation installment alternative.
Keršulienė and Turskis [46] combined the stepwise weight assessment ratio analysis (SWARA) and the fuzzy ARAS methods to overcome difficulties in the personnel selection process. Baležentis et al. [47] utilized the fuzzy ARAS method to compare the efficiency of Lithuanian economic sectors. Dadelo et al. [48] used the ARAS method for solving the personnel selection problem. Zavadskas et al. [49] adopted the ARAS method to generate a decision on the most suitable construction technology for installing pile-columns. Zavadskas et al. [50] applied the AHP-ARAS approach to assess project managers in construction processes.
Turskis et al. [51] coupled the AHP and grey ARAS methods to rank built heritage projects. Keršulienė and Turskis [52] combined the AHP and the fuzzy ARAS methods with the fuzzy weighted-product model to assess chief accounting officers. Kutut et al. [53] used the AHP-ARAS approach to prioritize cultural heritage buildings. Zamani et al. [54] integrated the ANP and fuzzy ARAS methods to solve the brand-extension strategy selection problem in the dairy food industry. Medineckiene et al. [55] applied the AHP-ARAS approach for solving the sustainable building certification problem. Stanujkic [56] proposed an interval-valued fuzzy set based ARAS method. Zavadskas et al. [57] coupled the AHP and the fuzzy ARAS methods to rank seaport locations. Liao et al. [58] integrated the AHP-ARAS approach and the multisegment goal programming for solving the green supplier selection problem. Nguyen et al. [59] used the fuzzy AHP-ARAS approach to solve the conveyor selection problem. Štreimikienė et al. [60] applied the AHP-ARAS approach for assessing electricity generation technologies in Lithuania. Rostamzadeh et al. [12] used the fuzzy ARAS method for evaluating supply chain management performance.
Büyüközkan and Göçer [61] developed an interval-valued intuitionistic fuzzy set based AHP-ARAS approach to support the supplier selection process in a digital supply chain. Dahooie et al. [62] combined the SWARA and the grey ARAS methods for choosing the best information technology expert. Dahooie et al. [63] used the interval-valued fuzzy ARAS method to evaluate oil and gas well drilling projects. The fuzzy Delphi and the SWARA methods were used to identify and determine criteria and weights, respectively. Radović et al. [64] suggested a rough ARAS method for evaluating performance indicators of transportation companies.
Bahrami et al. [65] utilized the best-worst method and the ARAS method to calculate weights of criteria and rank mineral deposits, respectively. Dahooie et al. [66] integrated the fuzzy c-means clustering algorithm and the ARAS method to evaluate the financial performances of manufacturing companies. Iordache et al. [67] developed an interval type-2 hesitant fuzzy set based ARAS method to tackle the underground hydrogen storage site selection problem. Fu [68] coupled the AHP-ARAS approach and multichoice goal programming to rank catering suppliers in the airline industry. Naicker and Thopil [69] used the AHP-ARAS approach to highlight renewable technology options. Pehlivan and Gürsoy [70] utilized the fuzzy ARAS method to assess life satisfaction levels. Turskis et al. [71] integrated the AHP and the fuzzy ARAS methods with the fuzzy multiplicative utility function for analyzing structural elements of buildings. Ghenai et al. [14] applied the SWARA-ARAS approach to rank renewable energy systems.
Our assessment of the literature has revealed some noticeable gaps:
- Uncertainty is the key factor influencing the selection of a freight distribution concept. However, uncertainty analysis is mainly ignored in the available studies.
- The available MCDM methods for outsourcing logistics do not take into account the neutral/refusal information.
- The available system analysis methods for selection of FDC are inadequate in situations when decision-makers’ opinions involve more answers, such as yes, abstain, no, and refusal.
- Advanced methodological approaches for solving outsourcing logistics problems, which can capture a higher degree of uncertainty and take into account numerous conflicting criteria, are missing.
- No previous work has elucidated the criteria for the selection of a freight distribution concept.
- Deterministic numbers or type-1 fuzzy sets have been used in the majority of the previous studies for solving outsourcing logistics problems.
- A picture fuzzy set based MCDM approach for solving transportation problems has not been applied in previous research.
- The ARAS method has not been extended before using picture fuzzy sets.
Hence, to fill these gaps with the help of the proposed picture fuzzy ARAS method, this paper solves the FDC selection problem in the Czech scenario.
3. Methodology
In this section, definitions of picture fuzzy sets and the developed picture fuzzy ARAS method are provided.
3.1. Picture Fuzzy Sets
Definition 1
[7,8]. Let PFS A on a universe X be an object in the form of
where , and represent the degrees of positive, neutral, and negative membership of x in A, respectively. The following condition needs to be satisfied:
The word “picture” in PFS relates to generality, as this set is the direct extension of fuzzy sets and intuitionistic fuzzy sets (IFSs). In the case where the PFS returns to the IFS set. When both the PFS returns to the fuzzy set. The integration of the degree of neutral membership measures the information of objects more accurately and increases the quality and accuracy of achieved results. In PFS theory, decision-makers are divided into four groups: vote for (its ratio is denoted as µ), abstain (its ratio is denoted as η), vote against (its ratio is denoted as υ), and refusal (its ratio is denoted as ξ) [72].
The degree of refusal membership of x in the PFS A can be calculated as follows:
In particular, if X has only one element, thenis called a picture fuzzy number (PFN), in whichand. For convenience, a PFN is denoted by
Definition 2
[7,8]. The complement of a PFS on a universe X is represented as
Definition 3
[68,69]. Let , and be three PFNs, and λ > 0. Their operations are defined as follows:
Definition 4
[72,73]. Let (i = 1, ..., m) be a collection of PFNs and λ = (λ1, ..., λm)T be the weight vector with λi∈[0, 1] and . The picture fuzzy weighted geometric average (PFWGA) operator is defined as follows:
Definition 5
[74,75]. Let be a PFN. A two-step defuzzification method to obtain a crisp value of the PFN A is given as follows:
Step 1. Distribute the neutral degree to the positive and negative degrees as follows:
Step 2. Calculate the defuzzification value y by
3.2. Picture Fuzzy ARAS Method
Let A = {A1, …, Am} (m ≥ 2) be a finite set of alternatives which experts have to choose from, C = {C1, …, Cn} (n ≥ 2) be a finite set of criteria with which performances of the alternatives can be measured, be a finite set of sub-criteria with respect to the j-th criterion Cj, and D = {D1, …, Dk} (k ≥ 2) be a set of invited experts. The steps of the developed picture fuzzy ARAS method are given as follows:
Step 1. Construct the linguistic criteria weight matrices :
where is the linguistic importance evaluation given by the expert De (e = 1, ..., k) towards the criterion Cj (j = 1, ..., n). Generally, importance evaluations can be yes, abstain, no, and refusal. For instance, if an expert has a positive, neutral, or negative attitude towards criterion importance, then they will answer yes, abstain, or no in a questionnaire, respectively. Therefore, experts are divided into four groups.
Step 2. Determine the picture fuzzy criteria weight matrix :
where is a PFN that represents an importance evaluation of the criterion Cj given by the experts. The four types of voting results are fully in accordance with the four components of a PFN. Criteria importance evaluations given by the experts can be expressed as PFNs by calculating the proportion of each item in the voting results.
Step 3. Calculate the weight of each criterion as follows:
where white papers are divided into half, i.e., one half for the experts who vote for and the other half for the experts who vote against; (j = 1, ..., n) is the ratio of experts who refuse to provide importance evaluation towards the criterion Cj; and wj∈[0, 1] (j = 1, ..., n), 1.
Step 4. Construct the linguistic sub-criteria weight matrices :
where is a linguistic importance evaluation given by the expert De towards the sub-criterion (sj = 1, ..., nj) of the criterion Cj. Generally, if an expert has a positive, neutral, or negative attitude towards the importance of some sub-criterion, then they will answer yes, abstain, or no in a questionnaire, respectively.
Step 5. Determine the picture fuzzy sub-criteria weight matrices :
where is a PFN which represents an importance evaluation of the sub-criterion of the criterion Cj given by the experts. It is calculated as the proportion of each item in the voting results.
Step 6. Calculate the weight of each sub-criterion as follows:
where (sj = 1, ..., nj) and .
Step 7. Construct the linguistic evaluation matrices :
where is a linguistic evaluation given by the expert De towards the alternative Ai (i = 1, ..., m) with respect to the sub-criterion of the criterion Cj. Generally, if an expert has a positive, neutral, or negative attitude towards an alternative with respect to some sub-criterion, then they will answer yes, abstain, or no in a questionnaire, respectively.
Step 8. Determine the picture fuzzy evaluation matrices :
where is a PFN which represents an evaluation of the alternative Ai with respect to the sub-criterion of the criterion Cj given by the experts. It is calculated as the proportion of each item in the voting results.
Step 9. Determine the picture fuzzy normalized evaluation matrices as follows:
where denotes a normalized evaluation of the alternative Ai with respect to the sub-criterion of the criterion Cj given by the experts. Only experts’ evaluations with respect to cost sub-criteria are transformed by utilizing the complement operation.
Step 10. Determine the picture fuzzy decision matrix :
where is a PFN which represents aggregated normalized evaluation of the alternative Ai with respect to the criterion Cj. It is calculated as follows:
where (j = 1, ..., n) is the weight vector of the sub-criteria of the criterion Cj with and .
Step 11. Determine the picture fuzzy weighted decision matrix as follows:
where is a PFN which represents an aggregated normalized weighted evaluation of the alternative Ai with respect to the criterion Cj and is the weight vector of the criteria, with and .
Step 12. Determine the ideal alternative as follows:
Step 13. Calculate the picture fuzzy optimality function as follows:
Step 14. Calculate the defuzzified value of the optimality function as follows:
where neutral degrees are distributed equally to positive and negative degrees.
Step 15. Calculate the utility degree of each alternative as follows:
Step 16. Rank the alternatives according to the decreasing values of their utility degree. The highest utility degree is the most desirable alternative.
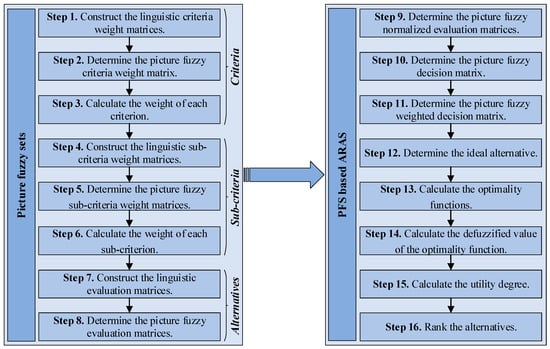
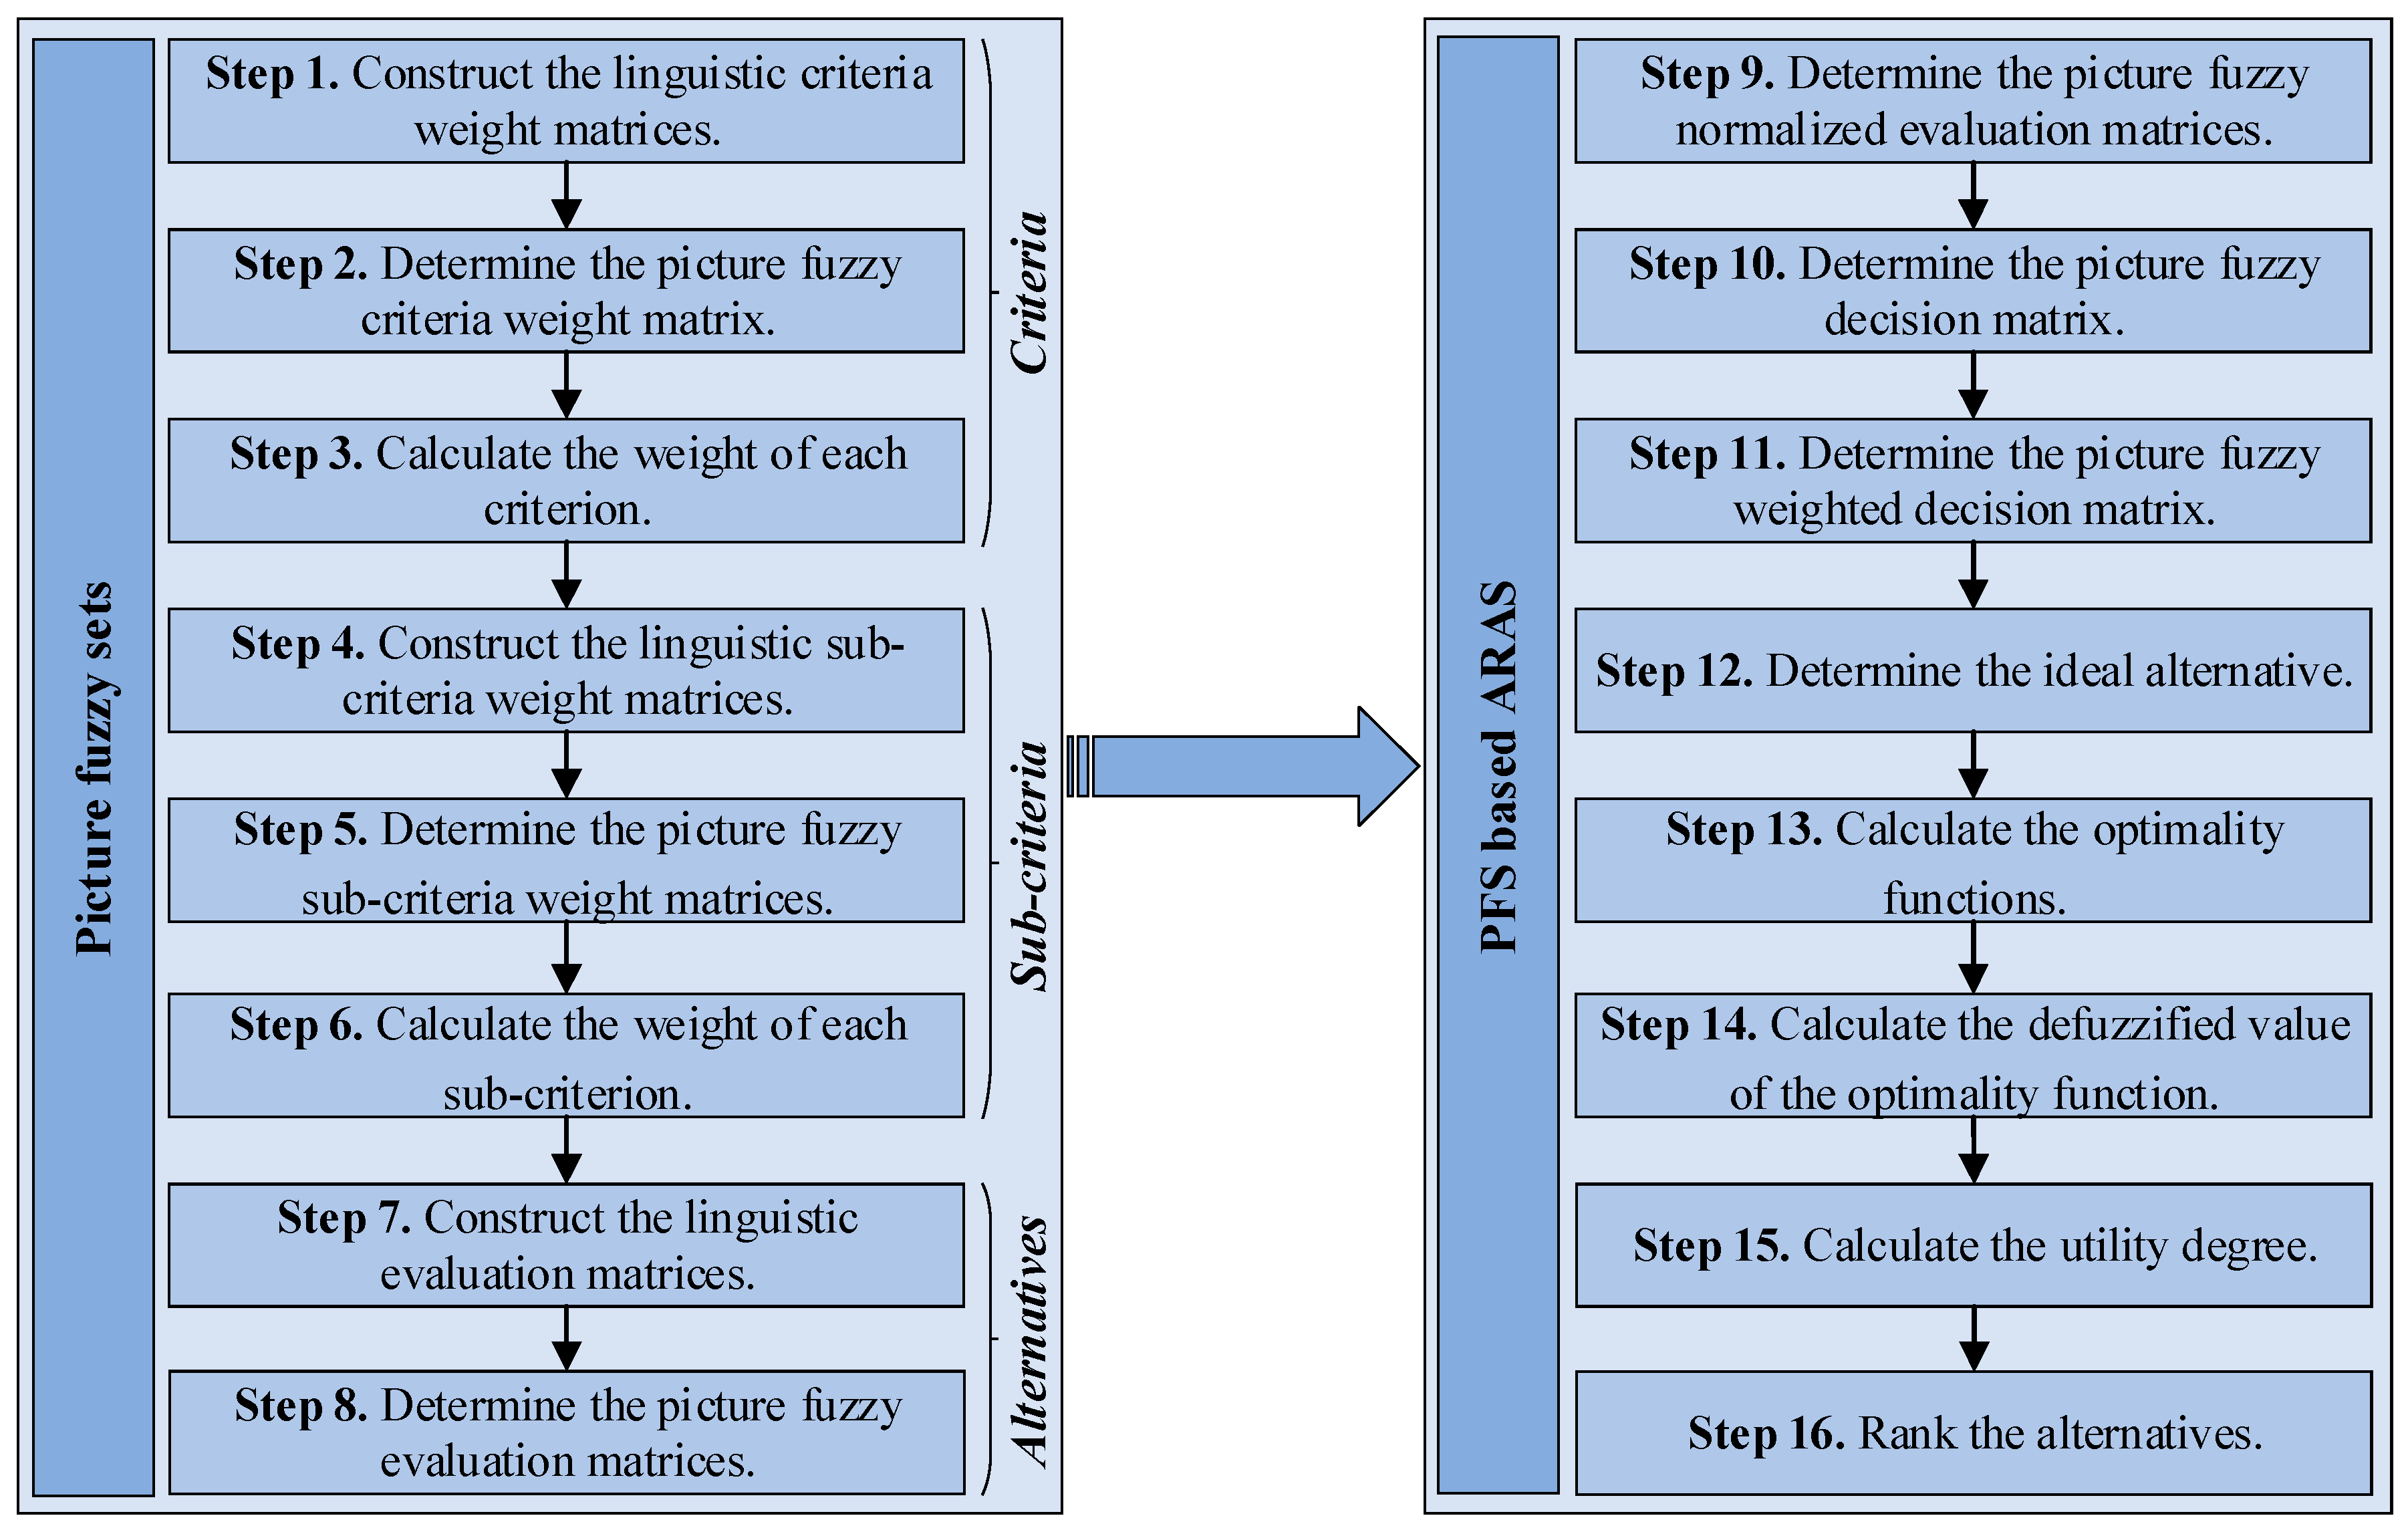
The flowchart of the proposed picture fuzzy ARAS method is presented in Figure 1.
Figure 1.
The flowchart of the proposed picture fuzzy set based ARAS approach.
4. Case Study
The developed PFS-based ARAS method is applied to the freight distribution concept selection problem for a tire manufacturing company in the Czech Republic.
The proposed methodology was tested in the case of a tire manufacturing company from the Czech Republic. The company name is not mentioned according to the agreement with its management; however, it is one of the major players in the Czech tire market. The main activities of the company are manufacturing, wholesaling, and retailing of tires. It produces a wide range of tires, mostly for trucks and passenger cars. In its warehouse, there are more than 90,000 pieces of tires available to its customers at each moment. Some of the major benefits of the company are reflected through the high level of service, professional staff, online ordering system, and delivery of goods within 24 h across the Czech Republic. The manufacturing company considers the possibilities of tire distribution. According to a discussion with the logisticians working in the company, the authors of this paper defined the criteria important for the selection of FDC that would be of the greatest interest of the company and society.
Five experts from the considered tire manufacturing company participated in this case study. They hold managerial positions to directly influence the selection of FDC. Interviews were carried out with them to collect linguistic importance evaluations considering criteria, sub-criteria, and alternatives.
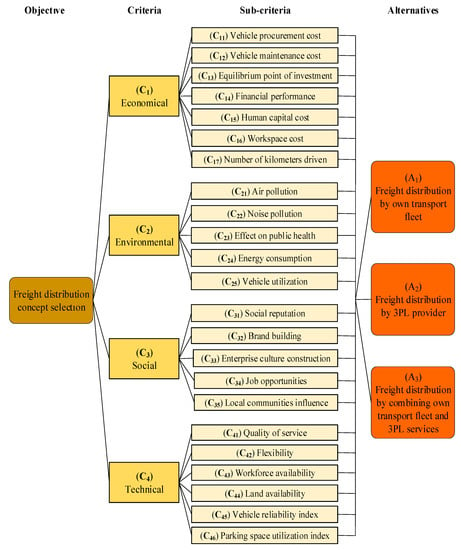
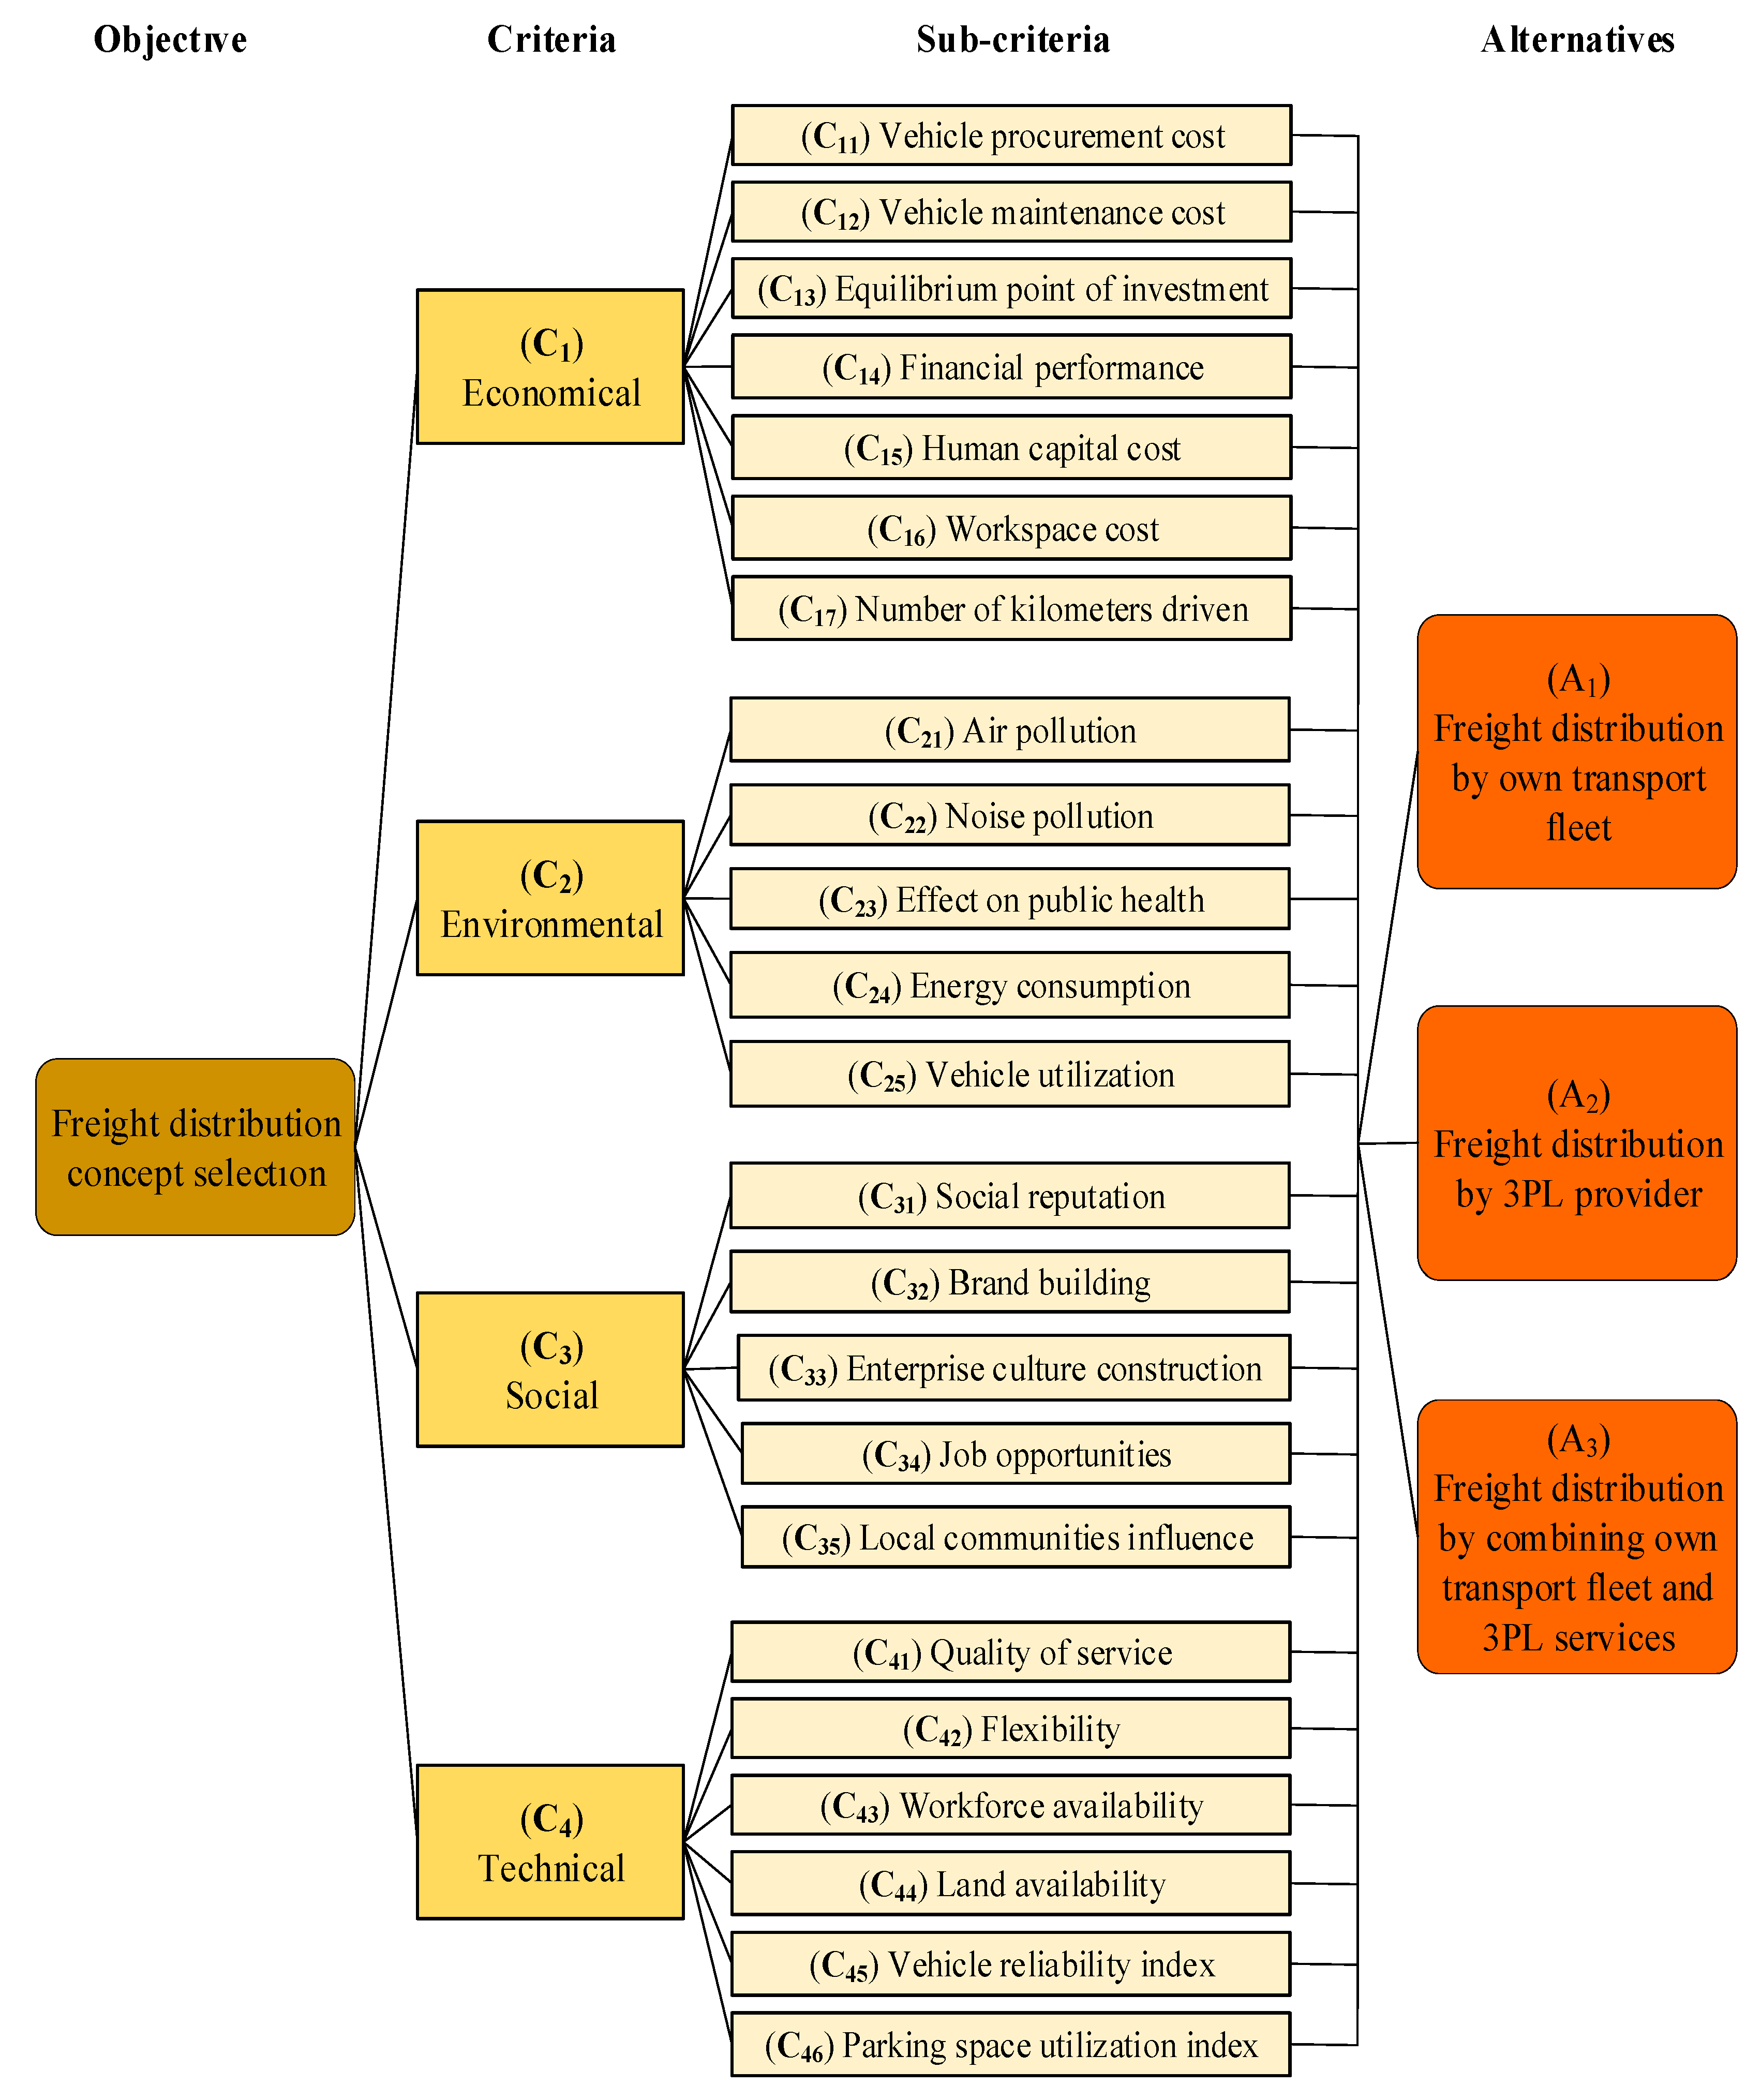
The hierarchical structure of the freight distribution concept selection problem is presented in Figure 2. As can be noticed in Figure 2, there are 23 sub-criteria under the four criteria.
Figure 2.
The schematic diagram for the hierarchical structure of the freight distribution concept selection problem.
The economical criterion (C1) has seven sub-criteria:
- Vehicle procurement cost (C11). This emerges when the company procures its transport fleet. The cost can be considered as a relatively high burden, especially for start-ups.
- Vehicle maintenance cost (C12). This cost is expressed in terms of parts consumption and maintenance. It is the amount spent for servicing during transport fleets’ life cycle.
- Time to achieve the equilibrium point of investment (C13). The period after which the invested funds start to bring benefits to the company.
- Financial performance (C14). Indication of the company’s endurance. Sound financial performance ensures the stability of services.
- Human capital cost (C15). This cost is related to employees, such as costs for drivers, dispatchers, training, etc. The core aim of outsourcing logistics is to decrease this cost.
- Workspace cost (C16). This includes the costs of garages, parking places, warehouses, and other auxiliary facilities.
- Number of kilometers driven (C17). If the company expects that its distribution system would require a relatively high number of kilometers to cover, then it should invest in its own fleet of vehicles.
The environmental criterion (C2) has five sub-criteria:
- Air pollution (C21). This represents the percentage of air pollution by a certain transport fleet. Emissions could vary in proportion to the alternative that is selected.
- Noise pollution (C22). This has a negative impact on both natural ecosystems and urban populations. It causes discomfort, complaints, sleep disorders, etc.
- Effect on public health (C23). This represents the occurrence of injuries, threats to health and life, fires, explosions, and other hazards. It is important to apply technical/technological and organizational solutions that minimize the effect on public health.
- Energy consumption (C24). The pollution from energy consumption is not only restricted to carbon emissions; other types of air pollution, from smog to acid rain, have harmful effects.
- Vehicle utilization (C25). This is determined mainly by delivery requirements and exploitation of the backhauling and transport fleet management. If each company were to have its own transport fleet, it could result in poor vehicle utilization.
The social criterion (C3) has five sub-criteria:
- Social reputation (C31). This is based on the social appraisal in terms of prestige in society. Adhering to ethical business practices such as supplying quality products on time and acting according to what is agreed secures a high social reputation.
- Brand building (C32). Successful brand building is essential to introduce new products and services. It can be considered as a catalyst for the development of a modern company.
- Enterprise culture construction (C33). This improves competitiveness by providing a guarantee, feedback, and long-term effect mechanisms.
- Job opportunities (C34). This is the number and quality of jobs created.
- Local community influence (C35). This encompasses service infrastructure, public services, community projects, etc.
The technical criterion (C4) has six sub-criteria:
- Quality of service (C41). This is the most important factor in obtaining customer loyalty. It is measured by the standard of customer service satisfaction.
- Flexibility (C42). This is the ability to react faster to turbulences in the market.
- Workforce availability (C43). The total number of workers can also influence a decision about purchasing a fleet of vehicles.
- Land availability (C44). The availability of enough land is a vital infrastructure prerequisite.
- Vehicle reliability index (C45). This is the number of reliable vehicles in relation to the total fleet of vehicles.
- Parking space utilization index (C46). This is the ratio of the required number of vehicles to the number of available parking spaces.
5. Results and Discussion
Step 1. Four criteria are evaluated by five invited experts. Linguistic importance evaluations for the criteria are presented in Table 3. Five linguistic criteria weight matrices are determined by using Equation (13).
Table 3.
Linguistic importance evaluations for the criteria.
Step 2. Table 4 presents the picture fuzzy criteria weight matrix. It is determined based on five linguistic criteria weight matrices with the help of Equation (14). The linguistic importance evaluations of four criteria given by experts (Table 3) are expressed as PFNs by computing the proportion of each item in the voting results.
Table 4.
The picture fuzzy criteria weight matrix and defuzzified values.
Step 3. The criteria weights are provided in Table 4. They are computed by using Equation (15).
Step 4. Linguistic importance evaluations given by five invited experts towards sub-criteria are provided in Table 5. The linguistic sub-criteria weight matrices are constructed with the help of Equation (16).
Table 5.
Linguistic importance evaluations for the sub-criteria.
Step 5. The picture fuzzy sub-criteria weight matrices are given in Table 6. PFNs which represent importance evaluation of the sub-criteria are computed as the proportion of each item in the voting results.
Table 6.
The picture fuzzy sub-criteria weight matrices and defuzzified values.
Step 6. The sub-criteria weights are found with the help of Equation (18). The obtained values are provided in Table 6.
Step 7. Linguistic evaluations given by the invited experts towards three alternatives for solving the freight distribution concept selection problem are presented in Table 7. Twelve linguistic evaluation matrices are obtained by using Equation (19).
Table 7.
Linguistic evaluations for the alternatives.
Step 8. Table 8 presents the picture fuzzy evaluation matrices. The picture fuzzy evaluations of three different freight distribution concepts are computed as the proportion of each item in the voting results.
Table 8.
The picture fuzzy evaluation matrices.
Step 9. Twelve picture fuzzy normalized evaluation matrices are presented in Table 9. Only experts’ evaluations with respect to cost sub-criteria are transformed by utilizing the complement operation (Equation (21)). Cost sub-criteria are vehicle procurement cost (C11), vehicle maintenance cost (C12), time to achieve the equilibrium point of investment (C13), human capital cost (C15), workspace cost (C16), air pollution (C21), noise pollution (C22), effect on public health (C23), and energy consumption (C24).
Table 9.
The picture fuzzy normalized evaluation matrices.
Step 10. The picture fuzzy decision matrix is provided in Table 10. Aggregated normalized evaluations of three different freight distribution concepts with respect to each criterion are determined based on Table 6 and Table 9 with the help of Equation (23).
Table 10.
The picture fuzzy decision matrix.
Step 11. The picture fuzzy weighted decision matrix is presented in Table 11. Its values are determined based on the criteria weights (Table 4) and the aggregated normalized evaluations of alternatives (Table 10) with the help of Equation (24).
Table 11.
The picture fuzzy weighted decision matrix.
Step 12. The ideal alternative is: A0 = {<0.208, 0.593, 0.104>, <0.131, 0.693, 0.105>, <0.067, 0.865, 0.014>, <0.134, 0.795, 0.033>}. It is determined by using Equation (25).
Step 13. The picture fuzzy optimality functions of the ideal alternative and three different freight distribution concepts are calculated with the help of Equation (26). The values can be found in Table 12.
Table 12.
Optimality function, utility degree, and alternative ranking.
Step 14. The picture fuzzy optimality functions are defuzzified by using Equation (27). The obtained crisp values are provided in Table 12.
Step 15. The utility degrees of three different freight distribution concepts can be found in Table 12. These values are calculated with the help of Equation (28).
Step 16. Six alternative locations are ranked according to the decreasing values of their utility degree (Table 12). The ordering is A2 > A3 > A1. Hence, according to the proposed picture fuzzy ARAS method, “freight distribution provided by 3PL” is the best freight distribution concept for the tire manufacturing company.
For validating the developed picture fuzzy ARAS method, the freight distribution concept selection problem in the Czech scenario is solved with all available PFS-based MCDM methods. Table 13 shows the score and ranking results of the considered PFS-based MCDM methods. The proposed method and eight existing state-of-the-art picture fuzzy MCDM methods have the ideal agreement between themselves since they generate the same ordering of three alternatives for the freight distribution in the Czech scenario; i.e., A2 > A3 > A1.
Table 13.
The comparison of different PFS-based MCDM methods.
The Spearman’s rank correlation coefficient is used to check the ranking similarity between the presented PFS-based MCDM method and all available state-of-the-art picture fuzzy MCDM methods. The relationships between the proposed PFS-based ARAS method and picture fuzzy TOPSIS, EDAS, VIKOR, MABAC, cross-entropy, projection, grey relational projection, and grey relational analysis methods are perfect. On the other hand, the correlation coefficient between the proposed PFS-based ARAS method and the PFS-based TODIM method is equal to 0.5. The provided PFS-based ARAS method has 94.4% of ranks matched. Hence, the results of the proposed method are highly consistent with the results of available state-of-the-art picture fuzzy MCDM methods.
In the provided real-life case study, the best alternative for the tire manufacturing company is the freight distribution by a 3PL provider (A2). In reality, by engaging the 3PL provider, the investigated company can greatly save on costs and time, allowing it to focus on core activities. On the other hand, the FDC by its own transportation fleet (A1) could pay off only for large-scale companies that generate significant transportations flows. Freight distribution by combining a company’s own transport fleet with 3PL services (A3) can also present a viable solution for mid-size companies to cut costs and save time. Additionally, companies that collaborate with 3PL providers can learn from them, since they are specialized in distribution activities.
6. Conclusions
The implementation of fuzzy logic in combination with MCDM methods is becoming more and more popular and represents a powerful tool for solving problems related to outsourcing logistics. This paper presents the novel picture fuzzy ARAS method. It is highly reliable and accurate. This is confirmed by its comparison with the existing state-of-the-art picture-fuzzy-based MCDM methods.
The insight into the FDC selection in a tire manufacturing company in the Czech Republic is provided to fully illustrate the real-life applicability of the formulated method. The picture fuzzy ARAS method shows effectiveness in dealing with the highly complex FDC selection problem. The obtained results indicate that the best possible solution is to engage the 3PL provider to carry out the outsourcing activities. It should be highlighted that the managers from the investigated tire manufacturing company agreed to this FDC proposal.
Managers dealing with uncertainty could use the proposed advanced decision-making method to solve the FDC selection problem. The introduced picture-fuzzy-based method is especially useful for a start-up company, where the FDC selection is of crucial importance. The right selection of the FDC can greatly benefit the company, especially in organizing the whole business process, and increase profit and customer satisfaction. This method may be considered as a powerful tool in solving complex decision-making problems.
This study can be seen as an important initiator of future papers in the field. Besides, future studies could apply the developed picture fuzzy ARAS method to solve various MCDM problems.
Author Contributions
Conceptualization, S.J. and V.S.; methodology, V.S.; validation, S.J., V.S., and M.D.; investigation and literature review, P.P. and M.D.; data curation, P.P.; formal analysis, S.J. and V.S.; writing—original draft preparation, S.J., V.S., P.P., and M.D.; writing—review and editing, S.J., V.S., P.P., and M.D.; visualization, S.J.; supervision, V.S., P.P., and M.D. All authors have read and agreed to the published version of the manuscript.
Funding
The article is supported by University of Pardubice, SGS_2020_010.
Conflicts of Interest
The authors declare no conflict of interest.
References
- Bennet, A.; Bennet, D. Organizational Survival in the New World: The Intelligent Complex Adaptive System; Elsevier: Amsterdam, The Netherlands, 2004. [Google Scholar]
- Fabianova, J.; Kacmary, P.; Janekova, J. Operative production planning utilising quantitative forecasting and Monte Carlo simulations. Open Eng. 2019, 9, 613–622. [Google Scholar] [CrossRef] [Scilit]
- Fedorko, G.; Molnar, V.; Honus, S.H.; Neradilova, A.; Kampf, R. The Application of Simulation Model of A Milk Run To Identify The Occurrence Of Failures. Int. J. Simul. Model. 2018. [CrossRef] [Scilit]
- Mikušová, N.; Tomková, E.; Dovica, M.; Debelic, B.; Peric-Hadzic, A.; Zajac, J. Use of Simulation for Waste Management and Reverse Material Flow. Adv. Sci. Technol. Res. J. 2018, 12, 136–143. [Google Scholar] [CrossRef] [Scilit]
- Cempirek, V.; Gasparik, J.; Zitricky, V.; Blaho, P. Control of modular conveyor and automated handling devices interconnection. Adv. Sci. Technol. Res. J. 2018, 12, 210–215. [Google Scholar] [CrossRef] [Scilit]
- Georgijevic, M.; Bojic, S.; Brcanov, D. The location of public logistic centers: An expanded capacity-limited fixed cost location-allocation modeling approach. Transp. Plan. Technol. 2013, 36, 218–229. [Google Scholar] [CrossRef] [Scilit]
- Cuong, B.C.; Kreinovich, V. Picture fuzzy sets—A new concept for computational intelligence problems. In Proceedings of the Third World Congress on Information and Communication Technologies, Hanoi, Vietnam, 15–18 December 2013; pp. 1–6. [Google Scholar] [CrossRef] [Scilit]
- Cuong, B.C. Picture fuzzy sets. J. Comput. Sci. Cybern. 2014, 30, 409–420. [Google Scholar] [CrossRef] [Scilit]
- Liu, H.; Wang, H.; Yuan, Y.; Zhang, C. Models for multiple attribute decision making with picture fuzzy information. J. Intell. Fuzzy Syst. 2019, 37, 1973–1980. [Google Scholar] [CrossRef] [Scilit]
- Zavadskas, E.K.; Turskis, Z. A new additive ratio assessment (ARAS) method in multi-criteria decision-making. Technol. Econ. Dev. Econ. 2010, 16, 159–172. [Google Scholar] [CrossRef] [Scilit]
- Zavadskas, E.K.; Turskis, Z.; Vilutiene, T. Multiple criteria analysis of foundation instalment alternatives by applying Additive Ratio Assessment (ARAS) method. Arch. Civ. Mech. Eng. 2010, 10, 123–141. [Google Scholar] [CrossRef] [Scilit]
- Rostamzadeh, R.; Esmaeili, A.; Nia, A.S.; Saparauskas, J.; Keshavarz Ghorabaee, M. A fuzzy ARAS method for supply chain management performance measurement in SMEs under uncertainty. Transform. Bus. Econ. 2017, 16, 319–348. [Google Scholar]
- Alinezhad, A.; Khalili, J. ARAS method. In New Methods and Applications in Multiple Attribute Decision Making (MADM); International Series in Operations Research & Management Science; Springer: Berlin/Heidelberg, Germany, 2019. [Google Scholar] [CrossRef] [Scilit]
- Ghenai, C.; Albawab, M.; Bettayeb, M. Sustainability indicators for renewable energy systems using multi-criteria decision-making model and extended SWARA/ARAS hybrid method. Renew. Energy 2020, 146, 580–597. [Google Scholar] [CrossRef] [Scilit]
- Marasco, A. Third-party logistics: A literature review. Int. J. Prod. Econ. 2008, 113, 127–147. [Google Scholar] [CrossRef] [Scilit]
- Shi, Y.; Zhang, A.; Arthanari, T.; Liu, Y.; Cheng, T. Third-party purchase: An empirical study of third-party logistics providers in China. Int. J. Prod. Econ. 2016, 171, 189–200. [Google Scholar] [CrossRef] [Scilit]
- Rao, K.; Young, R.R. Global Supply Chains: Factors Influencing Outsourcing of Logistics Functions. Int. J. Phys. Distrib. Logist. Manag. 1994, 24, 1–19. [Google Scholar] [CrossRef] [Scilit]
- Bhatnagar, R.; Sadiq Sohail, M.; Sohal, A. A comparative study on the use of third party logistics services by Singaporean and Malaysian firms. Int. J. Phys. Distrib. Logist. Manag. 2006, 36, 690–701. [Google Scholar] [CrossRef] [Scilit]
- Kremic, T.; Tukel, O.I.; Rom, W.O. Outsourcing Decision Support: A Survey of Benefits, Risks, and Decision Factors. Supply Chain Manag. Int. J. 2006, 11, 467–482. [Google Scholar] [CrossRef] [Scilit]
- Handley, S.M. The perilous effects of capability loss on outsourcing management and performance. J. Oper. Manag. 2012, 30, 152–165. [Google Scholar] [CrossRef] [Scilit]
- Bajec, P.; Jakomin, I. A Make-or-Buy Decision Process for Outsourcing. Promet Traffic Transp. 2010, 22, 285–291. [Google Scholar] [CrossRef] [Scilit]
- Pirannejad, A.; Salami, H.; Mollaee, A. Outsourcing priorities of government functions: Analytic network process approach. Afr. J. Bus. Manag. 2010, 4, 1723–1735. [Google Scholar]
- Liou, J.H.; Chuang, Y. Developing a hybrid multi-criteria model for selection of outsourcing providers. Expert Syst Appl. 2010, 37, 3755–3761. [Google Scholar] [CrossRef] [Scilit]
- Cheng, Y.; Lee, F. Outsourcing reverse logistics of high-tech manufacturing firms by using a systematic decision-making approach: TFT-LCD sector in Taiwan. Ind. Mark. Manag. 2010, 39, 1111–1119. [Google Scholar] [CrossRef] [Scilit]
- Aktas, E.; Agaran, B.; Ulengin, F.; Onsel, S. The use of outsourcing logistics activities: The case of Turkey. Transp. Res. Part C Emerg. Technol. 2011, 19, 833–852. [Google Scholar] [CrossRef] [Scilit]
- Solakivi, T.; Töyli, J.; Ojala, L. Logistics outsourcing, its motives and the level of logistics costs in manufacturing and trading companies operating in Finland. Prod. Plan. Control 2013, 24, 388–398. [Google Scholar] [CrossRef] [Scilit]
- Hsu, C.-C.; Liou, J.H.J. An outsourcing provider decision model for the airline industry. J. Air Transp. Manag. 2013, 28, 40–46. [Google Scholar] [CrossRef] [Scilit]
- Rezaeisaray, M.; Ebrahimnejad, S.; Khalili-Damghani, K. A novel hybrid MCDM approach for outsourcing supplier selection. J. Model. Manag. 2016, 11, 536–559. [Google Scholar] [CrossRef] [Scilit]
- Chen, S.L.; Pham, V.K.; Chen, J.K.C. Evaluating and Selecting the Best Outsourcing Service Country in East and Southeast Asia: An AHP Approach. J. Test. Eval. 2016, 1, 89–101. [Google Scholar] [CrossRef] [Scilit]
- Kahraman, C.; Öztayşi, B.; Onar, Ç.S. An Integrated Intuitionistic Fuzzy AHP and TOPSIS Approach to Evaluation of Outsource Manufacturers. J. Intell. Syst. 2018. [Google Scholar] [CrossRef] [Scilit]
- Arif, J.; Jawab, F. Outsourcing of Logistics’ Activities: Impact Analysis on Logistics Service Performance. In Proceedings of the 2018 International Colloquium on Logistics and Supply Chain Management (LOGISTIQUA), Tangier, Morocco, 26–27 April 2018; pp. 88–92. [Google Scholar] [CrossRef] [Scilit]
- Sanchis-Pedregosa, C.; Machuca, J.A.D.; Gonzalez-Zamora, M.D.M. Determinants of success in transport services outsourcing: Empirical study in Europe. Int. J. Logist. Manag. 2018. [Google Scholar] [CrossRef] [Scilit]
- Hwang, T.; Kim, S.T. Balancing in-house and outsourced logistics services: Effects on supply chain agility and firm performance. Serv. Bus. 2019, 13, 531–556. [Google Scholar] [CrossRef] [Scilit]
- Wan, Q.; Yuan, Y.; Lai, F. Disentangling the driving factors of logistics outsourcing: A configurational perspective. J. Enterp. Inf. Manag. 2019, 32, 964–992. [Google Scholar] [CrossRef] [Scilit]
- Bucovetchi, O.; Stanciu, R.; Badea, D. Is outsourcing the best solution in increasing organizational performance? Qual. Access Success 2019, 20, 447–450. [Google Scholar]
- Zarbakhshnia, N.; Wu, Y.; Govindan, K.; Soleimani, H. A novel hybrid multiple attribute decision-making approach for outsourcing sustainable reverse logistics. J. Clean. Prod. J. Clean. Prod. 2019, 242. [Google Scholar] [CrossRef] [Scilit]
- Kiani, M.; Bagheri, M.; Ebrahimi, A.; Alimohammadlou, M. A model for prioritizing outsourceable activities in universities through an integrated fuzzy-MCDM method. Int. J. Constr. Manag. 2019. [Google Scholar] [CrossRef] [Scilit]
- Vazifehdan, N.M.; Darestani, A.S. Green Logistics Outsourcing Employing Multi Criteria Decision Making and Quality Function Deployment in the Petrochemical Industry. Assian J. Shipp. Logist. 2019, 35, 243–254. [Google Scholar] [CrossRef] [Scilit]
- Sayed, M.; Hendry, L.C.; Bell, M.Z. Sustainable procurement: Comparing in-house and outsourcing implementation modes. Prod. Plan. Control 2020. [Google Scholar] [CrossRef] [Scilit]
- Mokrini, A.; Aouam, T. A fuzzy multi-criteria decision analysis approach for risk evaluation in healthcare logistics outsourcing: Case of Morocco. Health Serv. Manag. Res. 2020, 1–11. [Google Scholar] [CrossRef] [Scilit] [PubMed]
- Tavana, M.; Zareinejad, M.; Di Caprio, D.; Kaviani, M.A. An integrated intuitionistic fuzzy AHP and SWOT method for outsourcing reverse logistics. Appl. Soft Comput. 2016, 40, 544–557. [Google Scholar] [CrossRef] [Scilit]
- Wu, Y.; Chen, K.; Zeng, B.; Xu, H.; Yang, Y. Supplier selection in nuclear power industry with extended VIKOR method under linguistic information. Appl. Soft Comput. 2016, 48, 444–457. [Google Scholar] [CrossRef] [Scilit]
- Tupenaite, L.; Zavadskas, E.K.; Kaklauskas, A.; Turskis, Z.; Seniut, M. Multiple criteria assessment of alternatives for built and human environment renovation. J. Civ. Eng. Manag. 2010, 16, 257–266. [Google Scholar] [CrossRef] [Scilit]
- Turskis, Z.; Zavadskas, E.K. A new fuzzy additive ratio assessment method (ARAS-F). Case study: The analysis of fuzzy multiple criteria in order to select the logistic centers location. Transport 2010, 25, 423–432. [Google Scholar] [CrossRef] [Scilit]
- Turskis, Z.; Zavadskas, E.K. A novel method for multiple criteria analysis: Grey Additive Ratio Assessment (ARAS-G) method. Informatica 2010, 21, 597–610. [Google Scholar] [CrossRef] [Scilit]
- Keršulienė, V.; Turskis, Z. Integrated fuzzy multiple criteria decision-making model for architect selection. Technol. Econ. Dev. Econ. 2011, 17, 645–666. [Google Scholar] [CrossRef] [Scilit]
- Baležentis, A.; Baležentis, T.; Misiūnas, A. Integrated assessment of Lithuanian economic sectors based on financial ratios and fuzzy MCDM Methods. Technol. Econ. Dev. Econ. 2012, 18, 34–53. [Google Scholar] [CrossRef] [Scilit]
- Dadelo, S.; Turskis, Z.; Zavadskas, E.K.; Dadeliene, R. Multiple criteria assessment of elite security personal based on ARAS and expert methods. Econ. Comput. Econ. Cybern. Stud. Res. 2012, 46, 65–87. [Google Scholar]
- Zavadskas, E.K.; Sušinskas, S.; Daniūnas, A.; Turskis, Z.; Sivilevičius, H. Multiple criteria selection of pile-column construction technology. J. Civ. Eng. Manag. 2012, 18, 834–842. [Google Scholar] [CrossRef] [Scilit]
- Zavadskas, E.K.; Vainiūnas, P.; Turskis, Z.; Tamošaitienė, J. Multiple criteria decision support system for assessment of projects managers in construction. Int. J. Inf. Technol. Decis. Mak. 2012, 11, 501–520. [Google Scholar] [CrossRef] [Scilit]
- Turskis, Z.; Zavadskas, E.K.; Kutut, V. A model based on ARAS-G and AHP methods for multiple criteria prioritizing of heritage value. Int. J. Inf. Technol. Decis. Mak. 2013, 12, 45–73. [Google Scholar] [CrossRef] [Scilit]
- Keršulienė, V.; Turskis, Z. A hybrid linguistic fuzzy multiple criteria group selection of a chief accounting officer. J. Bus. Econ. Manag. 2014, 15, 232–252. [Google Scholar] [CrossRef] [Scilit]
- Kutut, V.; Zavadskas, E.K.; Lazauskas, M. Assessment of priority alternatives for preservation of historic buildings using model based on ARAS and AHP methods. Arch. Civ. Mech. Eng. 2014, 14, 287–294. [Google Scholar] [CrossRef] [Scilit]
- Zamani, M.; Rabbani, A.; Yazdani-Chamzini, A.; Turskis, Z. An integrated model for extending brand based on fuzzy ARAS and ANP methods. J. Bus. Econ. Manag. 2014, 15, 403–423. [Google Scholar] [CrossRef] [Scilit]
- Medineckiene, M.; Zavadskas, E.K.; Björk, F.; Turskis, Z. Multi-criteria decision-making system for sustainable building assessment/certification. Arch. Civ. Mech. Eng. 2015, 15, 11–18. [Google Scholar] [CrossRef] [Scilit]
- Stanujkic, D. Extension of the ARAS method for decision-making problems with interval-valued triangular fuzzy numbers. Informatica 2015, 26, 335–355. [Google Scholar] [CrossRef] [Scilit]
- Zavadskas, E.K.; Turskis, Z.; Bagočius, V. Multi-criteria selection of a deep-water port in the Eastern Baltic Sea. Appl. Soft Comput. 2015, 26, 180–192. [Google Scholar] [CrossRef] [Scilit]
- Liao, C.-N.; Fu, Y.-K.; Wu, L.-C. Integrated FAHP, ARAS-F and MSGP methods for green supplier evaluation and selection. Technol. Econ. Dev. Econ. 2016, 22, 651–669. [Google Scholar] [CrossRef] [Scilit]
- Nguyen, H.-T.; Md Dawal, S.Z.; Nukman, Y.; Rifai, A.P.; Aoyama, H. An integrated MCDM model for conveyor equipment evaluation and selection in an FMC based on a fuzzy AHP and fuzzy ARAS in the presence of vagueness. PLoS ONE 2016, 11, e153222. [Google Scholar] [CrossRef] [Scilit]
- Štreimikienė, D.; Šliogerienė, J.; Turskis, Z. Multi-criteria analysis of electricity generation technologies in Lithuania. Renew. Energy 2016, 85, 148–156. [Google Scholar] [CrossRef] [Scilit]
- Büyüközkan, G.; Göçer, F. An extension of ARAS methodology under interval valued intuitionistic fuzzy environment for digital supply chain. Appl. Soft Comput. 2018, 69, 634–654. [Google Scholar] [CrossRef] [Scilit]
- Dahooie, J.H.; Abadi, E.B.J.; Vanaki, A.S.; Firoozfar, H.R. Competency-based IT personnel selection using a hybrid SWARA and ARAS-G methodology. Hum. Factors Ergon. Manuf. Serv. Ind. 2018, 28, 5–16. [Google Scholar] [CrossRef] [Scilit]
- Dahooie, J.H.; Zavadskas, E.K.; Abolhasani, M.; Vanaki, A.; Turskis, Z. A novel approach for evaluation of projects using an interval–valued fuzzy Additive Ratio Assessment (ARAS) method: A case study of oil and gas well drilling projects. Symmetry 2018, 10, 45. [Google Scholar] [CrossRef] [Scilit]
- Radović, D.; Stević, Ž; Pamučar, D.; Zavadskas, E.K.; Badi, I.; Antuchevičiene, J.; Turskis, Z. Measuring performance in transportation companies in developing countries: A novel rough ARAS Model. Symmetry 2018, 10, 434. [Google Scholar] [CrossRef] [Scilit]
- Bahrami, Y.; Hassani, H.; Maghsoudi, A. BWM-ARAS: A new hybrid MCDM method for Cu prospectively mapping in the Abhar area, NW Iran. Spat. Stat. 2019, 33, 100382. [Google Scholar] [CrossRef] [Scilit]
- Dahooie, J.H.; Zavadskas, E.K.; Vanaki, A.S.; Firoozfar, H.R.; Lari, M.; Turskis, Z. A new evaluation model for corporate financial performance using integrated CCSD and FCM-ARAS approach. Econ. Res. Ekon. Istraz. 2019, 32, 1088–1113. [Google Scholar] [CrossRef] [Scilit]
- Iordache, M.; Schitea, D.; Deveci, M.; Akyurt, İ.Z.; Iordache, I. An integrated ARAS and interval type-2 hesitant fuzzy sets method for underground site selection: Seasonal hydrogen storage in salt caverns. J. Pet. Sci. Eng. 2019, 175, 1088–1098. [Google Scholar] [CrossRef] [Scilit]
- Fu, Y.-K. An integrated approach to catering supplier selection using AHP-ARAS-MCGP methodology. J. Air Transp. Manag. 2019, 75, 164–169. [Google Scholar] [CrossRef] [Scilit]
- Naicker, P.; Thopil, G.A. A framework for sustainable utility scale renewable energy selection in South Africa. J. Clean. Prod. 2019, 224, 637–650. [Google Scholar] [CrossRef] [Scilit]
- Pehlivan, N.Y.; Gürsoy, Z. Determination of individuals’ life satisfaction levels living in Turkey by FMCDM methods. Kybernetes 2019, 48, 1871–1893. [Google Scholar] [CrossRef] [Scilit]
- Turskis, Z.; Urbonas, K.; Daniūnas, A. A hybrid fuzzy group multi-criteria assessment of structural solutions of the symmetric frame alternatives. Symmetry 2019, 11, 261. [Google Scholar] [CrossRef] [Scilit]
- Wang, C.; Zhou, X.; Tu, H.; Tao, S. Some geometric aggregation operators based on picture fuzzy sets and their application in multiple attribute decision-making. Ital. J. Pure Appl. Math. 2017, 37, 477–492. [Google Scholar]
- Liang, W.; Zhao, G.; Luo, S. An integrated EDAS-ELECTRE method with picture fuzzy information for cleaner production evaluation in gold mines. Ieee Access 2018, 6, 65747–65759. [Google Scholar] [CrossRef] [Scilit]
- Son, L.H. Measuring analogousness in picture fuzzy sets: From picture distance measures to picture association measures. Fuzzy Optim. Decis. Mak. 2017, 16, 359–378. [Google Scholar] [CrossRef] [Scilit]
- Xu, X.-G.; Shi, H.; Xu, D.-H.; Liu, H.-C. Picture fuzzy Petri nets for knowledge representation and acquisition in considering conflicting opinions. Appl. Sci. 2019, 9, 983. [Google Scholar] [CrossRef] [Scilit]
- Torun, H.; Gördebil, M. Multi criteria decision making based on TOPSIS method with extended fuzzy sets. Adv. Intell. Syst. Comput. 2019, 558–566. [Google Scholar] [CrossRef] [Scilit]
- Zhang, S.; Wei, G.; Gao, H.; Wei, C.; Wei, Y. EDAS method for multiple criteria group decision making with picture fuzzy information and its application to green suppliers selections. Technol. Econ. Dev. Econ. 2019, 25, 1123–1138. [Google Scholar] [CrossRef] [Scilit]
- Wei, G. TODIM method for picture fuzzy multiple attribute decision-making. Informatica 2018, 29, 555–566. [Google Scholar] [CrossRef] [Scilit]
- Wang, L.; Wang, X.-K.; Peng, J.-J.; Wang, J.-Q. The differences in hotel selection among various types of travelers: A comparative analysis with a useful bounded rationality behavioral decision support model. Tour. Manag. 2020, 76, 103961. [Google Scholar] [CrossRef] [Scilit]
- Wang, L.; Zhang, H.Y.; Wang, J.Q.; Li, L. Picture fuzzy normalized projection-based VIKOR method for the risk evaluation of construction project. Appl. Soft Comput. 2018, 64, 216–226. [Google Scholar] [CrossRef] [Scilit]
- Wang, L.; Peng, J.J.; Wang, J.Q. A multi-criteria decision-making framework for risk ranking of energy performance contracting project under picture fuzzy environment. J. Clean. Prod. 2018, 191, 105–118. [Google Scholar] [CrossRef] [Scilit]
- Wei, G. Picture fuzzy cross-entropy for multiple attribute decision making problems. J. Bus. Econ. Manag. 2016, 17, 491–502. [Google Scholar] [CrossRef] [Scilit]
- Wei, G.; Alsaadi, F.E.; Hayat, T.; Alsaedi, A. Projection models for multiple attribute decision making with picture fuzzy information. Int. J. Mach. Learn. Cybern. 2018, 9, 713–719. [Google Scholar] [CrossRef] [Scilit]
- Ju, Y.; Ju, D.; Gonzalez, E.D.R.S.; Giannakis, M.; Wang, A. Study of site selection of electric vehicle charging station based on extended GRP method under picture fuzzy environment. Comput. Ind. Eng. 2019, 135, 1271–1285. [Google Scholar] [CrossRef] [Scilit]

© 2020 by the authors. Licensee MDPI, Basel, Switzerland. This article is an open access article distributed under the terms and conditions of the Creative Commons Attribution (CC BY) license (http://creativecommons.org/licenses/by/4.0/).