Article

Multivariate Chemometrics as a Strategy to Predict the Allergenic Nature of Food Proteins

by
Miroslava Nedyalkova
1 and
Vasil Simeonov
2,*
1
Department of Inorganic Chemistry, Faculty of Chemistry and Pharmacy, University of Sofia, 1 James Bourchier Blvd., 1164 Sofia, Bulgaria
2
Department of Analytical Chemistry, Faculty of Chemistry and Pharmacy, University of Sofia, 1 James Bourchier Blvd., 1164 Sofia, Bulgaria
*
Author to whom correspondence should be addressed.
Symmetry 2020, 12(10), 1616; https://doi.org/10.3390/sym12101616
Submission received: 3 September 2020 / Revised: 16 September 2020 / Accepted: 21 September 2020 / Published: 29 September 2020
(This article belongs to the Special Issue Chemometrics in Assessing Molecular Structures and Properties)

Abstract

:
The purpose of the present study is to develop a simple method for the classification of food proteins with respect to their allerginicity. The methods applied to solve the problem are well-known multivariate statistical approaches (hierarchical and non-hierarchical cluster analysis, two-way clustering, principal components and factor analysis) being a substantial part of modern exploratory data analysis (chemometrics). The methods were applied to a data set consisting of 18 food proteins (allergenic and non-allergenic). The results obtained convincingly showed that a successful separation of the two types of food proteins could be easily achieved with the selection of simple and accessible physicochemical and structural descriptors. The results from the present study could be of significant importance for distinguishing allergenic from non-allergenic food proteins without engaging complicated software methods and resources. The present study corresponds entirely to the concept of the journal and of the Special issue for searching of advanced chemometric strategies in solving structural problems of biomolecules.

Graphical Abstract

1. Introduction

Food allergy is an atypical immunological reaction to food proteins, which causes an adverse clinical reaction. According to the data, approximately 5% of adults and 8% of children have a food allergy [1,2,3]. Allergy to cow’s milk, eggs, wheat, soy, peanut, tree nuts, fish and shellfish comprises the majority of food allergy reactions. A study from 2001 indicated that peanut allergies are a mainstream cause for anaphylaxis, and fatal outcomes due to food allergies are 63%–67% of the deaths toll [4]. It has been proposed recently that the thermal treatment (boiled or in fried form) of peanuts leads to fewer allergenic products than roasting. In the work of Maleki et al., the digestibility of the major allergens in peanut during boiling, frying or roasting and in refined form was considered [5,6]. Despite the social importance of this issue, there is still no valuable methodology for prediction of allergenic structure or a proper methodology for the treatment of food allergies. The structural features of proteins could possibly contribute towards their allergenicity prediction. Developing such an in silico classification model may validate an appropriate approach for assisting in the allergenic potential of novel proteins. The exploratory methods based on a three-dimensional structure of allergens is of significance importance to make prediction models for allergenicity, which would allow the interpretation of the possible reasons for allergenicity of the proteins by combination of experimental and theoretical approaches
Why do proteins become allergens? This is a question that has triggered scientists to investigate what unique molecular features and properties make proteins become allergens. Information that the scientific community requires for allergy assessment should be developed by multiscale approaches and strategies with implications for different methods.
Only strategies based on multilayer approaches can boost early potential allergenicity detection. In the study of Naneva et. al., where an effort for prediction of allergic properties of a large number of proteins (over 700) is done by the use of linear sequence or surface spacial distribution of amino acids is made. The partial least square-based discriminant analysis (PLS-DA) classification model based on allergenic transformed protein data were constructed. A cluster analysis (hierarchical) was tried as a classification method for the separation of allergic from non-allergic proteins based on protein sequences to meet the needs of biologists in terms of phylogenetic analysis and prediction of biological functions like allergenicity [7,8,9,10,11]. A new type of molecular descriptor based on surface properties has been used. This approach for generating a database of is based on introduction of new types of descriptors able to reach classification of the proteins using only protein amino acids surface properties. To define the amino acids like polar, non-polar or charged, a set of hydrophobic scales were applied to explore these properties [11].
In the study of Guarino and Sciarrillo [12], deals with the proteome variation to different red strawberry species in order to clarify changes in allergen content and proteome variation for the different plant species. The detected allergens of strawberry were mapped on a 2-DE plot, and they were matched with spots recognized by a series of patients with different allergic patterns. By this approach, the authors identified the allergen proteins in Fragaria ananassa Duch, a variety of strawberry, by application of proteomic strategy compared to traditional approaches including protein isolation processes for discovering the binding between a patient’s IgE (immunoglobulin E) and separated plant allergenic protein on a membrane. The obtained results revealed that the application of proteomics analyses enhanced identification of multiple allergens in plants in contrast to the well-known techniques. Therefore, besides for the conventional methods for noticing allergens, the use of the proteomic method has wide advantage and practical value in allergens studies concerning their detection and characterization. It is expected that a combination of proteomics and biological assays could substantially contribute to better understanding of the function the IgE-binding proteins. The cheminformatics methods have been widely established as a proper approach for drug discovery applications [8,9]. The principles used in drug development can also be useful in food chemistry as well [10]. The application of chemoinformatics for studies focused on food proteins reveals the broad spectrum of application of chemical information to elucidate structure–property relationships towards an object from food science in combination with data mining. This study reveals a workflow based on chemometric methods for prediction of the allergenicity nature of the most important food allergens causing IgE-mediated food allergy that is believed to be responsible for most immediate-type, food-induced hypersensitive reactions. Analysis and classification of the allergenic molecules by the proper choice of descriptors in the chemical space provide an overall model for prediction of the pattern for recognition of allergenic and non-allergenic proteins based on their properties.
The aim of this study is to demonstrate the ability of different chemometric methods, using mainly easily assessable structural descriptors for protein molecules, to separate allergic from non-allergic proteins.

2. Materials and Methods

In this stage of the work an attempt was made to separate (classify) allergenic from non-allergenic proteins using a set of descriptors of a molecular structural nature (totally 27) based on chemometric algorithms described in detail in [11,12,13,14,15,16,17,18]. The number of proteins involved in the separation procedure was 19–13 allergenic and 6 non allergenic proteins (from data sets with proven quality and correct qualification). Thus, the data set treated had dimensions 18 x 27.
The following multivariate statistical methods for data mining were used: hierarchical cluster analysis (HCA) using standardized input data, Ward’s method of linkage, squared Euclidean distances as similarity measures and Sneath’s test for cluster significance.
Nonhierarchical (K-means) clustering was applied as a supervised pattern recognition method used as confirmation of the results from hierarchical clustering.
Two-way joining (clustering) was included for finding correspondence between the objects and variables of interest represented on a single plot.
Principal component analysis and factor analysis were used for studying the data set structure, for reducing the number of the initial variables and for projection of the data on bivariate plots.
The key goal of the data mining was to reveal patterns of similarity between the objects of study (allergenic and non-allergenic proteins) and reach reliable separation between both classes, to determine of the descriptors responsible for the formation of both classes and establish similarity patterns between the descriptors used for possible further selection of reduced number of descriptors for classification and to explain the significance of the descriptors for the classification procedure.
All chemometric calculations were performed by the software package STATISTICA 8.0.

2.1. Data Preparation

The set of plant proteins included in the present study is shown in Figure 1. Those proteins were classified as allergens by the Protein Data Bank (PDB) (https://www.rcsb.org/) or/and by the Structural Database of Allergenic Proteins (SDAP) (http://fermi.utmb.edu/). Each protein was described by a set of descriptors. The following types of descriptors were computed (using MOE and Alvadesc software ) and are presented in Table 1.

2.2. Cluster Analysis for Protein Separation

Cluster analysis (CA) is a method to find optimal groupings of observations or their descriptive variables in such a way that the members of a cluster are similar to each other and the clusters formed are different from each other. Hierarchical clustering is a type of unsupervised machine learning algorithm. In unsupervised learning mode, the learner algorithm can be used to group the data, since the non-hierarchical clustering as a supervised pattern recognition method requires a priori determination of the number of groups for data interpretation.
In order to interpret the data structure, a similarity measure should be introduced, such as Euclidean distance. Unwanted data rotations in the data structure are avoided by different data transformations, the most applied one being auto scaling or z-transformation. The graphical output of the analysis is known as a dendrogram plot.
The next important step after auto scaling and distance determination is the linkage algorithm. There are many options, but hierarchical clustering relies often on Ward’s method of linkage and non-hierarchical on K-means mode.
It must be mentioned that in non-hierarchical clustering, all a priori required clusters are simultaneously obtained, and this grouping does not possess hierarchy.

2.3. Principal Component Analysis for Protein Separation

Principal component analysis (PCA) is a powerful mathematical technique used to reduce the dimensionality of the parameter space [19]. PCA was first carried out with the aim of reducing the input variables. Varimax rotation mode was used. Three latent factors explaining over 80% of the total variance were selected for estimation of the variable relationships by factor loadings. Only statistically significant loadings (higher than 0.7) were considered for interpretation purposes.

3. Results and Discussion

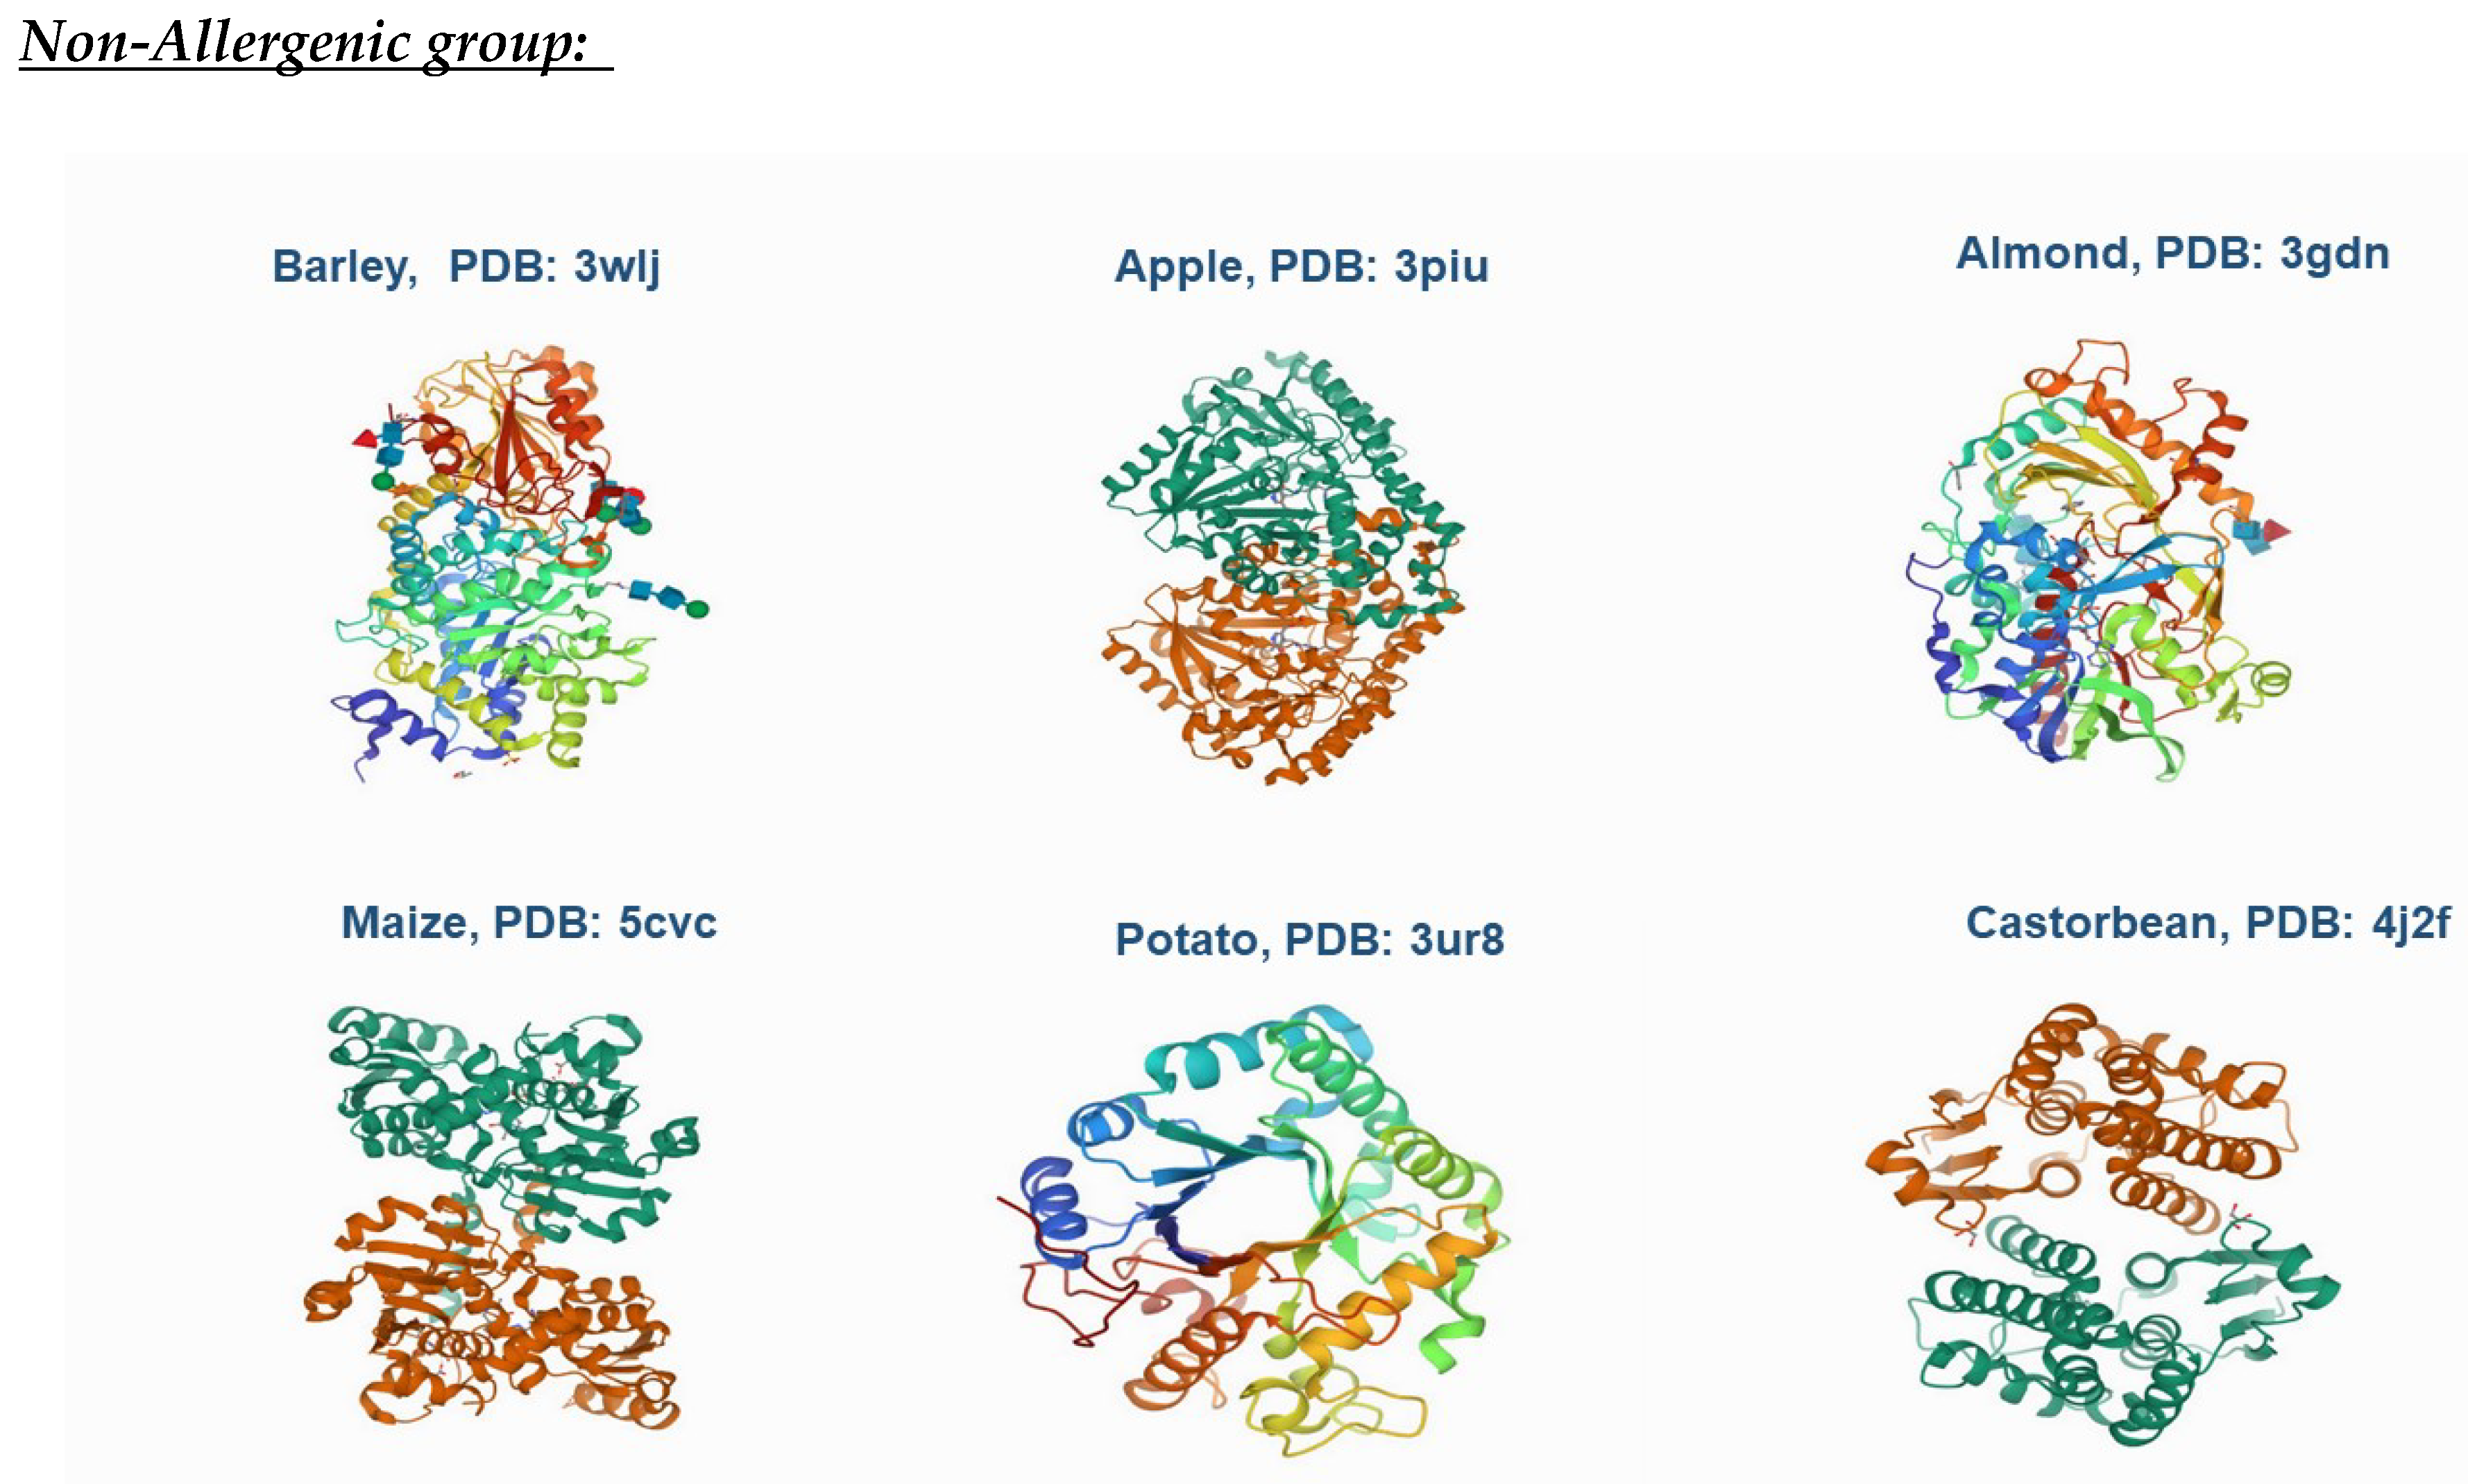
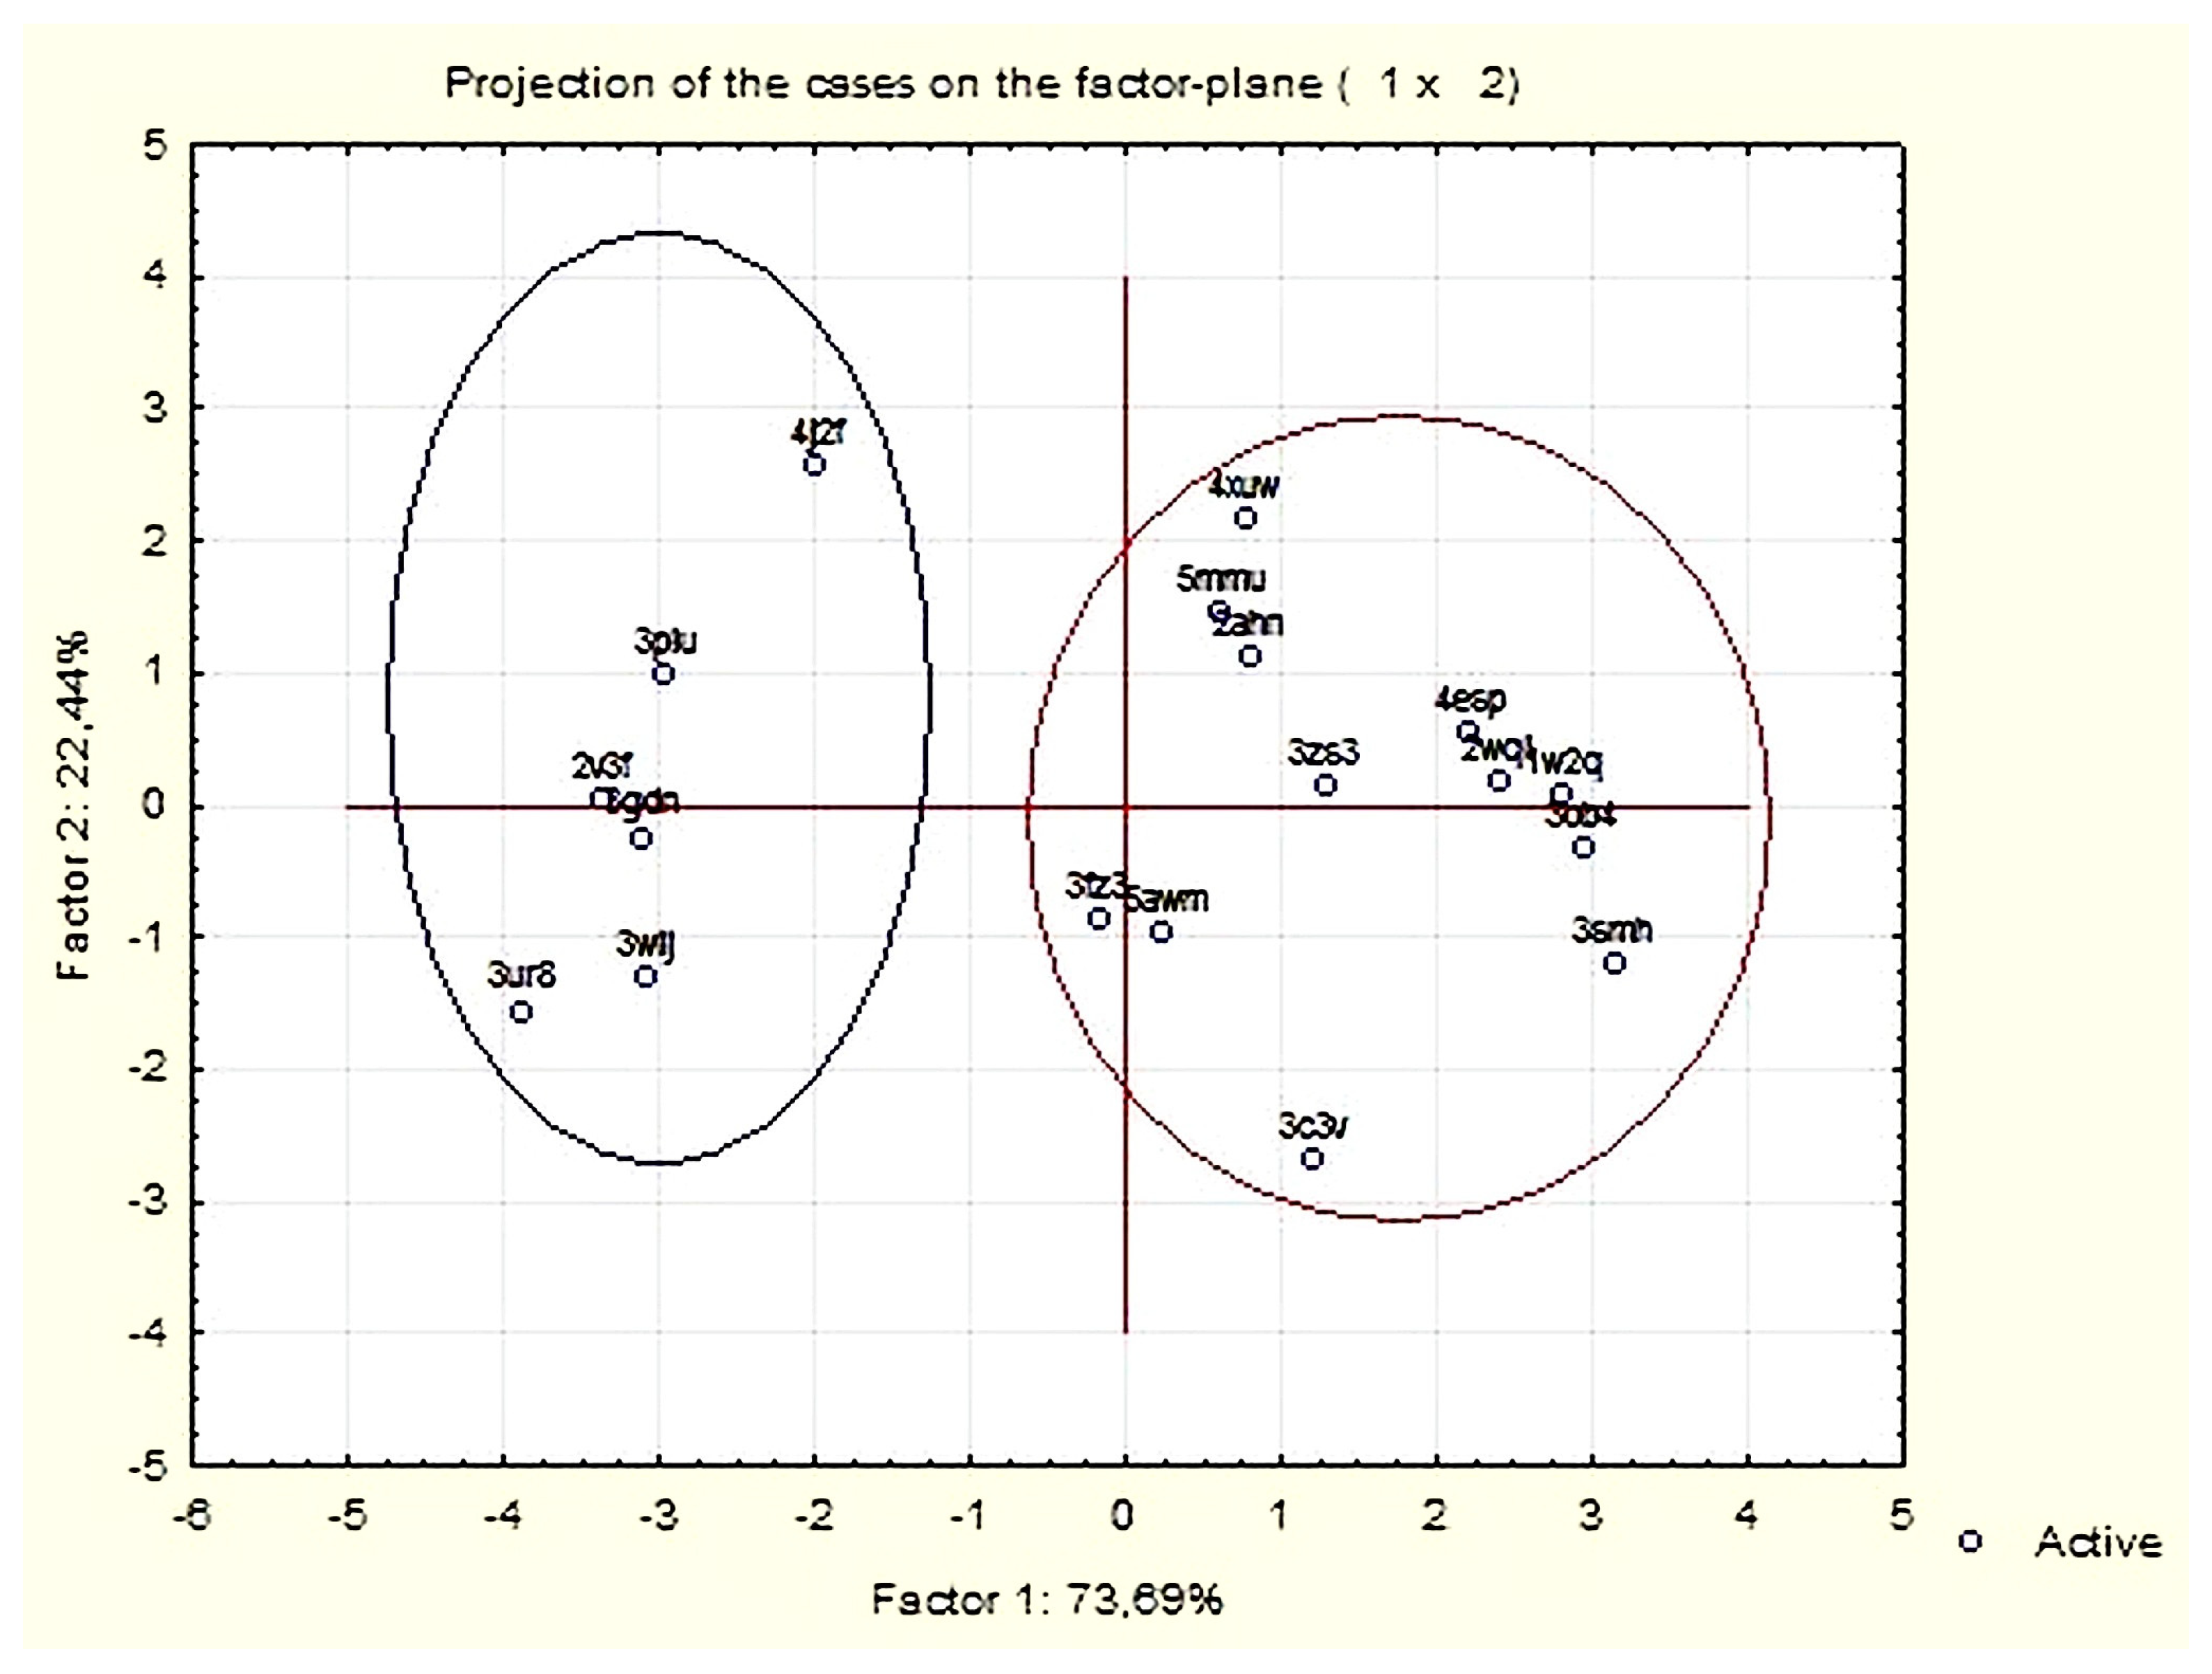
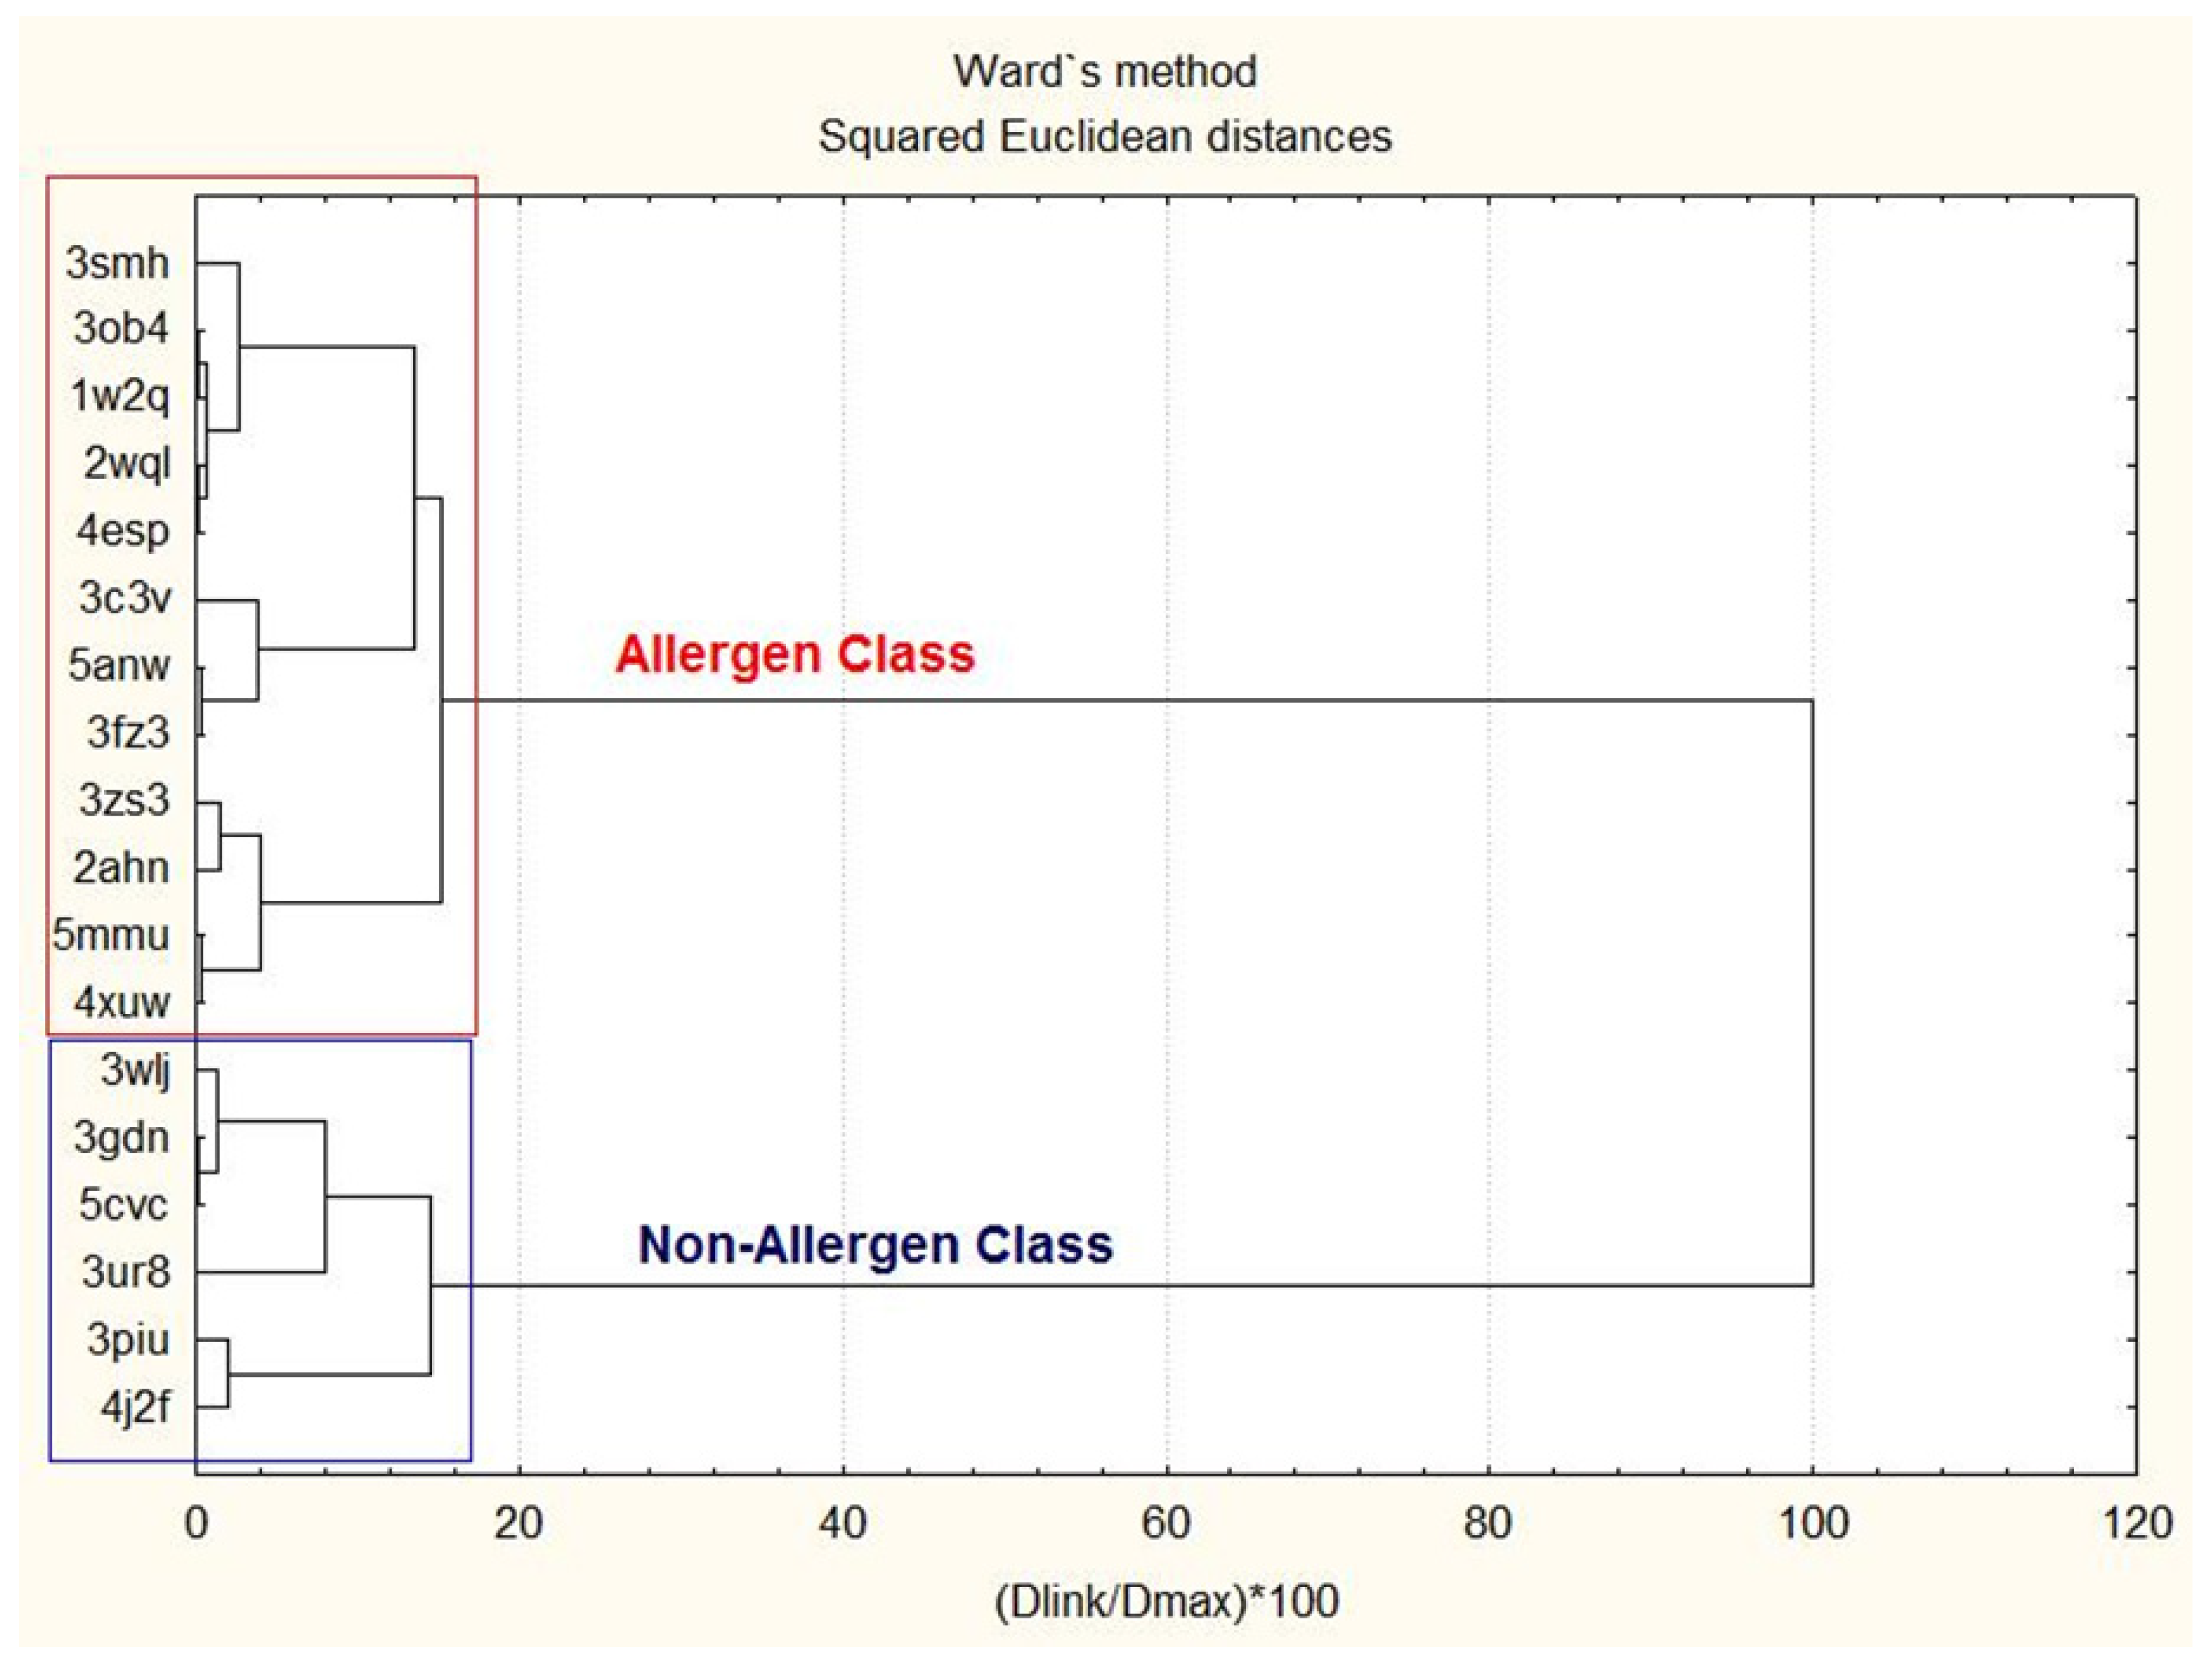
3.1. Cluster Analysis for Protein Classification Based on 2D and 3D Molecular Descriptors

The essential findings presented in this study could be defined as a pattern recognition classifying an unknown pattern into one of two predefined categories (allergenic and non-allergenic groups). Cluster analysis can be considered an important strategy in pattern recognition aiming putting a set of patterns into classes (categories). The cluster analysis approach is a highly applicable sampling method. Sampling by clusters happens over multiple stages, and the resulting process is a defined by similarity path in data and pattern space. The clustering was performed using the linkage option of the method of Ward, which was found to be most suitable as it creates a small number of clusters. In order to check the option for separation of proteins into allergenic and non-allergenic classes using structural descriptors of the proteins, a data set of 18 food proteins was prepared (12 allergenic and 6 non-allergenic). All descriptors were z-score normalized prior to the analysis so that they were on the same dimensionless scale.
The results and the comments of the data interpretation can be summarized as follows.
In Figure 2 the hierarchical dendrogram for linkage of 27 descriptors is presented.
Two very well expressed clusters were formed. One of them mainly included descriptors for surface area, volume and shape descriptors. These descriptors depend on the structure connectivity and conformation (dimensions are measured in Å). The second group of descriptors was based on physical properties. The resulting physical properties could be calculated from the connection table (with no dependence on conformation states of the molecules) of a molecule and the Kier molecular flexibility index descriptor was also defined in this cluster.
Next, Figure 3 represents the linkage between 18 proteins, and the distinctive separation of the proteins in “allergenic” and “non allergenic” classes was obvious.
The upper cluster consisted entirely of allergenic proteins, and the lower one of non-allergenic ones.
In order to confirm the clustering found by HCA, nonhierarchical K-means clustering was also performed. The stated hypothesis was that both descriptors and protein should be separated into two predetermined clusters.
In Table 2, the members of both clusters for 27 descriptors are presented, and in Table 2, the members of two clusters are presented for 18 proteins.
As could be seen, the separation between the descriptors (variables) followed entirely that reached by HCA.
The obtained results for the distribution profiles for each class of proteins based on a descriptor set were classified as allergenic and non-allergenic. Clearly, this particular selection of descriptors provided a pure dissimilarity in the profiles of allergenic and non-allergenic compounds.
Table 3 and Table 4 indicate the clustering of the proteins into two classes. Again, the similarity with HCA was almost perfect, as the only exception was protein barley defined as non-allergenic protein (PDB ID: 3wlj.pdb) belonging in K-means classification to the cluster of non-allergenic proteins rather than to the cluster of allergenic as expected.
An important step in the chemometric analysis was to try to determine the role of the separate descriptors in the separation procedure. From the plot of means (Figure 4) for the mean value of each descriptor for each of the identified clusters of proteins, it is readily seen that each protein cluster is described by different values of the descriptors.
It was readily seen that almost all descriptors were very well separated from each other for each identified cluster of proteins. Except for the descriptor weinerPa, all descriptors for non-allergic proteins had higher average (standardized) values as compared to those for allergic proteins (cluster 2). In Figure 5, the plot of means for each protein (object) for each identified cluster of descriptors is presented.
These results implied that cluster dendrograms obtained by HCA can be reliably used to identify and gain deeper insights in the presented results from K-means clustering. The obtained linearity profile, related to the descriptors of proteins obtained as well as with HCA, since a second cluster with HCA shows a non-linearly trend in each descriptor space. (to be deleted)
The results in Figure 5 indicate that the clusters of descriptors identified by K-means clustering separate very well allergenic from non-allergenic proteins. It should be noted that protein 3wlj marked in advance as non-allergenic is correctly classified by K-means clustering since in hierarchical clustering its position is doubtful.

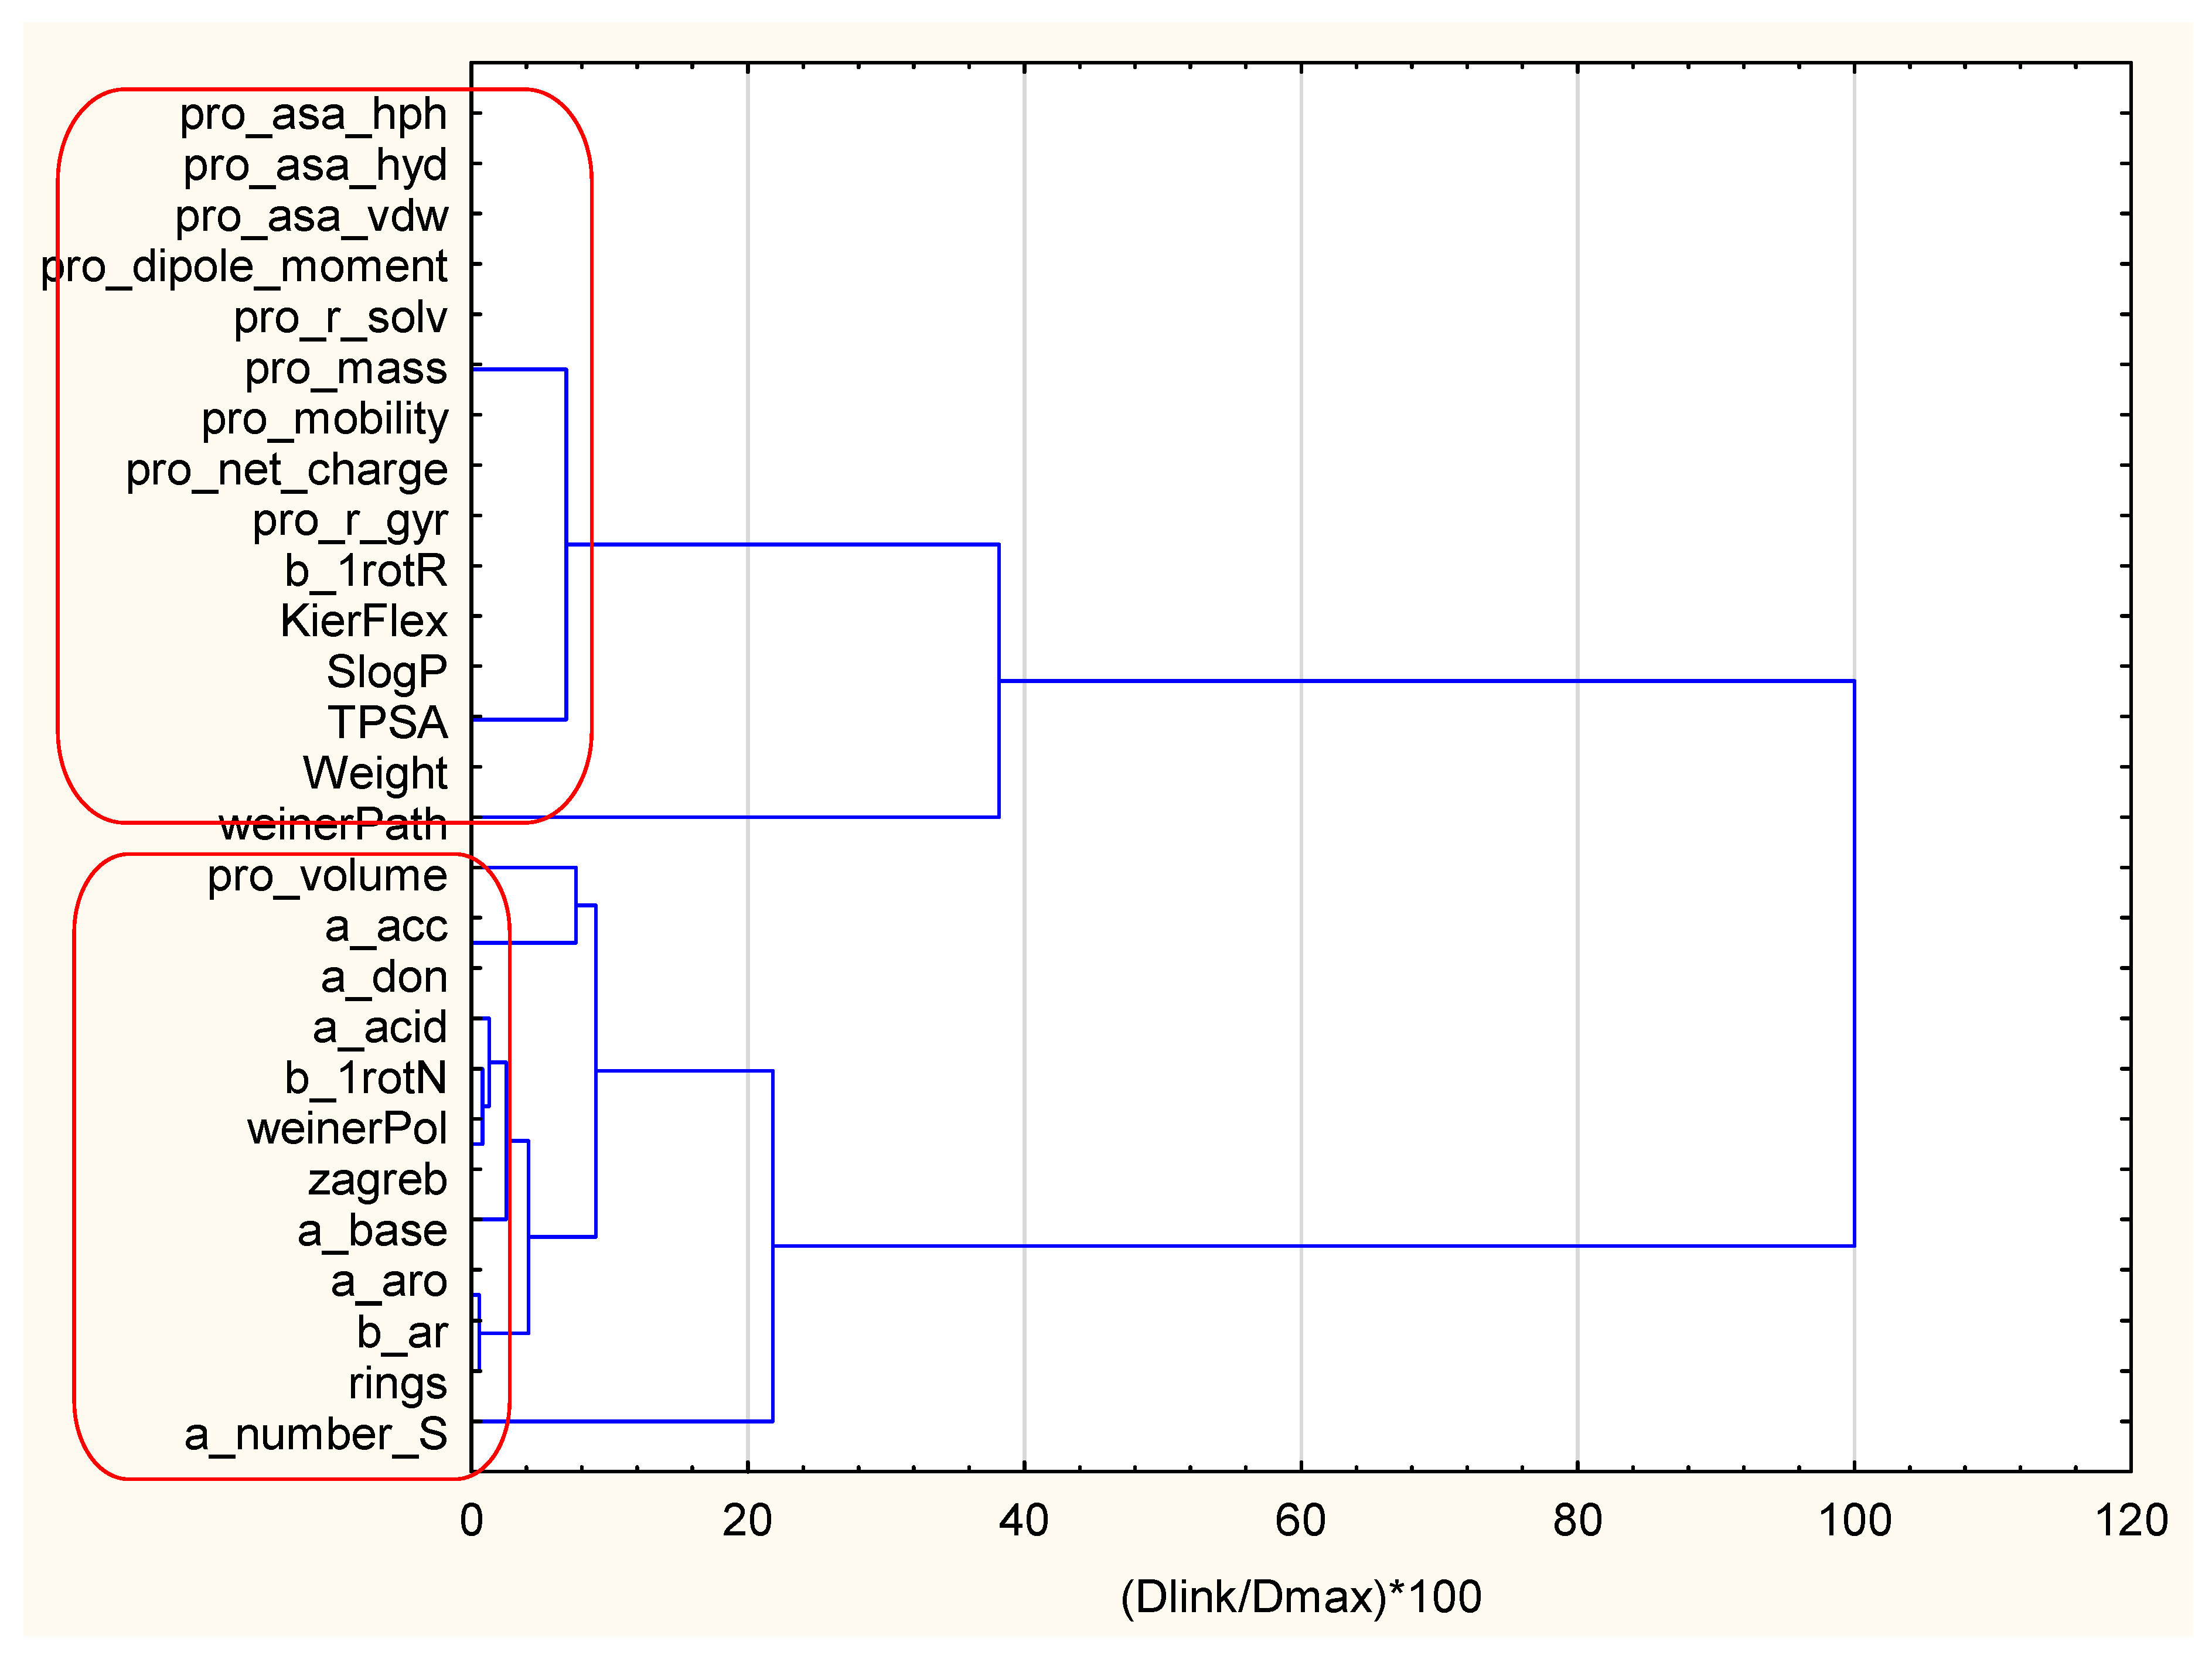
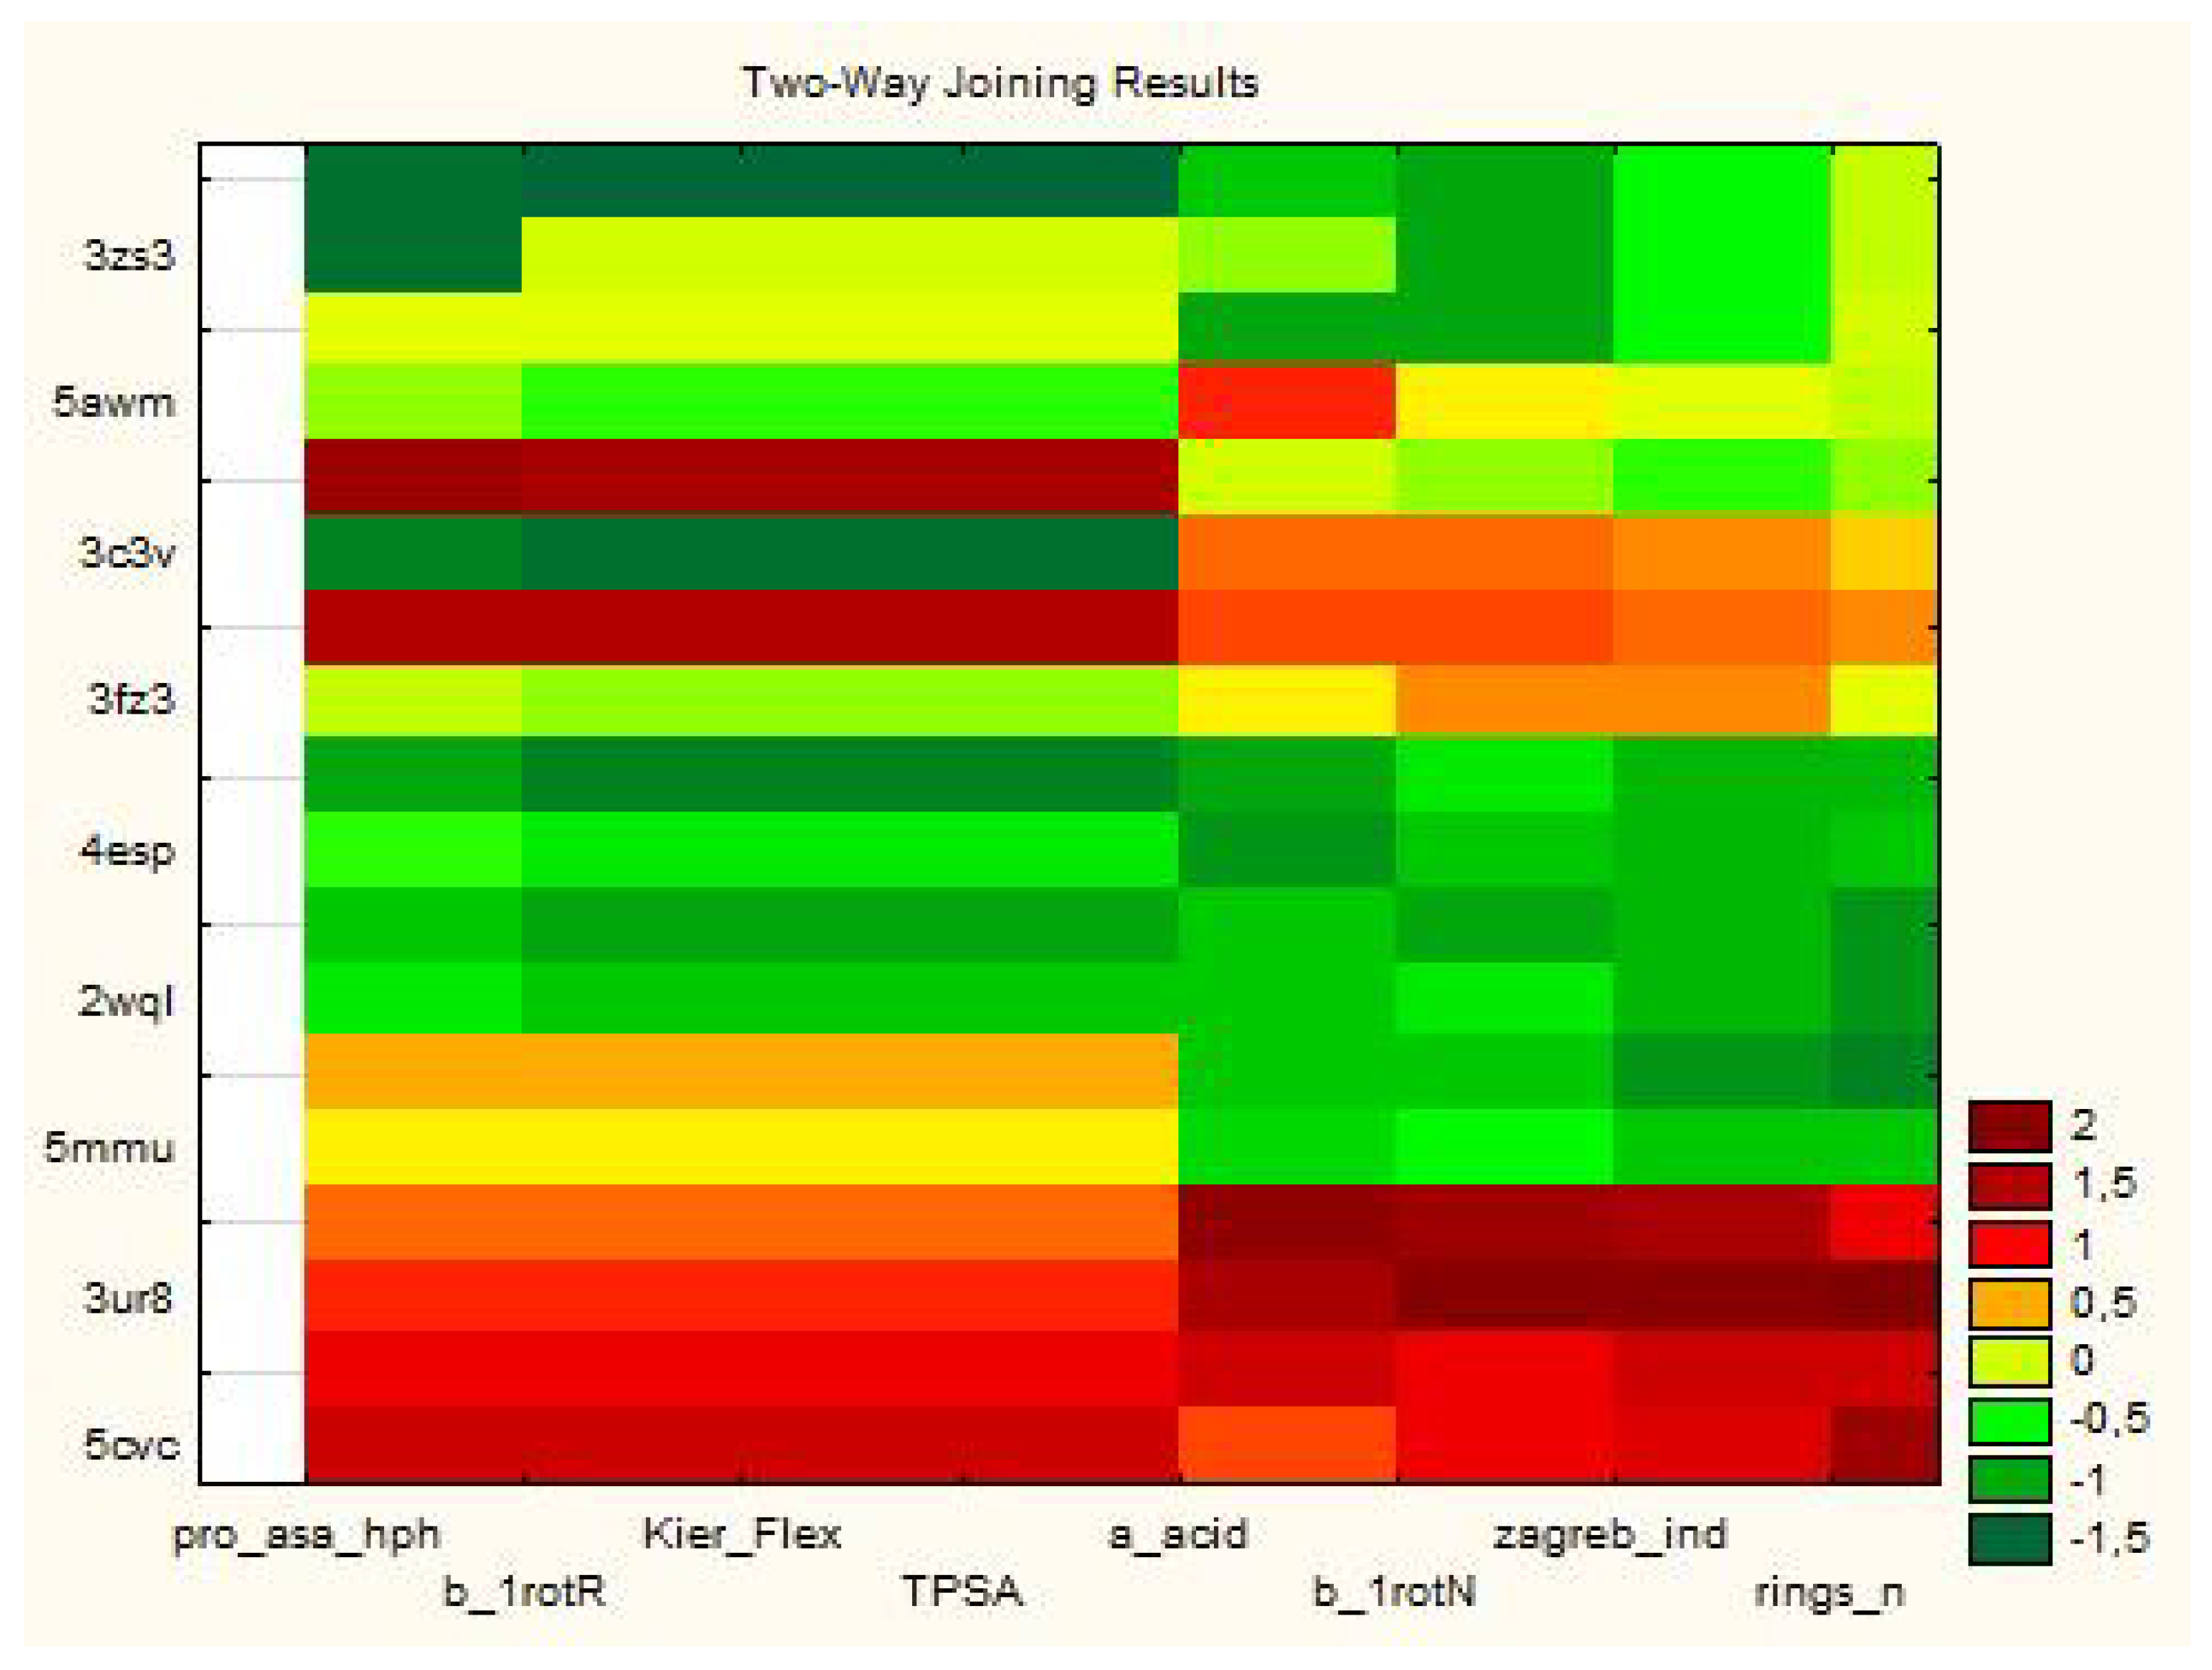
3.1.1. Two-Way Clustering

In the next step of the data mining two-way clustering approach was applied. In Figure 6 the correspondence between the groups of objects and groups of descriptors is presented.
The output of the K-means clustering was confirmed: for non-allergic proteins, the descriptor values were higher than those for allergenic proteins.

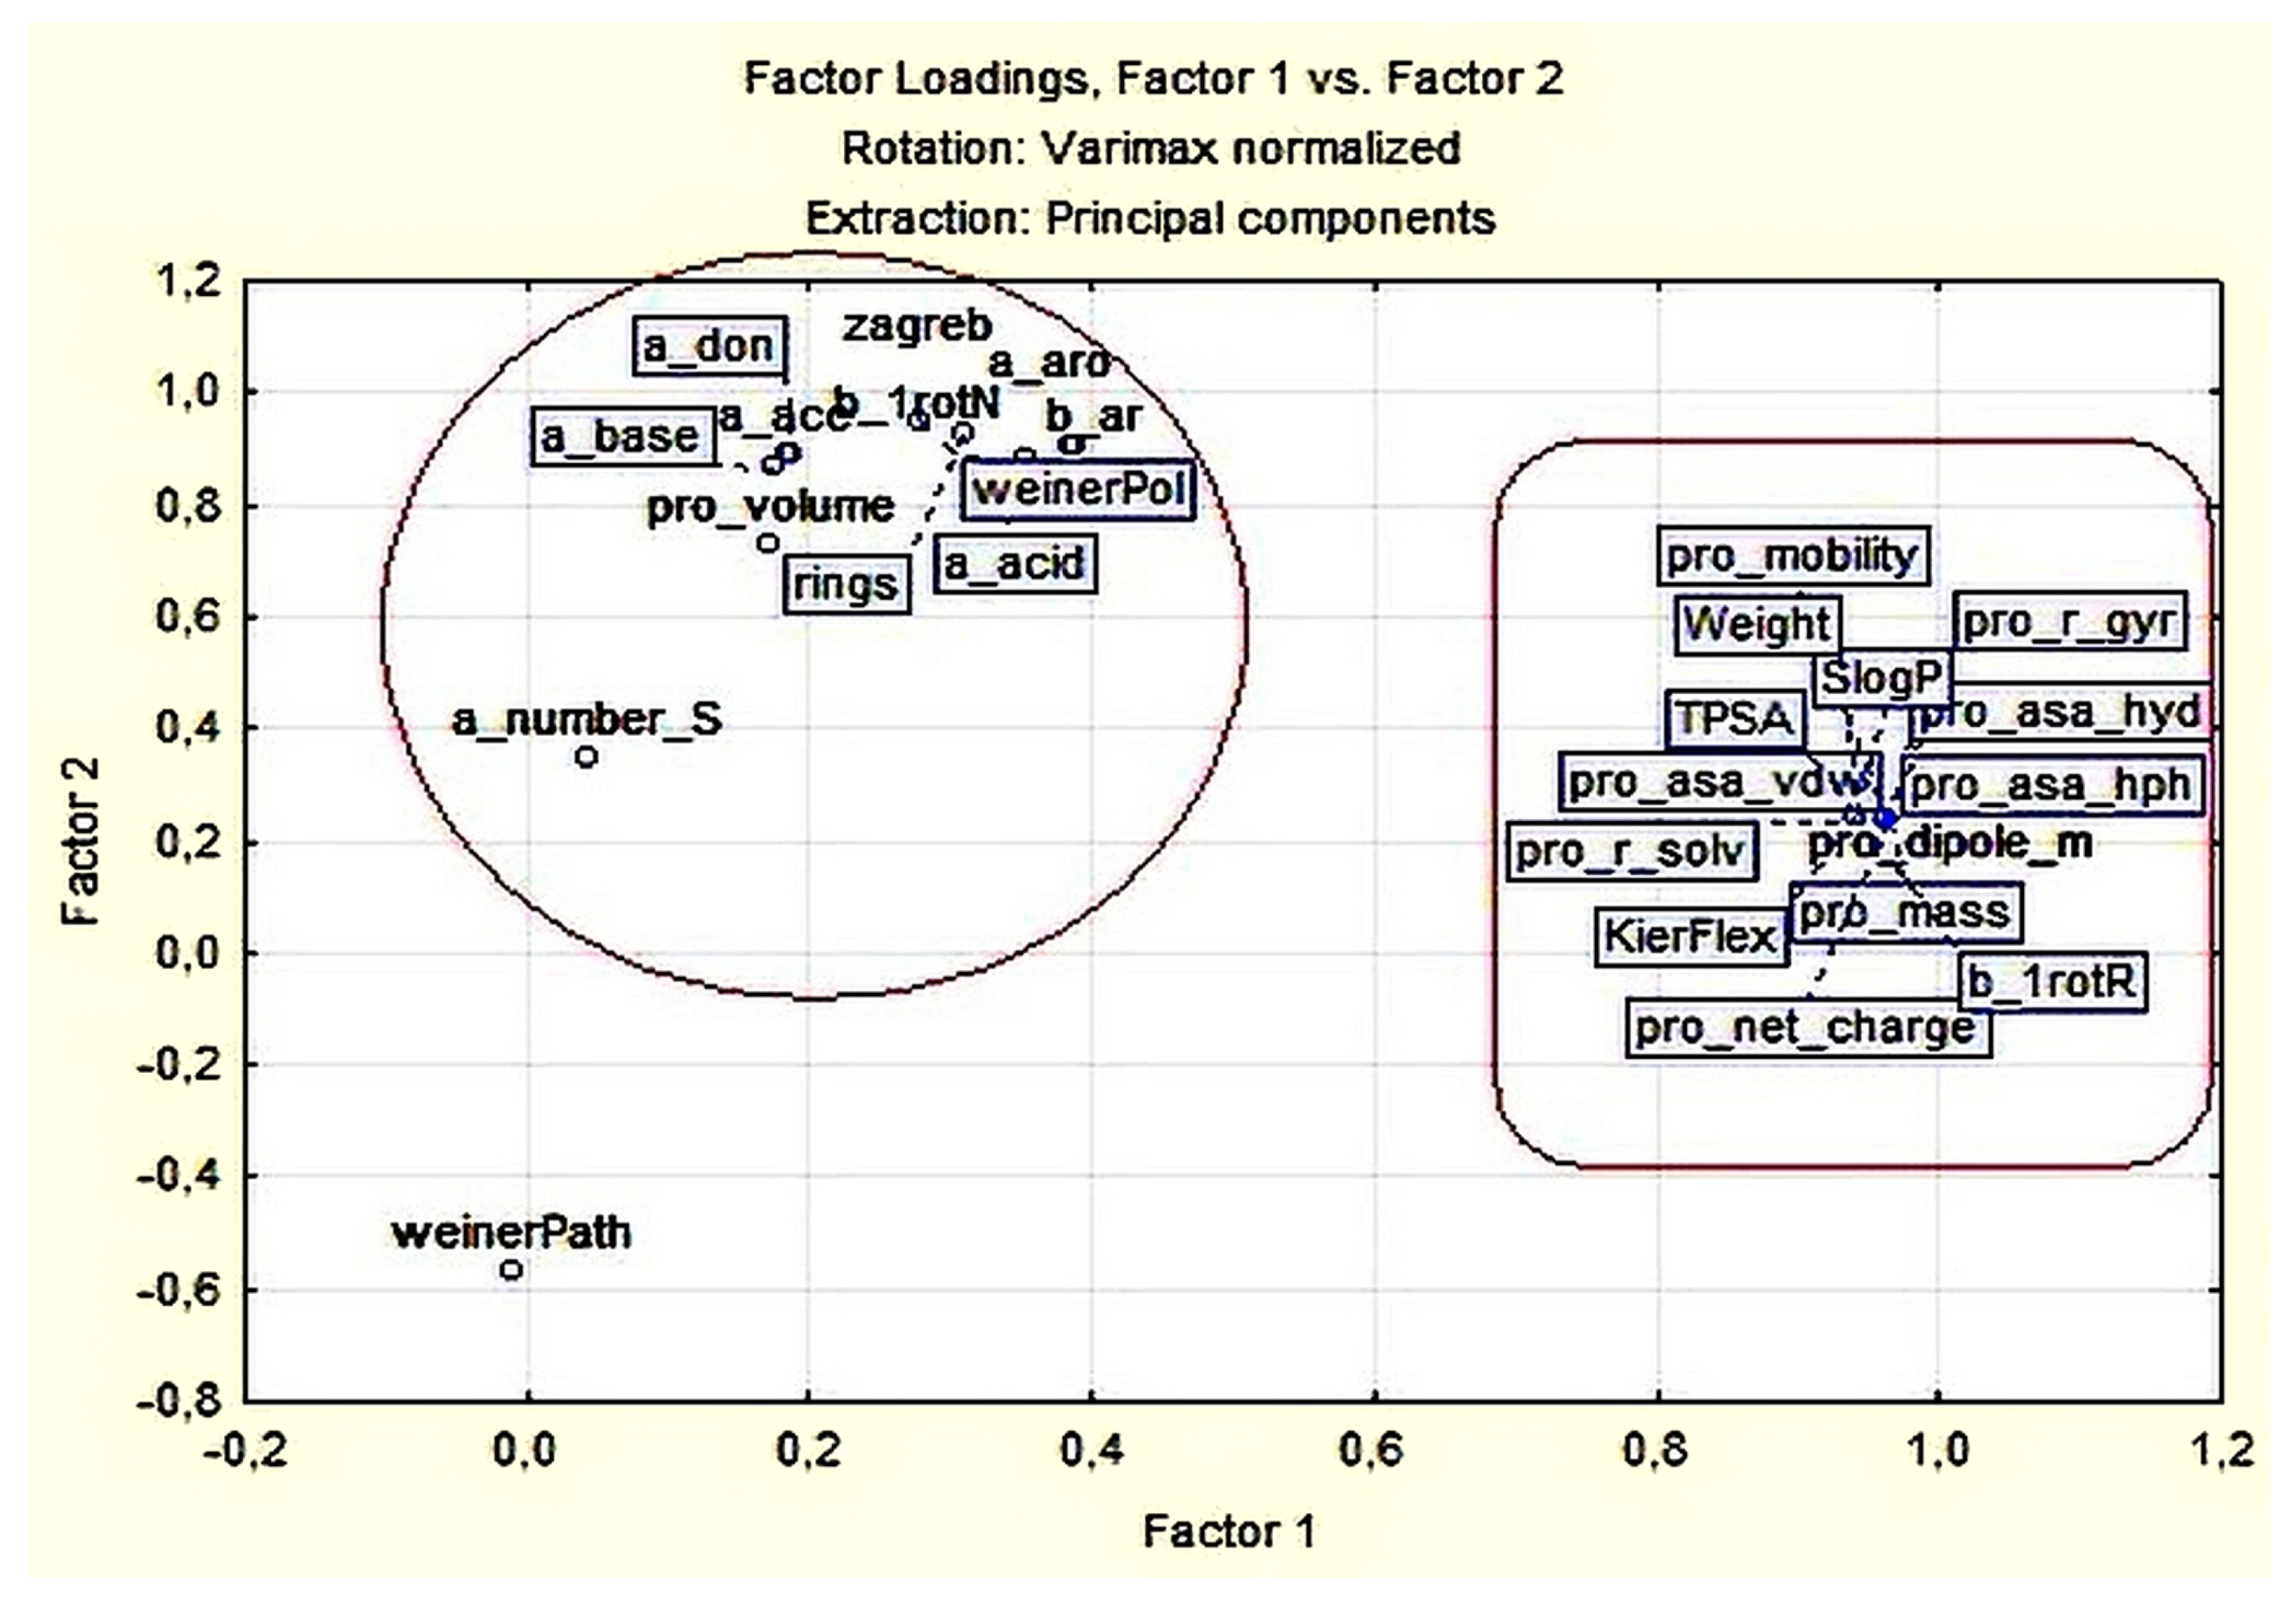
3.1.2. Principal Components and Factor Analysis

Principal components analysis of the data to correct the heavy skewness in some variables was performed.
In Table 5, the factor loadings for two latent factors explaining over 85% of the total variance are presented.
Two latent factors explain over 85% of the total variance of the system. The first latent factor includes high factor loadings for the groups of descriptors for physical properties and surface area, volume and shape and the second one includes high factor loadings from the descriptors connected to groups atom counts and bond counts, Kier Hall connectivity and Kappa Shape Indices in general, it confirms the results from cluster analysis.
From this table is possible to select a reduced number of variables (descriptors) to try even better separation of the proteins into two classes.
Graphically, the separation of the descriptor into two major groups and the special position of the descriptor Weiner Pa is well illustrated on Figure 7.
In Figure 8, the same distribution is shown.
The separation of the objects (proteins) is illustrated additionally in Figure 9.
There was a clear separation between allergenic and non-allergenic in each descriptor space and also showed a particularly good separation between two protein groups.
It was convincingly shown that the objects (proteins) were well separated into two classes: left side—non-allergic proteins, and right side—allergic proteins. Again, an exception was found concerning the classification of the expectedly allergic protein 3wlj.pdb as non-allergic.

3.1.3. Data Mining with Reduced Number of Descriptors

The data mining procedure was carried out once more with significantly reduced number of descriptors. The selection of descriptors was done on the basis of the factor loadings table, and out of several descriptors with high loadings (strong correlation), only single representatives were used: pro_asa; a_acid; b_1rotN, b_1rotR, Kier Flex, rings, TPSA, Zagreb
In general, the results of all multivariate statistical analyses applied (as in previous case) were the same:
Two clusters were formed, representative of the larger groups conditionally marked as a_descriptors and pro_descriptors (Figure 10).
Two clusters were formed, namely the upper part—allergenic—and the lower part—non allergenic. This way of feature reduction improved the allocation of protein 3wlj in the cluster of non-allergenic (Figure 11).
The same separation of the descriptors into two clusters depicted in Figure 12 was observed with the reduced number of descriptors.
The separation of the descriptors in this case was even better compared to the plot of all 27 descriptors. We did not present here the members of the two clusters of descriptors, but it resembled the outputs for 27 descriptors. More interestingly, the plot of means depicted in Figure 13 for each protein for each identified cluster of descriptors had the same output as the case with all descriptors.
It proves that the reduction of the number of descriptors does not change the existing tendency.
Similar tendency without observed biases were reported for the results of the two-way clustering presented in Figure 14. The same trend was observed for all descriptors.
This is also confirmed on the biplot presented in Figure 15 above and on the projection plot for descriptors below as indicated in Figure 16 and Table 6 for the factor loadings.
This is also confirmed on the biplot presented in Figure 15 and on the projection plot for descriptors, as indicated in Figure 16.
The projection plot for the objects (proteins) proves the separation into two classes as in the case with all descriptors as seen in Figure 17.
This study relies on the hypothesis that if we could describe in a simple way the proteins with a proper set of 2D molecular descriptors defined as numerical properties that can be calculated from the connection table representation of a molecule (e.g., elements, formal charges and bonds, but not atomic coordinates) it would be beneficial for differentiating and finding a pattern for prediction of allergenic proteins based on 2D.
Our ultimate goal is the development of highly accurate models for the prediction of the allergenicity toward plant proteins. In this context, analyzing the ability and proper choice of each molecular descriptor set to distinguish both forms is crucial. The results suggest that each descriptor set contains exceptional and complementary information to describe the final classification model. Obviously, variable selection methods based on PCA reduction are needed to identify the best descriptors from each descriptor set. These observations support the perspective that the combination of many different classes of chemical descriptors based on physical properties, subdivided surface areas, atom count and bond count descriptors, which are functions of the counts of atoms and bonds that are based on an approximate accessible van der Waals surface or pharmacophore feature descriptors, should be considered when constructing a classification model for the case of chosen proteins of families of these proteins. Using only descriptors from one type may result in a large loss of information and lack of a pattern. These results demonstrate how chemometric tools can provide us with an added layer of key information on such a complicated task, such as allergenicity prediction of food proteins. More effort is needed to validate and test for comprehension of this result; we will go further with a larger data set. In particular, the PCA-based approach has revealed a clear segregation between the groups as well as the obtained similarity pattern obtained by the HCA.
In this paper, we propose a new mapping method for classification of allergenic plant proteins that incorporates a simple scheme based on molecular descriptors. Therefore, the proposed simple model is based on the protein structure.

4. Conclusions

This study demonstrates the potential of exploiting chemometrics methods for separation and prediction between allergenic and non-allergenic food proteins. The complexity of the problem with a food allergy and especially the peanut allergies causing the majority of the annual emergency room admissions due to food allergies and approximately 63%–67% of deaths due to anaphylaxis with allergenicity nowadays is well documented. Our case study on the stated problem shows that generated descriptors could help in discriminating the groups in proteins and within the descriptors as well. Therefore, the workflow for the characterization of molecules could boost the prediction performances of models developed by PCA and HCA by a combination of different descriptors. This study paves the way to predictive abilities of the PCA and HCA models involving classical 2D molecular descriptors without a need for conducting more complicated model studies.

Author Contributions

Conceptualization, M.N.; methodology, M.N.; software, M.N.; validation, M.N. and V.S. formal analysis, M.N. and V.S.; investigation, M.N.; resources, M.N.; data curation, M.N.; writing—original draft preparation, M.N. and V.S.; writing—review and editing, M.N. and V.S.; visualization, M.N. All authors have read and agreed to the published version of the manuscript.

Funding

This research was funded by “Information and Communication Technologies for a Single Digital Market in Science, Education and Security” of the Scientific Research Center, grant number NIS-3317 and National roadmaps for research infrastructures (RIs) grant number NIS-3318.

Acknowledgments

The author M.N. is grateful for the additional support by the project “Information and Communication Technologies for a Single Digital Market in Science, Education and Security” of the Scientific Research Center, NIS-3317 and National roadmaps for research infrastructures (RIs) grant number NIS-3318. The funders had no role in the design of the study; in the collection, analyses, or interpretation of data; in the writing of the manuscript; or in the decision to publish the results.

Conflicts of Interest

The authors declare no conflict of interest.

References

  1. Anderson, A.; Shah, S.; Nurruzzaman, F. Increasing anaphylaxis hospitalizations in the first 2 decades of life: New York State, 1990–2006. Ann. Allergy Asthma Immunol. 2008, 101, 387–393. [Google Scholar]
  2. Branum, A.; Lukacs, S. Food Allergy Among Children in the United States. Pediatrics 2009, 124, 1549–1555. [Google Scholar] [CrossRef] [PubMed] [Green Version]
  3. Gupta, R.; Kim, J.; Springston, E.; Pongracic, J.; Wang, X.; Holl, J. Development of the chicago food allergy research surveys: Assessing knowledge, attitudes, and beliefs of parents, physicians, and the general public. BMC Health Serv Res. 2009, 9, 142. [Google Scholar] [CrossRef] [PubMed] [Green Version]
  4. Bock, S.; Munoz-Furlong, A.; Sampson, H.A. Fatalities due to anaphylactic reactions to foods. J. Allergy Clin. Immunol. 2001, 107, 191–193. [Google Scholar] [CrossRef] [PubMed]
  5. Maleki, S.J.; Schmitt, D.A.; Galeano, M.; Hurlburt, B.K. Comparison of the Digestibility of the Major Peanut Allergens in Thermally Processed Peanuts and in Pure Form. Foods 2014, 3, 290–303. [Google Scholar] [CrossRef] [PubMed] [Green Version]
  6. Dyer, S.; Nesbit, J.B.; Cabanillas, B.; Cheng, H.; Hurlburt, B.K.; Maleki, S.J. Contribution of chemical modifications and conformational epitopes to ige binding by ara h 3. Foods 2018, 7, 189. [Google Scholar] [CrossRef] [PubMed] [Green Version]
  7. Naneva, L.; Nedyalkova, M.; Madurga, S.; Mas, F.; Simeonov, V. Applying Discriminant and Cluster Analyses to Separate Allergenic from Non-Allergenic Proteins. Open Chem. 2019, 17, 401–407. [Google Scholar] [CrossRef]
  8. Krause, A.; Stoye, J.; Vingron, M. Large scale hierarchical clustering of protein sequences. BMC 2005, 6, 15–26. [Google Scholar]
  9. Paccanaro, A.; Casbon, J.A.; Saqi, M.A. Spectral clustering of protein sequences. Nucleic Acids Res. 2006, 34, 1571–1580. [Google Scholar] [CrossRef] [PubMed]
  10. Kelil, A.; Wang, S.; Brzezinski, R.; Fleury, A. CLUSS: Clustering of protein sequences based on a new similarity measure. BMC Bioinform. 2007, 8, 286. [Google Scholar] [CrossRef] [PubMed] [Green Version]
  11. Yu, C.; Deng, M.; Cheng, S.Y.; Yau, S.C.; He, R.L.; Yau, S.S. Protein space: A natural method for realizing the nature of protein universe. J. Theor. Biol. 2013, 318, 197–204. [Google Scholar] [CrossRef] [PubMed]
  12. Steinegger, M.; Söding, J. Clustering huge protein sequence sets in linear time. Nat. Commun. 2018, 9, 2542. [Google Scholar] [CrossRef] [PubMed] [Green Version]
  13. Gasteiger, J. Chemoinformatics: Achievements and Challenges, a Personal View. Molecules 2016, 21, 151. [Google Scholar] [CrossRef] [PubMed] [Green Version]
  14. Engel, T. Basic Overview of Chemoinformatics. J. Chem. Inf. Model. 2006, 46, 2267–2277. [Google Scholar] [CrossRef] [PubMed]
  15. Peña-Castillo, A.; Méndez-Lucio, O.; Owen, J.R.; Martínez-Mayorga, K.; Medina-Franco, J.L. Chemoinformatics in Food Science. In Applied Chemoinformatics; Engel, T., Gasteiger, J., Eds.; John Wiley and Sons: Hoboken, NJ, USA, 2020. [Google Scholar]
  16. Massart, D.L.; Kaufman, L. The Interpretation of Analytical Chemical Data by the Use of Cluster Analysis; John Wiley and Sons: Hoboken, NJ, USA, 1989. [Google Scholar]
  17. Vandeginste, B.; Massart, D.; De Jong, S.; Massaart, D.; Buydens, L. Handbook of Chemometrics And Qualimetrics: Part B; Elsevier: Amsterdam, The Netherlands, 1998. [Google Scholar]
  18. Bartholomew, D.J. Principal Components Analysis. In International Encyclopedia of Education, 3rd ed.; Peterson, P., Baker, E., Mc Gaw, B., Eds.; Elsevier: Amsterdam, The Netherlands, 2010; pp. 374–377. ISBN 9780080448947. [Google Scholar] [CrossRef]
  19. Guarino, C.; Sciarrillo, R. The identification of allergen proteins in two different varieties of strawberry by two different approaches: Proteomic and western blotting method. Ann. Agric. Sci. 2018, 63, 181–189. [Google Scholar] [CrossRef]
Figure 1. Allergenic and non-allergenic protein structures.
Symmetry 12 01616 g001aSymmetry 12 01616 g001b
Figure 2. Hierarchical dendrogram for linkage of 27 descriptors.
Symmetry 12 01616 g002
Figure 3. Hierarchical dendrogram for clustering of the 18 proteins.
Symmetry 12 01616 g003
Figure 4. Plot of means for each descriptor for each identified cluster of proteins.
Symmetry 12 01616 g004
Figure 5. Plot of means (standardized values) of each protein for each identified cluster of descriptors.
Symmetry 12 01616 g005
Figure 6. Two-way clustering of proteins and descriptors.
Symmetry 12 01616 g006
Figure 7. Biplot PC1 vs. PC 2 for grouping of descriptors.
Symmetry 12 01616 g007
Figure 8. Projection of descriptors on the plane of the first two latent factors.
Symmetry 12 01616 g008
Figure 9. Projection of objects (proteins) on the plane of the first two latent factors.
Symmetry 12 01616 g009
Figure 10. Hierarchical dendrogram for the clustering of 8 descriptors.
Symmetry 12 01616 g010
Figure 11. Hierarchical dendrogram for the clustering of 18 proteins.
Symmetry 12 01616 g011
Figure 12. Plot of means (standardized) for each descriptor for each identified cluster of proteins.
Symmetry 12 01616 g012
Figure 13. Plot of means (standardized) for each descriptor for each identified cluster of proteins.
Symmetry 12 01616 g013
Figure 14. Two-way clustering of proteins and descriptors.
Symmetry 12 01616 g014
Figure 15. Projection of objects (2D descriptors) on the plane of the first two latent factors.
Symmetry 12 01616 g015
Figure 16. Projection plot of the variables.
Symmetry 12 01616 g016
Figure 17. Projection of the cases on the factors.
Symmetry 12 01616 g017
Table 1. Molecular descriptors used and their explanation.
CODEDESCRIPTION
pro_asa_hphWater accessible surface area of all hydrophobic (|qi| < 0.2) atoms.
pro_asa_hydWater accessible surface area of all hydrophilic (|qi| < 0.2) atoms.
pro_vdwVan der Waals surface area
pro_dipole_momentDipole moment calculated from the partial charges of the molecule.
densMass density: molecular weight divided by van der Waals volume as calculated in the vol descriptor.
pro_mobilitymobility
pro_chargeTotal charge of the molecule (sum of formal charges).
pro_r_gyrRadius of gyration.
pro_r_solvRadius of cross-section
pro_volumevan der Waals volume calculated using a grid approximation (spacing 0.75 A).
a_accHydrogen bond acceptor atoms (number)
a_acidNumber of acidic atoms.
a_aroNumber of aromatic atoms.
a_baseNumber of basic atoms.
a_donNumber of hydrogen bond donor atoms (not counting basic atoms but counting atoms that are both hydrogen bond donors and acceptors such as -OH).
b_1rotRFraction of rotatable single bonds: b_1rotN divided by b_heavy.
KierFlexKier molecular flexibility index: (KierA1) (KierA2) / n
ringsThe number of rings.
SlogPLog of the octanol/water partition coefficient (including implicit hydrogens).
TPSA
(topological polar surface area based on fragments)
Polar surface area (Å2) calculated using group contributions to approximate the polar surface area from connection table information only.
WeightMolecular weight (including implicit hydrogens)
weinerPathWiener path number
weinerPolWiener polarity number
Zagreb indexZagreb index: the sum of di2 over all heavy atoms i.
Table 2. Members of cluster 1 and cluster 2 for 27 descriptors.
Variable (2D Descriptors)Members of Cluster Number 1 and Distances from Respective Cluster Center Cluster Contains 15 Variables
Distance
pro_asa_hph0.149240
pro_asahyd0.149240
pro_asa_vdw0.149240
pro_dipole_moment0.149240
pro_mass0.149240
pro_mobility0.149240
pro_net_charge0.149240
pro_r_gyr0.149240
pro_r_solv0.149240
B_1rotR0.243133
KierFlex0.243133
SlogP0.243133
TPSA0.243133
Variable (2D Descriptors)Members of Cluster Number 2 and Distances from Respective Cluster Center Cluster Contains 12 Variables
Distance
pro_volume0.649643
a_acc0.413425
a_acid0.382602
a_aro0,230073
a_base0.469422
a_don0.418075
a_number_S1.026357
b_1rotN0.322417
b_ar0.231530
rings0.236831
weinerPol0.180442
zagreb0.178149
Table 3. Members of cluster 1 for 18 proteins.
ProteinsMembers of Cluster Number 1 and Distances from Respective Cluster Center Cluster Contains 6 Cases
Distance
3wlj0.624337
3ur80.919784
3gdn0.250043
2v3f0.266641
3piu0.357769
4j2f0.929623
Table 4. Members of cluster 2 for 18 proteins.
ProteinsMembers of Cluster Number 2 and Distances from Respective Cluster Center Cluster Contains 12 Cases
Distance
3smh0.745996
3c3v0.895197
2c3b0.491340
1w2q0.492303
2wql0.569632
3vor0.343808
5amw0.490781
3fz30.660688
3zs30.633154
2ahn0.616859
5mmu0.672782
4cpv0.928246
Table 5. Factor Loadings.
VariableFactor Loadings (Varimax Normalized) Extraction: Principal Components (Marked Loadings are >0.700000)
Factor 1Factor 2
pro_mass0.964640.236248
pro_mobility0.964640.236248
pro_net_charge0.964640.236248
pro_r_gyr0.964640.236248
pro_r_solv0.964640.236248
pro_volume0.172640.728891
a_acc0.183980.890058
a_acid0.317960.867425
a_aro0.384780.907553
a_base0.174970.864993
a_don0.188960.886082
a_number_S0.043130.346071
b_1rotN0.355250.884013
b_1rotR0.942260.244491
b_ar0.389990.905283
KierFlex0.942260.244491
rings0.310020.924282
SlogP0.942260.244491
TPSA0.942260.244491
Weight0.942260.244491
weinerPath−0.00924−0.568203
weinerPol0.277420.948778
zagreb0.277910.949411
Expl. Var %50.8336.79
Table 6. Factor loadings.
VariableFactor Loadings (Varimax Normalized) Extraction: Principal Components (Marked Loadings are >0.700000)
Factor 1Factor 2
pro_asa_hph0.9200480.292616
a_acid0.2729150.923270
b_1rotN0.2820570.936526
b_1rotR0.9598520.268366
KierFlex0.9598520.268366
TPSA0.9598520.268366
rings0.2941100.903245
zagreb0.2325000.968740
Expl. Var %48.8147.32

