A Simplified Climate Change Model and Extreme Weather Model Based on a Machine Learning Method


 ,
,
Abstract
1. Introduction
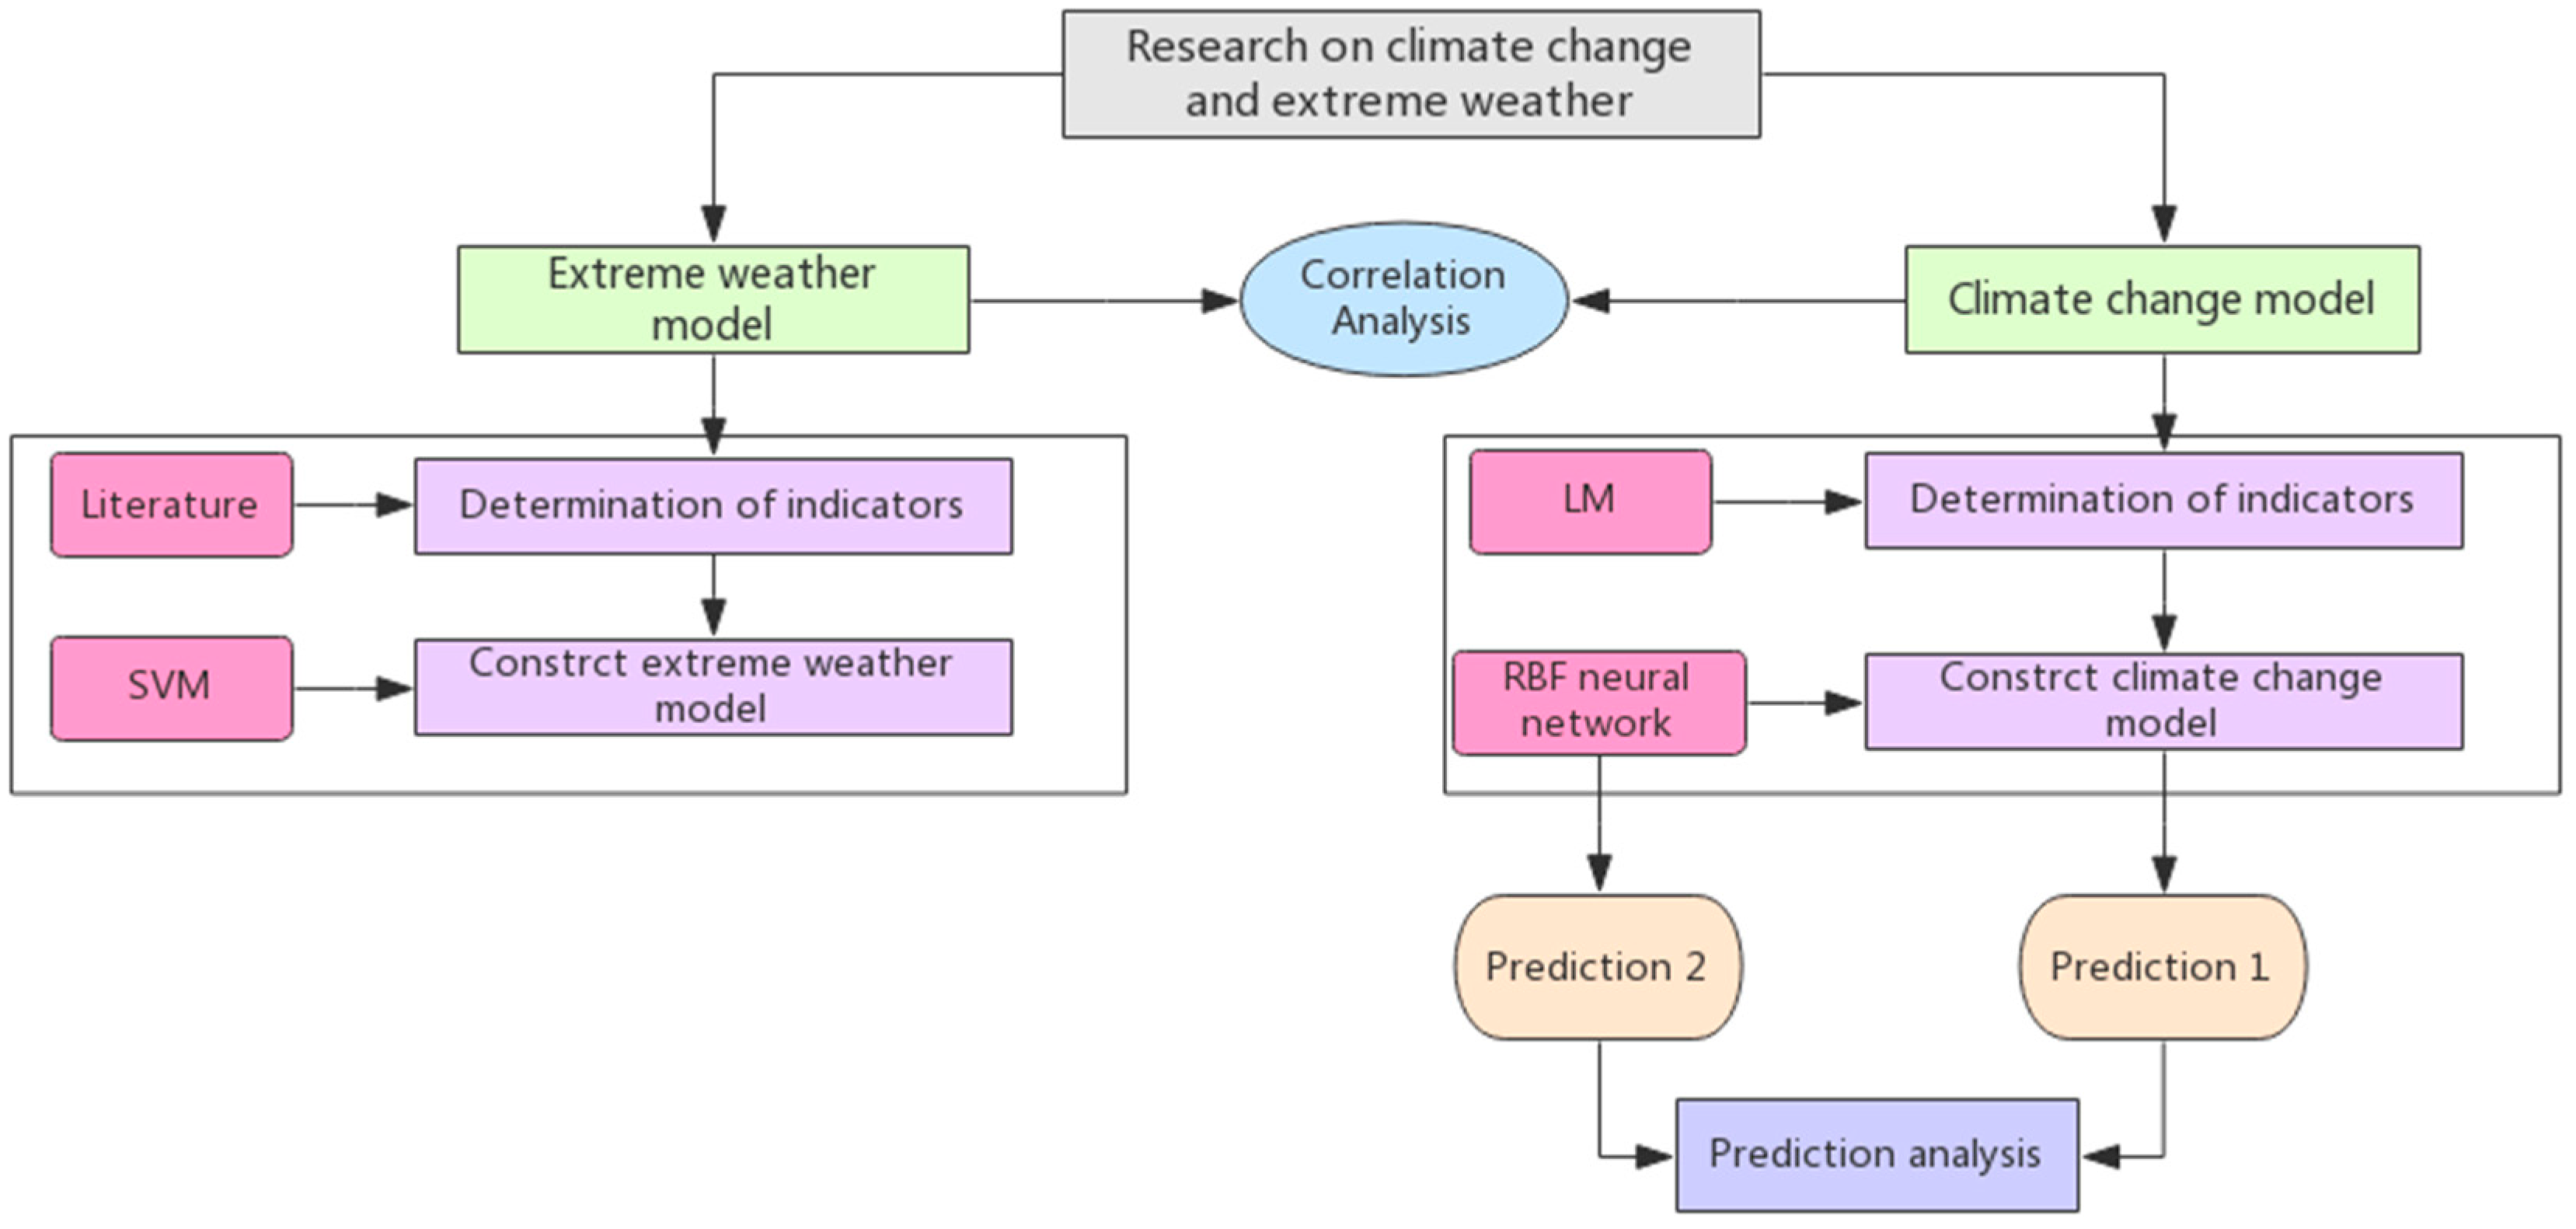
2. Materials and Methods
2.1. Assumptions
2.2. Construct the Climate Change Model
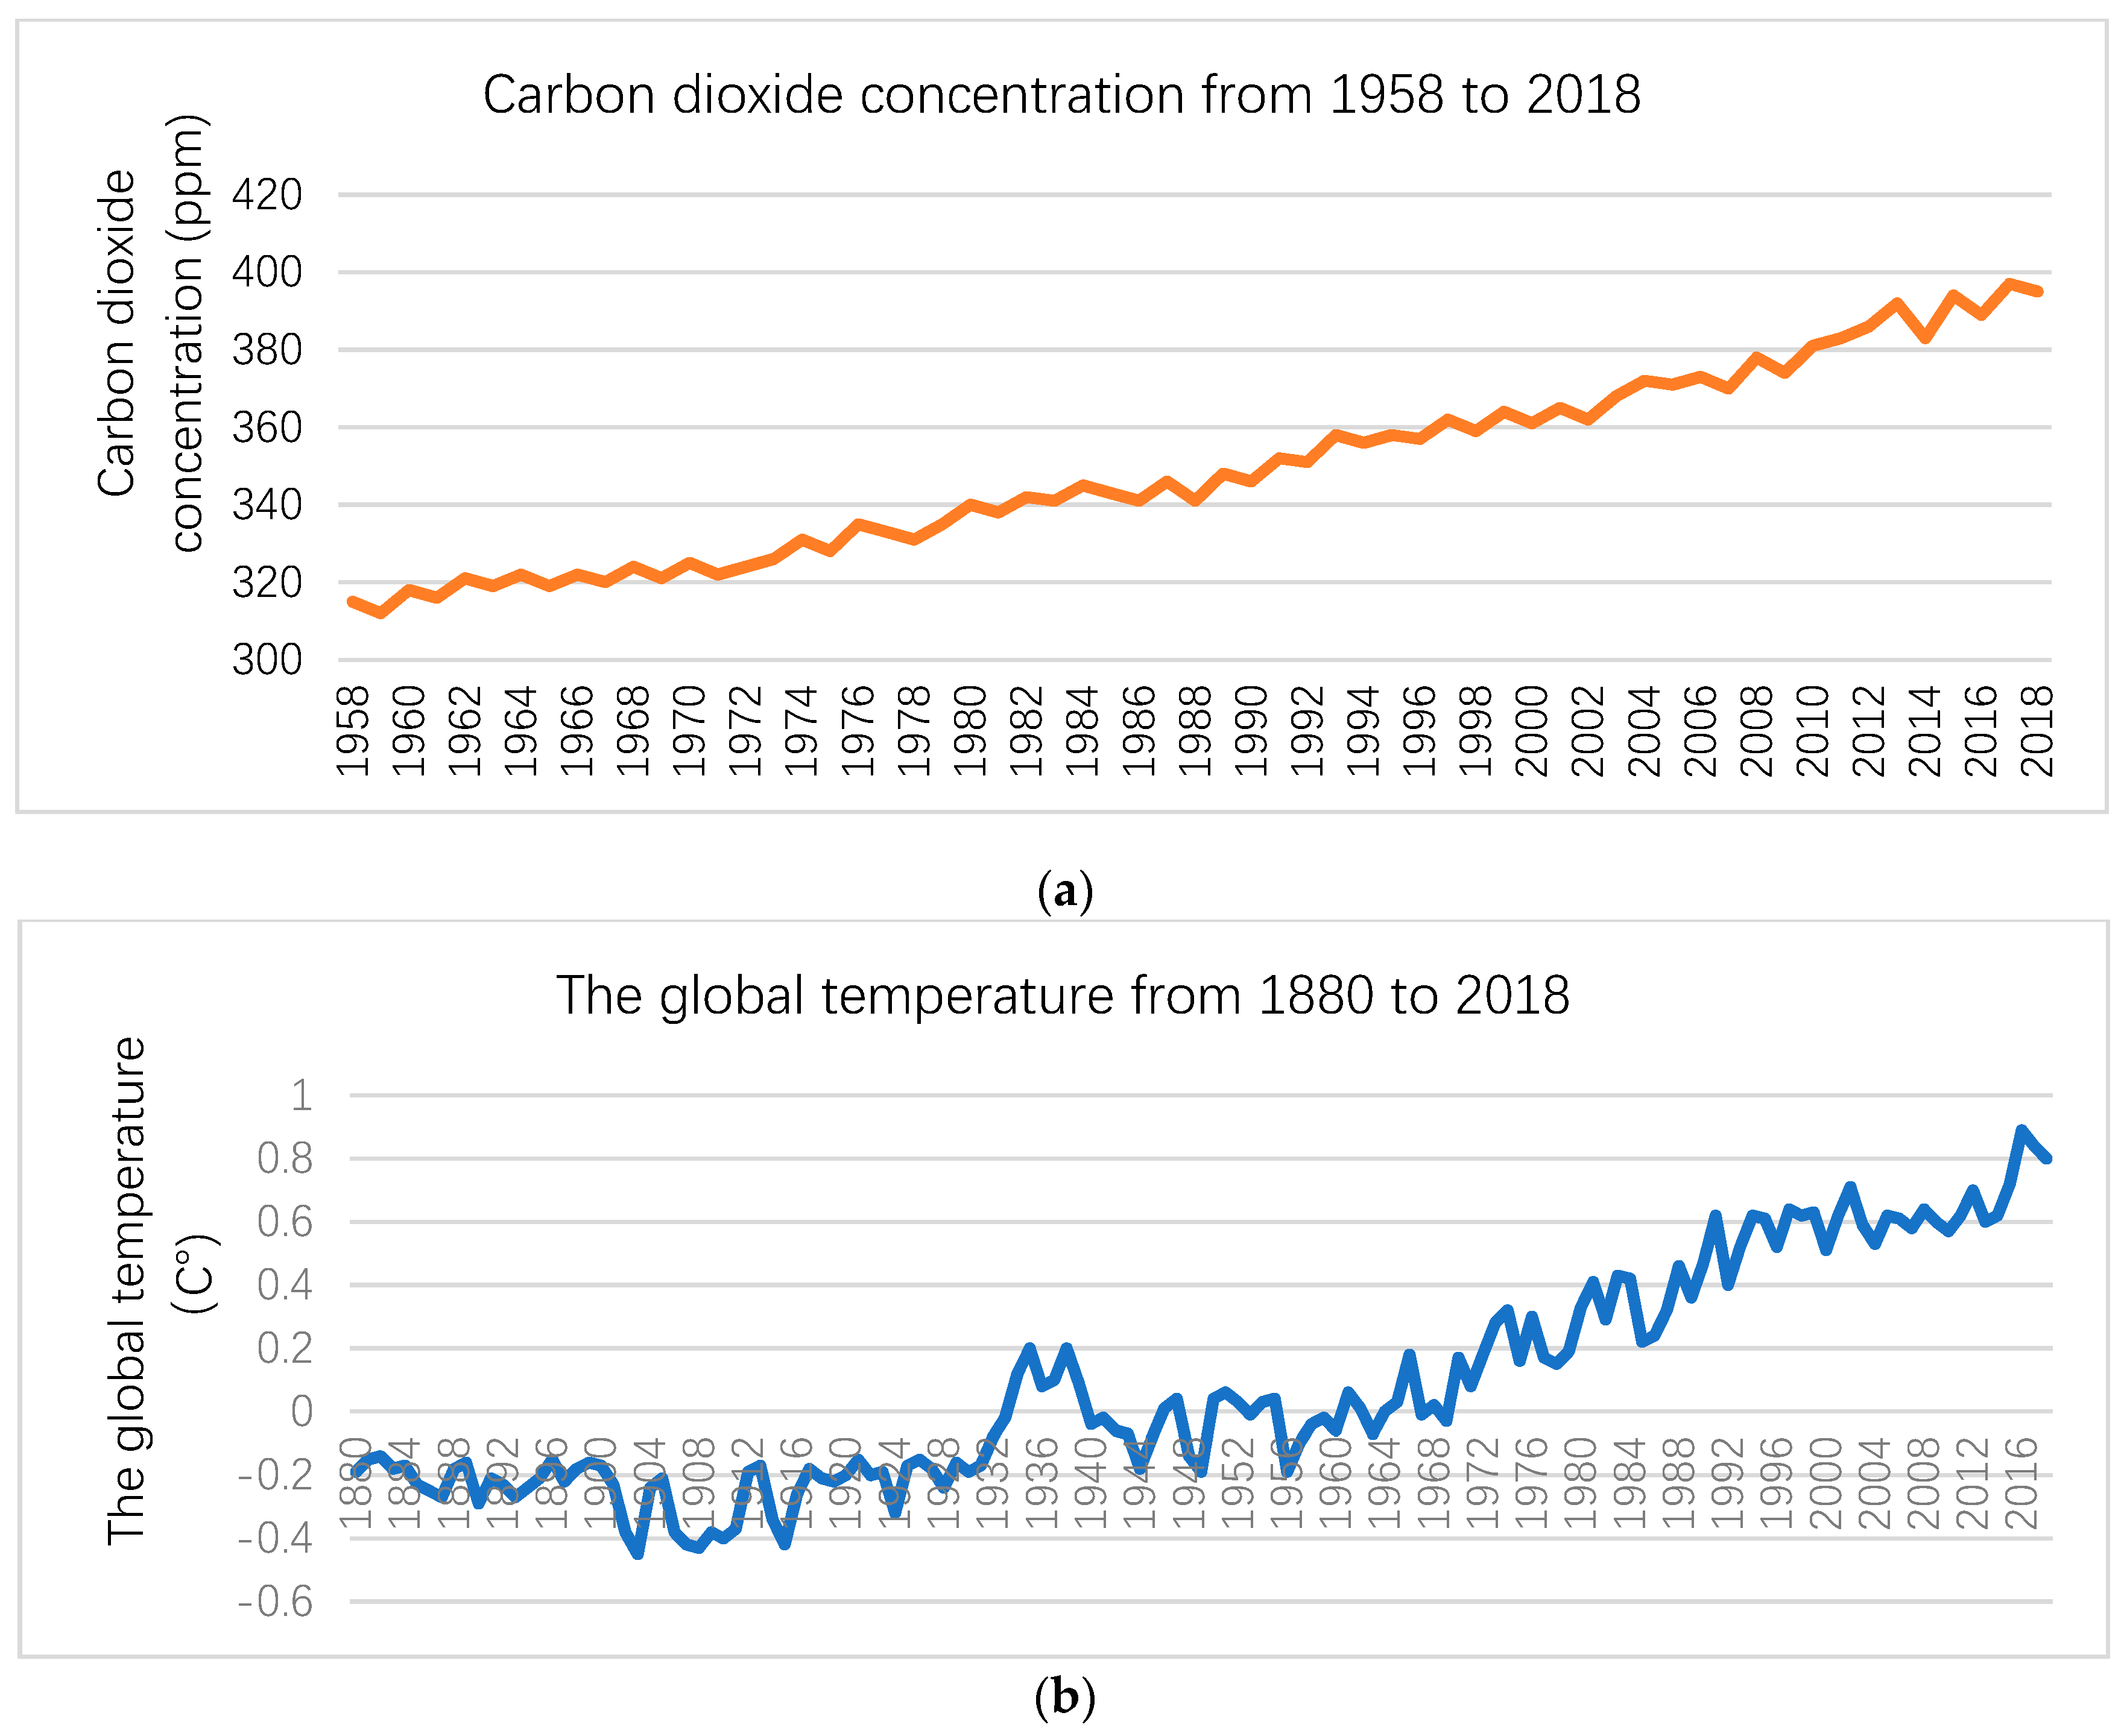
2.2.1. Determination of the Indicators
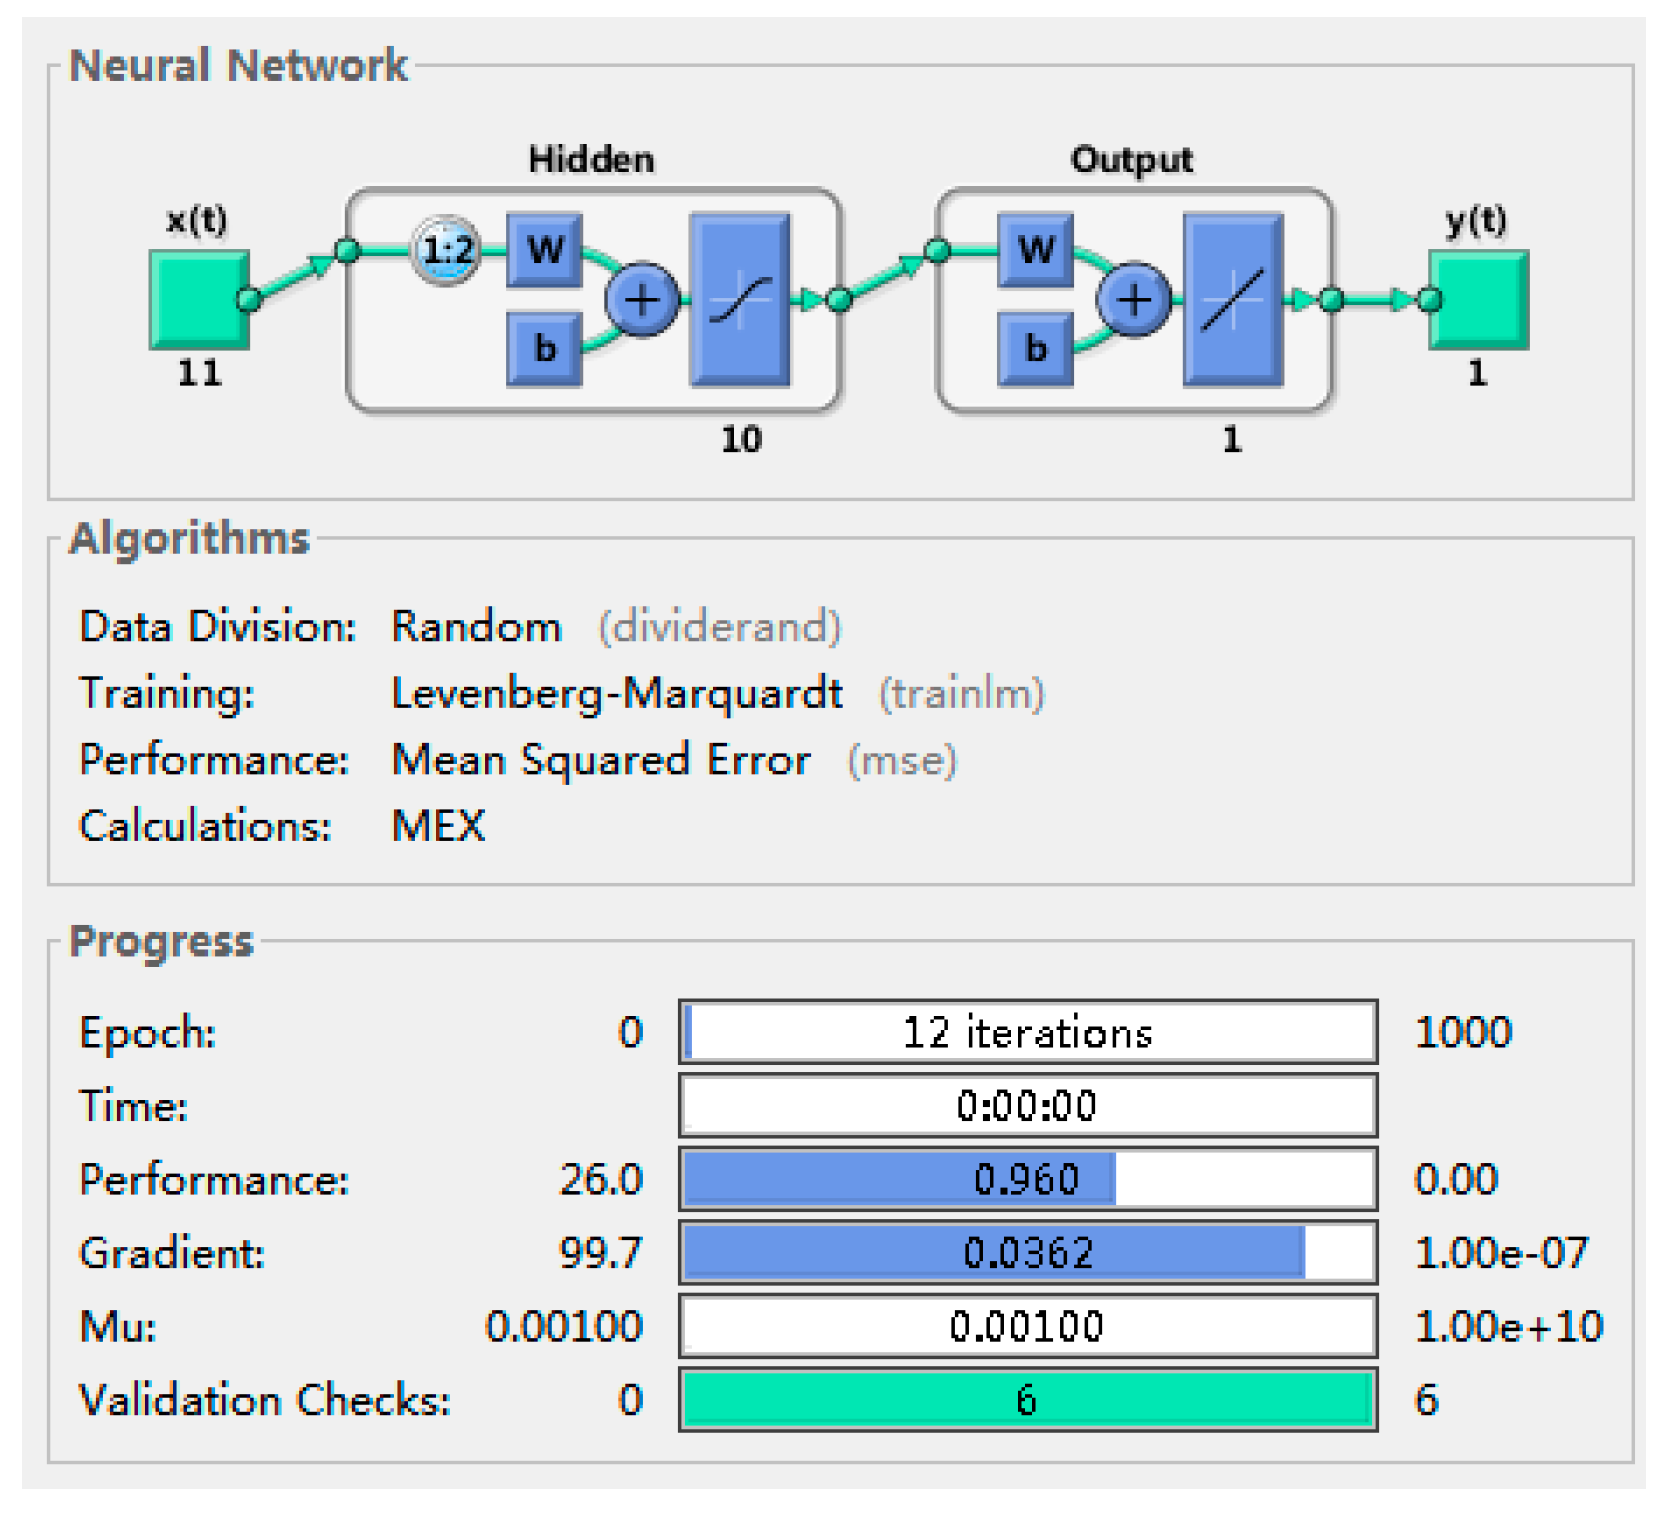
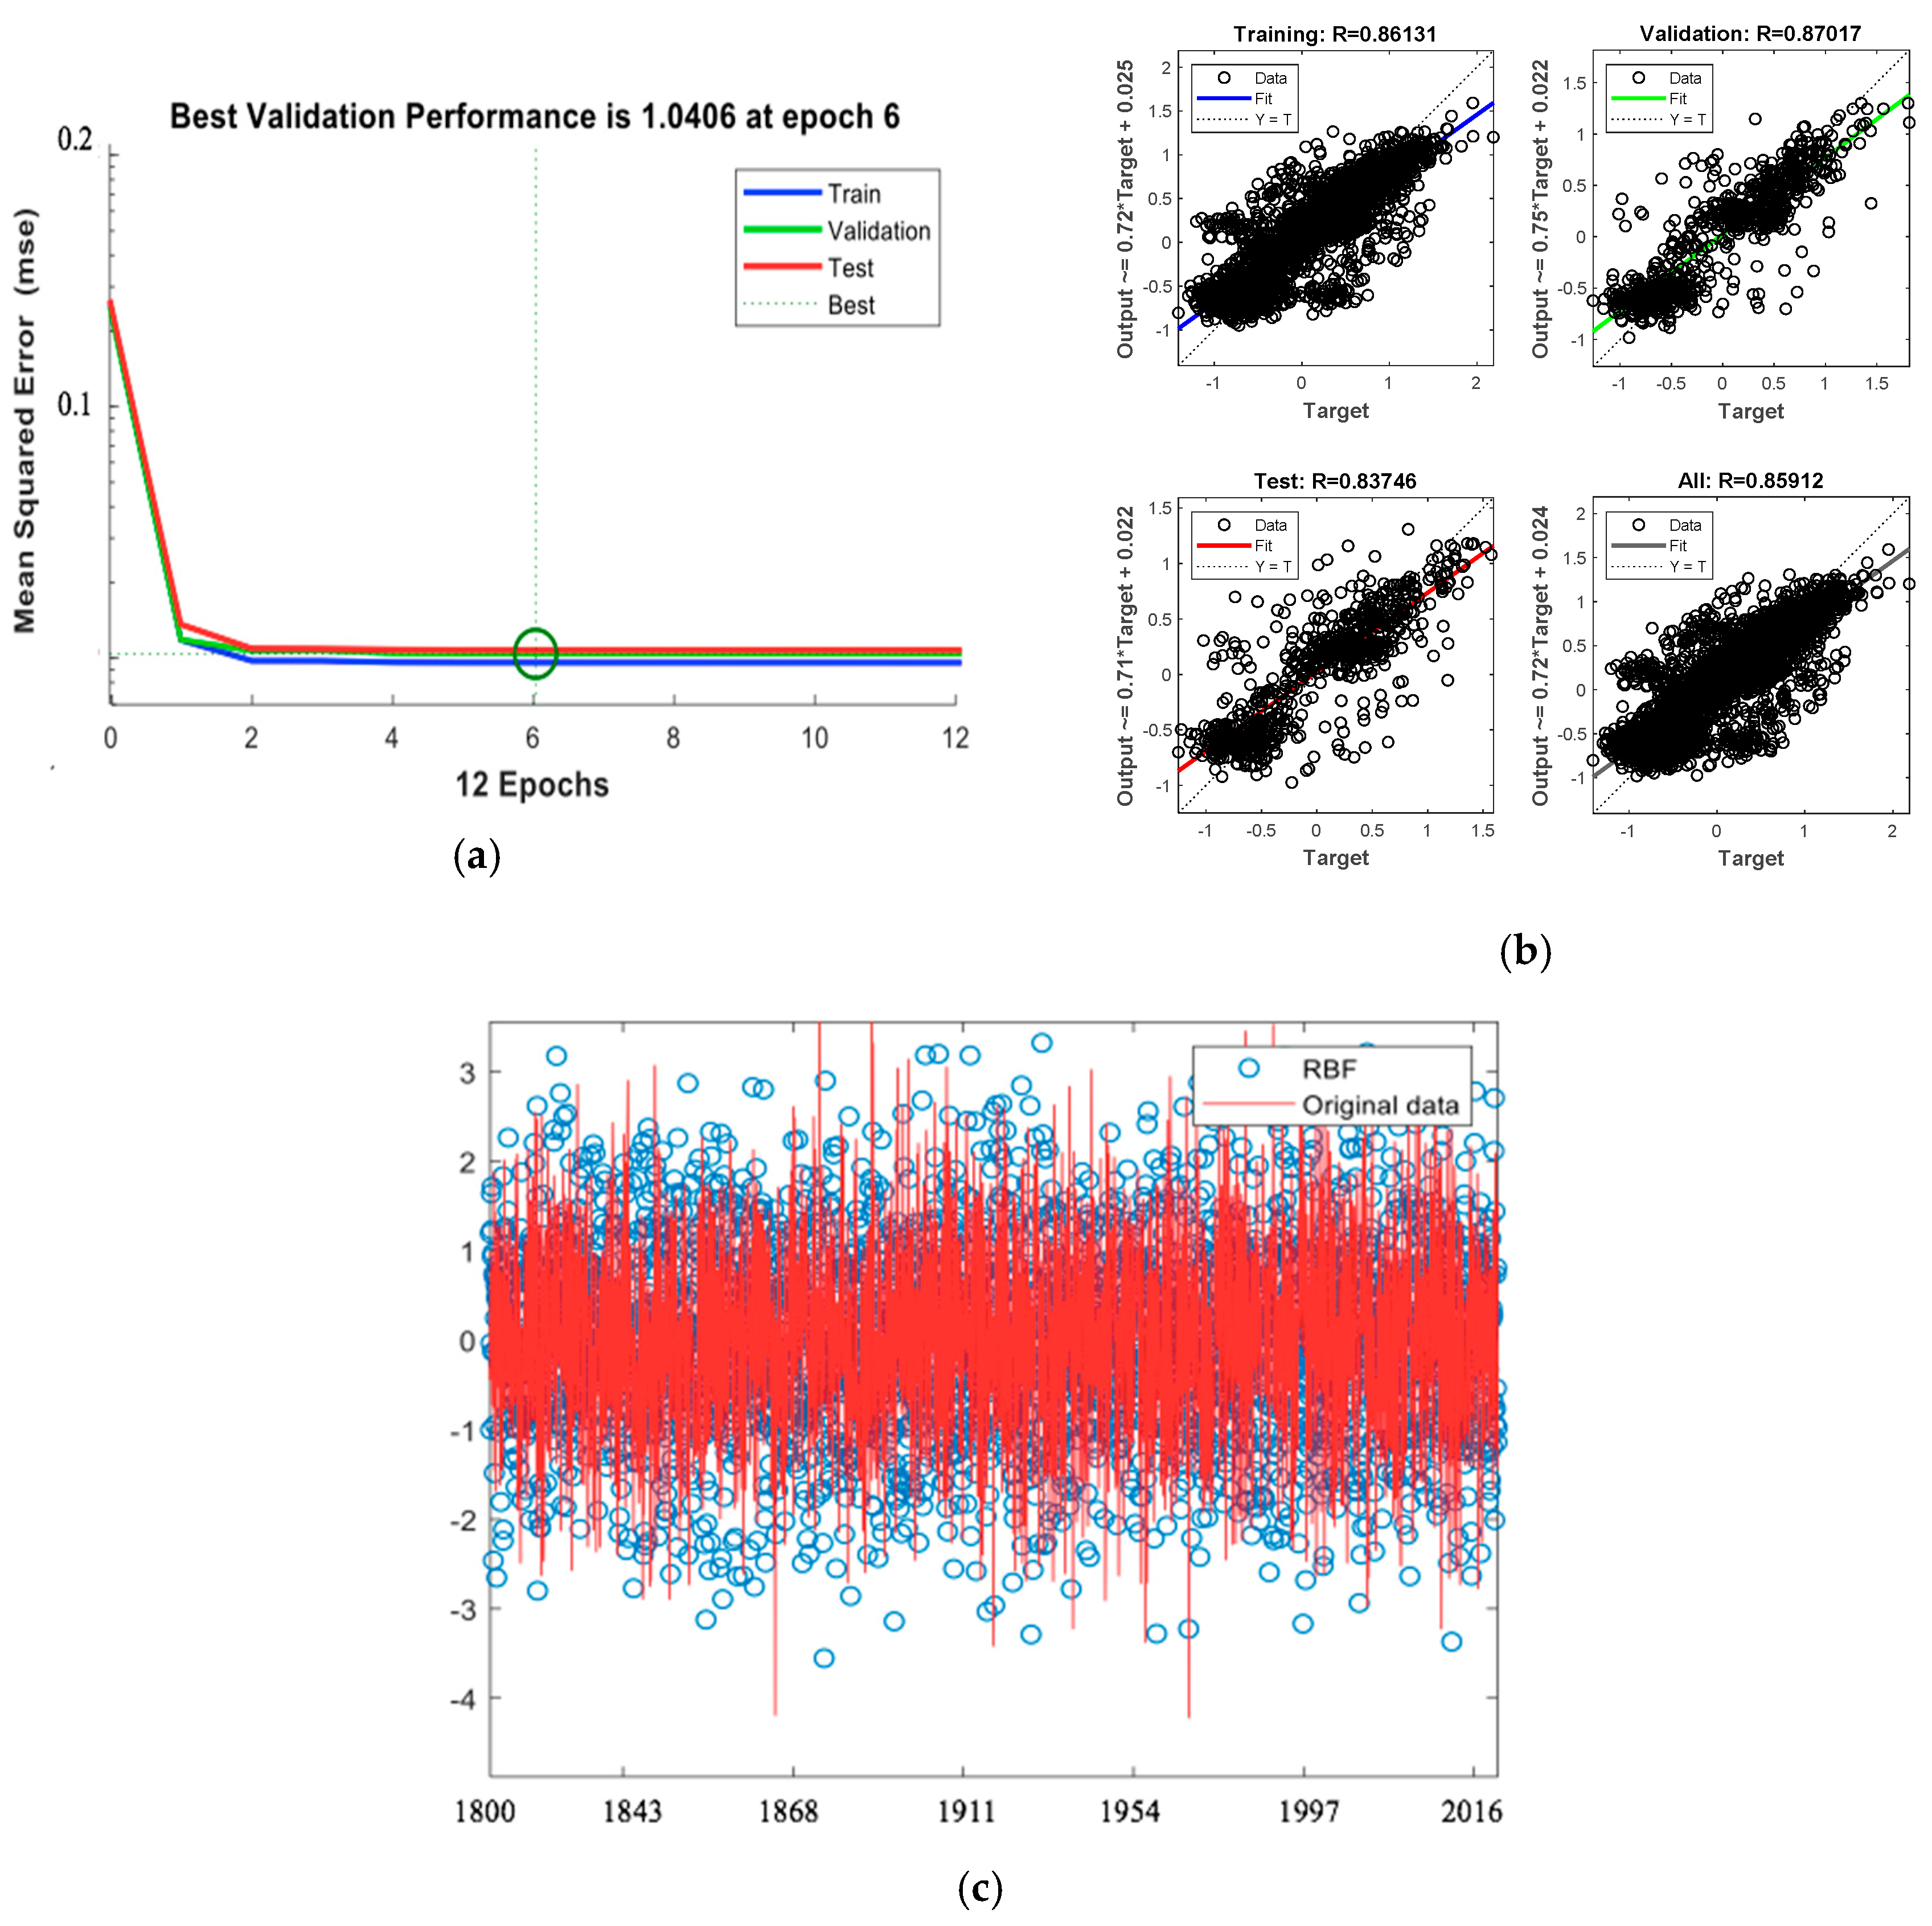
2.2.2. Climate Model Based on a Radial Basis Function Neural Network
2.3. Construct the Extreme Weather Model
2.3.1. Determination of the Indicators
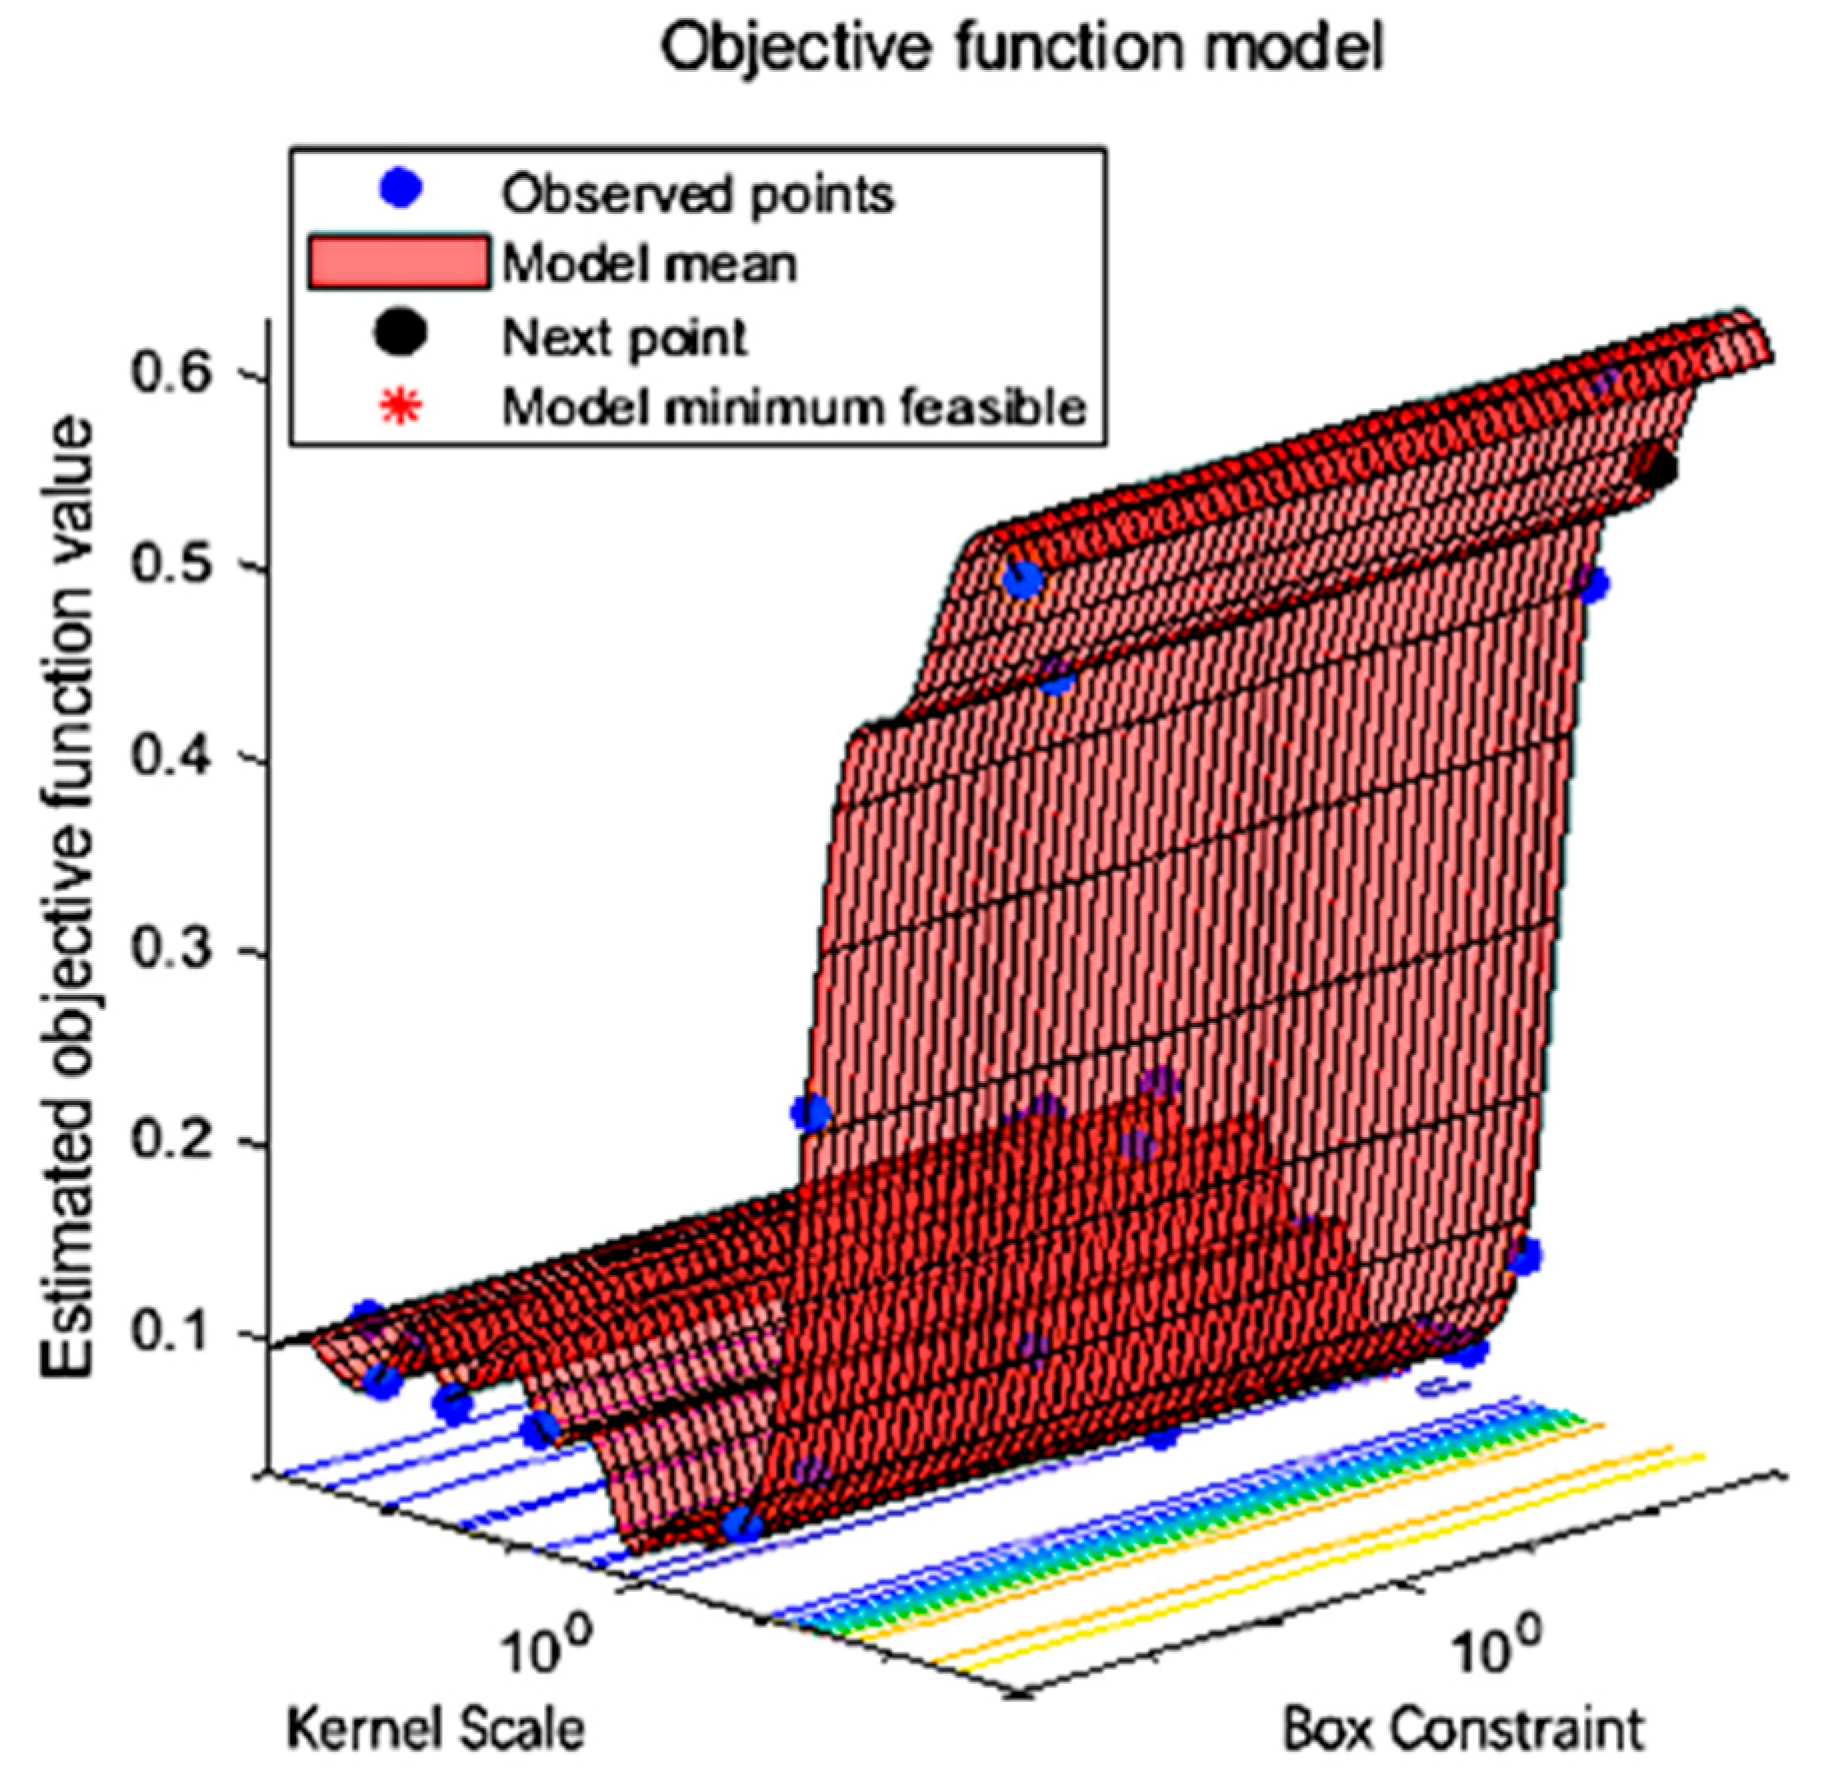
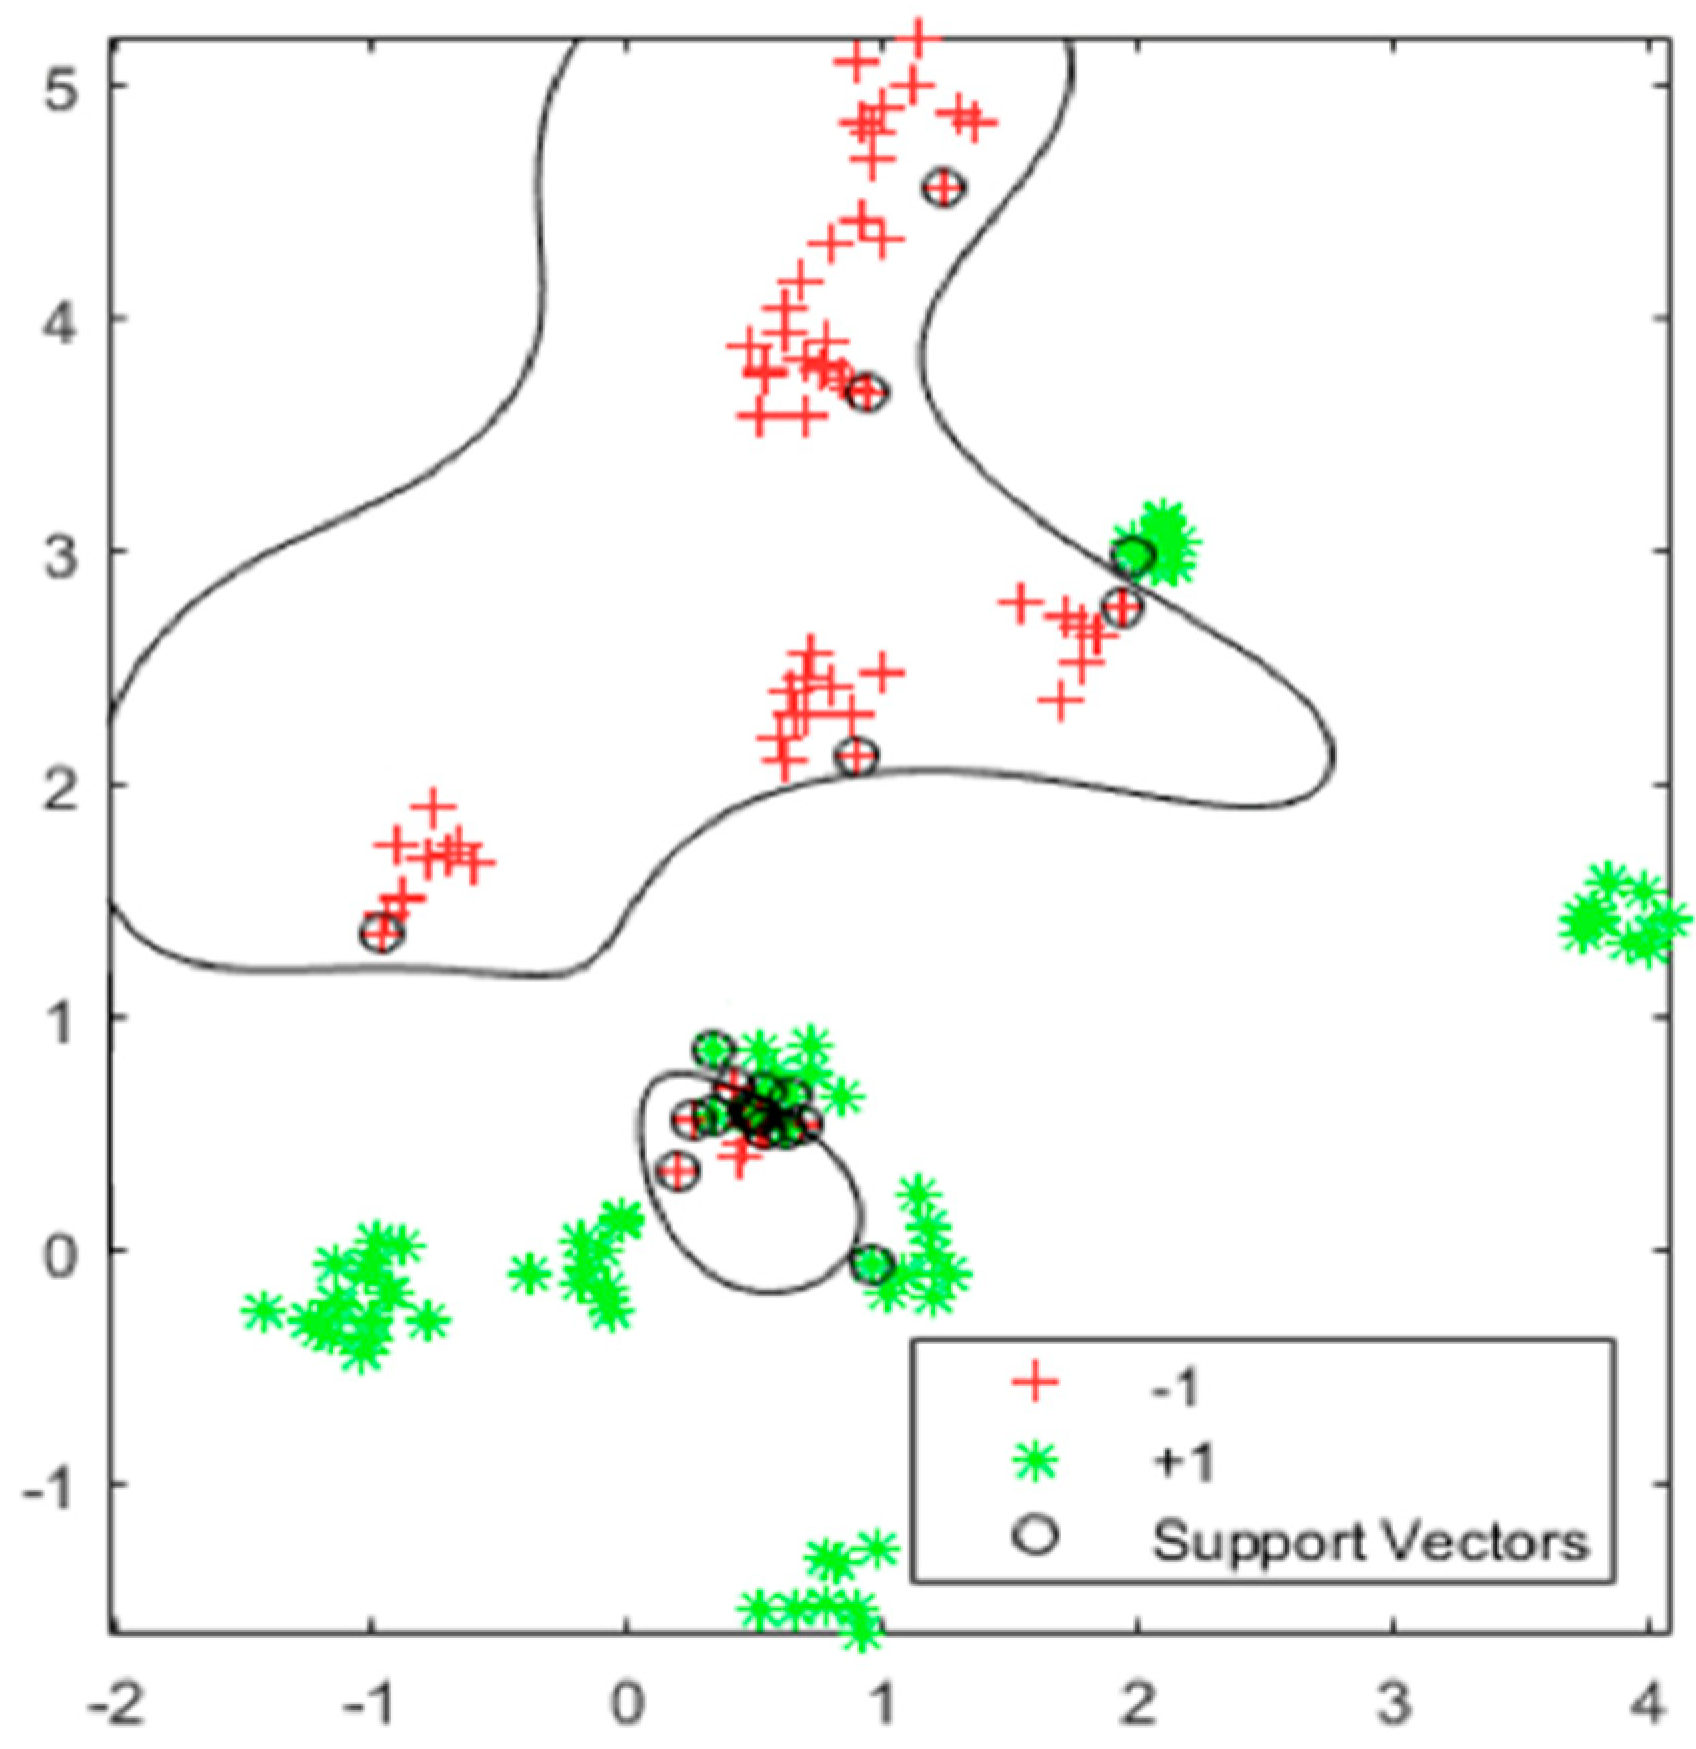
2.3.2. Extreme Weather Model Based on Support Vector Machine
3. Results and Discussion
3.1. Data
3.2. The Climate Change Model
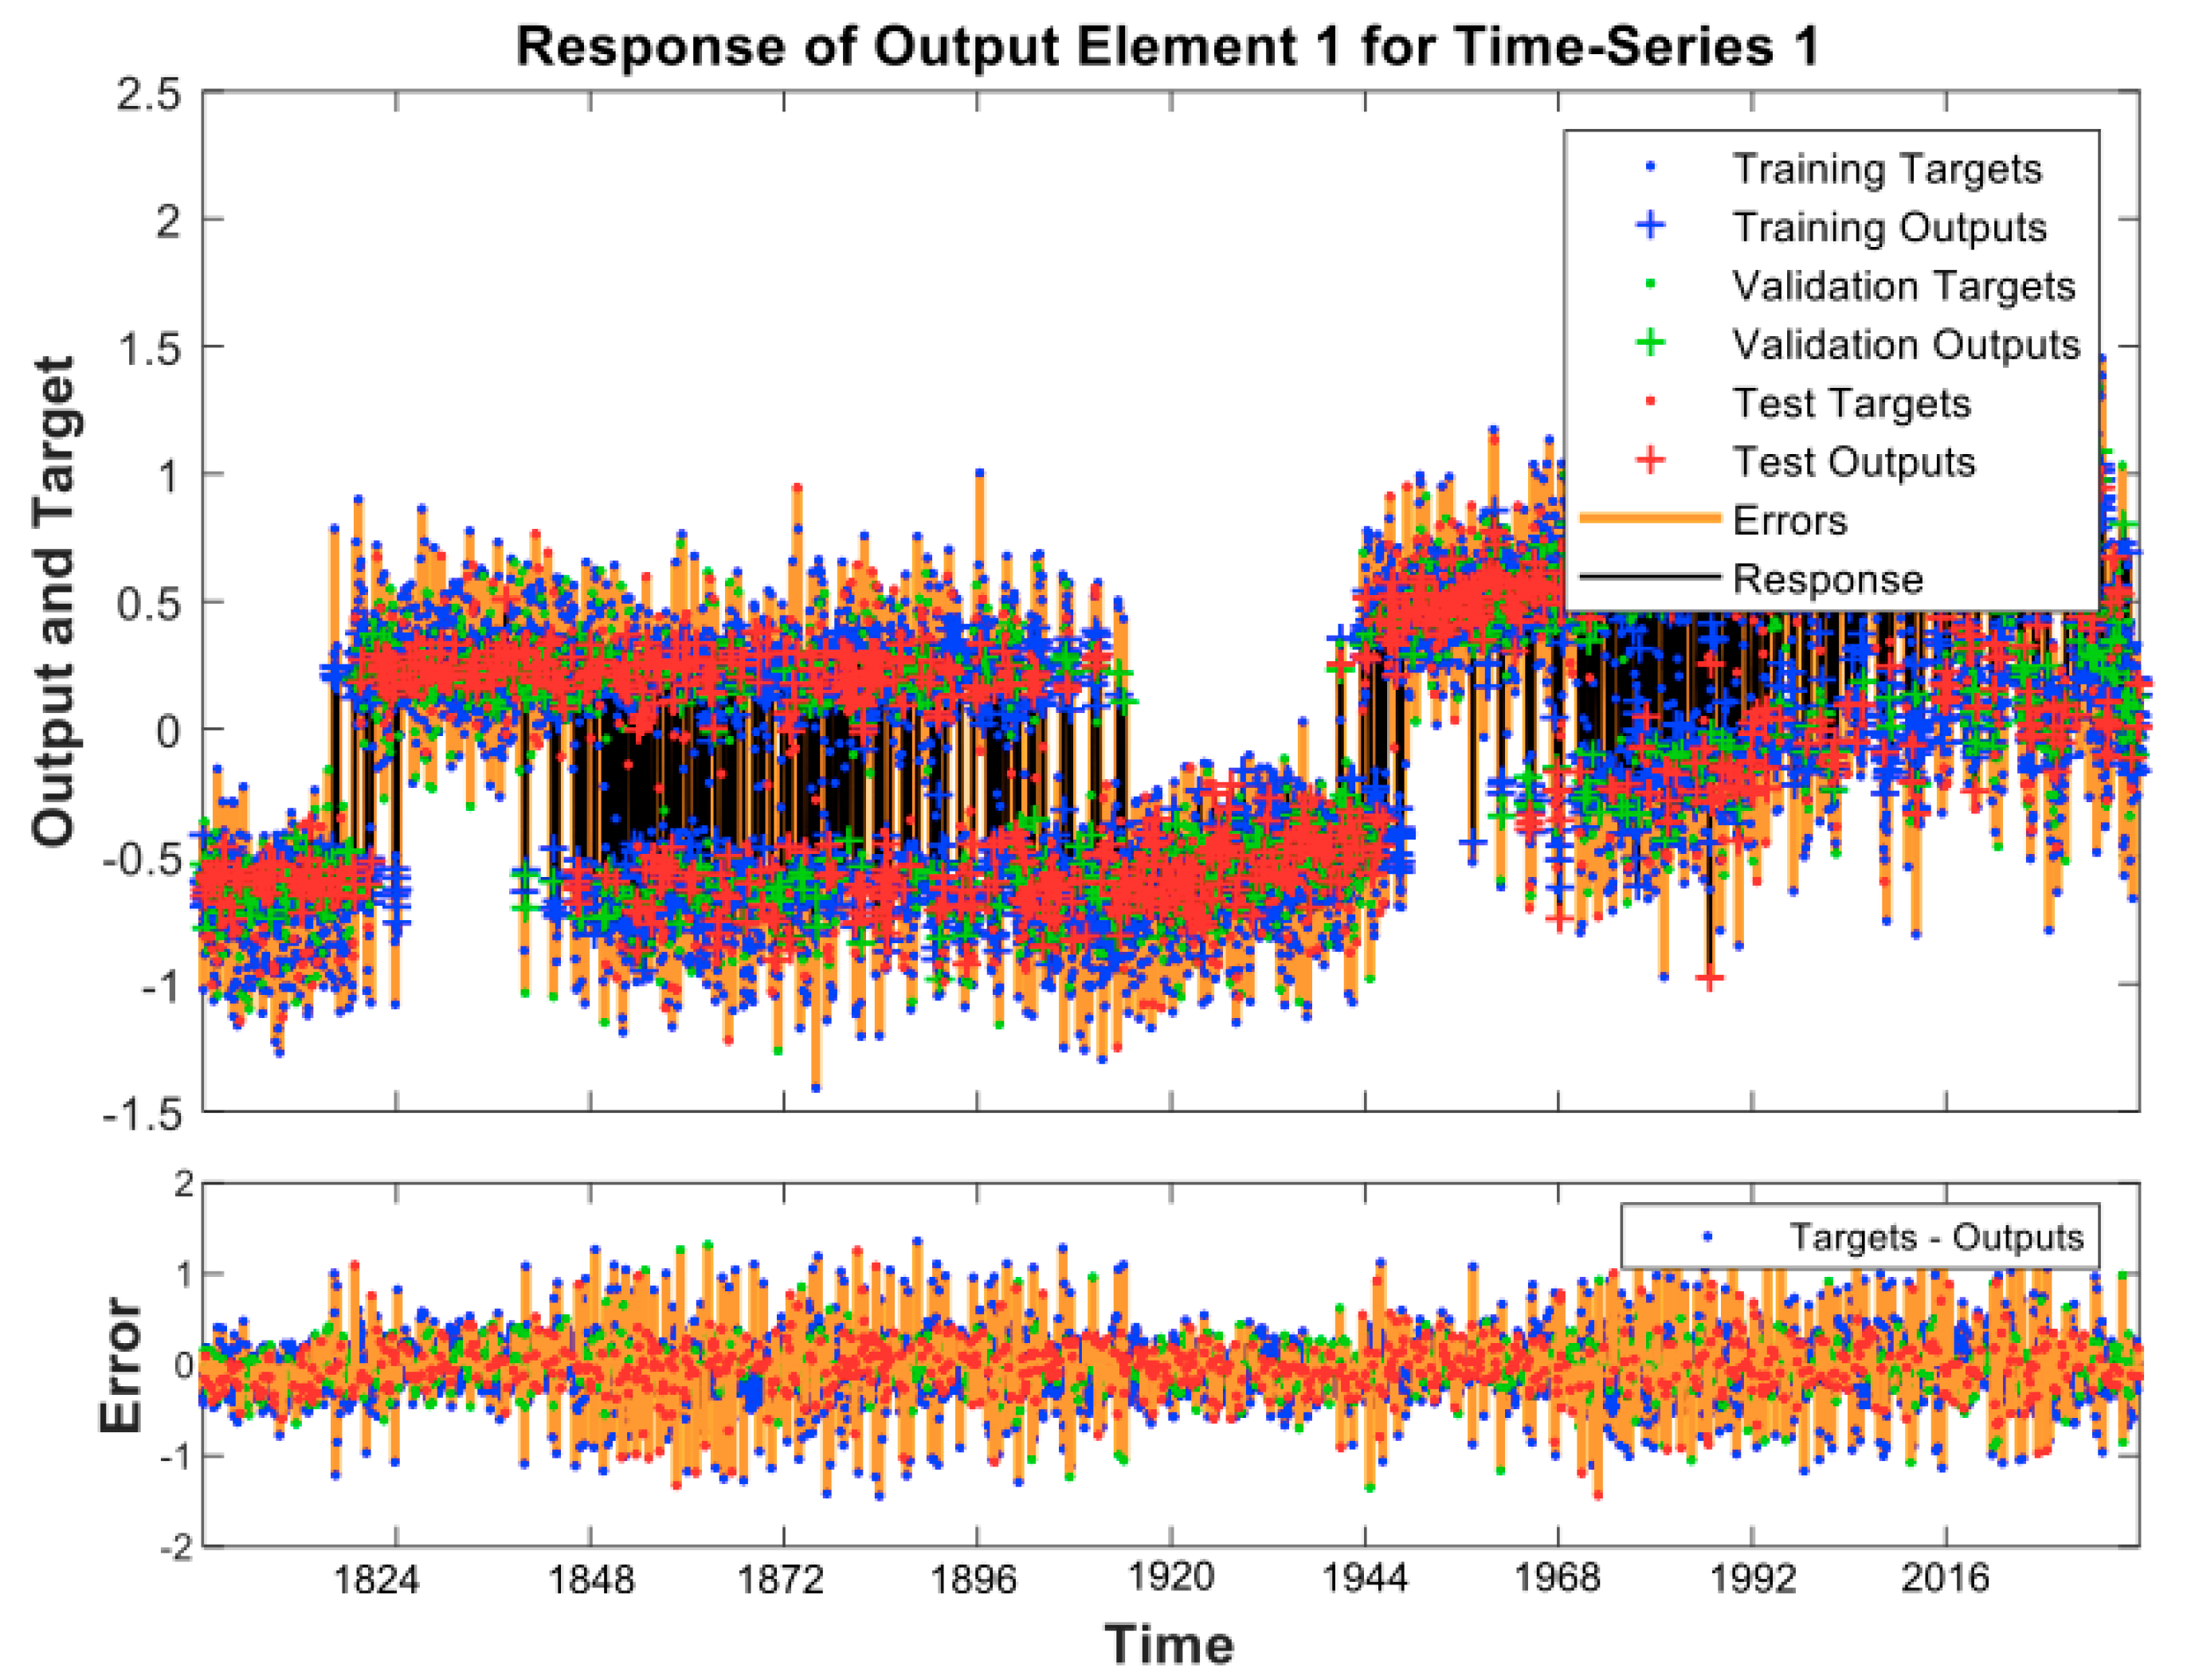
3.2.1. Determination of the Climate Change Model
3.2.2. Predictions of the CC Model
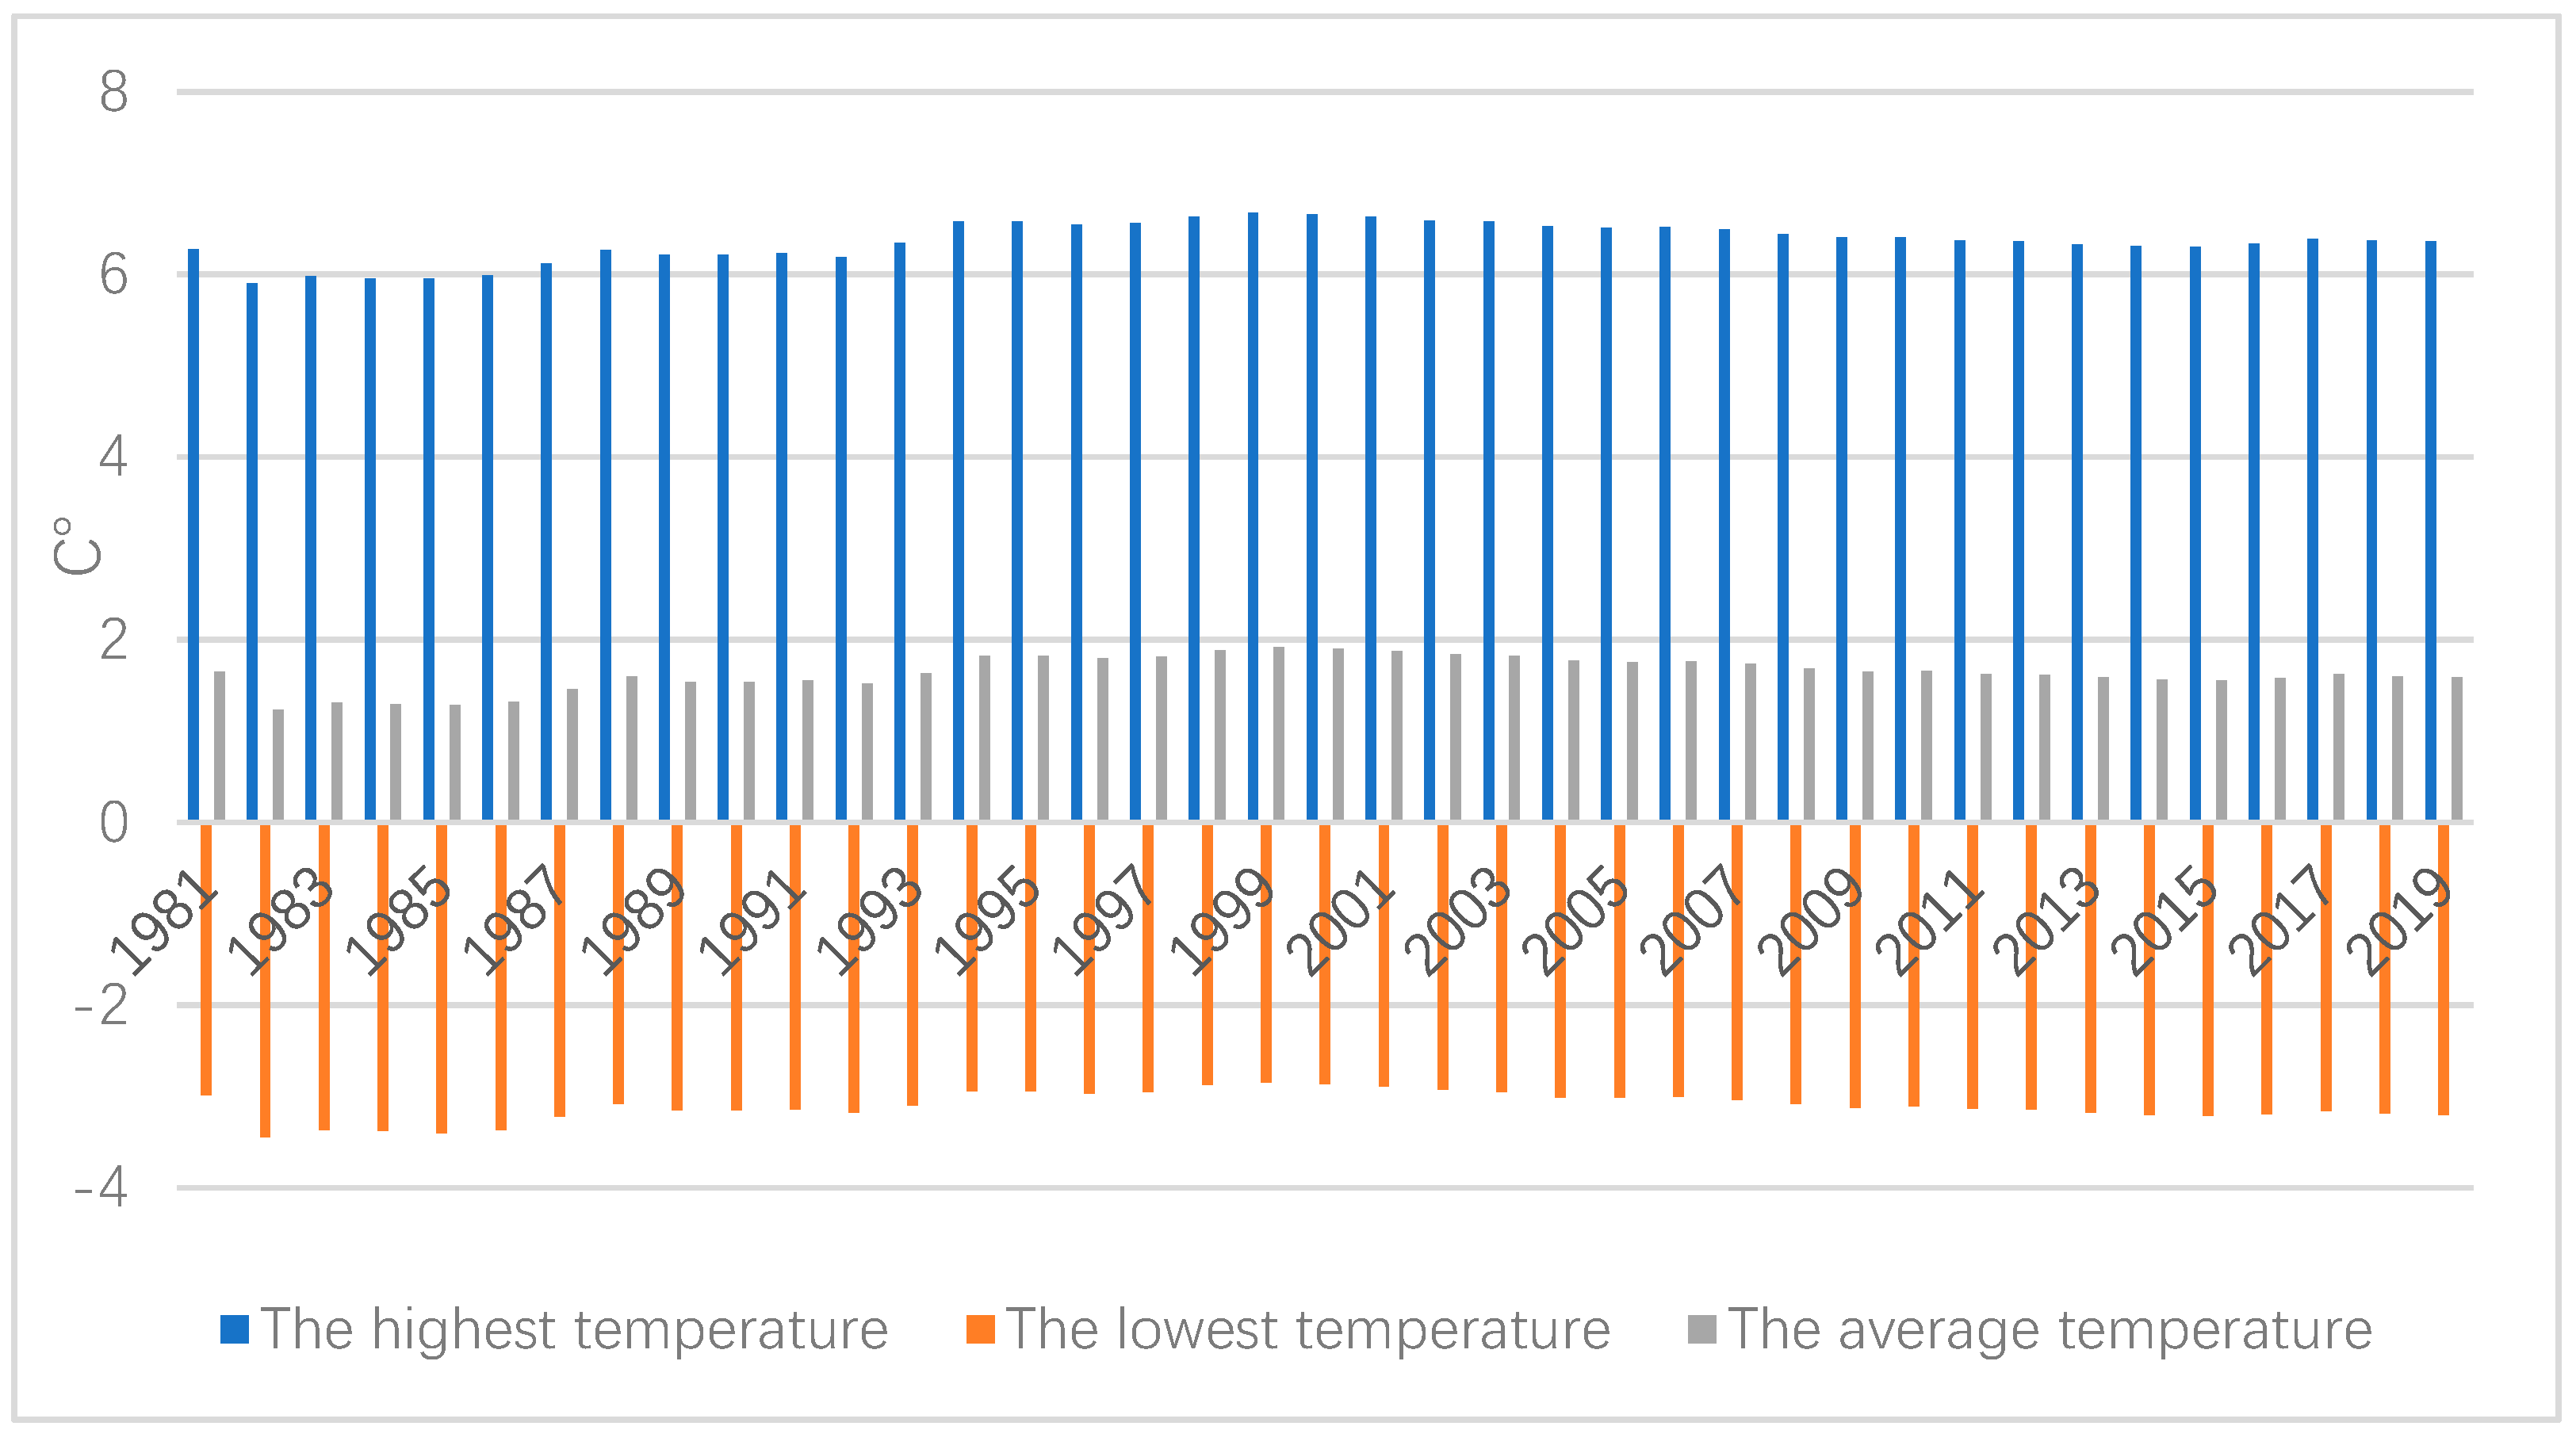
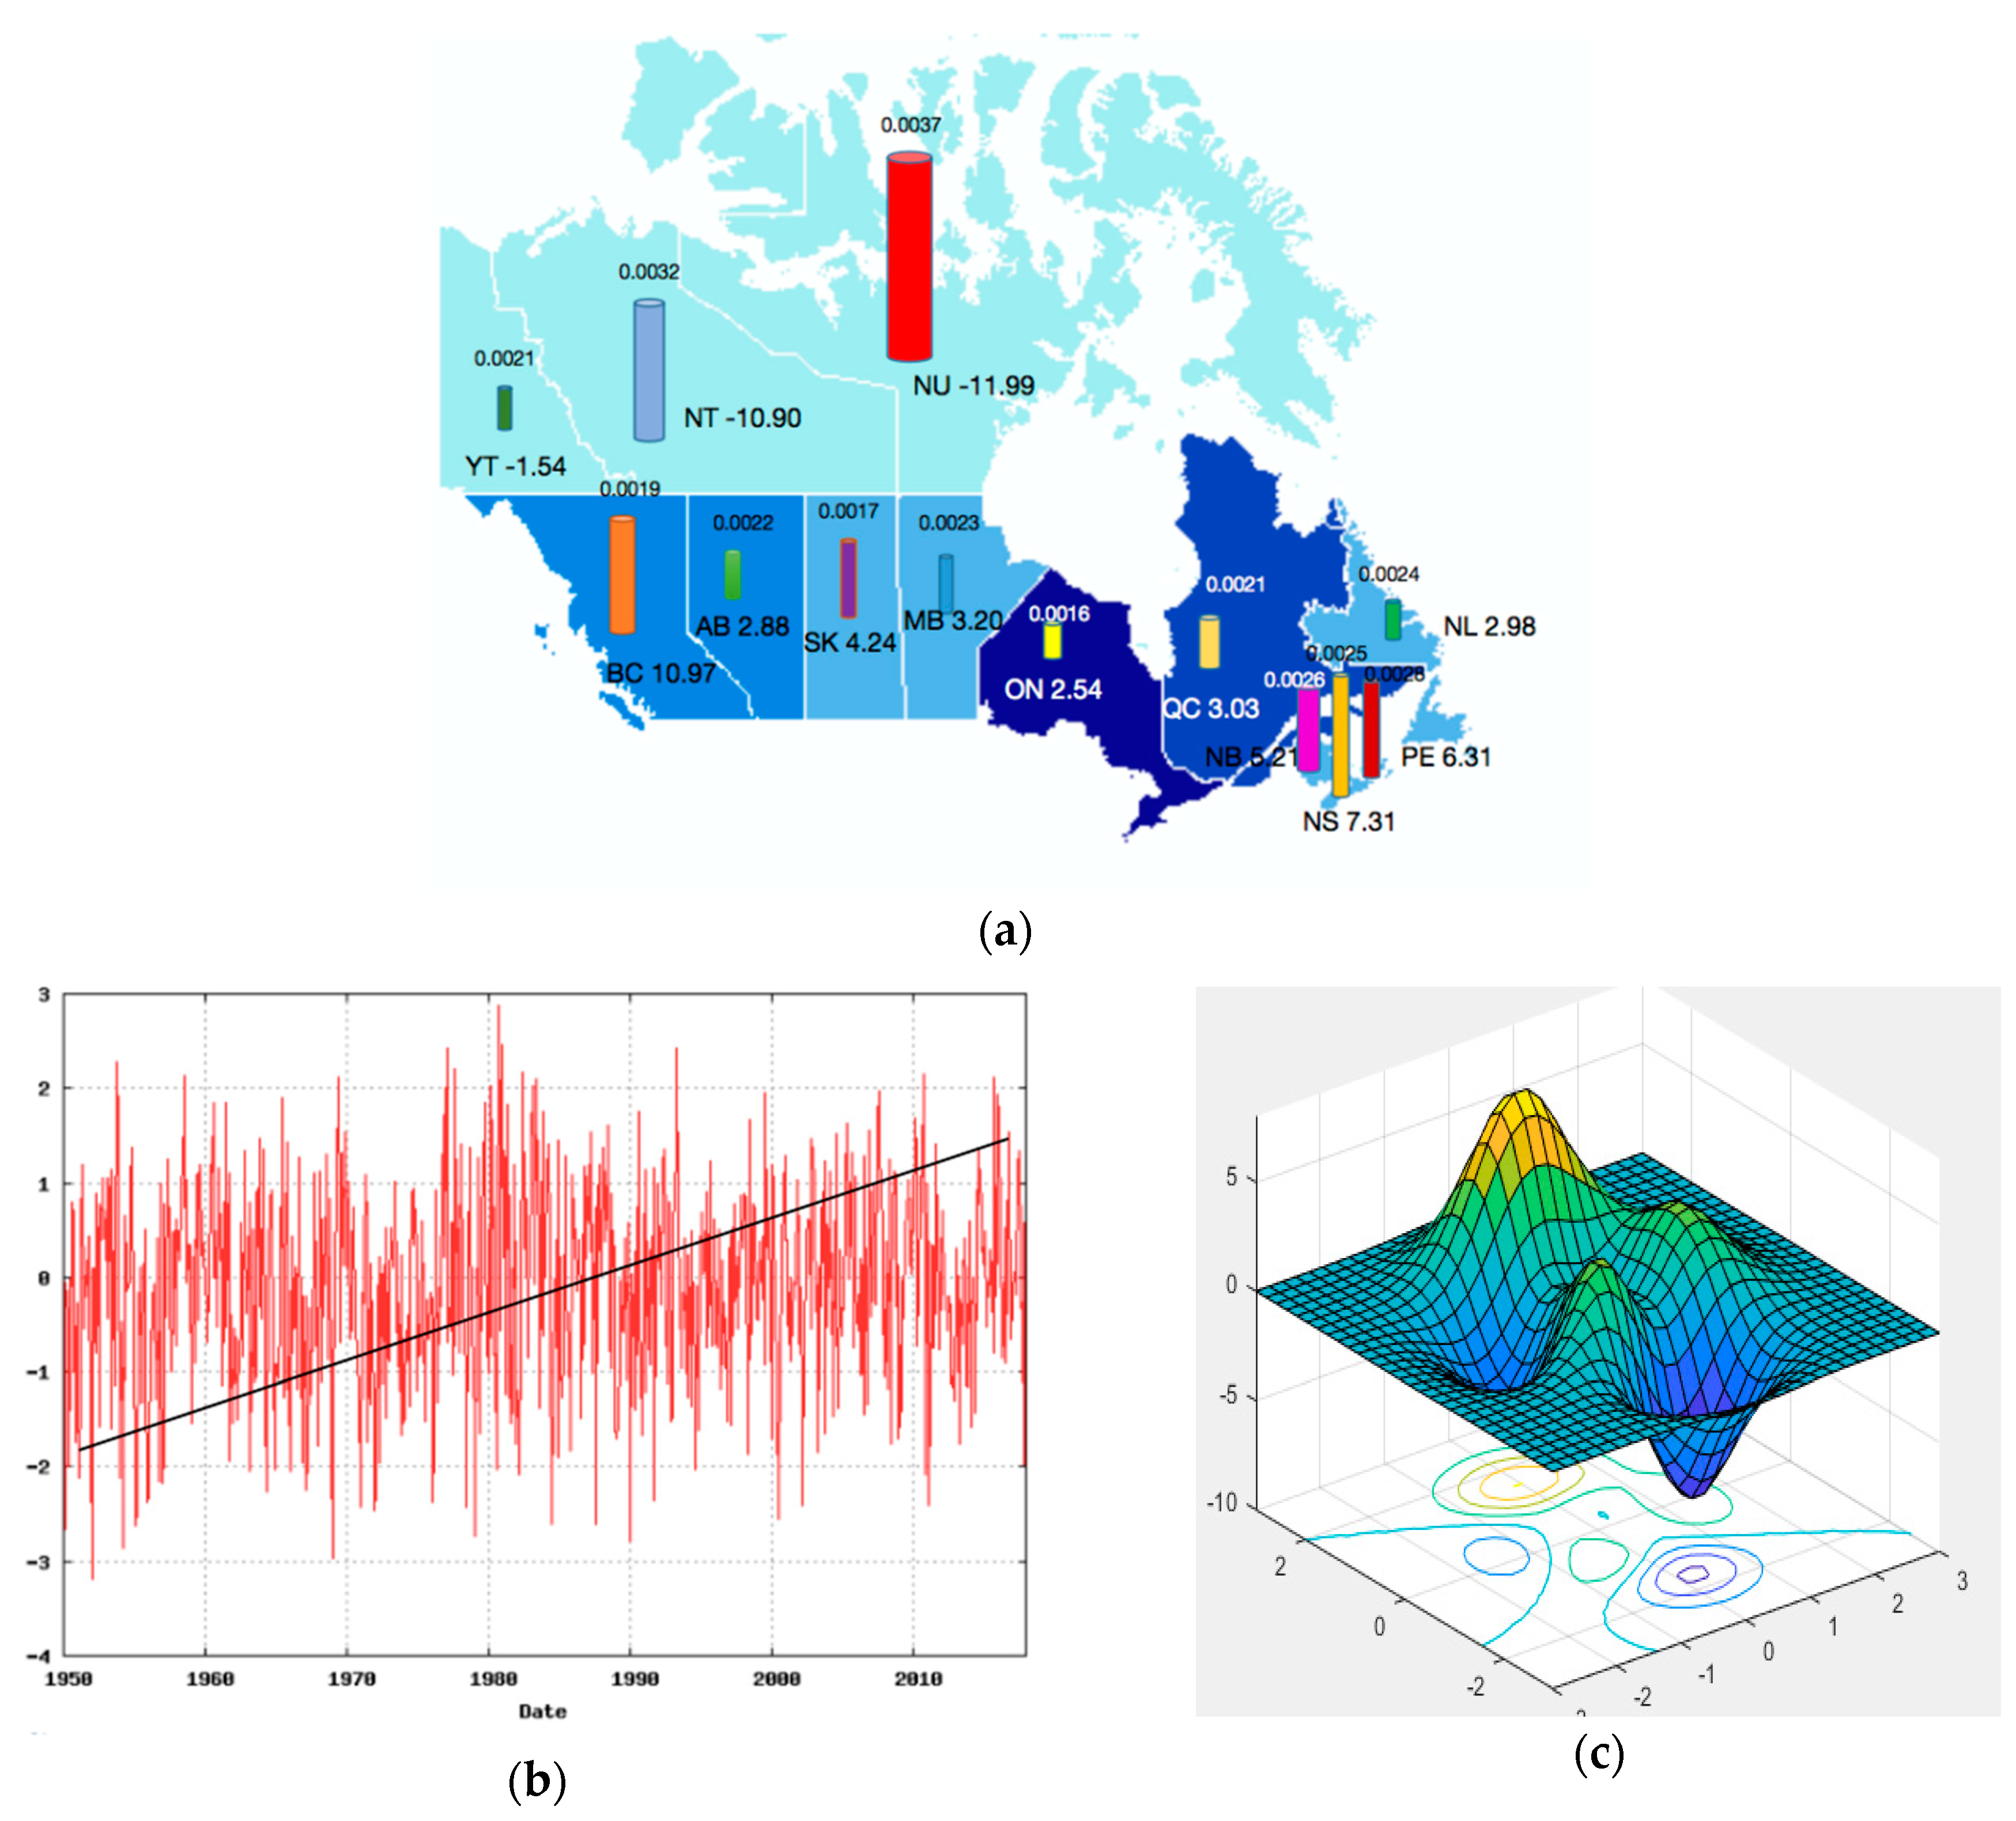
3.3. The Extreme Weather Model
3.4. Correlation Analysis
3.5. Discussion
4. Conclusions
Author Contributions
Funding
Acknowledgments
Conflicts of Interest
References
- Heymann, M. The climate change dilemma: Big science, the globalizing of climate and the loss of the human scale. Reg. Environ. Chang. 2019, 19, 1549–1560. [Google Scholar] [CrossRef]
- Hulme, M. Why We Disagree about Climate Change: Understanding Controversy, Inaction, and Opportunity. Response Prog. Hum. Geogr. 2011, 35, 136–138. [Google Scholar]
- Wang, B.; Hong, G.; Cui, C.-Q.; Yu, H.; Murty, T. Comprehensive analysis on China’s National Climate Change Assessment Reports: Action and emphasis. Front. Eng. Manag. 2019, 6, 52–61. [Google Scholar] [CrossRef]
- Mazo, J. Climate Change Impacts in the United States: The Third National Climate Assessment. Survival 2014, 56, 175–183. [Google Scholar] [CrossRef]
- Wan, H.; Zhang, X.B.; Zwiers, F. Human influence on Canadian temperatures. Clim. Dyn. 2019, 52, 479–494. [Google Scholar] [CrossRef]
- Elisa, P.; Alessandro, P.; Andrea, A.; Silvia, B.; Mathis, P.; Dominik, P.; Manuela, R.; Francesca, T.; Voglar, G.E.; Tine, G.; et al. Environmental and climate change impacts of eighteen biomass-based plants in the alpine region: A comparative analysis. J. Clean. Prod. 2020, 242, 12. [Google Scholar] [CrossRef]
- Harper, E.T. Ecological Gentrification in Response to Apocalyptic Narratives of Climate Change: The Production of an Immuno-political Fantasy. Int. J. Urban Reg. Res. 2019. [Google Scholar] [CrossRef]
- Walther, G.R.; Post, E.; Convey, P.; Menzel, A.; Parmesan, C.; Beebee, T.J.C.; Fromentin, J.M.; Hoegh-Guldberg, O.; Bairlein, F. Ecological responses to recent climate change. Nature 2002, 416, 389–395. [Google Scholar] [CrossRef]
- Lindner, M.; Maroschek, M.; Netherer, S.; Kremer, A.; Barbati, A.; Garcia-Gonzalo, J.; Seidl, R.; Delzon, S.; Corona, P.; Kolstrom, M.; et al. Climate change impacts, adaptive capacity, and vulnerability of European forest ecosystems. For. Ecol. Manag. 2010, 259, 698–709. [Google Scholar] [CrossRef]
- Jarvis, A.; Lane, A.; Hijmans, R.J. The effect of climate change on crop wild relatives. Agric. Ecosyst. Environ. 2008, 126, 13–23. [Google Scholar] [CrossRef]
- Dennis, S.; Fisher, D. Climate Change and Infectious Diseases: The Next 50 Years. Ann. Acad. Med. Singap. 2018, 47, 401–404. [Google Scholar] [PubMed]
- McVea, D.; Copes, R.; Galanis, E. Climate change and infectious disease in Canada and BC. Br. Columbia Med. J. 2018, 60, 463–464. [Google Scholar]
- Smith, E. The Effect of Potential Climate Change on Infectious Disease Presentation. JNP J. Nurse Pract. 2019, 15, 405–409. [Google Scholar] [CrossRef]
- Bryce Kennedy, P.G. Measuring Progress on Climate Change Adaptation: Lessons from the Community Well-Being Analogue. J. Integr. Disaster Risk Manag. 2015, 5, 115–134. [Google Scholar] [CrossRef]
- Dolšak, N.; Prakash, A. The Politics of Climate Change Adaptation. Annu. Rev. Environ. Resour. 2018, 43, 317–341. [Google Scholar] [CrossRef]
- Purdon, M. Advancing Comparative Climate Change Politics: Theory and Method Introduction. Glob. Environ. Politics 2015, 15, 1–26. [Google Scholar] [CrossRef]
- Palchik, N.A.; Moroz, T.N.; Miroshnichenko, L.V.; Artamonov, V.P. Crystal Chemistry of Carbonates and Clay Minerals from Bottom Sediments of Okhotskoe Sea as an Indicator of Climate Change. In Proceedings of the 9th Geoscience Conference for Young Scientists, Ekaterinburg, Russia, 5–8 February 2018; pp. 161–168. [Google Scholar]
- Lee, J.S.; Choi, H.I. Comparative Analysis of Flood Vulnerability Indicators by Aggregation Frameworks for the IPCC’s Assessment Components to Climate Change. Appl. Sci. 2019, 9, 2321. [Google Scholar] [CrossRef]
- Sundaralingam, P. The Science of Climate Change. World Lit. Today 2019, 93, 74. [Google Scholar] [CrossRef]
- Hu, R.J.; Ratner, K.; Ratner, E.; Miche, Y.; Bjork, K.M.; Lendasse, A. ELM-SOM plus: A continuous mapping for visualization. Neurocomputing 2019, 365, 147–156. [Google Scholar] [CrossRef]
- Bagheri, V.; Uromeihy, A.; Aghda, S.M.F. A Comparison Among ANFIS, MLP, and RBF Models for Hazard Analysis of Rockfalls Triggered by the 2004 Firooz Abad-Kojour, Iran, Earthquake. Geotech. Geol. Eng. 2019, 37, 3085–3111. [Google Scholar] [CrossRef]
- Kaas, E.; Frich, P. Diurnal temperature-range and cloud cover in the nordic countries-observed trends and estimates for the future. Atmos. Res. 1995, 37, 211–228. [Google Scholar] [CrossRef]
- Cortes, C.; Vapnik, V. Support-vector networks. Mach. Learn. 1995, 20, 273–297. [Google Scholar] [CrossRef]
- Nagashzadeghan, M.; Shirzadi, M. Building Energy Optimization Using Sequential Search Approach for Different Climates in Iran. Int. J. Renew. Energy Res. 2015, 5, 210–216. [Google Scholar]
- Zeng, S.W.; Hu, H.G.; Xu, L.H.; Li, G.H. Nonlinear Adaptive PID Control for Greenhouse Environment Based on RBF Network. Sensors 2012, 12, 5328–5348. [Google Scholar] [CrossRef]
- Boles, W.C. The Science and Politics of Climate Change in Steve Waters’ The Contingency Plan. J. Contemp. Drama Engl. 2019, 7, 107–122. [Google Scholar] [CrossRef]
- Bui, H.X.; Maloney, E.D. Mechanisms for Global Warming Impacts on Madden-Julian Oscillation Precipitation Amplitude. J. Clim. 2019, 32, 6961–6975. [Google Scholar] [CrossRef]
- Kim, G.Y.; Lee, S. Prediction of extreme wind by stochastic typhoon model considering climate change. J. Wind Eng. Ind. Aerodyn. 2019, 192, 17–30. [Google Scholar] [CrossRef]
- Hawkins, L.R.; Rupp, D.E.; McNeall, D.J.; Li, S.H.; Betts, R.A.; Mote, P.W.; Sparrow, S.N.; Wallom, D.C.H. Parametric Sensitivity of Vegetation Dynamics in the Triffid Model and the Associated Uncertainty in Projected Climate Change Impacts on Western US Forests. J. Adv. Model. Earth Syst. 2019, 11, 2787–2813. [Google Scholar] [CrossRef]
- Hanittinan, P.; Tachikawa, Y.; Ram-Indra, T. Projection of hydroclimate extreme indices over the Indochina region under climate change using a large single-model ensemble. Int. J. Climatol. 2019. [Google Scholar] [CrossRef]
- Sakalli, A. Sea surface temperature change in the mediterranean sea under climate change: A linear model for simulation of the sea surface temperature up to 2100. Appl. Ecol. Environ. Res. 2017, 15, 707–716. [Google Scholar] [CrossRef]
- Colucci, R.R.; Guglielmin, M. Climate change and rapid ice melt: Suggestions from abrupt permafrost degradation and ice melting in an alpine ice cave. Prog. Phys. Geogr. 2019, 43, 561–573. [Google Scholar] [CrossRef]
- Kobler, U.G.; Schmid, M. Ensemble modelling of ice cover for a reservoir affected by pumped-storage operation and climate change. Hydrol. Process. 2019, 33, 2676–2690. [Google Scholar] [CrossRef]
- Carton, J.A.; Ding, Y.N.; Arrigo, K.R. The seasonal cycle of the Arctic Ocean under climate change. Geophys. Res. Lett. 2015, 42, 7681–7686. [Google Scholar] [CrossRef]
- Kumar, K.R.; Attada, R.; Dasari, H.P.; Vellore, R.K.; Abualnaja, Y.O.; Ashok, K.; Hoteit, I. On the Recent Amplification of Dust Over the Arabian Peninsula During 2002–2012. J. Geophys. Res. Atmos. 2019, 1124, 13220–13229. [Google Scholar] [CrossRef]
- Akinyoola, J.A.; Ajayi, V.O.; Abiodun, B.J.; Ogunjobi, K.O.; Gbode, I.E.; Ogungbenro, S.B. Dynamic response of monsoon precipitation to mineral dust radiative forcing in the West Africa region. Model. Earth Syst. Environ. 2019, 5, 1201–1214. [Google Scholar] [CrossRef]
- Burdejova, L.; Tobolkova, B.; Polovka, M. Effects of Different Factors on Concentration of Functional Components of Aronia and Saskatoon Berries. Plant Foods Hum. Nutr. 2019. [Google Scholar] [CrossRef]
- Alexander, P.M.; Tedesco, M.; Koenig, L.; Fettweis, X. Evaluating a Regional Climate Model Simulation of Greenland Ice Sheet Snow and Firn Density for Improved Surface Mass Balance Estimates. Geophys. Res. Lett. 2019, 46, 12073–12082. [Google Scholar] [CrossRef]
- Tapiador, F.J.; Sanchez, E.; Romera, R. Exploiting an ensemble of regional climate models to provide robust estimates of projected changes in monthly temperature and precipitation probability distribution functions. Tellus Ser. A Dyn. Meteorol. Oceanol. 2009, 61, 57–71. [Google Scholar] [CrossRef]
- Dai, A.G.; Zhao, T.B.; Chen, J. Climate Change and Drought: A Precipitation and Evaporation Perspective. Curr. Clim. Chang. Rep. 2018, 4, 301–312. [Google Scholar] [CrossRef]
- Lombardo, F.T.; Ayyub, B. Approach to Estimating Near-Surface Extreme Wind Speeds with Climate Change Considerations. ASCE ASME J. Risk. Uncertain. Eng. Syst. Part A Civ. Eng. 2017, 3, 11. [Google Scholar] [CrossRef]
- Saha, U.; Chakraborty, R.; Maitra, A.; Singh, A.K. East-west coastal asymmetry in the summertime near surface wind speed and its projected change in future climate over the Indian region. Glob. Planet. Chang. 2017, 152, 76–87. [Google Scholar] [CrossRef]
- Illy, T. Near-surface wind speed changes in the 21st century based on the results of Aladin-Climate regional climate model. Idojaras 2017, 121, 161–187. [Google Scholar]
- Leffler, A.J.; Beard, K.H.; Kelsey, K.C.; Choi, R.T.; Schmutz, J.A.; Welker, J.M. Cloud cover and delayed herbivory relative to timing of spring onset interact to dampen climate change impacts on net ecosystem exchange in a coastal Alaskan wetland. Environ. Res. Lett. 2019, 14, 10. [Google Scholar] [CrossRef]
- Coates, S.J.; Davis, M.D.P.; Andersen, L.K. Temperature and humidity affect the incidence of hand, foot, and mouth disease: A systematic review of the literature—A report from the International Society of Dermatology Climate Change Committee. Int. J. Dermatol. 2019, 58, 388–399. [Google Scholar] [CrossRef]
- Kleynhans, E.; Terblanche, J.S. Complex interactions between temperature and relative humidity on water balance of adult tsetse (Glossinidae, Diptera): Implications for climate change. Front. Physiol. 2011, 2, 74. [Google Scholar] [CrossRef]
- Terrenoire, E.; Hauglustaine, D.A.; Gasser, T.; Penanhoat, O. The contribution of carbon dioxide emissions from the aviation sector to future climate change. Environ. Res. Lett. 2019, 14, 12. [Google Scholar] [CrossRef]
- Chen, X.Z.; Liu, X.D.; Liu, Z.Y.; Zhou, P.; Zhou, G.Y.; Liao, J.S.; Liu, L.Y. Spatial clusters and temporal trends of seasonal surface soil moisture across China in responses to regional climate and land cover changes. Ecohydrology 2017, 10, 12. [Google Scholar] [CrossRef]
- Li, Y.; Su, T.; Sheng, L.; Qiang, P.; Zhao, B. Study of a high-precision pulsar angular position measuring method. Mod. Phys. Lett. B 2018, 32, 1850355. [Google Scholar] [CrossRef]
- Harrison, D.E.; Larkin, N.K. Darwin sea level pressure, 1876-1996: Evidence for climate change? Geophys. Res. Lett. 1997, 24, 1779–1782. [Google Scholar] [CrossRef]
- Reader, M.C.; Plummer, D.A.; Scinocca, J.F.; Shepherd, T.G. Contributions to twentieth century total column ozone change from halocarbons, tropospheric ozone precursors, and climate change. Geophys. Res. Lett. 2013, 40, 6276–6281. [Google Scholar] [CrossRef][Green Version]
- Jankovic, A.; Podrascanin, Z.; Djurdjevic, V. Future climate change impacts on residential heating and cooling degree days in Serbia. Idojaras 2019, 123, 351–370. [Google Scholar] [CrossRef]
- Shi, Y.; Gao, X.J.; Xu, Y.; Giorgi, F.; Chen, D.L. Effects of climate change on heating and cooling degree days and potential energy demand in the household sector of China. Clim. Res. 2016, 67, 135–149. [Google Scholar] [CrossRef]
- Zhang, Y.W.; Gong, C.L.; Fang, H.; Su, H.; Li, C.N.; Da Ronch, A. An efficient space division-based width optimization method for RBF network using fuzzy clustering algorithms. Struct. Multidiscip. Optim. 2019, 60, 461–480. [Google Scholar] [CrossRef]
- Tian, Z.D.; Li, S.J.; Wang, Y.H. A prediction approach using ensemble empirical mode decomposition-permutation entropy and regularized extreme learning machine for short-term wind speed. Wind Energy 2019. [Google Scholar] [CrossRef]
- Willmott, C.J.; Matsuura, K. Advantages of the mean absolute error (MAE) over the root mean square error (RMSE) in assessing average model performance. Clim. Res. 2005, 30, 79–82. [Google Scholar] [CrossRef]
- Royer, D.L.; Berner, R.A.; Park, J. Climate sensitivity constrained by CO2 concentrations over the past 420 million years. Nature 2007, 446, 530–532. [Google Scholar] [CrossRef]
- Stanghellini, C.; Bontsema, J.; de Koning, A.; Baeza, E.J. An Algorithm for Optimal Fertilization with Pure Carbon Dioxide in Greenhouses. In International Symposium on Advanced Technologies and Management Towards Sustainable Greenhouse Ecosystems: Greensys 2011; Kittas, C., Katsoulas, N., Bartzanas, T., Eds.; ISHS: Leuven, Belgium, 2012; Volume 952, pp. 119–124. [Google Scholar]
- Huber, M.; Sloan, L.C. Climatic responses to tropical sea surface temperature changes on a “greenhouse” Earth. Paleoceanography 2000, 15, 443–450. [Google Scholar] [CrossRef]
- Kim, D.; Kang, S.; Cho, S. Expected margin-based pattern selection for support vector machines. Expert Syst. Appl. 2020, 139, 112865. [Google Scholar] [CrossRef]
- Winslow, L.A.; Leach, T.H.; Rose, K.C. Global lake response to the recent warming hiatus. Environ. Res. Lett. 2018, 13, 5. [Google Scholar] [CrossRef]
- Zheng, B.; Chevallier, F.; Yin, Y.; Ciais, P.; Fortems-Cheiney, A.; Deeter, M.N.; Parker, R.J.; Wang, Y.L.; Worden, H.M.; Zhao, Y.H. Global atmospheric carbon monoxide budget 2000-2017 inferred from multi-species atmospheric inversions. Earth Syst. Sci. Data 2019, 11, 1411–1436. [Google Scholar] [CrossRef]
- Le Quere, C.; Andrew, R.M.; Friedlingstein, P.; Sitch, S.; Pongratz, J.; Manning, A.C.; Korsbakken, J.I.; Peters, G.P.; Canadell, J.G.; Jackson, R.B.; et al. Global Carbon Budget 2017. Earth Syst. Sci. Data 2018, 10, 405–448. [Google Scholar] [CrossRef]
- Liu, X.S. A probabilistic explanation of Pearson’s correlation. Teach. Stat. 2019, 41, 115–117. [Google Scholar] [CrossRef]
- Wu, C.Y.; Chen, Y.F.; Peng, C.H.; Li, Z.C.; Hong, X.J. Modeling and estimating aboveground biomass of Dacrydium pierrei in China using machine learning with climate change. J. Environ. Manag. 2019, 234, 167–179. [Google Scholar] [CrossRef] [PubMed]
- Buckland, C.E.; Bailey, R.M.; Thomas, D.S.G. Using artificial neural networks to predict future dryland responses to human and climate disturbances. Sci. Rep. 2019, 9, 3855. [Google Scholar] [CrossRef] [PubMed]
- Nguyen, P.; Ombadi, M.; Sorooshian, S.; Hsu, K.; AghaKouchak, A.; Braithwaite, D.; Ashouri, H.; Thorstensen, A.R. The PERSIANN family of global satellite precipitation data: A review and evaluation of products. Hydrol. Earth Syst. Sci. 2018, 22, 5801–5816. [Google Scholar] [CrossRef]


| Indicators | Variable | The Setting of the Threshold Value |
|---|---|---|
| The extreme maximum temperature | The highest temperature in the year, the percentile value is 95% | |
| The extreme minimum temperature | The minimum temperature of the year, the percentile value is 5% | |
| Frost days | The number of days with the daily minimum temperature less than 0 | |
| Icing days | The number of days with a maximum daily temperature less than 0 | |
| Summer days | The number of days with a maximum daily temperature higher than 25 degrees Celsius | |
| Hot nights | The number of days with a daily minimum temperature higher than 20 degrees Celsius | |
| The annual range of temperature | The difference between the highest temperature in summer and the lowest temperature in winter | |
| Annual precipitation | Annual cumulative rainfall with daily precipitation greater than 1 mm | |
| Precipitation intensity | The ratio of total yearly precipitation to wet days | |
| Heavy rain days | The number of days with daily precipitation higher than 20 mm | |
| Rainy days | The number of days with daily precipitation ≥10 mm | |
| Wet days | The number of days with daily precipitation greater than 1 mm | |
| Maximum daily rainfall | Annual maximum single-day precipitation |
| Number | Province or Region | Abbreviation |
|---|---|---|
| 1 | Alberta | AB |
| 2 | British Columbia | BC |
| 3 | Manitoba | MB |
| 4 | New Brunswick | NB |
| 5 | Newfoundland and Labrador | NL |
| 6 | Northwest Territories | NT |
| 7 | Nova Scotia | NS |
| 8 | Nunavut | NU |
| 9 | Ontario | ON |
| 10 | Prince Edward Island | PE |
| 11 | Quebec | QC |
| 12 | Saskatchewan | SK |
| 13 | Yukon | YT |
| Number | Indicator | Variable |
|---|---|---|
| 1 | The surface temperature of the sea | |
| 2 | Ice coating | |
| 3 | Monthly average long-wave radiation | |
| 4 | Monthly average near-infrared beam downward sun flux | |
| 5 | Average monthly precipitation | |
| 6 | Monthly average evaporation rate | |
| 7 | Earth surface wind speed | |
| 8 | Earth surface cloud amount | |
| 9 | Average temperature | |
| 10 | Relative humidity | |
| 11 | Total carbon dioxide emissions |
| Climate Change Interval | Probability | Definition |
|---|---|---|
| [0.1, 0.15] | 0.12 | The level of climate change is considered “excellent” |
| [0.16, 0.20] | 0.22 | The level of climate change is considered “good” |
| [0.21, 0.25] | 0.31 | The level of climate change is considered “normal” |
| [0.26, 0.30] | 0.11 | The level of climate change is considered “a little bad” |
| [0.31, 0.35] | 0.13 | The level of climate change is considered “bad” |
| [0.36, 0.40] | 0.08 | The level of climate change is considered “worse” |
| [0.41, 0.45] | 0.03 | The level of climate change is considered “worst” |
| [0.46, 1] | 0 | Reaching the level of the environment’s maximum limit |
| Range of Extreme Temperature Values | Level |
| (0.9, 1) | Hottest |
| [0.7, 0.9] | Hotter |
| (0.3, 0.7) | Warm |
| [0.1, 0.3] | Colder |
| (0, 0.1) | Coldest |
| Range of Extreme Precipitation Values | Level |
| (0.9, 1) | Rainiest |
| [0.7, 0.9] | Rainier |
| (0.3, 0.7) | Normal |
| [0.1, 0.3] | Drier |
| (0, 0.1) | Driest |
| Correlation Coefficient Interval | Definition |
|---|---|
| [0.8, 1] | Extremely strong correlation |
| [0.6, 0.8) | Strong correlation |
| [0.4, 0.6) | Moderate correlation |
| [0.2, 0.4) | Weak correlation |
| [0, 0.2) | Very weakly related or irrelevant |
© 2020 by the authors. Licensee MDPI, Basel, Switzerland. This article is an open access article distributed under the terms and conditions of the Creative Commons Attribution (CC BY) license (http://creativecommons.org/licenses/by/4.0/).
Share and Cite
Ren, X.; Li, L.; Yu, Y.; Xiong, Z.; Yang, S.; Du, W.; Ren, M. A Simplified Climate Change Model and Extreme Weather Model Based on a Machine Learning Method. Symmetry 2020, 12, 139. https://doi.org/10.3390/sym12010139
Ren X, Li L, Yu Y, Xiong Z, Yang S, Du W, Ren M. A Simplified Climate Change Model and Extreme Weather Model Based on a Machine Learning Method. Symmetry. 2020; 12(1):139. https://doi.org/10.3390/sym12010139
Chicago/Turabian StyleRen, Xiaobin, Lianyan Li, Yang Yu, Zhihua Xiong, Shunzhou Yang, Wei Du, and Mengjia Ren. 2020. "A Simplified Climate Change Model and Extreme Weather Model Based on a Machine Learning Method" Symmetry 12, no. 1: 139. https://doi.org/10.3390/sym12010139
APA StyleRen, X., Li, L., Yu, Y., Xiong, Z., Yang, S., Du, W., & Ren, M. (2020). A Simplified Climate Change Model and Extreme Weather Model Based on a Machine Learning Method. Symmetry, 12(1), 139. https://doi.org/10.3390/sym12010139