Article

CARS Algorithm-Based Detection of Wheat Moisture Content before Harvest

College of Mechanical and Electrical Engineering, Henan Agricultural University, Zhengzhou 450002, China
*
Author to whom correspondence should be addressed.
Symmetry 2020, 12(1), 115; https://doi.org/10.3390/sym12010115
Submission received: 27 November 2019 / Revised: 3 January 2020 / Accepted: 3 January 2020 / Published: 7 January 2020

Abstract

:
To rapidly detect the wheat moisture content (WMC) without harm to the wheat and before harvest, this paper measured wheat and panicle moisture content (PMC) and the corresponding spectral reflectance of panicle before harvest at the Beijing Tongzhou experimental station of China Agricultural University. Firstly, we used correlation analysis to determine the optimal regression model of WMC and PMC. Secondly, we derived the spectral sensitive band of PMC before filtering the redundant variables competitive adaptive reweighted sampling (CARS) to select the variable subset with the least error. Finally, partial least squares regression (PLSR) was used to build and analyze the prediction model of PMC. At the early stage of wheat harvest, a high correlation existed between WMC and PMC. Among all regression models such as exponential, univariate linear, polynomial models, and the power function regression model, the logarithm regression model was the best. The determination coefficients of the modeling sample were: R2 = 0.9284, the significance F = 362.957, the determination coefficient of calibration sample R2v = 0.987, the root mean square error RMSEv = 3.859, and the relative error REv = 7.532. Within the range of 350–2500 nm, bands of 728–907 nm, 1407–1809 nm, and 1940–2459 nm had a correlation coefficient of PMC and wavelength reflectivity higher than 0.6. This paper used the CARS algorithm to optimize the variables and obtained the best variable subset, which included 30 wavelength variables. The PLSR model was established based on 30 variables optimized by the CARS algorithm. Compared with the all-sensitive band, which had 1103 variables, the PLSR model not only reduced the number of variables by 1073, but also had a higher accuracy in terms of prediction. The results showed that: RMSEC = 0.9301, R2c = 0.995, RMSEP = 2.676, R2p = 0.945, and RPD = 3.362, indicating that the CARS algorithm could effectively remove the variables of spectral redundant information. The CARS algorithm provided a new way of thinking for the non-destructive and rapid detection of WMC before harvest.

1. Introduction

Wheat, the most important cereal grain in China, if harvested mechanically at an appropriate harvest time, will generate a higher yield and income. Wheat moisture content (WMC) before harvest is a key index to determine the time [1,2]. However, different varieties of wheat have different harvest times. Different cultivation conditions and weather conditions also affect the time of harvest. Traditional WMC detection method is time-consuming and laborious. As a result, large-scale real-time monitoring and the scheduling of operation and maintenance for wheat combines are hard to achieve. Therefore, we need to develop an efficient, non-destructive and accurate method to detect WMC before harvest. Hyperspectral remote sensing technology has many advantages. It is able to detect a large area of crops without touching the crop itself and obtain results within a short period of time. The rapid and non-destructive detection of moisture content in wheat grains improves both wheat yield and quality, and thus boosts farmers’ income. This useful method should be done before harvest. As agricultural modernization proceeds, mechanical harvesting has become one of the most widely adopted mechanization practices. However, this practice may cause damage to the seeds during harvest. To reduce the damage, the moisture content of wheat seeds should be measured before harvest to determine the optimal harvest time. The best time for this should be when the grain moisture decreases and its hardness and mechanical resistance increase. In recent years, this technology has become popular among researchers for monitoring wheat plant growth and pests [3,4,5,6] and detecting wheat grain quality. However, most studies detect the content based on the spectrum reflected from the surface of the research object. Before harvest, we can only collect the spectral information reflected from the panicle surface, as the wheat grain is filling in the panicle. Therefore, the correlation between WMC and panicle moisture content (PMC) before harvest, and the characteristics of reflection spectrum from panicle before harvest are key to spectral analysis and modeling of WMC before harvest.
Spectral information obtained by spectrometer is visible and near infrared. Such information contains numerous useless and irrelevant components, which will affect the accuracy of the prediction model. If we want to evaluate the internal quality of agricultural products with hyperspectral data, we have to select effective variables before qualitative and quantitative analysis. Variable selection helps us to build stable models that are more easily interpreted than others [7]. The most common variable optimization methods are genetic algorithms (GA), successive projection algorithms (SPA), partial least squares of the interval (interval PLS, iPLS), Monte Carlo-uninformative variable elimination (MC-UVE), and competitive adaptive reweighted sampling (CARS) [8,9]. Lu et al. [10] improved the prediction accuracy of PLSR model by optimizing 12 variables with 200 competitive adaptive reweighting, when they were detecting the crude protein content of wheat grain from its near-infrared spectrum. Cai et al. [11] studied the hyperspectral inversion of soil moisture content and used the wavelet transform coupled competitive adaptive weighted sampling (WT-CARS) coupling algorithm to select 131 wavelength variables from the full-band reflectance spectrum. They found that PLSR prediction model with the optimal variables of CARS was more accurate than the full-band prediction model. Li et al. [12] used the CARS algorithm to study the spectral detection of soluble solids content (SSC) in Yali pear. The results showed that, as the CARS-PLS model was based on the optimal key variables, it only used 15.6% of variables in the original information. In this way, the number of variables was reduced [13]. Moreover, the CARS-PLS model could more accurately predict the SSC content in Yali pear than the full-variable PLS model. This indicates that spectral data analysis applied with the CARS algorithm can overcome combinatorial explosion and boost the accuracy of the model by selecting variables from high-dimensional data. This paper was the first of its kind to adopt the CARS algorithm for selecting variables in the spectral data of wheat panicle. The variables were used to build a partial least squares regression (PLSR) prediction model for the detection of WMC.

2. Materials and Methods

2.1. Test Design and Sample Collection

We conducted the test at Tongzhou experimental station of Beijing Agricultural University of China (39°42′ N, 116°41′ E) from 6 to 14 June 2018. We selected Nongda 211 as the wheat variety and four plots as the study area based on the environment conditions. Each plot had an area of 4 m2 (2 × 2 m). In the field management, we kept the water and fertilization at the same amount for all plots. During sampling, we measured the spectral reflectance of each plot once a day and selected three representative wheat plants as sample points [14]. We made panicles of each sample point into samples and transported them in plastic freezer bags to the laboratory. At the laboratory, we measured their WMC and PMC with an electric blast drying oven and a balance with the accuracy of 0.1 mg. During the correlation analysis of WMC and PMC, we randomly selected 30 samples as modeling samples, because their moisture content showed a series of gradients. Further, we selected another 14 samples with the same obvious pattern of moisture content for validation.
We used ASD Field Spec4 spectrometer (U.S.A., spectral range 350–2500 nm) for spectral determination. The sampling interval and the spectral resolution were 1.4 nm and 3 nm respectively, for the spectral wavelength region of 350–1000 nm; they changed into 1.1 nm and 8 nm for the region of 1001–2500 nm. We carried out spectral measurements during 10:00–14:00 on windless sunny days (when solar altitude angle was higher than 45°). To obtain more panicle spectral information, we turned the spectrometer probe to a 45-degree tilt, and put it close to the top of wheat canopy, at a distance of 0.8 m. We took the same method to measure three fields of view and recorded 10 sampling spectra for every plot. We took the average value of the 10 sampling spectra as the spectral value of the whole plot and made standard whiteboard corrections before and after the data acquisition for each group.

2.2. Data Processing and Analysis

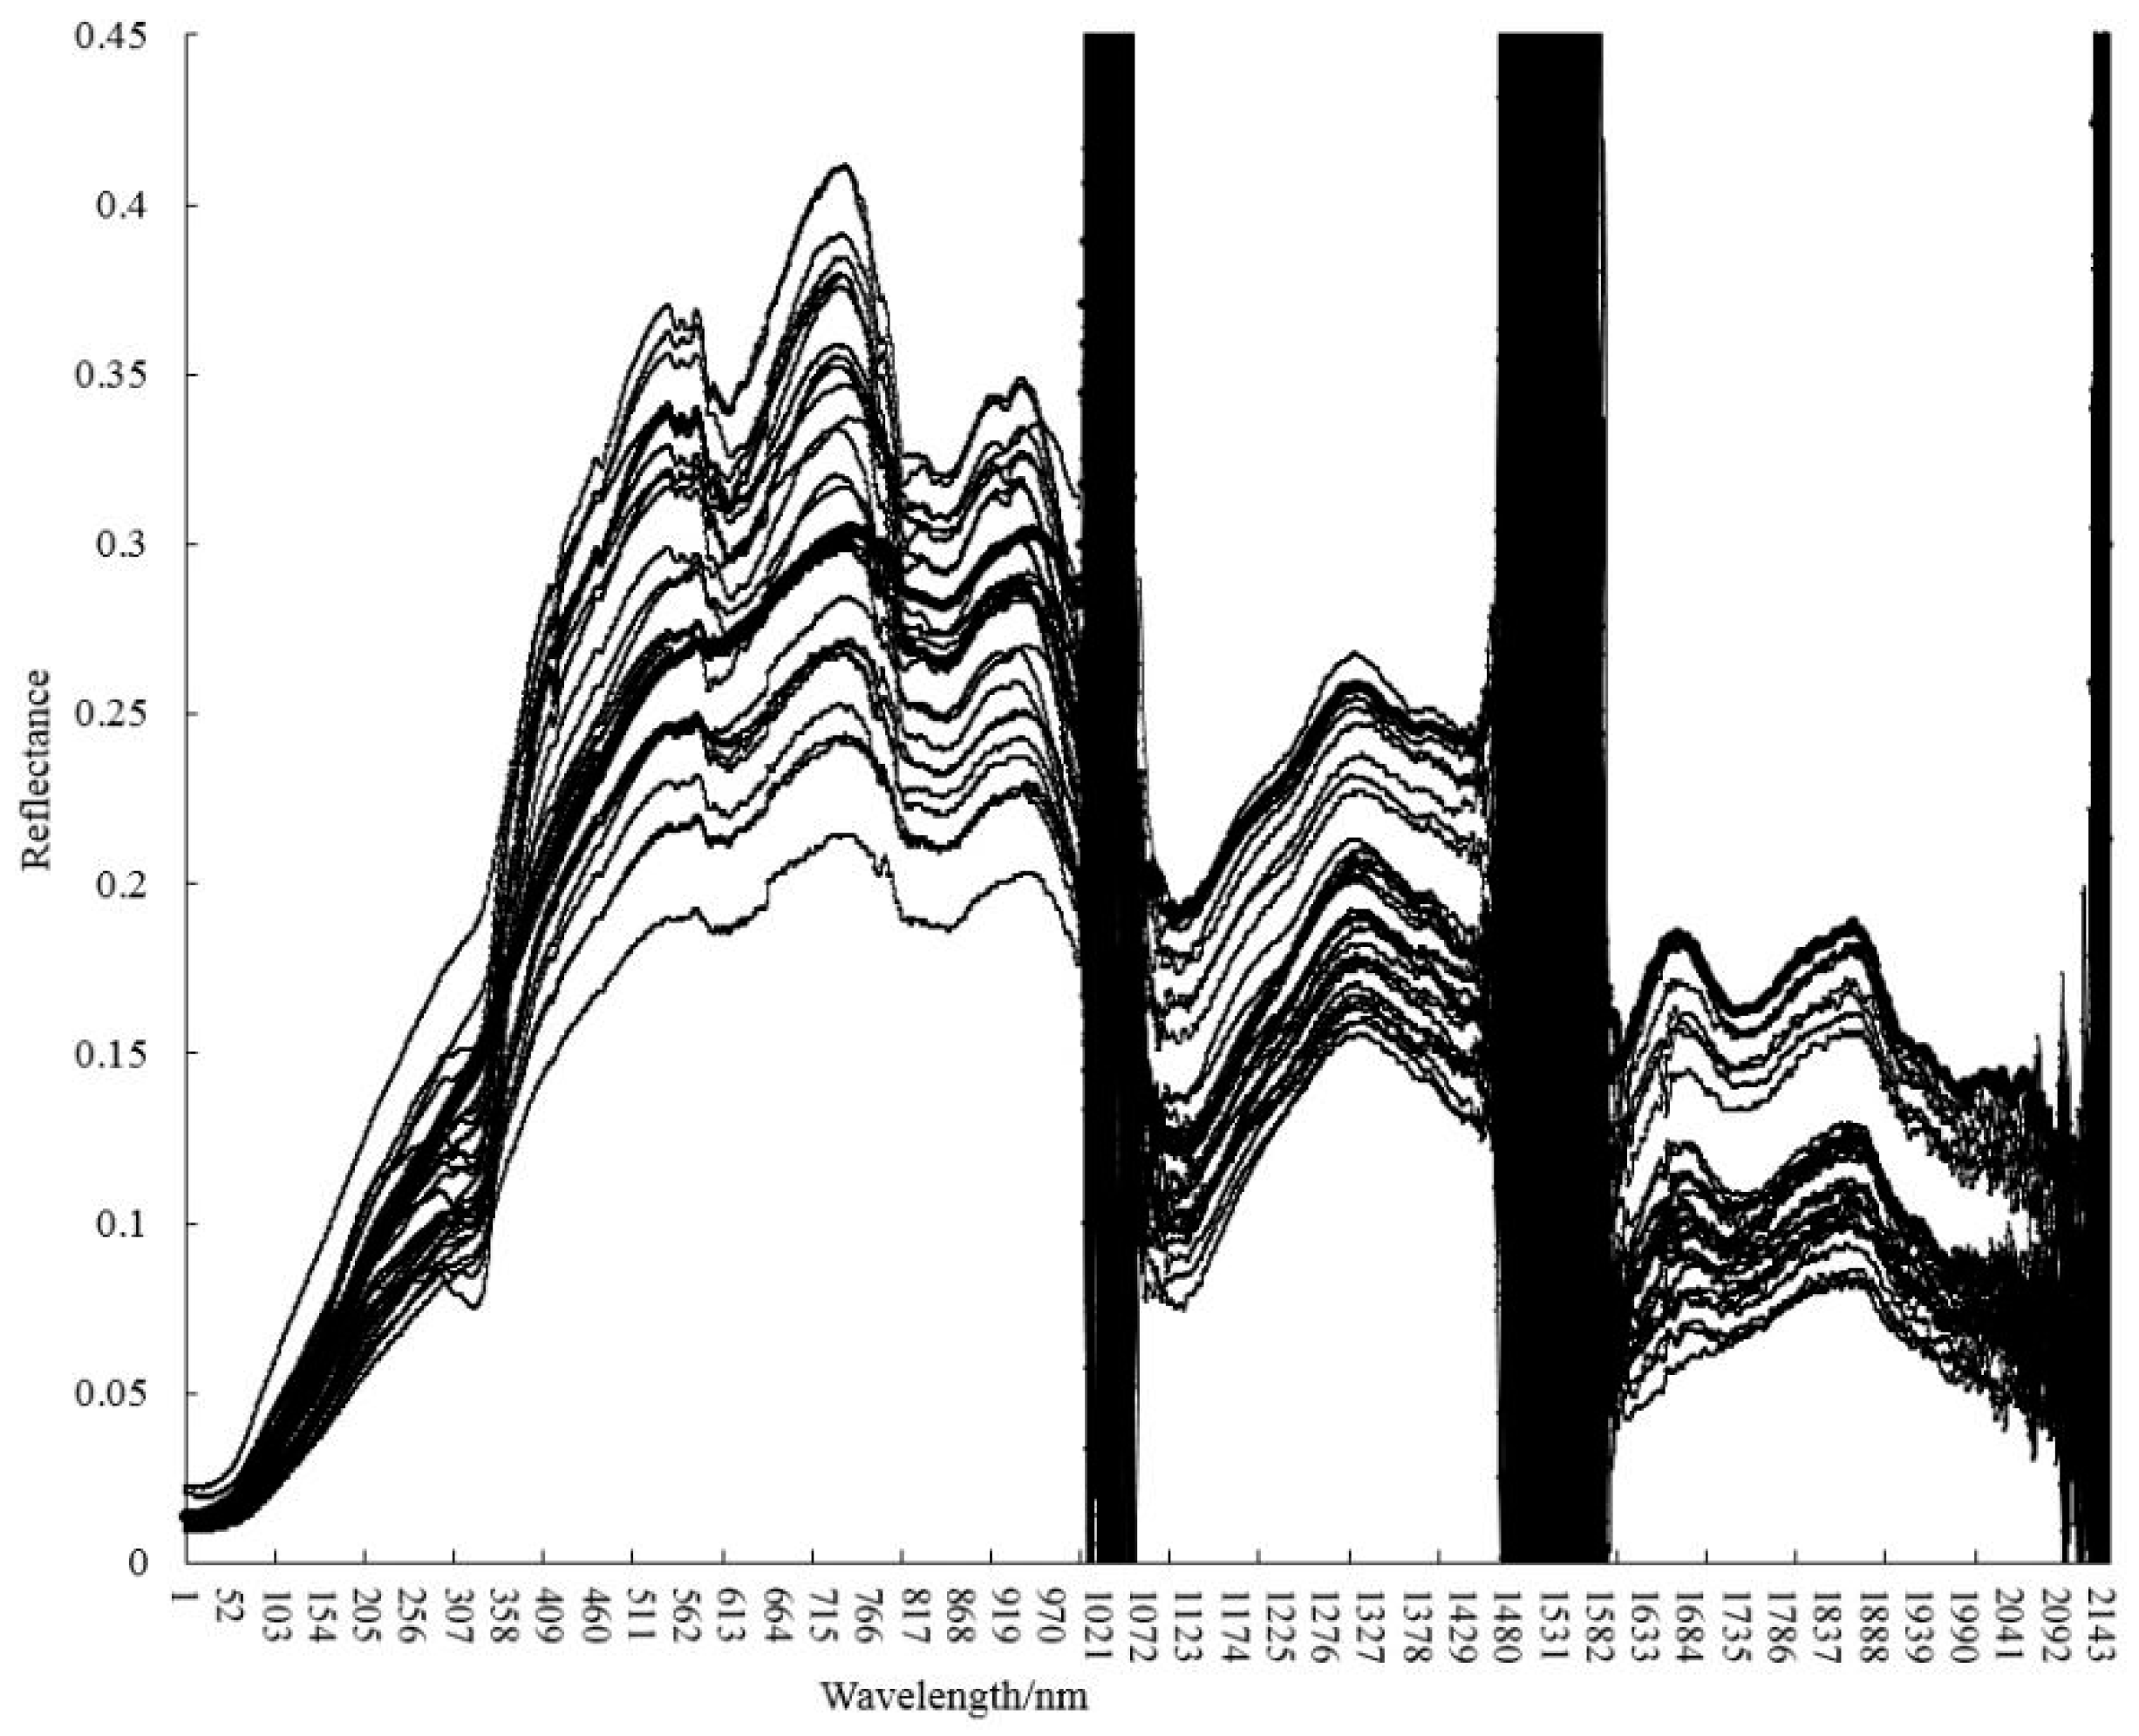
2.2.1. Spectra Pretreatment

After spectral determination with the ASD spectrometer, we used programs such as ViewSpecPro, Excel and SPSS to calculate the average values of the spectral data and analyze the correlation of the whole band.

2.2.2. Competitive Adaptive Reweighted Sampling (CARS)

The CARS method follows the Darwinian evolutionary theory of “survival of the fittest” and takes advantage of Monte Carlo sampling (MCS). The CARS method selects subsets of wavelength variables through iteration and competition, and optimizes variables through exponential decreasing function (EDP) and adaptive reweighted sampling (APS). The method, once applied in the PLSR model, can quickly identify the key variables that have higher absolute values of regression coefficient. Through the change of root mean square error of crossing verification (RMSECV), the CARS method is also able to find the optimal variable subset with minimal error [15,16,17,18]. It screens out wavelength variable combinations that are sensitive to PMC, and overcomes combinatorial explosion during the selection of variables. This method can be well applied to high-dimensional data.

2.2.3. Establishment and Calibration of PLSR Model

The PLSR model has absorbed the advantages of the following three methods: (1) principal component analysis, (2) canonical correlation analysis, and (3) general multiple linear regression. The PLSR model will remain stable, even if multiple linear correlation exists between independent variables and the number of samples is less than wavelength variables. This will enhance the statistical analysis of multivariate data.
This paper uses PLSR to establish the CARS optimal variable model and full-sensitive-band model. It also adopts determination coefficients of calibration (R2c), predicting determination of calibration (R2p), root mean square error of calibration (RMSEC), root mean square error of prediction (RMSEP), and residual predictive deviation (RPD) to evaluate the model’s performance [19,20,21]. A large R2 and small RMSEC and RMSEP means that the model performs very well. Larger values of R2 and lower values of RMSEC and RMSEP indicate better performance. If RPD is between 1.5 and 2, it shows that the model is able to predict PMC, whereas if it is between 2 and 2.5, the model’s prediction could be used for rough quantitative analysis, while RPD ranging from 2.5 to 3 indicates that the model’s prediction is rather accurate.

3. Results and Analysis

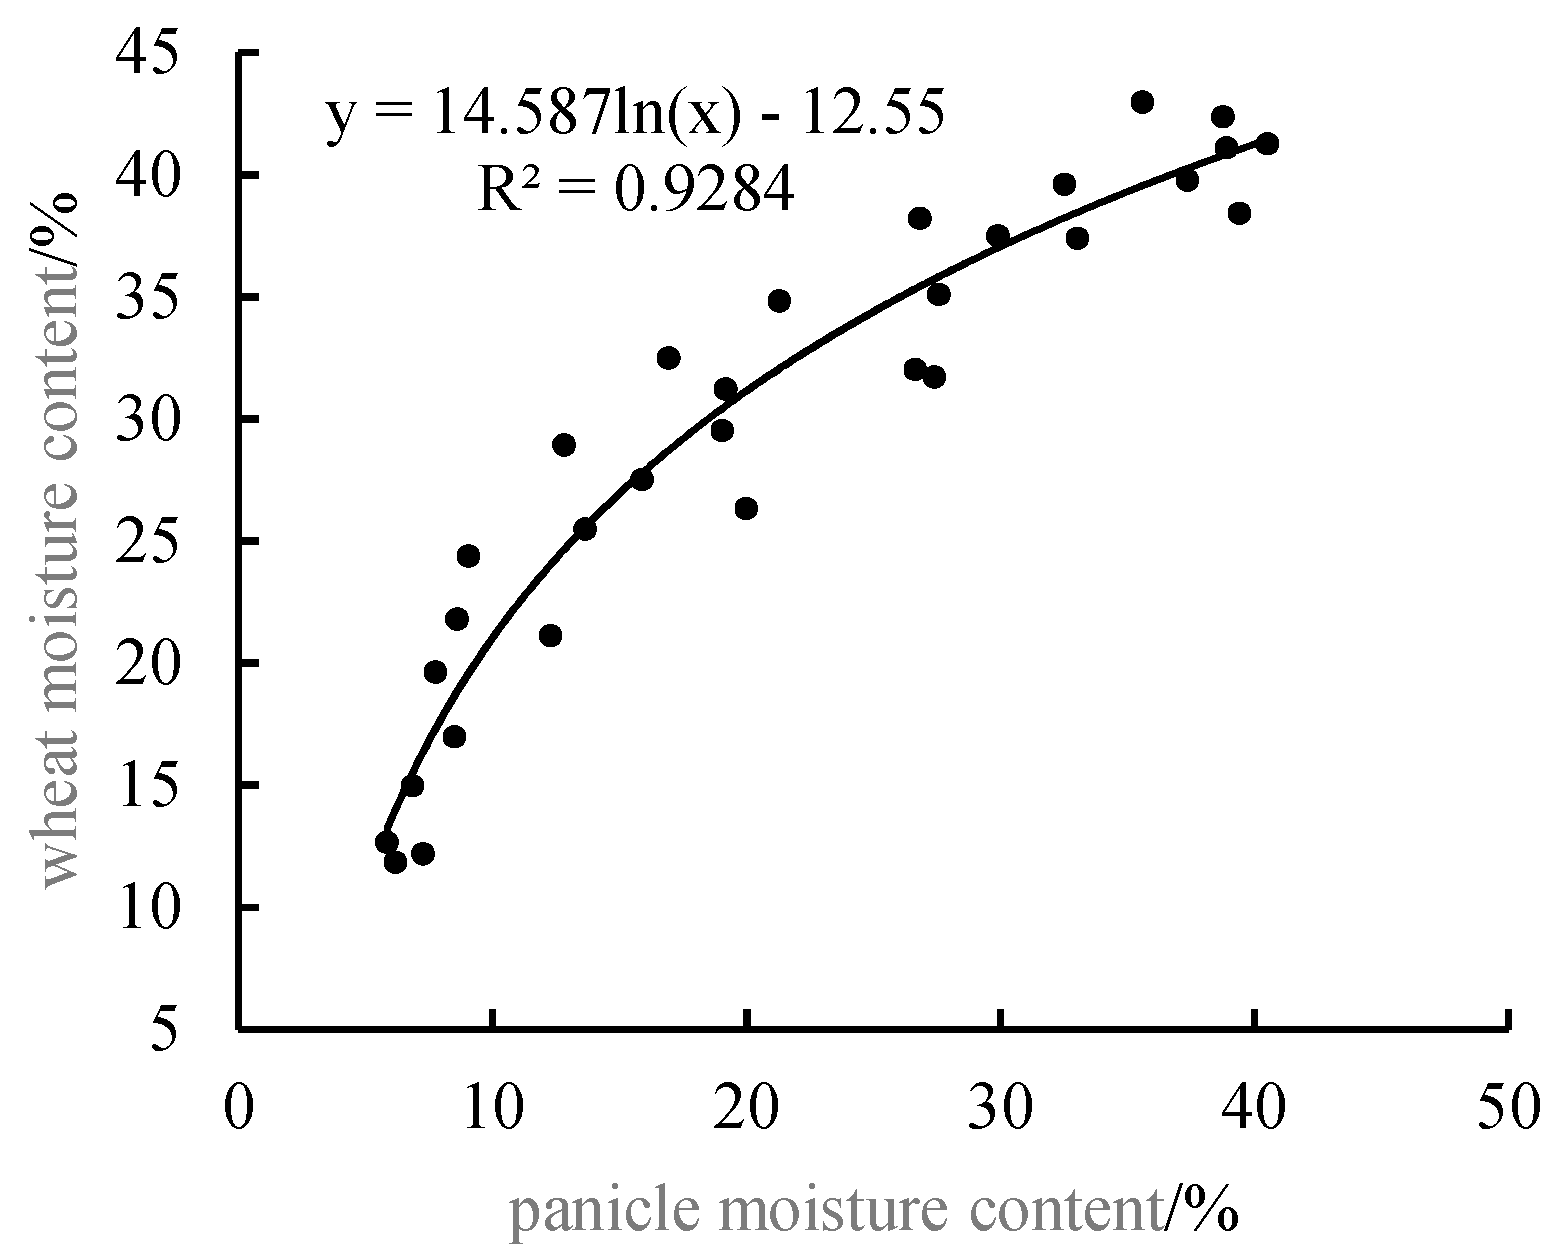
3.1. Changes in Moisture Content of Wheat and Panicle Samples

The statistical description of the characteristics wheat and panicle is shown in Table 1. As for the respective moisture content range of wheat and panicle, WMC gets 11.82–42.95%, with an average of 29.62% and PMC falls in the range of 5.85–40.52%, with an average of 21.53%. At the early stage of its maturity, a wheat plant has almost the same WMC and PMC. However, when it grows up, the moisture content of panicle becomes significantly lower than that of wheat grain, especially at the late stage of its maturity. This statistical description indicates that panicle loses water faster than wheat grain.

3.2. Correlation Analysis

We used an ASD spectrometer to detect the spectral reflectance information of wheat panicle and took the following method to study the quantitative relationship between WMC and spectral reflectance of panicle. Firstly, we carried out correlation analysis to study the relationship between WMC and PMC and established a regression model.
Table 2 shows the regression model of WMC and PMC and its validation. We selected the regression model with high simulation fit and small test errors to be the optimal estimation model. After comparison, we found that values of R2c for logarithmic, univariate linear [22], polynomial and power function regression models were higher than 0.8, and those of exponential regression models were lower than 0.8. The values of R2c for logarithmic and polynomial regression models were 0.9284 and 0.9158, respectively, which were the highest values among regression models. For the logarithmic model, R2v (represents the determination coefficient of validation mode) of its predicted value and measured value was 0.987, with RMSEv (represents the root mean square error of validation) at 3.859, and Rev (represents the relative error of validation) at 7.532%. For polynomial regression model, R2v of its predicted value and measured value was 0.982, with RMSEv at 5.426, and REv at 9.972%. Based on our analysis, the log regression model was the best estimation model for WMC detection. The details are shown in Figure 1 and Figure 2.

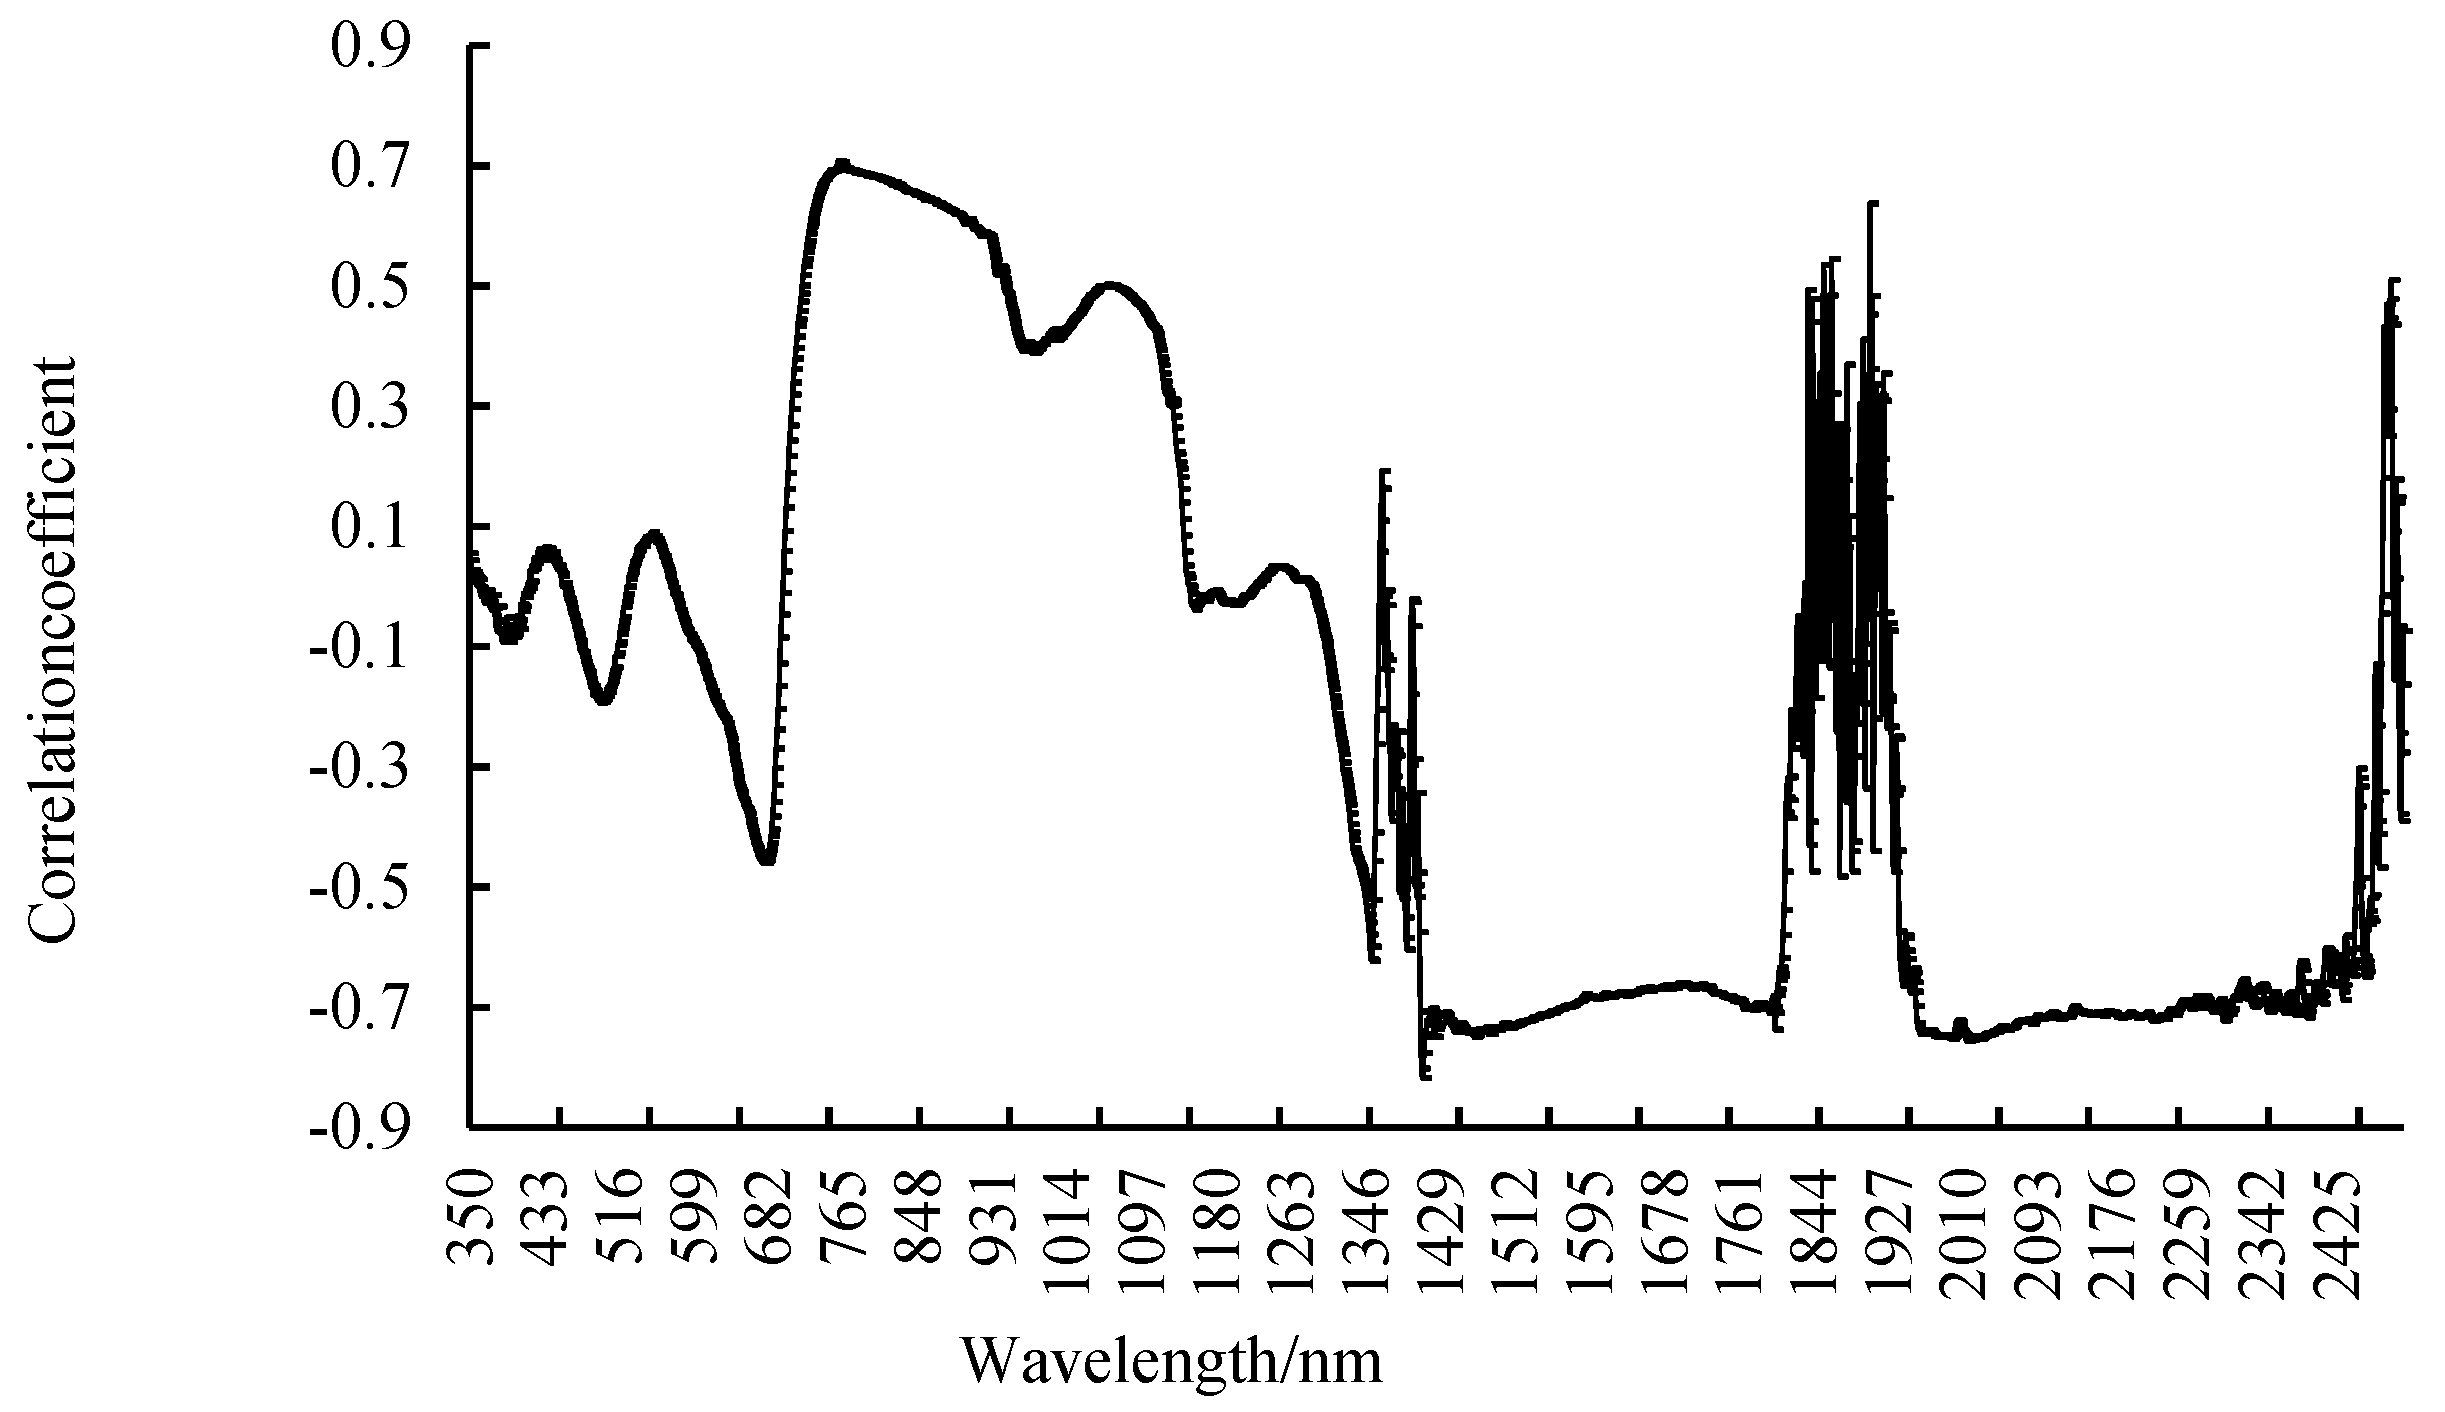
3.3. Selection of Spectral Sensitive Bands of PMC

We used ViewSpecPro, the post-processing software of the ASD spectrometer, to pre-process the spectral data, and obtained the visible near-infrared spectrum of wheat panicle. As is shown in Figure 3, there is an obvious reflection valley in wheat panicle within the wavelength range of 350–2500 nm. This spectral region was mainly the double frequency and combined frequency absorption of C-H, O-H and N-H bonds [23,24]. We used Excel and SPSS 21.0 to analyze the correlation between the spectral reflectivity of wheat panicle and moisture content at each wavelength location. The results are shown in Figure 4 At the band of 728–907 nm, the correlation coefficient values are all above 0.6, with a significant positive correlation at the level of 0.01; at the band of 1407–1809 nm and 1940–2459 nm, the correlation coefficient values are all below –0.6, with a significant negative correlation at the level of 0.01; the correlation coefficient R is the largest at –0.817 for 1409 nm. Therefore, we selected 728–907 nm, 1407–1809 nm and 1940–2459 nm as the spectral sensitive bands of PMC.

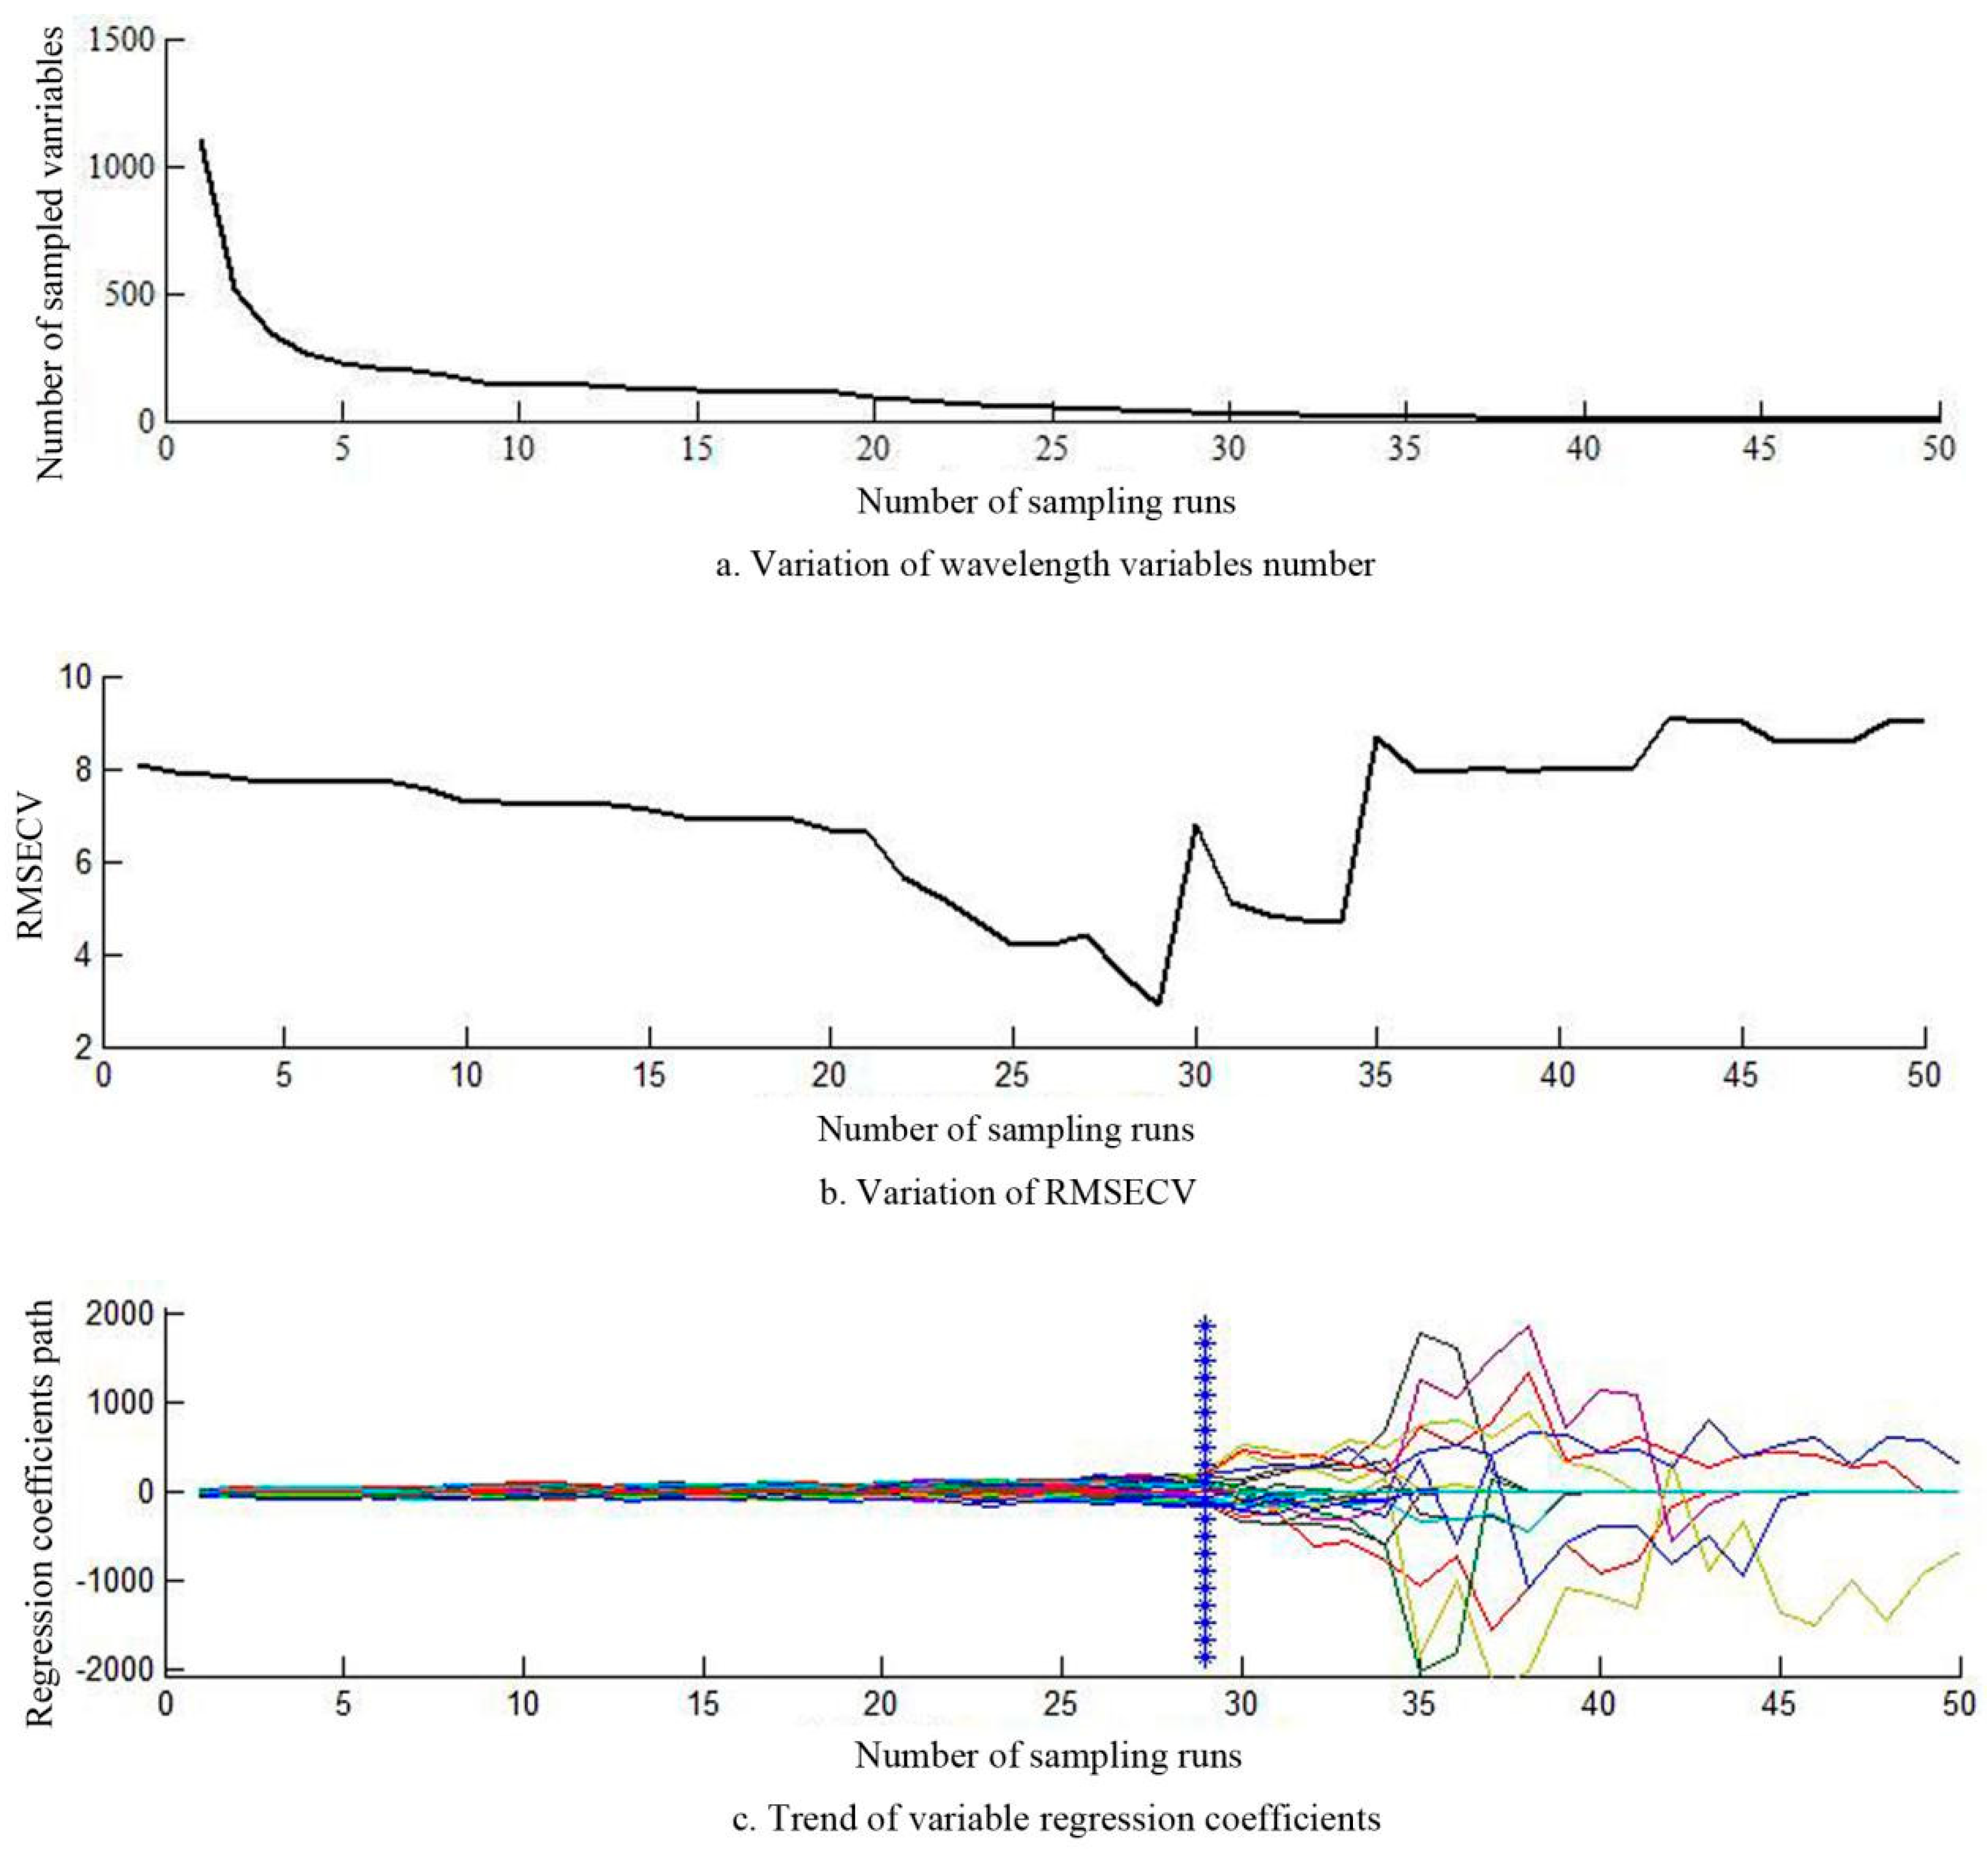
3.4. Variable Optimization by CARS Algorithm

We used competitive adaptive reweighted sampling (CARS) to optimize 1103 variables of the selected sensitive bands and set the times of Monte Carlo sampling were set to be 50. The iterations of sampling times were repeated [25]. We compared the RMSECV values of each sampling and included the lowest values in the subset of optimization variables. Because of the exponential decreasing function (EDP), the number of the corresponding optimal variables decreased exponentially as iterations increased (Figure 5a). Figure 5b shows that the RMSECV value first decreased before increased with the continuous iterations of sampling times. The RMSECV value decreased gradually during 1–29 iterations, indicating that a large amount of information or noise irrelevant to PMC was removed from the selected sensitive band spectrum. After 29 times of sampling, the RMSECV value slowly rose. This was due to the continuous removals of key variables that were sensitive to PMC. According to Figure 5c, the RMSECV value was the lowest during 29 times of sampling. Lines in the figure show the trend of regression coefficient of wavelength variables as the operation goes on. Figure 5 shows that the RMSECV value is the lowest at the 29th sampling. The corresponding spectral variables belong to the optimal variable set, which contains 30 spectral variables.

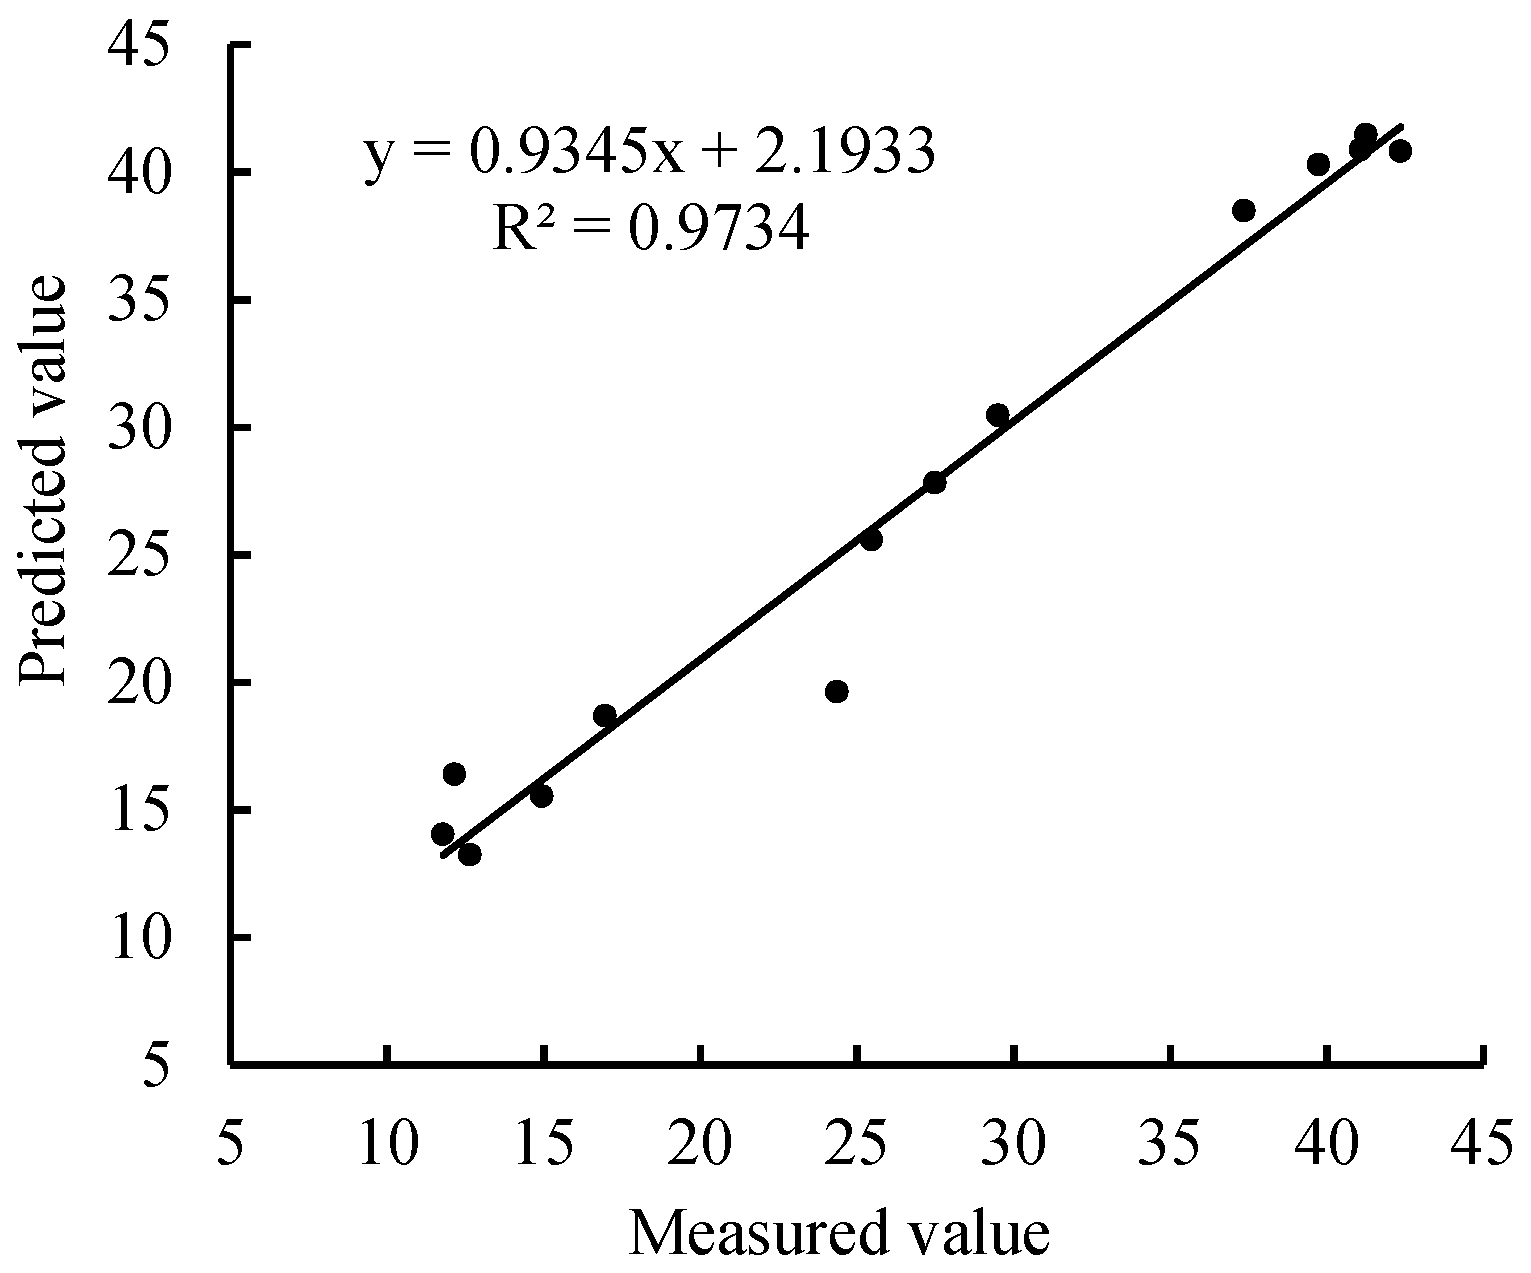
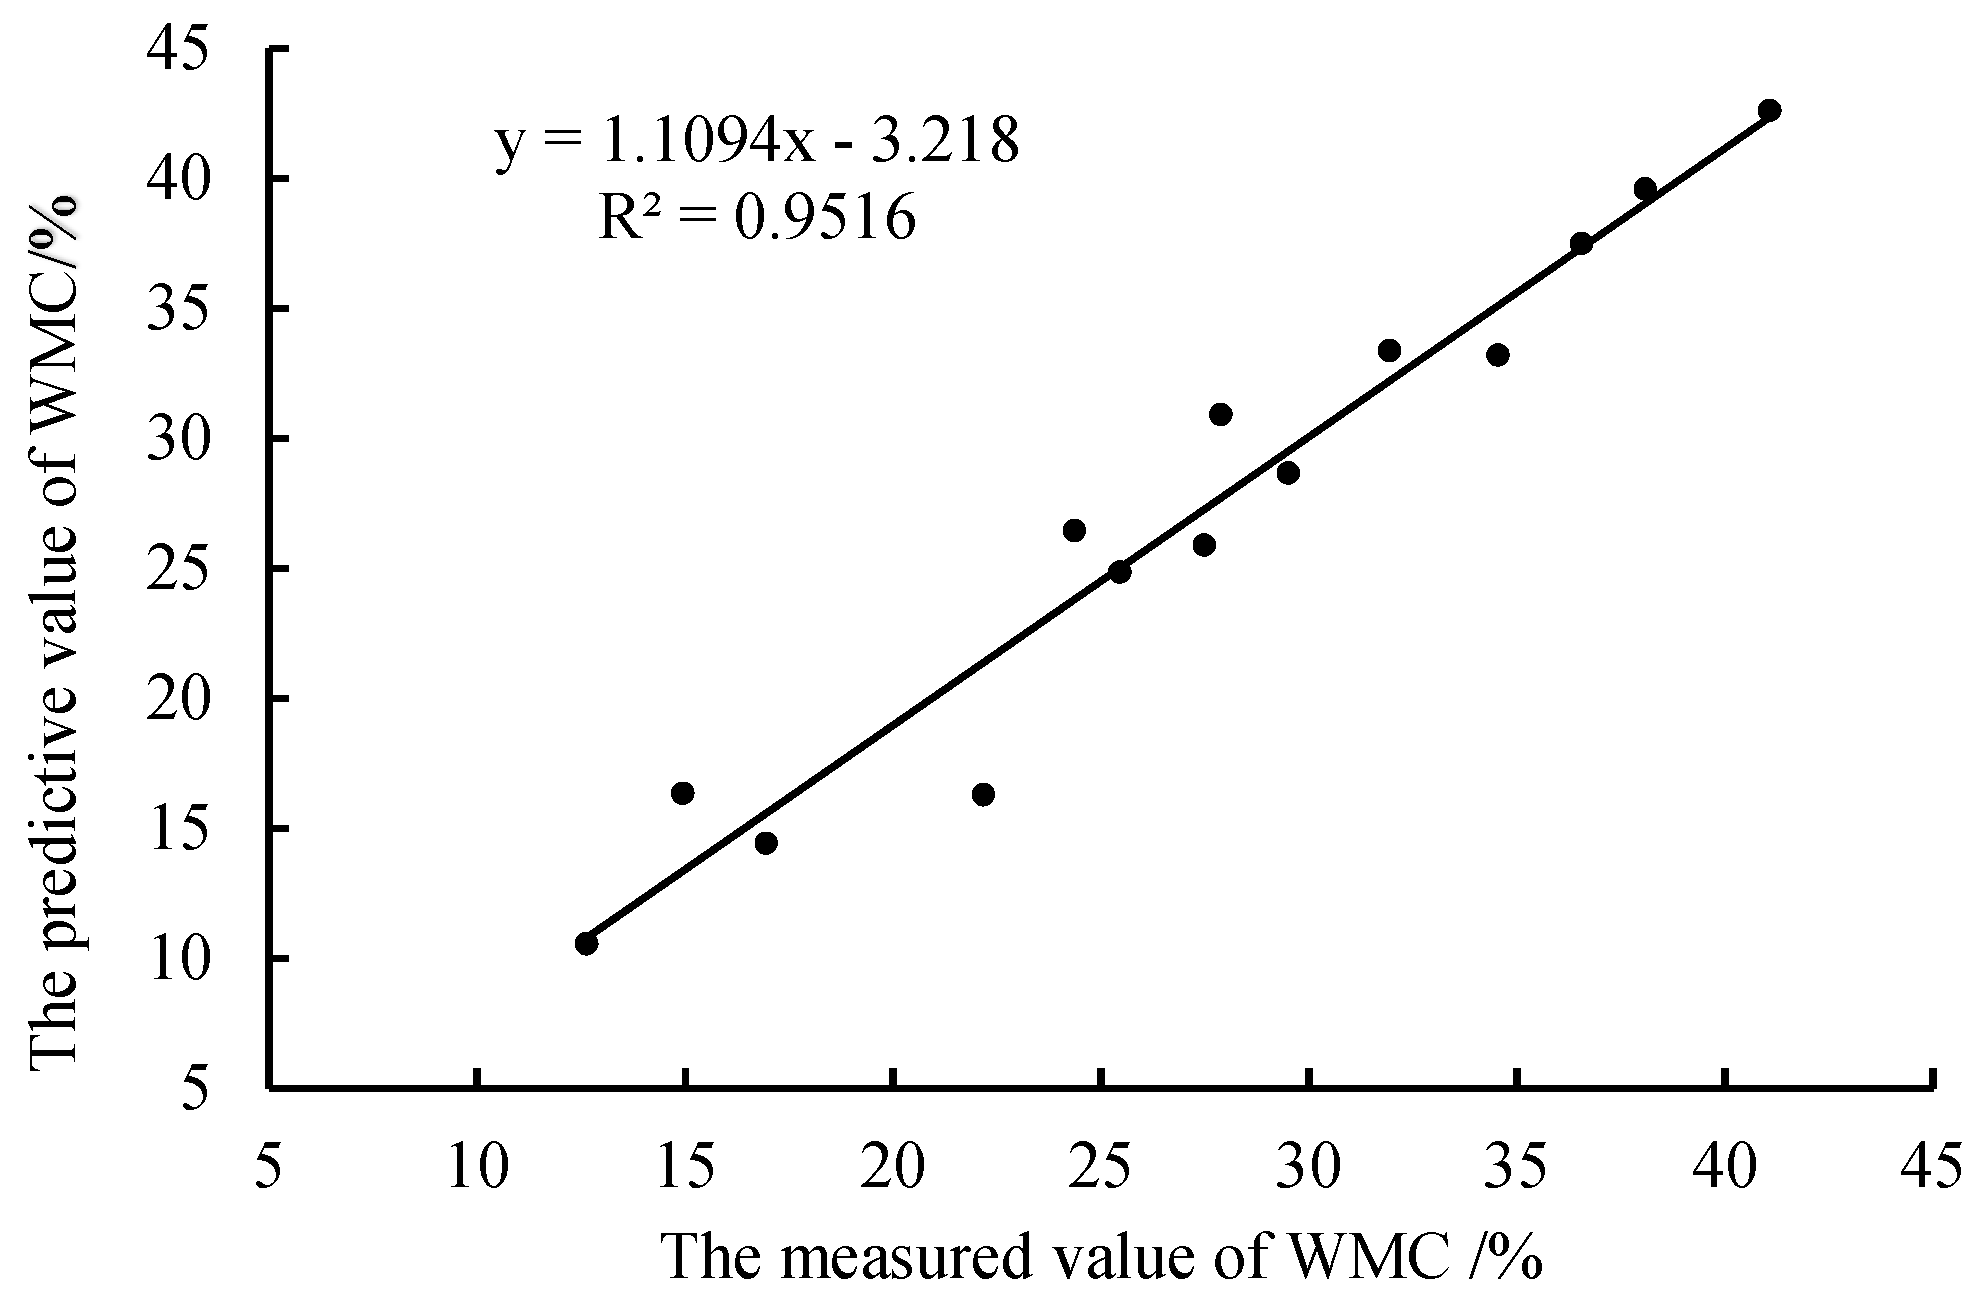
3.5. The Establishment and Verification of Optimal-Variable-Based PLSR Model

We selected spectral variables optimized by the CARS algorithm as independent variables and PMC as the dependent variable to build a PMC prediction model. To show the advantages of variable optimization, we introduced the PLSR model of all selected sensitive bands for comparison. Parameters of the CARS-optimized-variable model and the all-sensitive-band-variable model are shown in Table 3 We will compare them to analyze the prediction effects of both models.
Prediction data of the two models in Table 3 shows that CARS algorithm can improve the accuracy of PMC. For the partial least squares model based on CARS algorithm, RMSEC = 0.9301, R2c = 0.995, RMSEP = 2.676, R2p = 0.945, and RPD = 3.362. The CARS algorithm optimized 1103 sensitive bands and selected 30 optimal variables. Generally speaking, the new model constructed by these 30 optimal variables was more accurate and stable than the model of 1103 variables. The CARS algorithm not only reduced the number of modeling variables, but also improved the model’s accuracy. Therefore, it is an effective method in spectral analysis to optimize variables. This study analyzed the correlation between 2151 bands’ reflectivity and PMC with the best prediction model. It selected 1103 bands with the correlation coefficient higher than 0.6 and further filtered out optimal bands with the CARS algorithm. We selected a total of 30 bands for modeling. This process reduced the modeling time and improved the accuracy of the model. It also provided a reference for the inversion of selecting key bands of wheat growth information with wheat canopy hyperspectral reflectance in this region.
We adopted CARS-PLSR model to verify the prediction set and obtained RMSEP = 2.676, R2p = 0.945, and RPD = 3.362. Figure 6 shows the scatter diagram of the measured and predicted WMC. According to Figure 6, values predicted by the PLSR model and the measured values were evenly distributed near the 1:1 line of sample points. This proved that the model was rather accurate. Therefore, the CARS algorithm is effective in selecting bands for WMC prediction in the sensitive band, reducing the number of modeling variables, and improving the model’s accuracy.

4. Concluding Remarks

This paper focused on measuring wheat before harvest in the Beijing area. Firstly, we analyzed the correlation between WMC and PMC before harvest. Based on the analysis, we further analyzed the correlation between PMC and the characteristic parameters of the spectrum. Secondly, we adopted the CARS algorithm to select the optimal spectral variables of PMC and established a PLSR model for PMC prediction. After verifying the inversion accuracy of the model, we reached the following conclusions:
(1) A high correlation existed between WMC and PMC before harvest. The best regression model was the logarithmic regression, in which R2 = 0.9284, F = 362.957, R2v = 0.987, RMSEv = 3.859, and REv = 7.532.
(2) SPSS software analysis of the correlation between PMC and the spectral parameters of the whole band identified 1103 sensitive bands in total, including 728–907nm, 1407–1809nm and 1940–2459 nm. As an effective tool to optimize the variables, the CARS algorithm successfully obtained an optimal variable set with 30 wavelength variables.
(3) The CARS-algorithm-based PLSR model only took 30 optimized variables, much less than the 1,103 variables of the whole sensitive band. CARS algorithm filtered out 1073 variables in total and greatly improved the accuracy. The PLSR model had an RMSEC of 0.9301, R2c of 0.995, RMSEP of 2.676, R2p of 0.945, and RPD of 3.362.
The rapid and non-destructive detection of WMC before harvest is very important. As the wheat grain is filling in the panicle before harvest, it is impossible to directly obtain its reflection spectrum. Therefore, we have studied the correlation between the WMC and PMC, and built a PMC-based prediction model for WMC detection. The spectrum curve from the panicle’s hyperspectral reflectance is a comprehensive reflection of the wheat canopy’s attributes. On the spectrum, many bands are redundant data that are irrelevant of PMC. This study has determined bands that are sensitive to PMC by analyzing the correlation between whole-band reflectance and PMC. As there are numerous sensitive bands, CARS algorithm has been used to optimize variables of sensitive bands, extract effective variables and build the PLSR model. In this way, the accuracy of prediction is improved.
Over the past two years, the detection of moisture content of wheat seeds based on hyperspectral in China has been carried out after harvest and after threshing. The main application of this method is for the storage and drying of wheat. Few Chinese researchers have focused on the detection of the moisture content of grain on field wheat plants before harvest. The WMC detection system designed by Xianming Xiong et al. took the method of near infrared three-wavelength method to study WMC after harvest and threshing. The authors summarized the light absorption rule of three different wavelengths combined the regression fitting method of cubic polynomial with five unknowns and built a mathematical model was 0.7691 [26]. After correction, the correlation coefficient was 0.7267. In the work of He Hongju et al, the authors mentioned that the correlation coefficients of prediction in the full-band PLS regression model (F-PLS) constructed by GFS (Gaussian filtering smoothing) pretreatment (100wavelengths) performed better. Their model predicted the correlation coefficient as RP = 0.927 [27]. Both of the above-mentioned correlation coefficients were less than R2C and R2P derived by the CARS algorithm-based model.
In this study, we detected the WMC based on the reflection spectrum of panicle before harvest in the field. First, we averaged the original spectrum was averaged. Second, we analyzed the correlation between the whole-band reflection spectrum and PMC. After the analysis, we determined 1103 sensitive bands. Third, we adopted the CARS algorithm to optimize variables. Finally, we determined 30 effective variables. Although the prediction of the PLRS model was rather accurate, some bands of the spectra from the wheat field were disturbed by the noise signal of the ASD spectrometer, water evaporation, and other factors. Disturbed bands were mainly concentrated in three spectral regions: 1358–1406 nm, 1814–1934 nm and 2438–2500 nm and some sensitive bands might be lost due to interference signals. To further improve the accuracy, we need to study the method to remove interference signals during the acquisition of spectral information.

Author Contributions

Conceived and designed the experiments: H.J. and W.W.; Performed the experiments: H.J., D.C. and B.Z.; Analyzed the data: H.J.; Wrote the paper: H.J. All authors have read and agreed to the published version of the manuscript.

Funding

This research was funded by China Agriculture Research System (CARS-03).

Acknowledgments

The authors acknowledge the China Agricultural University for support.

Conflicts of Interest

The authors declare no conflict of interest.

References

  1. Cao, F.F.; Huang, D.; Zhu, J.F.; Wu, L.P. The Wheat Harvest Loss and its Main Determinants in China: An Empirical Analysis Based on Survey Data from 1135 Households. J. China Rural Surv. 2018, 2, 75–87. [Google Scholar]
  2. Cao, F.; Zhu, J.F.; Guo, Y.; Liu, J.P.; Wu, L.P. Wheat harvest loss in China: Based on experiments and surveys in 5 cities of 4 provinces. J. Arid Land Resour. Environ. 2018, 32, 7–14. [Google Scholar]
  3. Yan, Y.L. Foundation and Application of Near Infrared Spectroscopy; China Light Industry Press: Beijing, China, 2005. [Google Scholar]
  4. Xue, Z.C.; Gao, H.Y.; Liu, J. Monitoring growth and grain yield of wheat in fields with different soil fertility levels and different fertilizer application using spectral reflectance technique. J. Triticeae Crop. 2011, 31, 136–142. [Google Scholar]
  5. Yuan, L. Identification and Differentiation of Wheat Diseases and Insects with Multi-Sourse and Multi-Scale Remote Sensing Data. Ph.D. Thesis, Zhejiang University, Hangzhou, China, 2015. [Google Scholar]
  6. Li, C.J. Study on the Technology of Monitoring Winter Wheat Grain Protein Content on Regional Scale by Remote Sensing. Ph.D. Thesis, Zhejiang University, Hangzhou, China, 2005. [Google Scholar]
  7. Huan, K.W.; Liu, X.X.; Zheng, F.; Cai, X.; Yu, S.; Shi, X. Variable selection of near-infrared spectroscopy for measuring wheat protein based on MC-LPG. Trans. CSAE 2013, 29, 266–271. [Google Scholar]
  8. Sun, J.; Cong, S.L.; Mao, H.P.; Wu, X.; Zhang, X.; Wang, P. CARS-ABC-SVR model for predicting leaf moisture of leaf-used lettuce based on hyperspectral. Trans. CSAE 2017, 33, 178–184. [Google Scholar]
  9. Li, Q.B. Study on Several Key Techniques of Near-Infrared Spectroscopy Analysis. Ph.D. Thesis, Tianjin University, Tianjin, China, 2002. [Google Scholar]
  10. Lu, C.X.; Jiang, X.P.; Zhang, Y.Q.; Zhang, X. Variable selection based near infrared spectroscopic quantitative analysis on wheat crude protein content. Trans. Chin. Soc. Agric. Mach. 2016, 47 (Suppl. S1), 340–346. [Google Scholar]
  11. Cai, L.H.; Ding, J.L. Wavelet transformation coupled with CARS algorithm improving prediction accuracy of soil moisture content based on hyperspectral reflectance. Trans. CSAE 2017, 33, 144–151. [Google Scholar]
  12. Li, J.B.; Peng, Y.K.; Chen, L.P.; Huang, W.Q. Near-Infrared hyperspectral imaging combined with CARS Algorithm to quantitatively determine soluble solids content in “Ya” pear. Spectrosc. Spectr. Anal. 2014, 34, 1264–1269. [Google Scholar]
  13. Sudhakar, S.; Francis, S.; Balaji, V. Odd Mean Labeling for Two Star Graph. Appl. Math. Nonlinear Sci. 2017, 2, 195–200. [Google Scholar] [CrossRef] [Green Version]
  14. Mi, C.; Shen, Y.; Mi, W.J.; Huang, Y.F. Ship Identification Algorithm Based on 3D Point Cloud for Automated Ship Loaders. J. Coast. Res. 2015, 73, 28–34. [Google Scholar] [CrossRef]
  15. Li, H.; Liang, Y.; Xu, Q.; Cao, D. Key wavelengths screening using competitive adaptive reweighted sampling method for multivariate calibration. Anal. Chim. Acta 2009, 648, 77–84. [Google Scholar] [CrossRef] [PubMed]
  16. Zhan, B.S.; Ni, J.H.; Li, J. Hyperspectral technology combined with CARS algorithm to quantitatively determine the SSC in Korla Fragrant Pear. Spectrosc. Spectr. Anal. 2014, 34, 2752–2757. [Google Scholar]
  17. Sun, T.; Xu, W.L.; Lin, J.L.; Liu, M.H.; He, X.W. Determination of soluble solids content in navel oranges by Vis/NIR diffuse transmission spectra combined with CARS method. Spectrosc. Spectr. Anal. 2012, 32, 3229–3233. [Google Scholar]
  18. Yu, L.; Zhu, Y.X.; Hong, Y.S.; Xia, T.; Liu, M.; Zhou, Y. Determination of soil moisture content by hyperspectral technology with CARS algorithm. Trans. CSAE 2016, 32, 138–145. [Google Scholar]
  19. Wu, J.Z.; Xu, Y. NIR quantitative model optimization of fatty acid inedible oil based on CARS-PLS. Trans. Chin. Soc. Agric. Mach. 2011, 42, 162–166. [Google Scholar]
  20. Yu, L.; Hong, Y.S.; Geng, L.; Zhou, Y.; Zhu, Q.; Cao, J.; Nie, Y. Hyperspectral estimation of soil organic matter content based on partial least squares regression. Trans. CSAE 2015, 31, 103–109. [Google Scholar]
  21. Liu, X.Y. Monitoring Models of Physiological Parameters of Corn and Farmland Soil Information Based on Hyper-Spectral Reflectance. Ph.D. Thesis, Northwest A&F University, Yangling, China, 2016. [Google Scholar]
  22. Butanda, J.A.; Málaga, C.; Plaza, R.G. On the Stabilizing Effect of Chemotaxis on Bacterial Aggregation Patterns. Appl. Math. Nonlinear Sci. 2017, 2, 157–172. [Google Scholar] [CrossRef] [Green Version]
  23. Liu, J.; Li, X.Y.; Li, P.W.; Wang, W.; Zhou, W.; Zhang, J. Determination of moisture in chestnuts using near infrared spectroscopy. Trans. CSAE 2010, 26, 338–341. [Google Scholar]
  24. Jin, H.; Li, L.; Cheng, J. Rapid and non-destructive determination of moisture content of peanut kernels using hyperspectral imaging technique. Food Anal. Methods 2015, 8, 1–9. [Google Scholar] [CrossRef]
  25. Gao, W.; Wang, W.F. The Fifth Geometric-Arithmetic Index of Bridge Graph and Carbon Nanocones. J. Differ. Equ. Appl. 2017, 23, 100–109. [Google Scholar] [CrossRef] [Green Version]
  26. Xiong, X.M.; Wang, X.M.; Zhang, W.T.; Nie, J.Y.; Tang, Y.W. Design of wheat moisture content detection system based on three-wavelength near-infrared method. Jiangsu Agric. Sci. 2016, 44, 390–393. [Google Scholar]
  27. He, H.J.; Wang, Y.L.; Qiao, H.; Ou, H.Q.; Liu, H.; Wang, H.; Zhu, Y.D.; Jiang, S.Q. Rapid non-contact evaluation of wheat grain moisture content based on long-wave near-infrared spectroscopy. J. Hainan Norm. Univ. 2019, 32, 26–32. [Google Scholar]
Figure 1. Logarithm regression of WMC and PMC.
Symmetry 12 00115 g001
Figure 2. Comparison between measured and predicted WMC.
Symmetry 12 00115 g002
Figure 3. Visible and near-infrared spectra of wheat panicle.
Symmetry 12 00115 g003
Figure 4. Correlation between spectral reflectivity and PMC.
Symmetry 12 00115 g004
Figure 5. Variable filtering process by competitive adaptive reweighted sampling (CARS).
Symmetry 12 00115 g005
Figure 6. Correlation between measured WMC and predicted WMC by sensitive band-CARS-PLSR model.
Symmetry 12 00115 g006
Table 1. Moisture content of wheat and panicle samples.
Sample SetSample SizeWheat Moisture Content/%Panicle Moisture Content/%
Minimum ValueMaximum ValueAverage VauleStandard DeviationMinimum ValueMaximumvalueAverage VauleStandard Deviation
Modeling set3011.8242.9529.629.725.8540.5221.5311.82
Testing set1411.7942.3526.9411.855.8540.5220.0714.25
Table 2. Regression models and performance of WMC based on PMC.
ModelRegression EquationModeling SetValidation Set
FR2vRMSEvREv/%
Exponentioly = 14.839e0.0291x0.770493.9690.94220.34220.466
Logarithmy = 14.587ln(x) − 12.550.9284362.9570.9873.8597.532
Lineary = 0.766x + 13.1340.8677183.5760.96312.19817.365
Polynomialy = −0.0201x2 + 1.6769x + 5.55040.9158146.8840.9825.4269.972
Powery = 5.2698x0.57460.8876221.1780.9776.94611.102
Note: R2 represents the determination coefficient of calibration; F represents the significance of regression equation; R2v represents the determination coefficient of validation model; RMSEv represents the root mean square error of validation; REv represents the relative error of validation.
Table 3. Results of estimation for PMC.
Variable Selection MethodsVariable NumberCalibration SetsPrediction Sets
RMSECR2cRMSEPR2pRPD
sensitive band -PLSR11037.6120.6689.8030.8431.140
sensitive band -CARS-PLRS300.93010.9952.6760.9453.362
Note: As can be seen in the table, “sensitive band-PLSR” represents the partial least squares model of the selected sensitive band, while “sensitive band-CARS-PLRS” represents the partial least squares model of variables optimized by CARS algorithm.

