Quantifying Differences among Ten Fingers in Force Control Capabilities by a Modified Meyer Model


Abstract
1. Introduction
- The differences among all ten fingers in force control capabilities were revealed and characterized quantitatively.
- A modified Meyer model was proposed for quantifying and comparing the difference between ten fingers in the performance of SAT in the discrete force control tasks.
2. Materials and Methods
2.1. Subjects
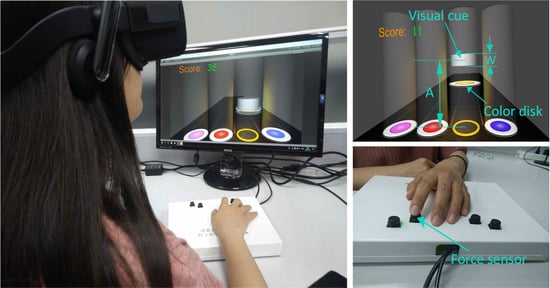
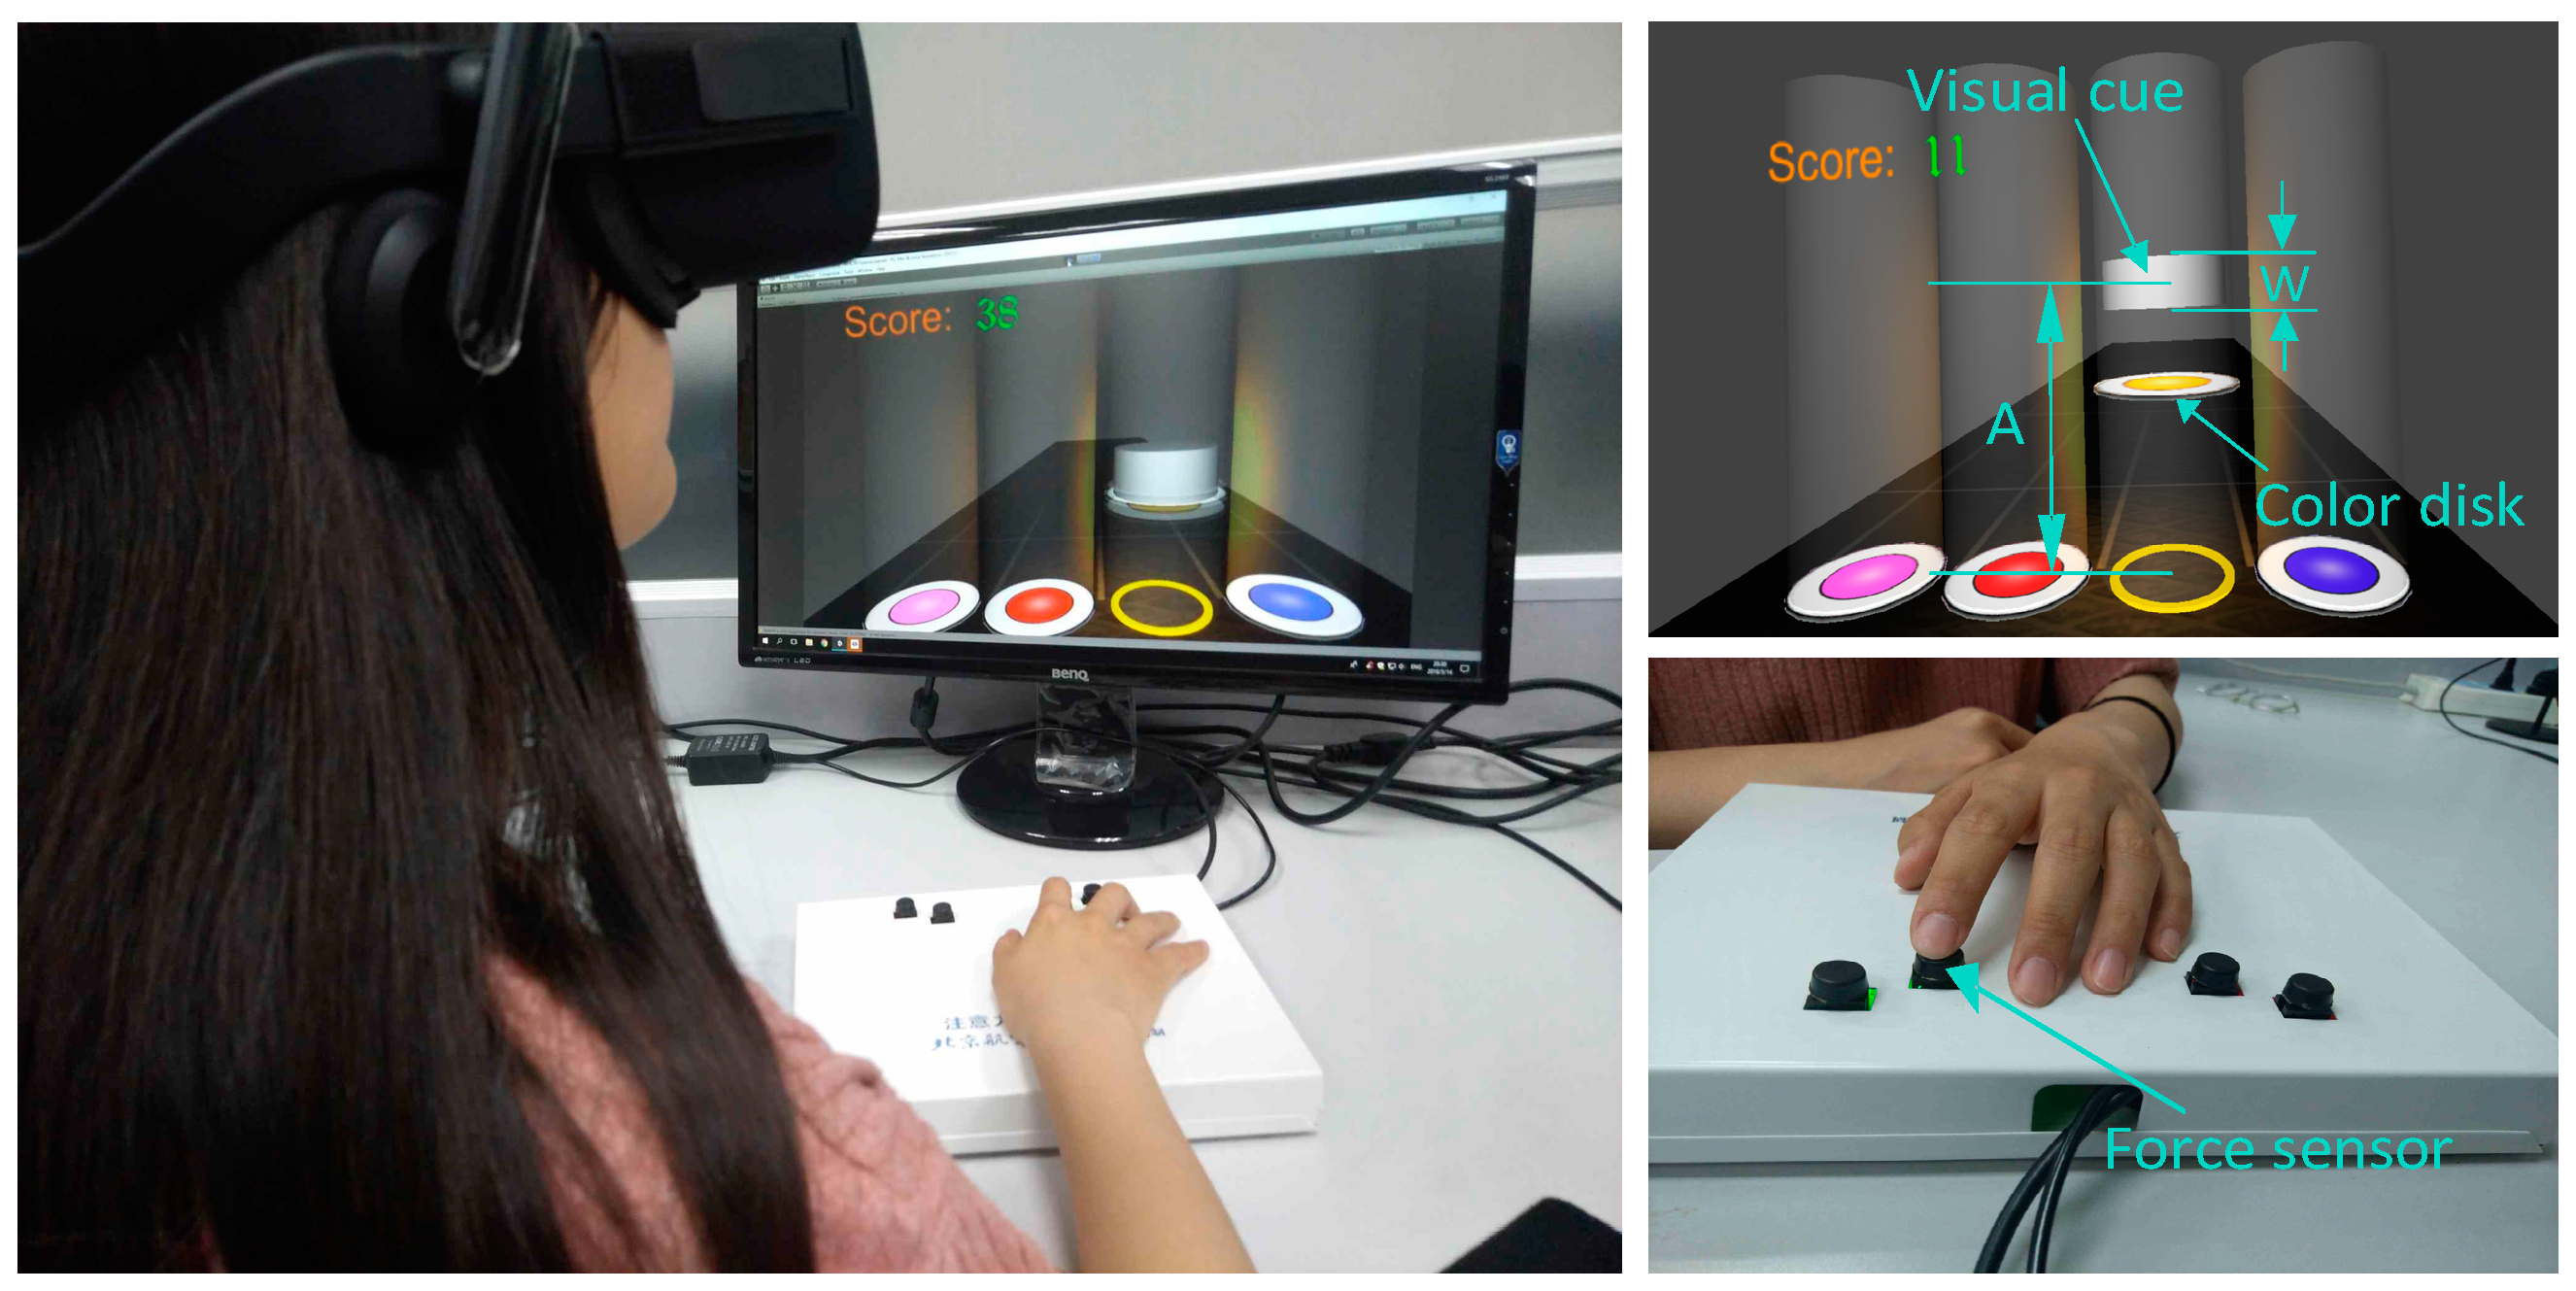
2.2. Apparatus
2.3. Single-Finger Force Control Tasks
2.4. Procedures
2.5. Data Analysis and Statistics
3. Results
3.1. Quantifying the Differences of All Ten Fingers with Characteristics of the Original Meyer Model
3.1.1. Differences in Reaction Time
3.1.2. Differences in Index of Performance
3.1.3. Differences in Goodness of Fit
3.2. Quantifying Differences of All Ten Fingers with a Modified Meyer Model and Its’ Characteristics
3.2.1. Modified Meyer Model
3.2.2. Index of Performance and Goodness of Fit in the Modified Meyer Model
3.2.3. Regression Analysis in the Modified Meyer Model
3.2.4. Paired Comparison among all Ten Fingers
4. Discussion
5. Conclusions
Author Contributions
Funding
Conflicts of Interest
References
- Jones, L.A.; Lederman, S.J. Human Hand Function; Oxford University Press: New York, NY, USA, 2006; pp. 131–149. [Google Scholar]
- Aoki, T.; Francis, P.R.; Kinoshita, H. Differences in the abilities of individual fingers during the performance of fast, repetitive tapping movements. Exp. Brain Res. 2003, 152, 270–280. [Google Scholar] [CrossRef]
- Billon, M.; Bootsma, R.J.; Mottet, D. The dynamics of human isometric pointing movements under varying accuracy requirements. Neurosci. Lett. 2000, 286, 49–52. [Google Scholar] [CrossRef]
- Kornblum, S. Response competition and/or inhibition in two-choice reaction time. Psychon. Sci. 1965, 2, 55–56. [Google Scholar] [CrossRef][Green Version]
- Gatewood, E.L. Individual differences in finger reactions. Psychol. Monogr. Gen. Appl. 1920, 28, 1–43. [Google Scholar] [CrossRef][Green Version]
- Bhatnagar, M.; Jain, R.K.; Khairnar, N.S. A Survey on Behavioral Biometric Techniques: Mouse vs. Keyboard Dynamics. Int. J. Comput. Appl. 2013, 975, 27–30. [Google Scholar]
- Martin, B.J.; Natarajan, S.; Klinenberg, E.; Serina, E.; Armstrong, T.J.; Foulke, J.A.; Rempel, D. Keyboard Reaction Force and Finger Flexor Electromyograms during Computer Keyboard Work. Hum. Factors J. Hum. Factors Ergon. Soc. 1996, 38, 654–664. [Google Scholar] [CrossRef] [PubMed]
- Findlater, L.; Wobbrock, J. Personalized input: Improving ten-finger touchscreen typing through automatic adaptation. In Proceedings of the SIGCHI Conference on Human Factors in Computing Systems, Seattle, WA, USA, 5–10 May 2012; ACM: New York, NY, USA, 2012; pp. 815–824. [Google Scholar]
- Zhai, S.; Hunter, M.; Smith, B. Performance Optimization of Virtual Keyboards. Hum.-Comput. Interact. 2002, 17, 229–269. [Google Scholar]
- Sears, A. Improving touchscreen keyboards: Design issues and a comparison with other devices. Interact. Comput. 1991, 3, 253–269. [Google Scholar] [CrossRef]
- Corsten, C.; Lahaye, M.; Borchers, J.; Voelker, S. ForceRay: Extending Thumb Reach via Force Input Stabilizes Device Grip for Mobile Touch Input. In Proceedings of the 2019 CHI Conference on Human Factors in Computing Systems, Glasgow, Scotland, UK, 4–9 May 2019; ACM: New York, NY, USA, 2019; pp. 1–12. [Google Scholar]
- Zhong, M.; Yu, C.; Wang, Q.; Xu, X.; Shi, Y. ForceBoard: Subtle Text Entry Leveraging Pressure. In Proceedings of the 2018 CHI Conference on Human Factors in Computing Systems, Montreal, QC, Canada, 21–26 April 2018; pp. 1–10. [Google Scholar]
- Karrenbauer, A.; Oulasvirta, A. Improvements to keyboard optimization with integer programming. In Proceedings of the ACM Symposium on User Interface Software and Technology, Honolulu, HI, USA, 5–8 October 2014; pp. 621–626. [Google Scholar]
- Wu, C.-M.; Smith, S. A haptic keypad design with a novel interactive haptic feedback method. J. Eng. Des. 2015, 26, 169–186. [Google Scholar] [CrossRef]
- Bufton, M.J.; Marklin, R.W.; Nagurka, M.L.; Simoneau, G.G. Effect of keyswitch design of desktop and notebook keyboards related to key stiffness and typing force. Ergonomics 2006, 49, 996–1012. [Google Scholar] [CrossRef]
- Gerard, M.J.; Armstrong, T.J.; Foulke, J.A.; Martin, B.J. Effects of Key Stiffness on Force and the Development of Fatigue While Typing. Am. Ind. Hyg. Assoc. J. 1996, 57, 849–854. [Google Scholar] [CrossRef] [PubMed]
- Moore, A.W.; Gruber, T.; Derose, J.; Malinowski, P. Regular, brief mindfulness meditation practice improves electrophysiological markers of attentional control. Front. Hum. Neurosci. 2012, 6, 1–15. [Google Scholar] [CrossRef] [PubMed]
- Peng, C.; Wang, D.; Zhang, Y.; Xiao, J. A Visuo-Haptic Attention Training Game with Dynamic Adjustment of Difficulty. IEEE Access. 2019, 7, 68878–68891. [Google Scholar] [CrossRef]
- Latash, M.; Scholz, J.; Danion, F.; Schöner, G. Structure of motor variability in marginally redundant multifinger force production tasks. Exp. Brain Res. 2001, 141, 153–165. [Google Scholar] [CrossRef] [PubMed]
- Zatsiorsky, V.M.; Li, Z.-M.; Latash, M.L. Enslaving effects in multi-finger force production. Exp. Brain Res. 2000, 131, 187–195. [Google Scholar] [CrossRef] [PubMed]
- Cuadra, C.; Bartsch, A.; Tiemann, P.; Reschechtko, S.; Latash, M.L. Multi-finger synergies and the muscular apparatus of the hand. Exp. Brain Res. 2018, 236, 1383–1393. [Google Scholar] [CrossRef]
- Lee, M.; Lee, J.; Shin, J.; Bae, J. Evaluation of Finger Force Control Ability in Terms of Multi-Finger Synergy. IEEE Trans. Neural Syst. Rehabil. Eng. 2019, 27, 1253–1262. [Google Scholar] [CrossRef]
- Kjnoshita, H.; Kawai, S.; Ikuta, K. Contributions and co-ordination of individual fingers in multiple finger prehension. Ergonomics. 1995, 38, 1212–1230. [Google Scholar] [CrossRef]
- Kong, Y.-K.; Park, H.; Kim, D.; Lee, T.; Roh, E.; Lee, S.; Zhao, W.; Kim, D.-M.; Kang, H.-S. A Study on the Difference of Total Grip Strength and Individual Finger Force between Dominant and Non-dominant Hands in Various Grip Spans of Pliers. J. Ergon. Soc. Korea. 2013, 32, 503–509. [Google Scholar] [CrossRef]
- Salmoni, A.W.; McIlwain, J.S. Fitts’ Reciprocal Tapping Task, a Measure of Motor Capacity? Percept. Mot. Sk. 1979, 49, 403–413. [Google Scholar] [CrossRef]
- Christe, B.; Burkhard, P.R.; Pegna, A.J.; Mayer, E.; Hauert, C.-A. Clinical Assessment of Motor Function: A Processes Oriented Instrument Based on a Speed-Accuracy Trade-Off Paradigm. Behav. Neurol. 2007, 18, 19–29. [Google Scholar] [CrossRef] [PubMed]
- Gorniak, S.L.; Duarte, M.; Latash, M.L. Do synergies improve accuracy? A study of speed-accuracy trade-offs during finger force production. Mot. Control. 2008, 12, 151–172. [Google Scholar] [CrossRef]
- Li, T.; Wang, D.; Peng, C.; Yu, C.; Zhang, Y. Speed-accuracy tradeoff of fingertip force control with visual/audio/haptic feedback. Int. J. Hum.-Comput. Stud. 2018, 110, 33–44. [Google Scholar] [CrossRef]
- Meyer, D.E.; Smith, J.E.K.; Kornblum, S.; Abrams, R.A.; Wright, C.E. Speed Accuracy Tradeoffs in Aimed Movements—Toward a Theory of Rapid Voluntary Action. Atten. Perform. 1990, 4, 173–226. [Google Scholar]
- Soukoreff, R.W.; MacKenzie, I.S. Towards a standard for pointing device evaluation, perspectives on 27 years of Fitts’ law research in HCI. Int. J. Hum.-Comput. Stud. 2004, 61, 751–789. [Google Scholar] [CrossRef]
- Irwin, C.B.; Duff, S.N.; Skye, J.L.; Wiegmann, D.A.; Sesto, M.E. Disability and Orientation-Specific Performance during a Reciprocal Tapping Task. In Proceedings of the Human Factors and Ergonomics Society Annual Meeting, San Francisco, CA, USA, 27 September–1 October 2010; pp. 581–585. [Google Scholar]
- Goodgold-Edwards, S.A.; Beshere, N.; Murphy, K.; MacNeil, D.; Daoust, B. Cognitive Strategies During a Reciprocal Tapping Task. Phys. Occup. Ther. Pediatr. 1997, 17, 1–19. [Google Scholar] [CrossRef]
- Fitts, P.M. The information capacity of the human motor system in controlling the amplitude of movement. J. Exp. Psychol. 1954, 47, 381–391. [Google Scholar] [CrossRef] [PubMed]
- Wright, C.E.; Lee, F. Issues Related to HCI Application of Fitts’s Law. Hum.-Comput. Interact. 2013, 28, 548–578. [Google Scholar] [CrossRef]
- Zhai, S.M. Characterizing computer input with Fitts’ law parameters—The information and non-information aspects of pointing. Int. J. Hum.-Comput. Stud. 2004, 61, 791–809. [Google Scholar] [CrossRef]
- Peng, C.; Wang, D.; Zhang, Y.; Li, T. Quantifying differences between five fingers in speed-accuracy tradeoff for force control tasks. In Proceedings of the 2017 IEEE World Haptics Conference (WHC), Munich, Germany, 6–9 June 2017; pp. 275–280. [Google Scholar]
- Bongers, R.M.; Fernandez, L.; Bootsma, R.J. Linear and logarithmic speed–accuracy trade-offs in reciprocal aiming result from task-specific parameterization of an invariant underlying dynamics. J. Exp. Psychol. Hum. Percept. Perform. 2009, 35, 1443–1457. [Google Scholar] [CrossRef]
- Esterman, M.; Noonan, S.K.; Rosenberg, M.; Degutis, J. In the zone or zoning out? Tracking behavioral and neural fluctuations during sustained attention. Cereb. Cortex. 2013, 23, 2712–2723. [Google Scholar] [CrossRef] [PubMed]
- Teather, R.J.; Natapov, D.; Jenkin, M. Evaluating haptic feedback in virtual environments using ISO 9241–9. In Proceedings of the 2010 IEEE Virtual Reality Conference (VR), Waltham, MA, USA, 20–24 March 2010; pp. 307–308. [Google Scholar]
- Bonneviale, C.; Thon, B. Two-choice reaction time as a function of finger, finger pairing and foreperiod duration. Eur. Bull. Cognit. Psychol. 1990, 10, 251–267. [Google Scholar]
- Miller, J. Discrete versus continuous stage models of human information processing: In search of partial output. J. Exp. Psychol. Hum. Percept. Perform. 1982, 8, 273–296. [Google Scholar] [CrossRef] [PubMed]
- Schieber, M.H.; Poliakov, A.V. Partial Inactivation of the Primary Motor Cortex Hand Area: Effects on Individuated Finger Movements. J. Neurosci. 1998, 18, 9038–9054. [Google Scholar] [CrossRef] [PubMed]
- Schieber, M. Muscular production of individuated finger movements: The roles of extrinsic finger muscles. J. Neurosci. 1995, 15, 284–297. [Google Scholar] [CrossRef] [PubMed]
- Szychlinska, M.A.; Dullaert, K.; Beumer, A.; Nsir, H.; Guglielmino, C.; Mazzone, V.; Giunta, S. Ergonomics of Prehensility in Pushing and Pulling Motions: An Anatomical and Biomechanical Overview. J. Funct. Morphol. Kinesiol. 2017, 2, 6. [Google Scholar] [CrossRef]
- Meyer, D.E.; Abrams, R.A.; Kornblum, S.; Wright, C.E.; Al, E. Optimality in human motor performance: Ideal control of rapid aimed movements. Psychol. Rev. 1988, 95, 340–370. [Google Scholar] [CrossRef]
- Antal, M.; Szabó, L.Z.; László, I. Keystroke Dynamics on Android Platform. Procedia Technol. 2015, 19, 820–826. [Google Scholar] [CrossRef]
- Roy, Q.; Guiard, Y.; Bailly, G.; Lecolinet, É.; Rioul, O. Glass + Skin: An Empirical Evaluation of the Added Value of Finger Identification to Basic Single-Touch Interaction on Touch Screens. In Proceedings of the Ifip Tc.13 International Conference on Human-Computer Interaction, Bamberg, Germany, 14–18 September 2015; pp. 55–71. [Google Scholar]
- Goguey, A.; Vogel, D.; Chevalier, F.; Pietrzak, T.; Roussel, N.; Casiez, G. Leveraging Finger Identification to Integrate Multi-touch Command Selection and Parameter Manipulation. Int. J. Hum.-Comput. Stud. 2016, 99, 21–36. [Google Scholar] [CrossRef]
- Orozco, M.; Asfaw, Y.; Shirmohammadi, S.; Adler, A.; El Saddik, A. Haptic-based biometrics: A feasibility study. In Proceedings of the 2006 14th Symposium on Haptic Interfaces for Virtual Environment and Teleoperator Systems, Arlington, VA, USA, 25–26 March 2006; pp. 265–271. [Google Scholar]
- Ali, M.L.; Monaco, J.V.; Tappert, C.C.; Qiu, M. Keystroke Biometric Systems for User Authentication. J. Signal Process. Syst. 2016, 86, 175–190. [Google Scholar] [CrossRef]
- Mayer, N.H. Clinicophysiologic concepts of spasticity and motor dysfunction in adults with an upper motoneuron lesion. Muscle Nerve. 1997, 20, 1–14. [Google Scholar] [CrossRef]
- Liu, X.; Zhu, Y.; Huo, H.; Wei, P.; Wang, L.; Sun, A.; Hu, C.; Yin, X.; Lv, Z.; Fan, Y. Design of Virtual Guiding Tasks with Haptic Feedback for Assessing the Wrist Motor Function of Patients with Upper Motor Neuron Lesions. IEEE Trans. Neural Syst. Rehabil. Eng. 2019, 27, 984–994. [Google Scholar] [CrossRef] [PubMed]
- Yokoe, M.; Okuno, R.; Hamasaki, T.; Kurachi, Y.; Akazawa, K.; Sakoda, S. Opening velocity, a novel parameter, for finger tapping test in patients with Parkinson’s disease. Park. Relat. Disord. 2009, 15, 440–444. [Google Scholar] [CrossRef] [PubMed]
- Tavares, A.L.T.; Jefferis, G.S.; Koop, M.; Hill, B.C.; Hastie, T.; Heit, G.; Bronte-Stewart, H.M. Quantitative measurements of alternating finger tapping in Parkinson’s disease correlate with UPDRS motor disability and reveal the improvement in fine motor control from medication and deep brain stimulation. Mov. Disord. 2005, 20, 1286–1298. [Google Scholar] [CrossRef] [PubMed]


| A and W | ID | LL | LR | LM | LI | LT | RT | RI | RM | RR | RL |
|---|---|---|---|---|---|---|---|---|---|---|---|
| 1&0.2 | 2.236 | 0.610 (0.318) | 0.592 (0.279) | 0.540 (0.257) | 0.574 (0.285) | 0.653 (0.374) | 0.641 (0.331) | 0.582 (0.306) | 0.585 (0.308) | 0.605 (0.293) | 0.686 (0.332) |
| 1&0.3 | 1.826 | 0.520 (0.249) | 0.474 (0.247) | 0.467 (0.254) | 0.505 (0.272) | 0.530 (0.305) | 0.513 (0.265) | 0.438 (0.229) | 0.455 (0.250) | 0.451 (0.238) | 0.521 (0.274) |
| 1&0.5 | 1.414 | 0.361 (0.199) | 0.347 (0.181) | 0.337 (0.187) | 0.387 (0.191) | 0.379 (0.207) | 0.356 (0.189) | 0.325 (0.175) | 0.341 (0.177) | 0.340 (0.175) | 0.385 (0.202) |
| 1&0.7 | 1.195 | 0.323 (0.165) | 0.321 (0.200) | 0.286 (0.154) | 0.315 (0.161) | 0.307 (0.167) | 0.313 (0.159) | 0.293 (0.169) | 0.283 (0.154) | 0.300 (0.156) | 0.319 (0.171) |
| 1&0.8 | 1.118 | 0.294 (0.147) | 0.285 (0.147) | 0.284 (0.136) | 0.309 (0.166) | 0.283 (0.140) | 0.301 (0.172) | 0.274 (0.157) | 0.276 (0.149) | 0.284 (0.151) | 0.301 (0.170) |
| 2&0.2 | 3.162 | 0.744 (0.338) | 0.667 (0.309) | 0.636 (0.277) | 0.664 (0.292) | 0.703 (0.321) | 0.684 (0.273) | 0.649 (0.290) | 0.633 (0.275) | 0.729 (0.301) | 0.784 (0.359) |
| 2&0.3 | 2.582 | 0.606 (0.268) | 0.558 (0.238) | 0.521 (0.254) | 0.518 (0.240) | 0.596 (0.261) | 0.591 (0.282) | 0.542 (0.265) | 0.551 (0.243) | 0.564 (0.244) | 0.666 (0.348) |
| 2&0.5 | 2.000 | 0.487 (0.247) | 0.456 (0.232) | 0.417 (0.204) | 0.398 (0.175) | 0.441 (0.189) | 0.438 (0.230) | 0.410 (0.206) | 0.400 (0.202) | 0.486 (0.211) | 0.493 (0.229) |
| 2&0.7 | 1.690 | 0.416 (0.196) | 0.405 (0.208) | 0.371 (0.177) | 0.372 (0.176) | 0.368 (0.168) | 0.352 (0.170) | 0.348 (0.194) | 0.345 (0.163) | 0.386 (0.172) | 0.432 (0.207) |
| 2&0.8 | 1.581 | 0.380 (0.190) | 0.384 (0.174) | 0.327 (0.164) | 0.353 (0.181) | 0.364 (0.177) | 0.325 (0.149) | 0.322 (0.162) | 0.335 (0.166) | 0.382 (0.190) | 0.378 (0.186) |
| 3&0.2 | 3.873 | 1.065 (0.424) | 0.939 (0.351) | 0.827 (0.382) | 0.805 (0.322) | 0.907 (0.416) | 0.896 (0.373) | 0.769 (0.298) | 0.788 (0.331) | 0.924 (0.351) | 0.949 (0.406) |
| 3&0.3 | 3.162 | 0.781 (0.365) | 0.717 (0.281) | 0.641 (0.263) | 0.661 (0.264) | 0.710 (0.300) | 0.679 (0.311) | 0.631 (0.278) | 0.627 (0.263) | 0.705 (0.282) | 0.812 (0.415) |
| 3&0.5 | 2.450 | 0.619 (0.257) | 0.613 (0.283) | 0.527 (0.206) | 0.506 (0.212) | 0.519 (0.218) | 0.565 (0.274) | 0.509 (0.221) | 0.512 (0.227) | 0.566 (0.263) | 0.626 (0.261) |
| 3&0.7 | 2.070 | 0.537 (0.211) | 0.500 (0.205) | 0.450 (0.197) | 0.464 (0.212) | 0.447 (0.200) | 0.443 (0.189) | 0.430 (0.194) | 0.457 (0.205) | 0.516 (0.215) | 0.524 (0.229) |
| 3&0.8 | 1.937 | 0.534 (0.212) | 0.476 (0.199) | 0.450 (0.188) | 0.453 (0.199) | 0.441 (0.191) | 0.423 (0.179) | 0.439 (0.212) | 0.423 (0.186) | 0.466 (0.195) | 0.538 (0.284) |
| Hand | Fingers | a | b | R2 | IP (Bits/s) |
|---|---|---|---|---|---|
| Left | Little | 0.0044 | 0.2542 | 0.9632 | 3.9343 |
| Ring | 0.0495 | 0.2165 | 0.9602 | 4.6193 | |
| Middle | 0.0659 | 0.1886 | 0.9624 | 5.3022 | |
| Index | 0.1078 | 0.1755 | 0.9243 | 5.6984 | |
| Thumb | 0.0480 | 0.2145 | 0.9171 | 4.6625 | |
| Right | Thumb | 0.0466 | 0.2112 | 0.9168 | 4.7344 |
| Index | 0.0704 | 0.1829 | 0.9471 | 5.4685 | |
| Middle | 0.0726 | 0.1834 | 0.9412 | 5.4530 | |
| Ring | 0.0347 | 0.2225 | 0.9751 | 4.4943 | |
| Little | 0.0444 | 0.2400 | 0.9639 | 4.1672 |
| Hand | Fingers | b | R2 | IP (bits/s) |
|---|---|---|---|---|
| Left | Little | 0.2513 | 0.9630 | 3.9788 |
| Ring | 0.2181 | 0.9602 | 4.5847 | |
| Middle | 0.1832 | 0.9613 | 5.4576 | |
| Index | 0.1876 | 0.9180 | 5.3296 | |
| Thumb | 0.2140 | 0.9171 | 4.6737 | |
| Right | Thumb | 0.2079 | 0.9165 | 4.8108 |
| Index | 0.1768 | 0.9456 | 5.6574 | |
| Middle | 0.1789 | 0.9404 | 5.5892 | |
| Ring | 0.2188 | 0.9747 | 4.5709 | |
| Little | 0.2528 | 0.9599 | 3.9561 |
| Fingers | LL | LR | LM | LI | LT | RT | RI | RM | RR | RL |
|---|---|---|---|---|---|---|---|---|---|---|
| LL | 1.0000 | 1.1523 | 1.3717 | 1.3395 | 1.1746 | 1.2091 | 1.4219 | 1.4047 | 1.1488 | 0.9943 |
| LR | 0.8678 | 1.0000 | 1.1904 | 1.1625 | 1.0194 | 1.0493 | 1.2340 | 1.2191 | 0.9970 | 0.8629 |
| LM | 0.7290 | 0.8401 | 1.0000 | 0.9765 | 0.8564 | 0.8815 | 1.0366 | 1.0241 | 0.8375 | 0.7249 |
| LI | 0.7466 | 0.8602 | 1.0240 | 1.0000 | 0.8769 | 0.9027 | 1.0615 | 1.0487 | 0.8577 | 0.7423 |
| LT | 0.8513 | 0.9810 | 1.1677 | 1.1403 | 1.0000 | 1.0293 | 1.2105 | 1.1959 | 0.9780 | 0.8465 |
| RT | 0.8271 | 0.9530 | 1.1345 | 1.1078 | 0.9715 | 1.0000 | 1.1760 | 1.1618 | 0.9501 | 0.8223 |
| RI | 0.7033 | 0.8104 | 0.9647 | 0.9421 | 0.8261 | 0.8504 | 1.0000 | 0.9879 | 0.8080 | 0.6993 |
| RM | 0.7119 | 0.8203 | 0.9765 | 0.9535 | 0.8362 | 0.8607 | 1.0122 | 1.0000 | 0.8178 | 0.7078 |
| RR | 0.8705 | 1.0030 | 1.1940 | 1.1660 | 1.0225 | 1.0525 | 1.2377 | 1.2228 | 1.0000 | 0.8655 |
| RL | 1.0057 | 1.1589 | 1.3796 | 1.3472 | 1.1814 | 1.2161 | 1.4300 | 1.4128 | 1.1554 | 1.0000 |
© 2019 by the authors. Licensee MDPI, Basel, Switzerland. This article is an open access article distributed under the terms and conditions of the Creative Commons Attribution (CC BY) license (http://creativecommons.org/licenses/by/4.0/).
Share and Cite
Peng, C.; Wang, D.; Zhang, Y. Quantifying Differences among Ten Fingers in Force Control Capabilities by a Modified Meyer Model. Symmetry 2019, 11, 1109. https://doi.org/10.3390/sym11091109
Peng C, Wang D, Zhang Y. Quantifying Differences among Ten Fingers in Force Control Capabilities by a Modified Meyer Model. Symmetry. 2019; 11(9):1109. https://doi.org/10.3390/sym11091109
Chicago/Turabian StylePeng, Cong, Dangxiao Wang, and Yuru Zhang. 2019. "Quantifying Differences among Ten Fingers in Force Control Capabilities by a Modified Meyer Model" Symmetry 11, no. 9: 1109. https://doi.org/10.3390/sym11091109
APA StylePeng, C., Wang, D., & Zhang, Y. (2019). Quantifying Differences among Ten Fingers in Force Control Capabilities by a Modified Meyer Model. Symmetry, 11(9), 1109. https://doi.org/10.3390/sym11091109