Composite Quantile Regression for Varying Coefficient Models with Response Data Missing at Random


Abstract
1. Introduction
- A composite quantile regression estimation (CQRE) method is proposed for the analysis of varying coefficient models with response data missing at random. This method has the following two advantages: (1) the CQRE method can effectively overcome not only the drawback of a relative small efficiency that may result from a single quantile regression procedure compared with the least-squares regression, but also the interference of non-normal error; hence, it improves its estimation efficiency significantly; (2) since different quantiles are used in the imputation instead of actually observed responses or means and the robustness of quantile regression is inherited, the CQRE method is less sensitive to outliers; thus, the CQRE method is more effective and robust than the single quantile regression method and the classical least squares method.
- Three estimators including the weighted local linear CQR (WLLCQR) estimator, the nonparametric WLLCQR (NWLLCQR) estimator, and the imputed WLLCQR (IWLLCQR) estimator are proposed for an unknown coefficient function in the varying coefficient model to establish the asymptotic normality of these estimators under some mild conditions.
2. Estimation Based on the CQR Varying Coefficient Model With Missing Response
2.1. WLLCQR Estimation
2.2. Nonparametric WLLCQR Estimation
2.3. Imputed WLLCQR Estimation
3. Asymptotic Properties
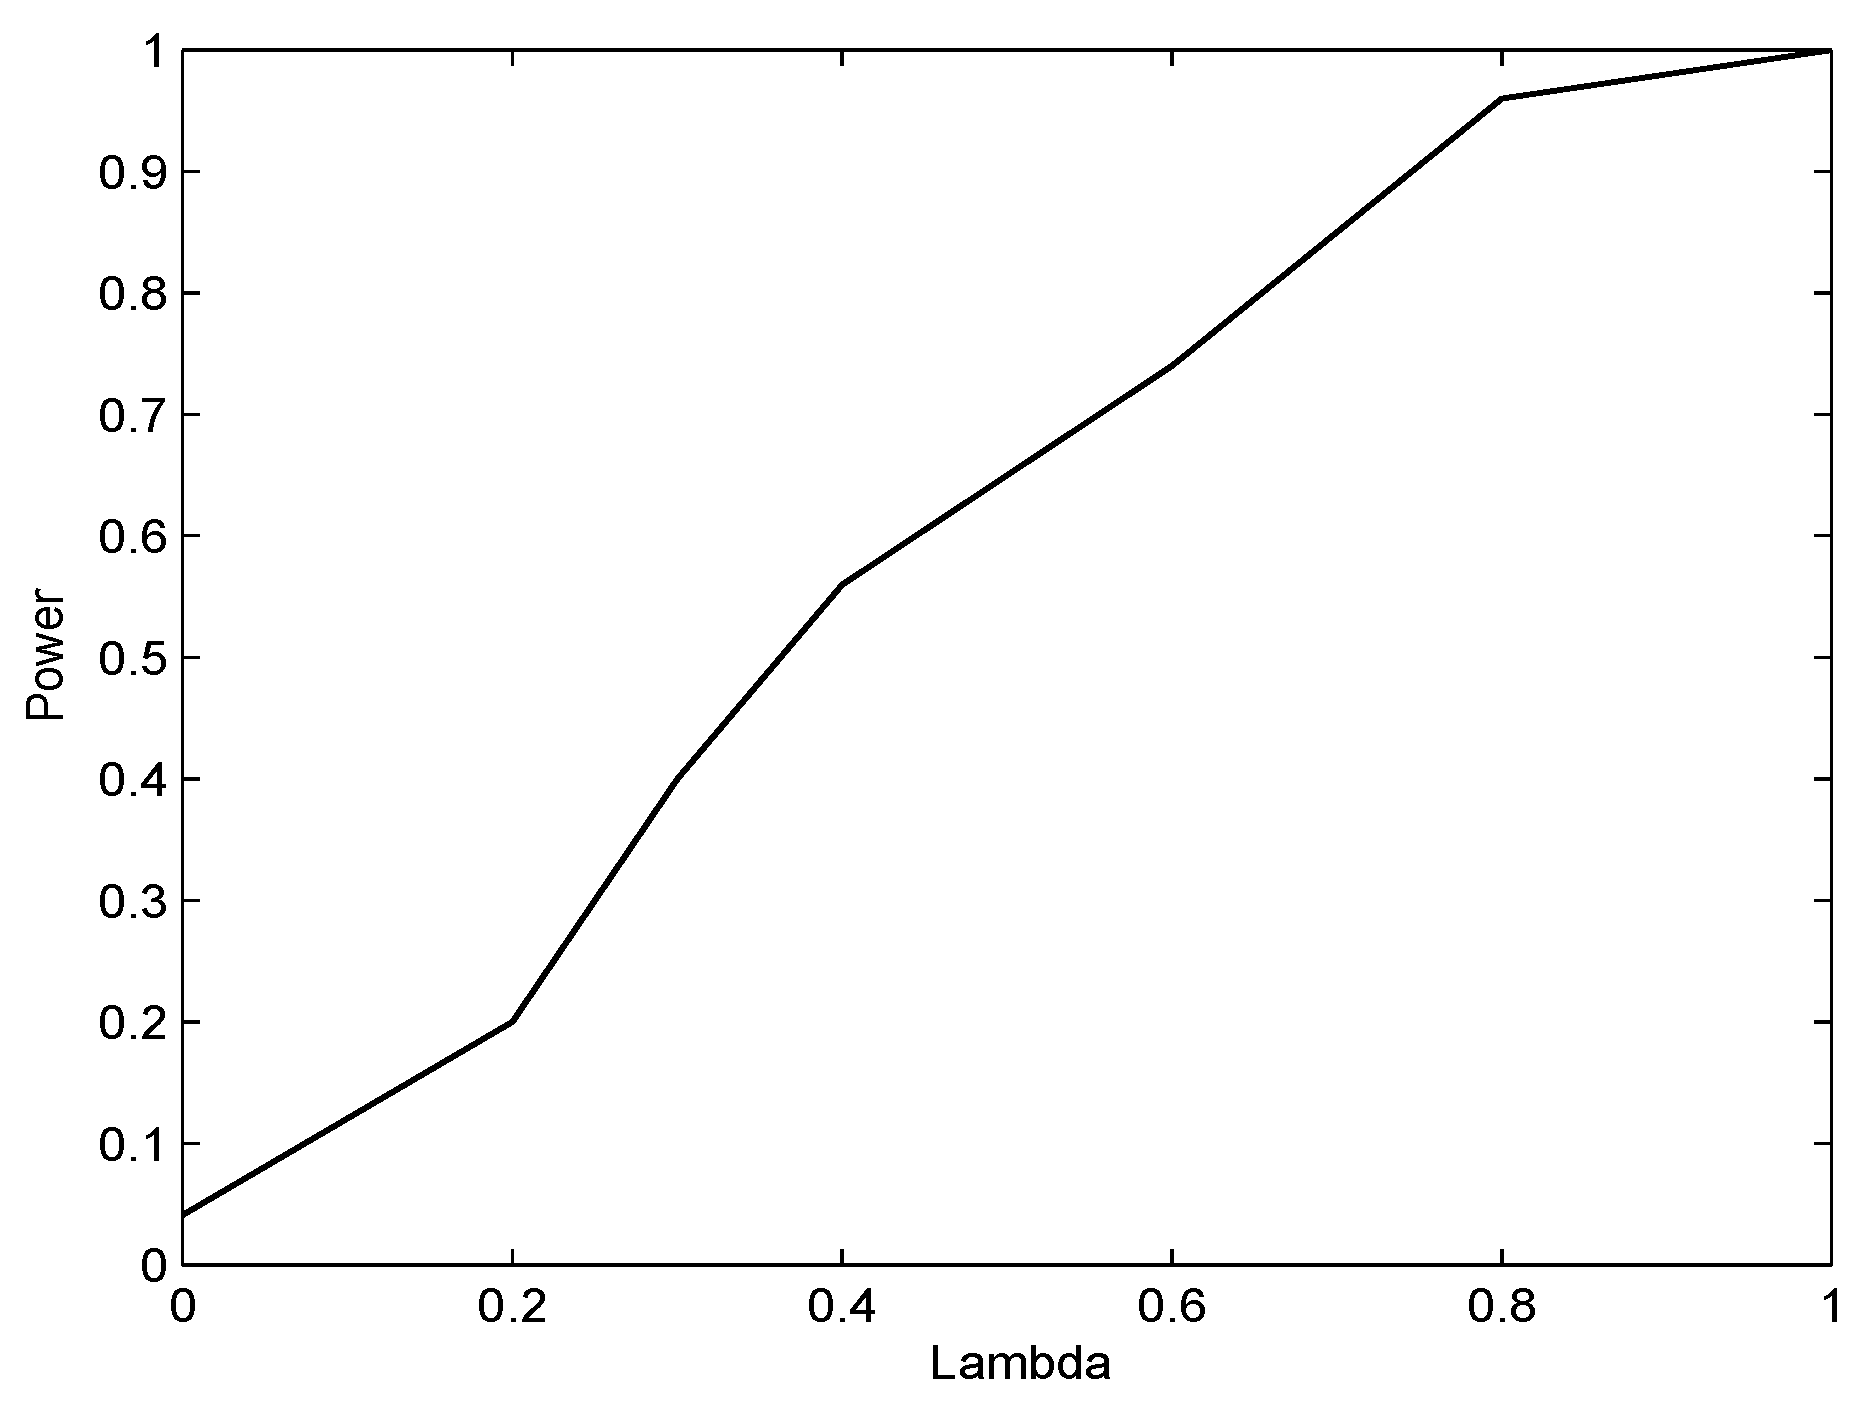
4. A Bootstrap-Based Goodness-of-Fit Test
- Step 1.
- Assume the number of complete data is m. We get the IWLLCQR estimator .
- Step 2.
- The bootstrap residuals are generated from series , where:
- Step 3.
- Step 2 is repeated for M times, and then, series sets are obtained for . The bootstrap test statistic is calculated for each bootstrap sample , denoted by .
- Step 4.
- The p value is approximately estimated by , where S is the cardinality of the set .
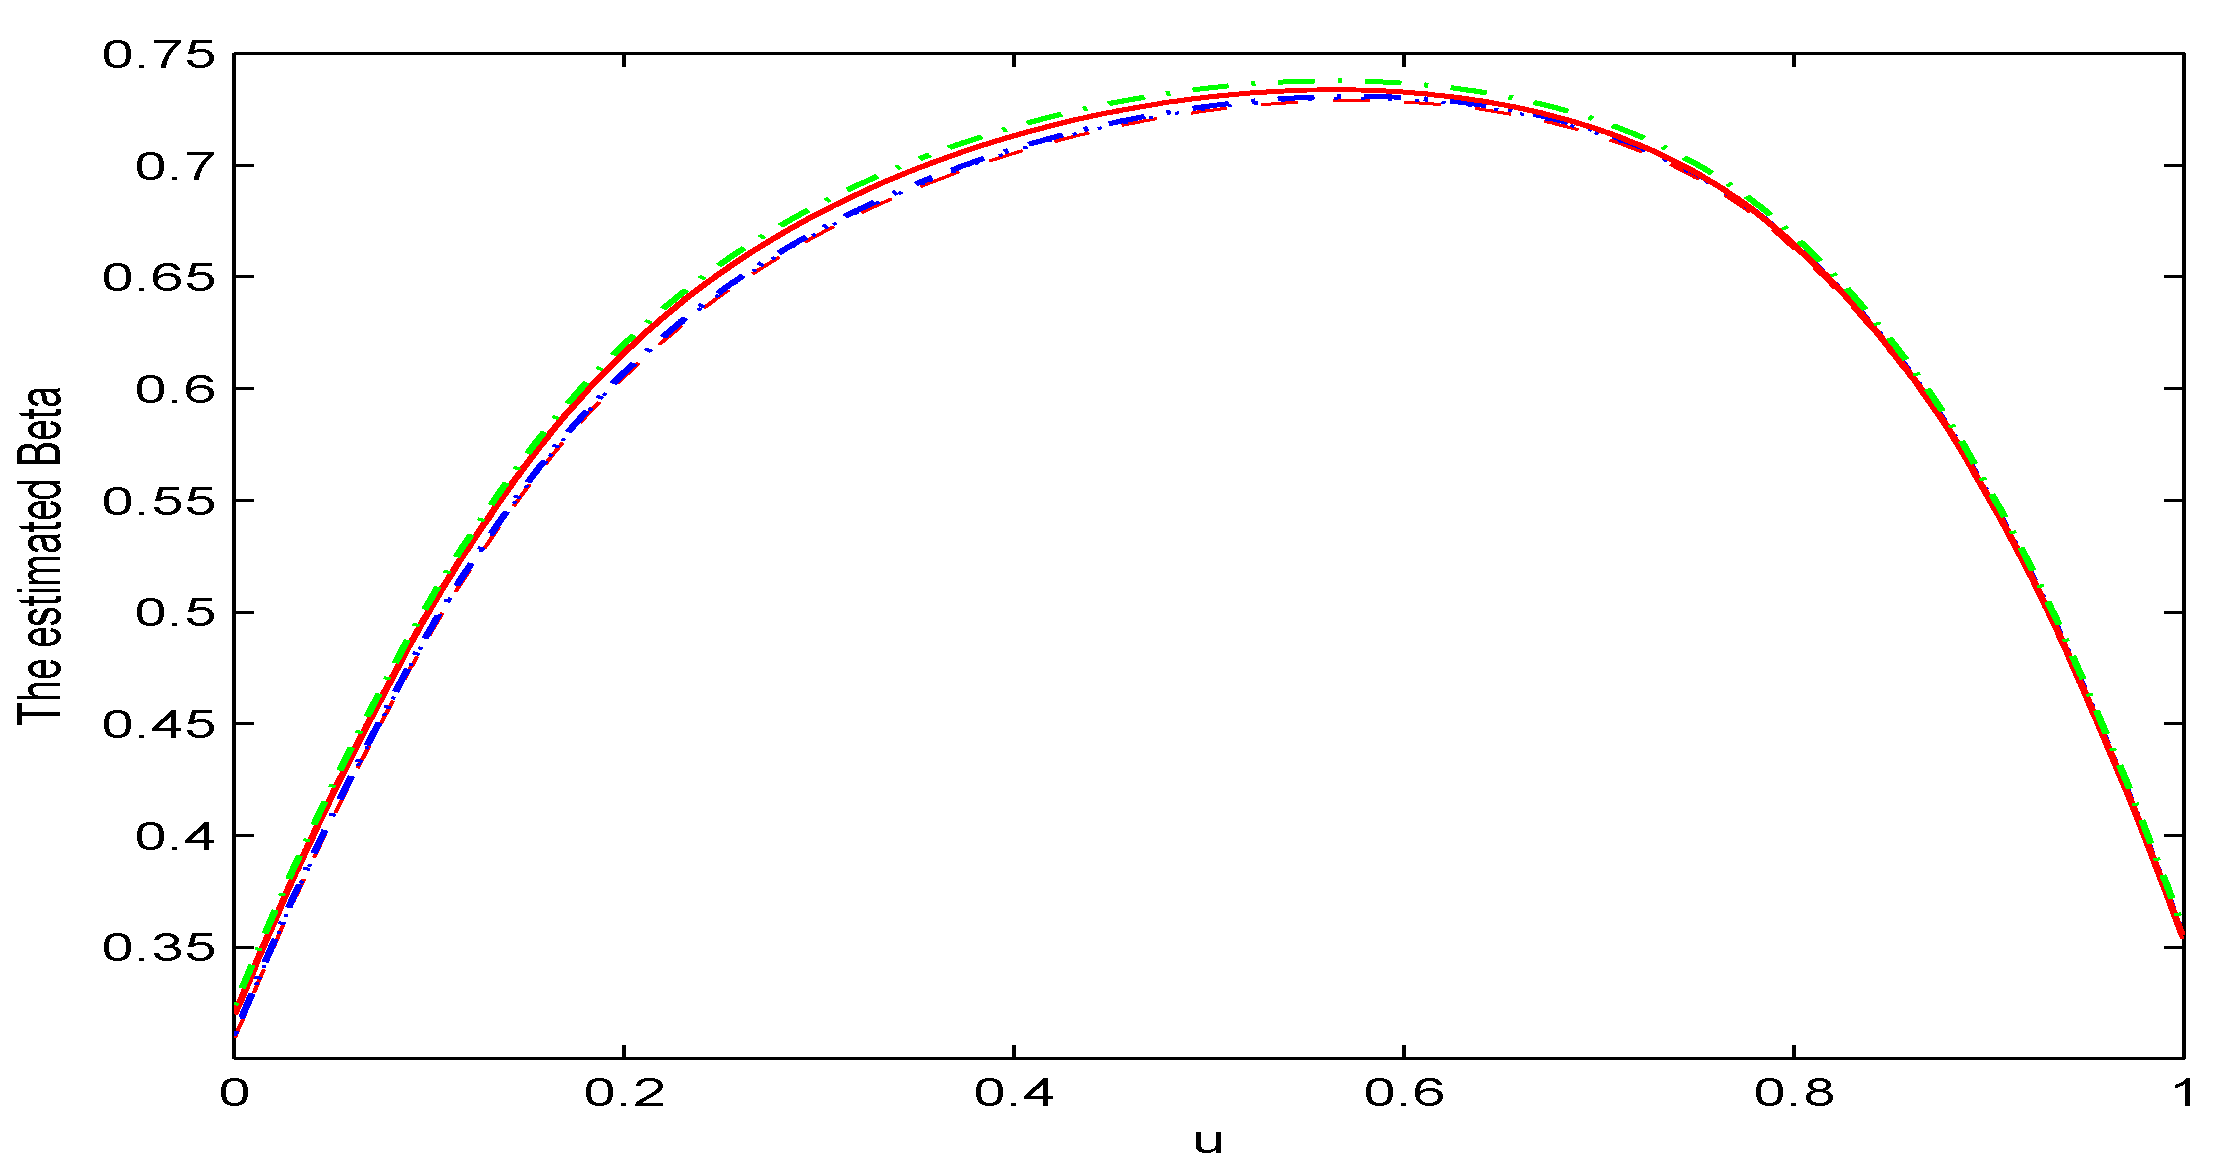
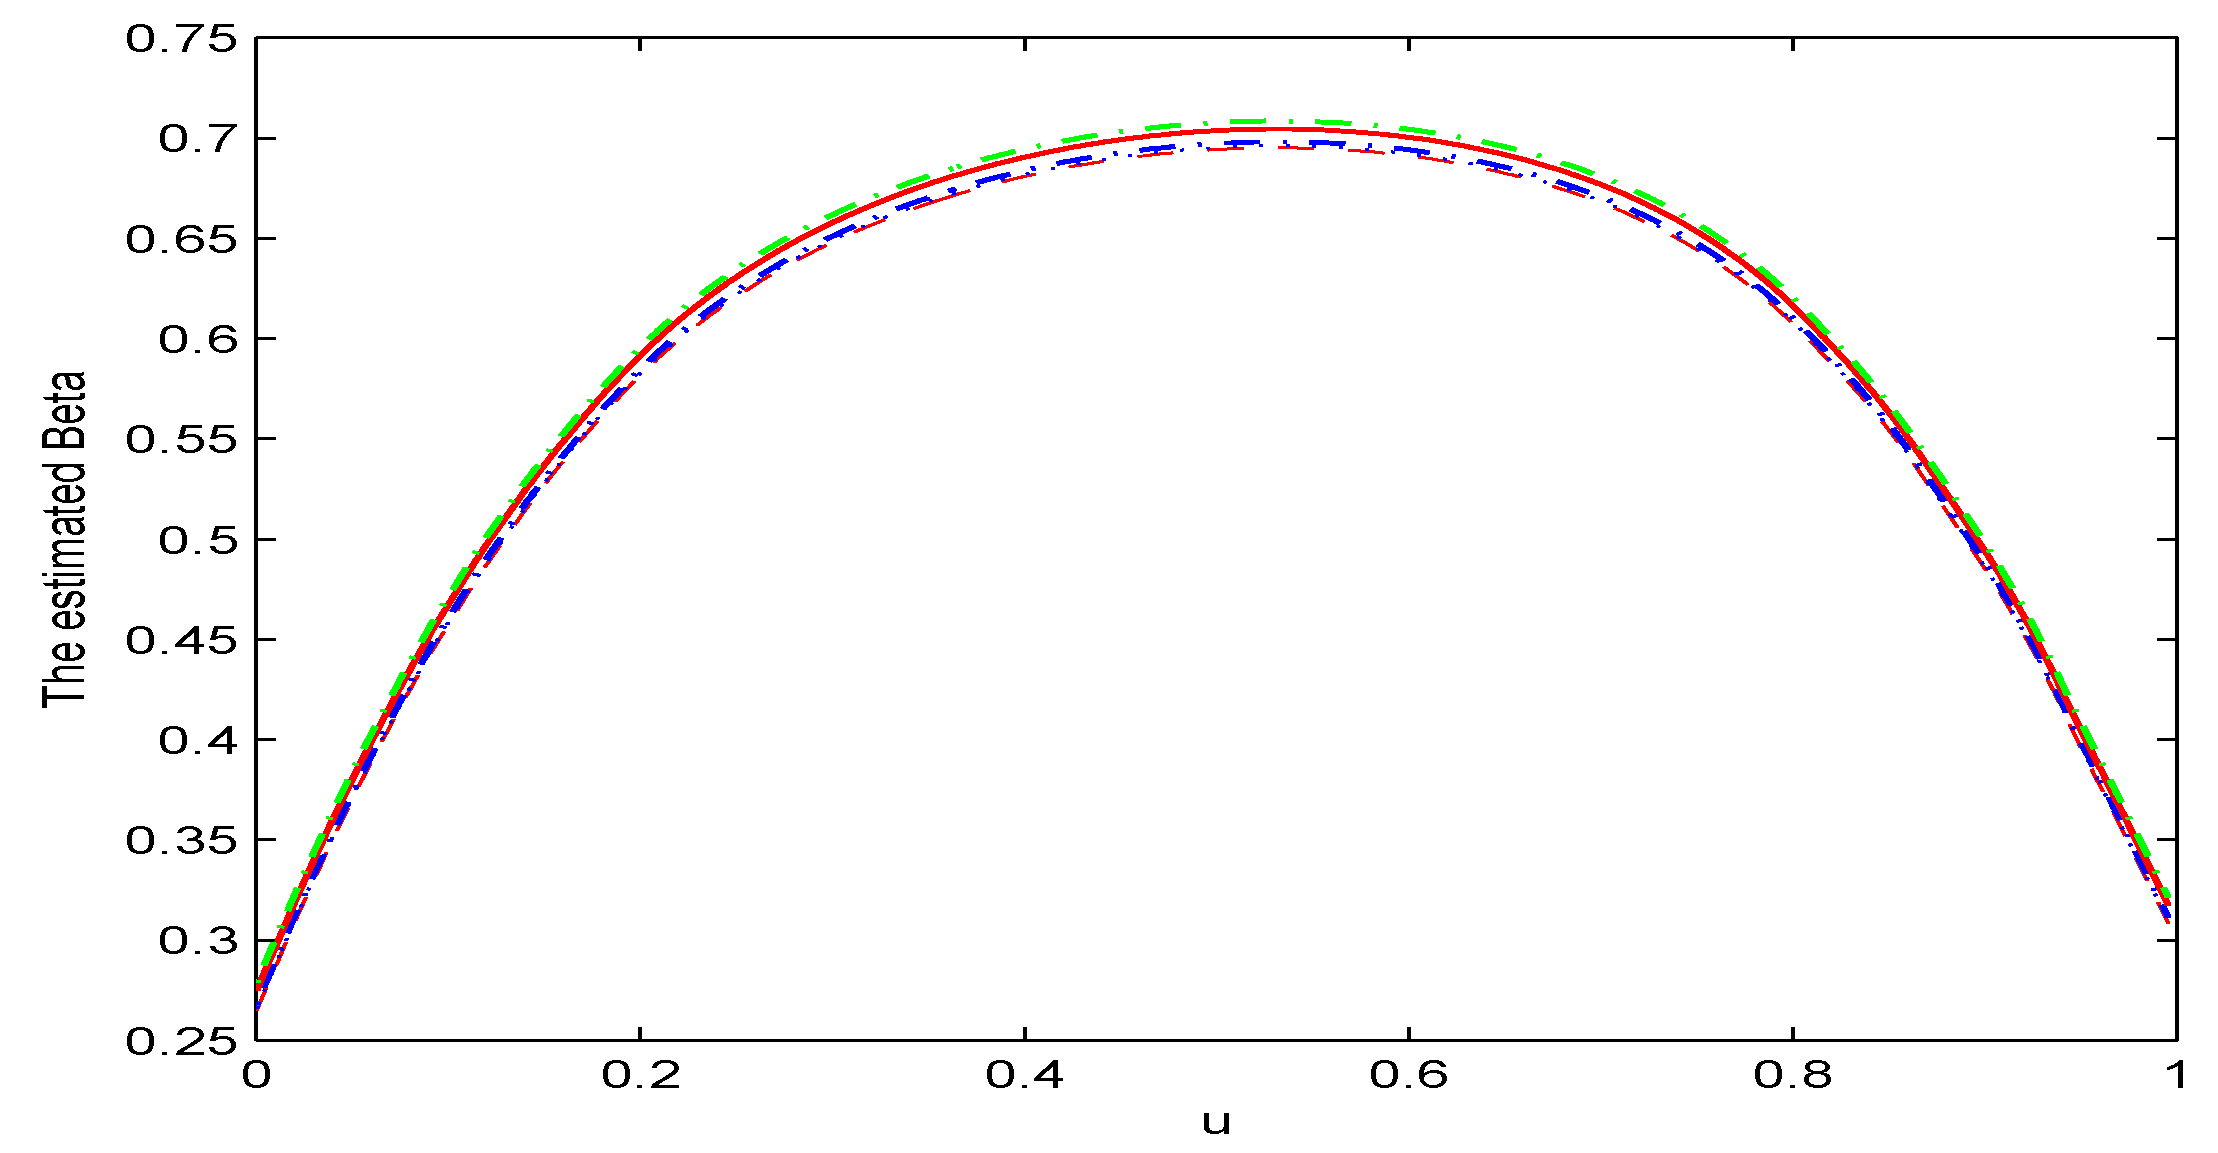
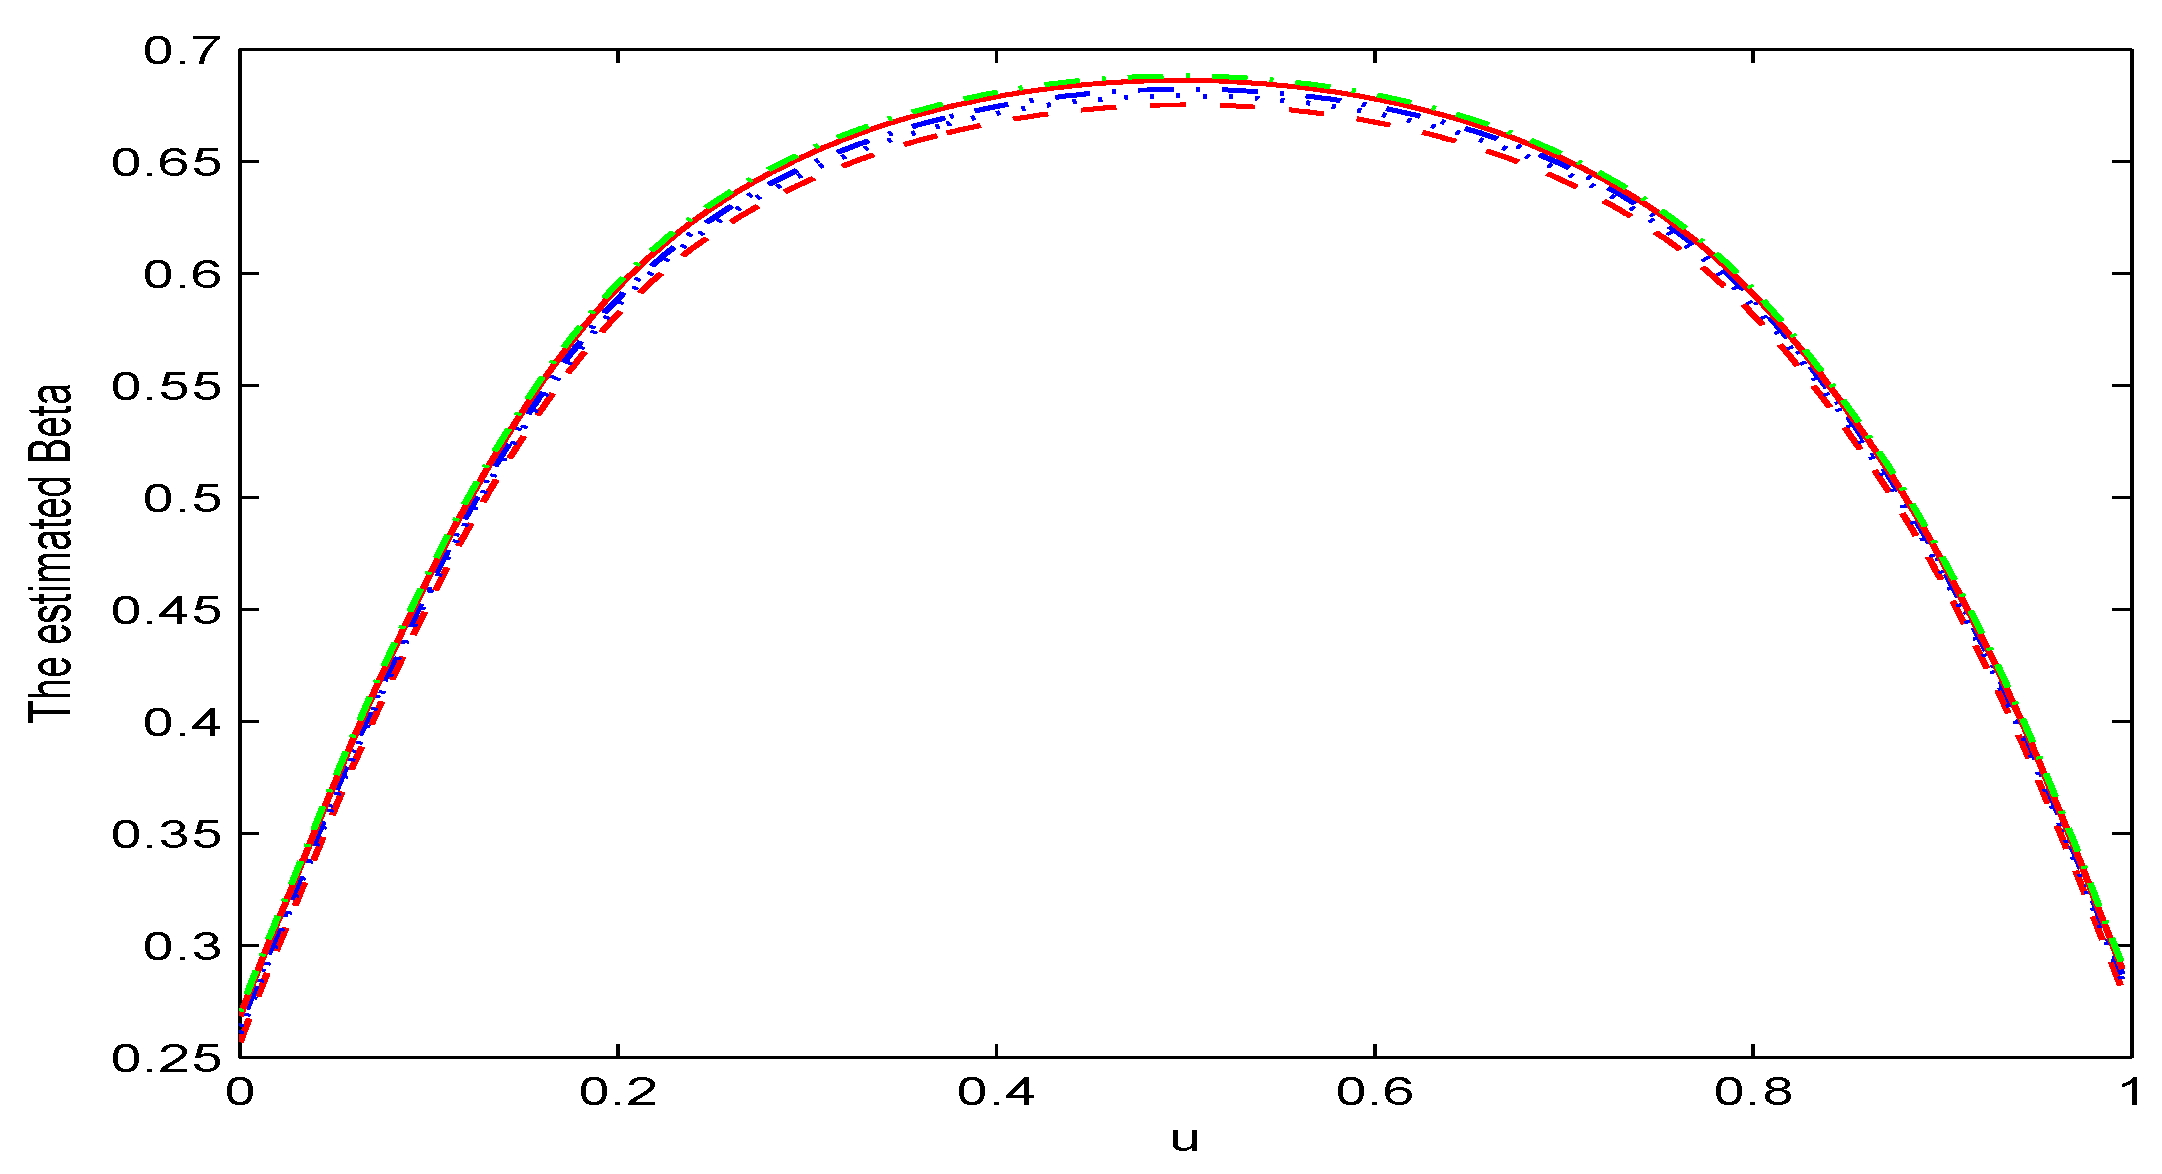
5. Simulation Study
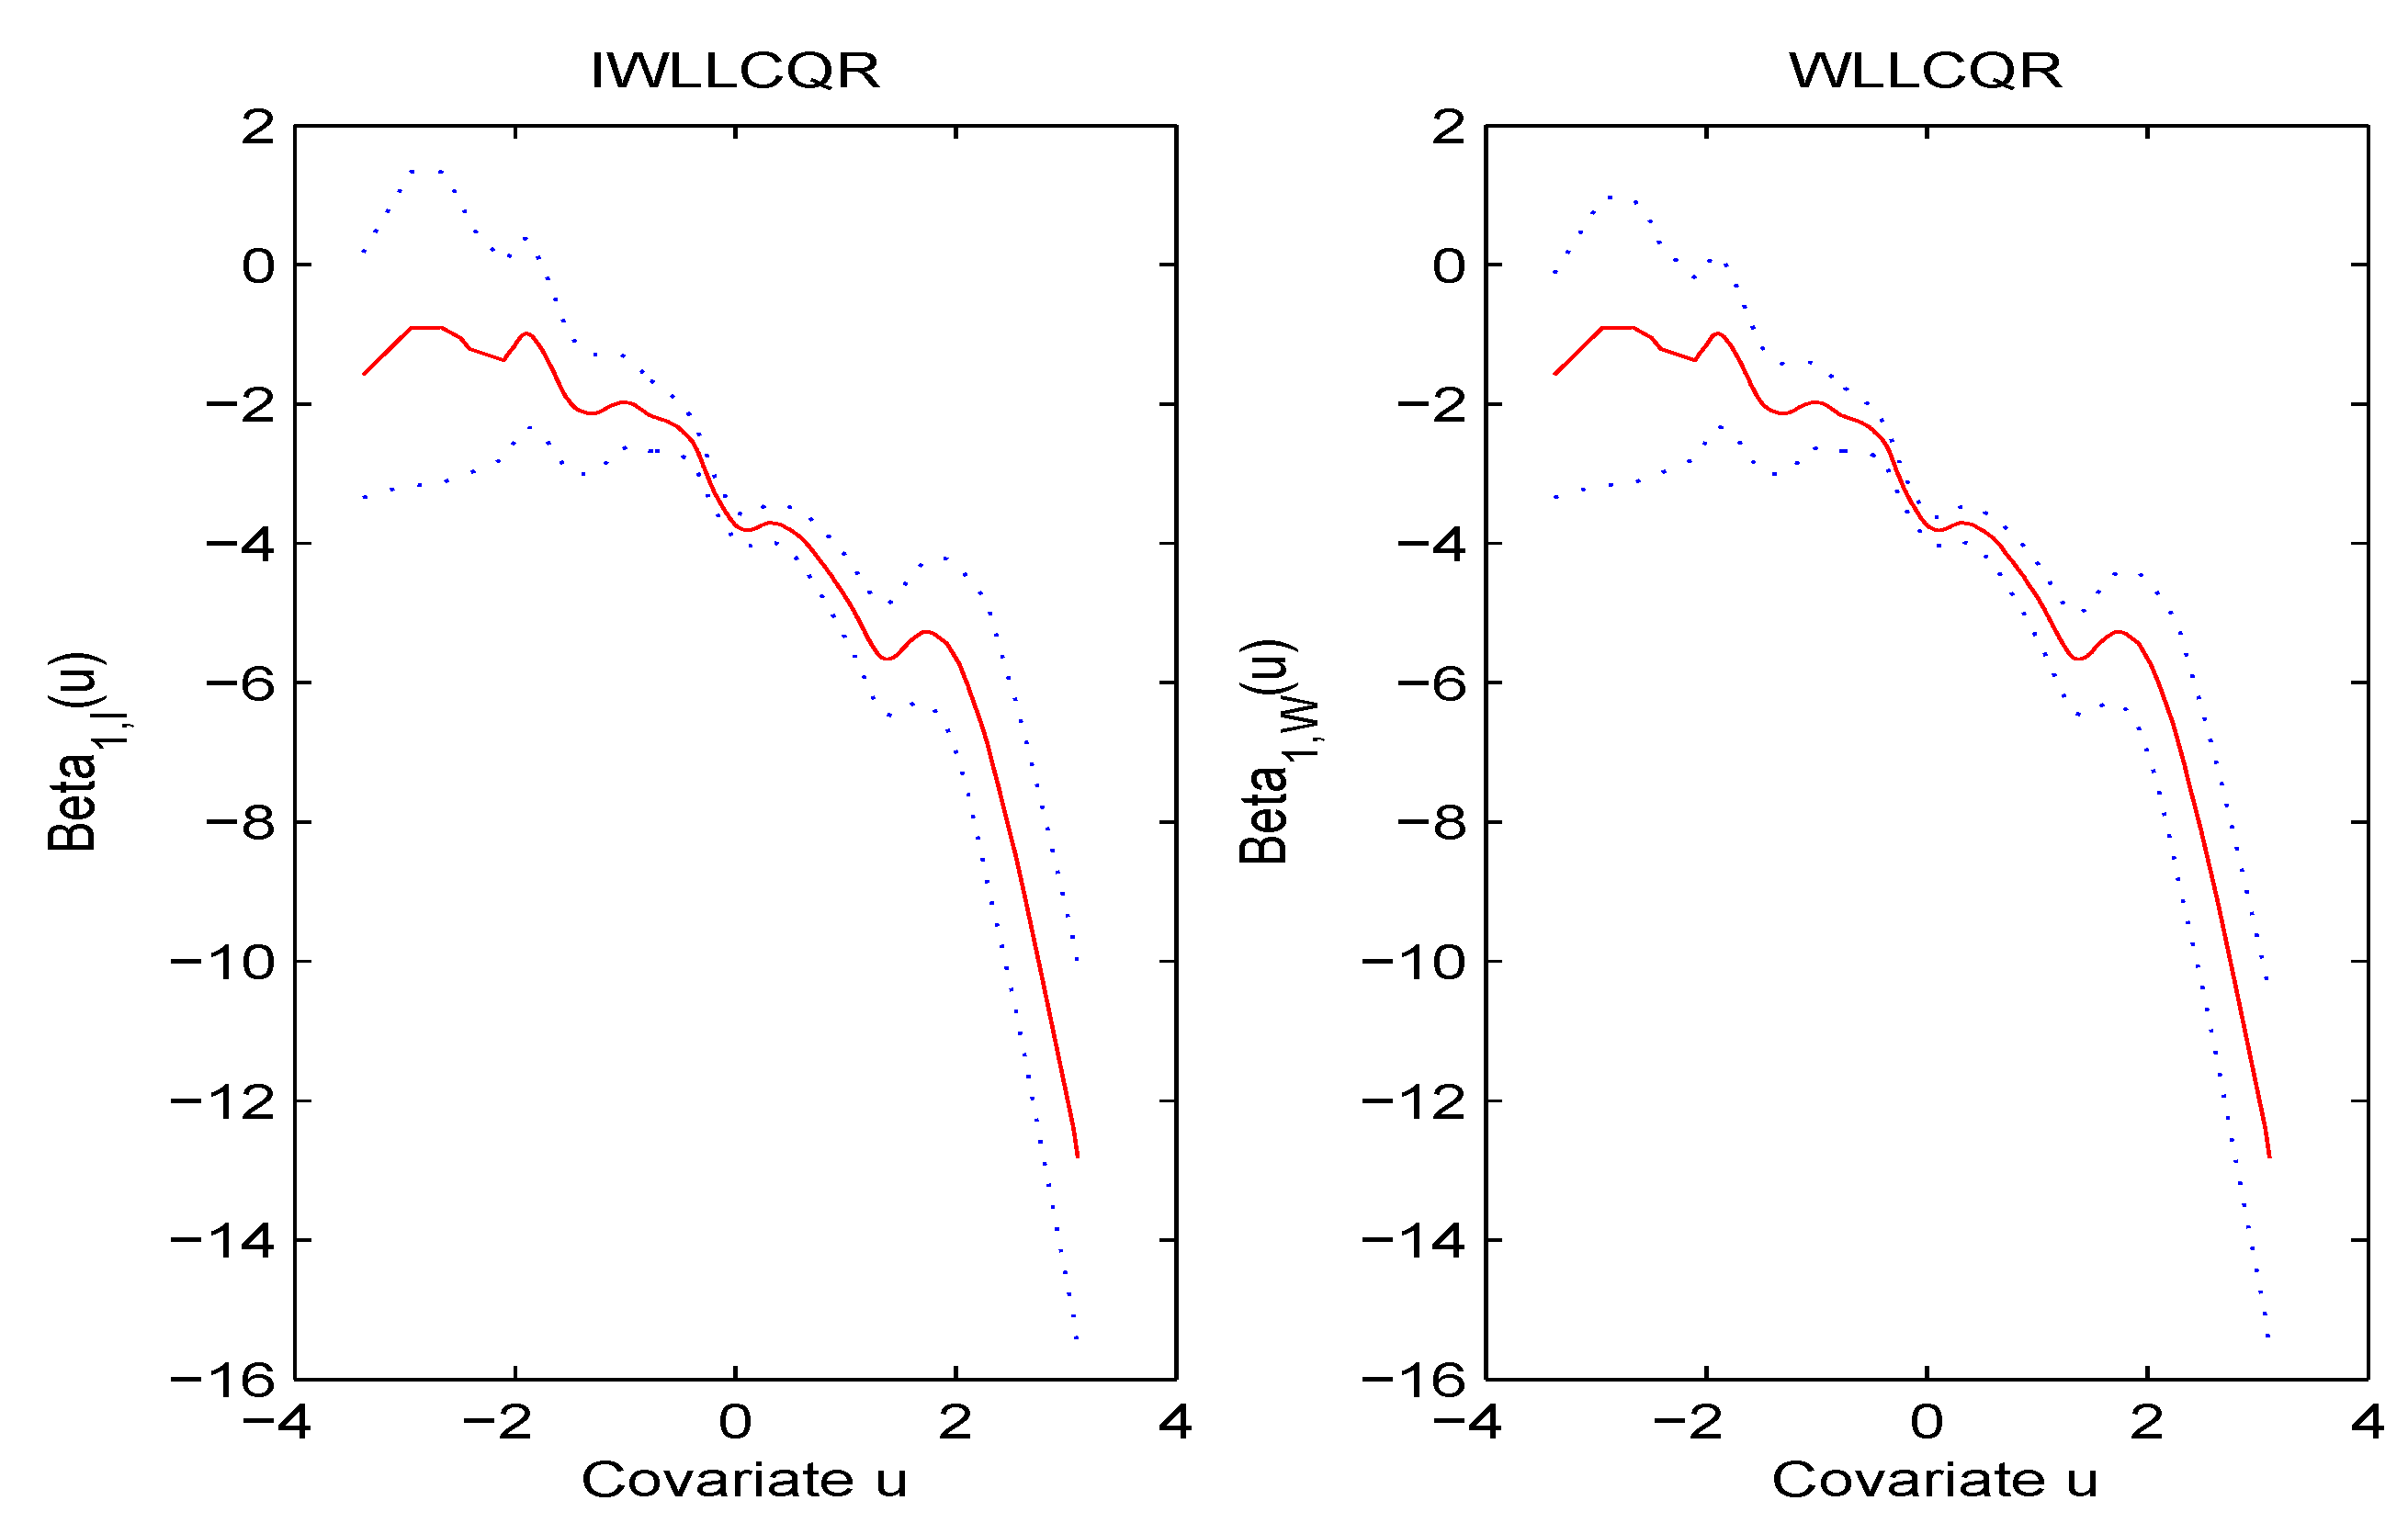
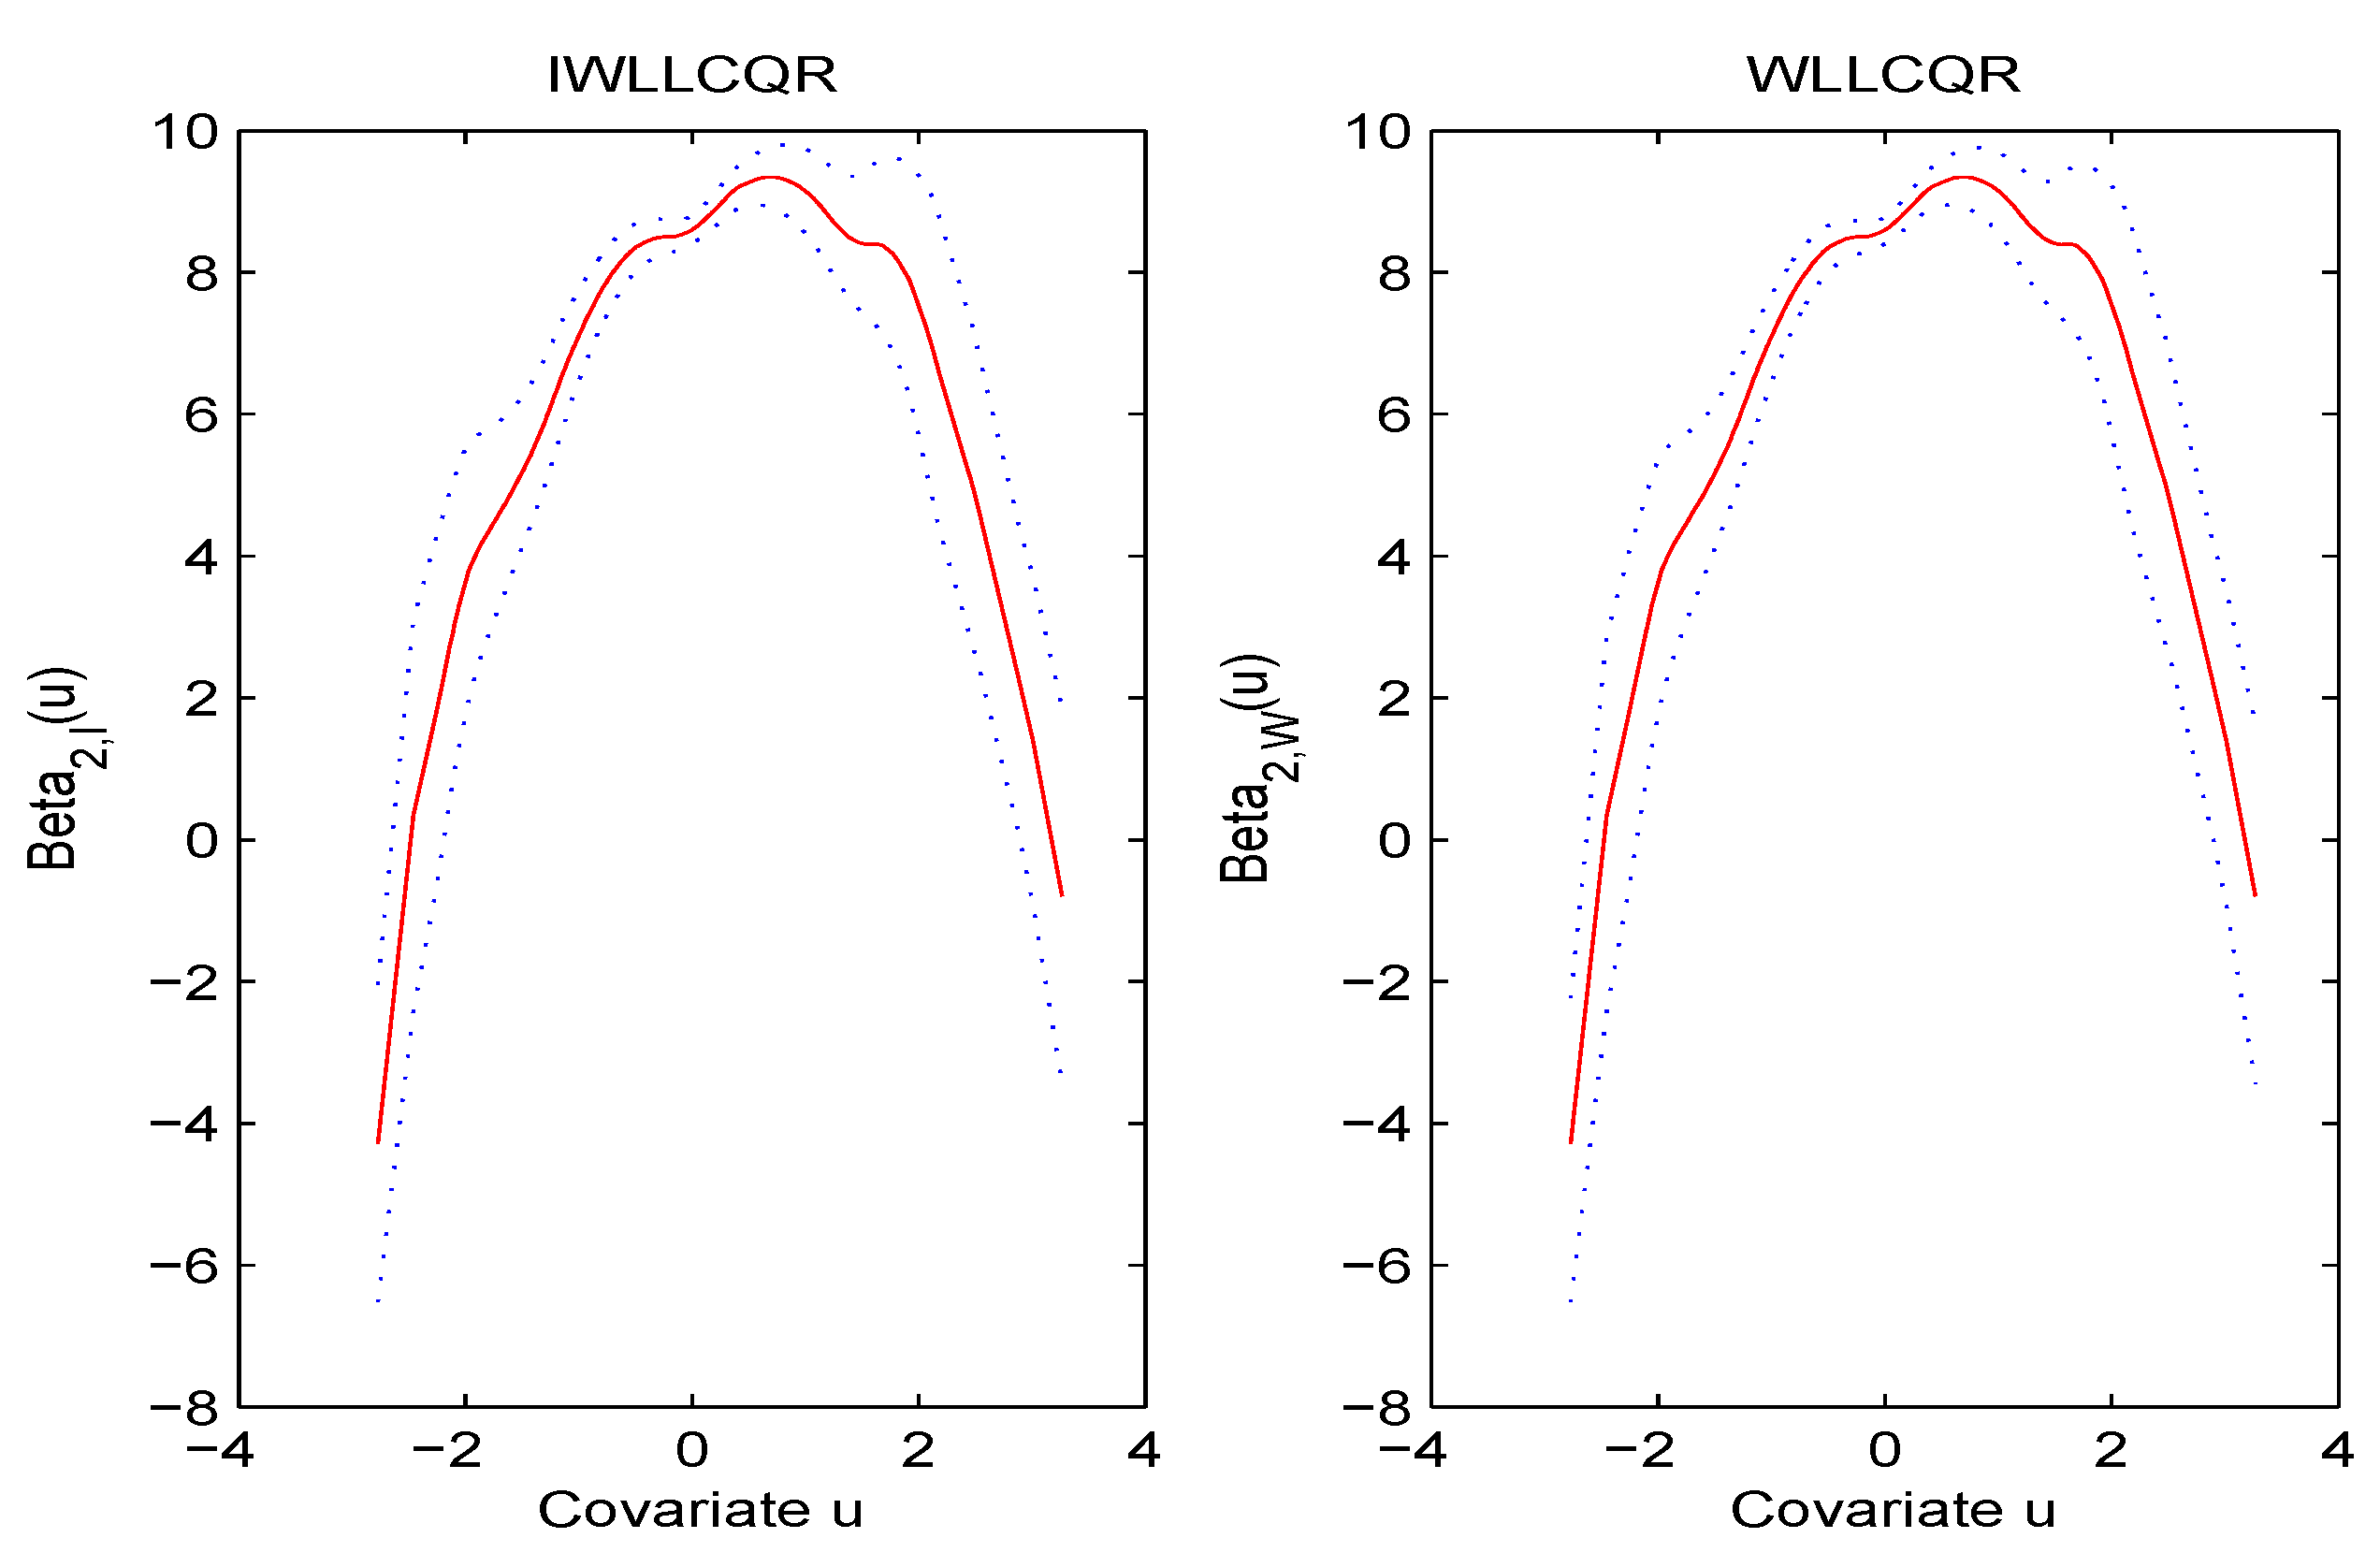
6. A Real Data Example
7. Discussions
8. Concluding Remarks
Author Contributions
Acknowledgments
Conflicts of Interest
Abbreviations
| QR | quantile regression |
| CQR | composite QR |
| WCQR | weighted CQR |
| CQRE | CQR estimation |
| LLQR | local linear QR |
| LLCQR | local linear CQR |
| WLLCQR | weighted LLCQR |
| NWLLCQR | nonparametric WLLCQR |
| IWLLCQR | imputed WLLCQR |
Appendix A
References
- Hastie, T.J.; Tibshirani, R.J. Varying-coefficient models. J. R. Stat. Soc. Ser. 1993, 55, 757–796. [Google Scholar] [CrossRef]
- Chiang, C.T.; Rice, J.A.; Wu, C.O. Smoothing spline estimation for varying coefficient models with repeatedly measured dependent variables. J. Am. Stat. Assoc. 2001, 96, 605–619. [Google Scholar] [CrossRef]
- Eubank, R.L.; Huang, C.; Maldonado, Y.M.; Wang, N.; Wang, S.; Buchanan, R.J. Smoothing spline estimation in varying coefficient models. J. R. Stat. Soc. Ser. 2004, 66, 653–667. [Google Scholar] [CrossRef]
- Fan, J.; Zhang, J.T. Statistical estimation in varying coefficient models. Ann. Stat. 1999, 27, 1491–1518. [Google Scholar]
- Huang, J.; Wu, C.O.; Zhou, L. Varying coefficient models and basis function approximations for the analysis of repeated measurements. Biometrika 2002, 89, 111–128. [Google Scholar] [CrossRef]
- Wu, C.O.; Yu, K.F.; Chiang, C.T. A two-step smoothing method for varying coefficient models with repeated measurements. Ann. Inst. Stat. Math. 2000, 52, 519–543. [Google Scholar] [CrossRef]
- Fan, J.; Huang, T. Profile likelihood inferences on semiparametric varying-cofficient partially linear models. Bernoulli 2005, 11, 1031–1057. [Google Scholar] [CrossRef]
- Whang, Y.J. Smoothed empirical likelihood methods for quantile regression models. Econom. Theory 2006, 22, 173–205. [Google Scholar] [CrossRef]
- Koenker, R. Quantiles Regression; Cambridge University Press: Cambridge, UK, 2005. [Google Scholar]
- Kim, M.O. Quantile regression with varying coefficients. Ann. Stat. 2007, 35, 92–108. [Google Scholar] [CrossRef]
- Cai, Z.; Xu, X. Nonparametric quantile estimations for dynamic smooth coefficient models. J. Am. Stat. Assoc. 2008, 103, 1595–1608. [Google Scholar] [CrossRef]
- Cai, Z.; Xiao, Z. Semiparametric quantile regression estimation in dynamic models with partially varying coefficients. J. Econom. 2012, 167, 413–425. [Google Scholar] [CrossRef]
- Tang, Q.G. Robust estimation for spatial semiparametric varying coefficient partially linear regression. Stat. Pap. 2015, 56, 1137–1161. [Google Scholar]
- Zou, H.; Yuan, M. Composite quantile regression and the oracle model selection theory. Ann. Stat. 2008, 36, 1108–1126. [Google Scholar] [CrossRef]
- Kai, B.; Li, R.; Zou, H. New efficient estimation and variable selection methods for semiparametric varying coefficient partially linear models. Ann. Stat. 2011, 39, 305–332. [Google Scholar] [CrossRef] [PubMed]
- Guo, J.; Tian, M.Z. New efficient and robust estimation in varying coefficient models with heteroscedasticity. Stat. Sin. 2012, 22, 1075–1101. [Google Scholar]
- Sun, J.; Gai, Y.; Lin, L. Weighted local linear composite quantile estimation for the case of general error distributions. J. Stat. Plan. Inference 2013, 143, 1049–1063. [Google Scholar] [CrossRef]
- Yang, H.; Lv, J.; Guo, C.H. Weighted composite quantile regression estimation and variable selection for varying coefficient models with heteroscedasticity. J. Korean Stat. Soc. 2015, 44, 77–94. [Google Scholar] [CrossRef]
- Luo, S.; Zhang, C.-Y. Nonparametric M-type regression estimation under missing response data. Stat. Pap. 2016, 57, 641–664. [Google Scholar] [CrossRef]
- Rubin, D.B. Inference and missing data. Biometrika 1976, 63, 581–592. [Google Scholar] [CrossRef]
- Sterne, J.; White, I.; Carlin, J.; Spratt, M.; Royston, P.; Kenward, M.; Carpenter, J. Multiple imputation for missing data in epidemiological and clinical research: potential and pitfalls. BMJ 2009, 338, b2393. [Google Scholar] [CrossRef] [PubMed]
- Wang, Q.; Linton, O.; HÄrdle, W. Semiparametric regression analysis with missing response at random. J. Am. Stat. Assoc. 2004, 99, 334–345. [Google Scholar] [CrossRef]
- Wang, Q.; Sun, Z. Estimation in partially linear models with missing responses at random. J. Multivar. Anal. 2007, 98, 1470–1493. [Google Scholar] [CrossRef]
- Wang, Q.; Rao, N.K. Empirical Likelihood-based inference under imputation for missing response data. Ann. Stat. 2002, 30, 896–924. [Google Scholar] [CrossRef]
- Xue, L.G. Empirical likelihood confidence intervals for response mean with data missing at random. Scand. J. Stat. 2009, 36, 671–685. [Google Scholar] [CrossRef]
- Wei, Y.; Ma, Y.; Carroll, R. Multiple imputation in quantile regression. Biometrika 2012, 99, 423–438. [Google Scholar] [CrossRef] [PubMed]
- Lv, X.; Li, R. Smoothed empirical likelihood analysis of partially linear quantile regression models with missing response variables. Adv. Stat. Anal. 2013, 97, 317–347. [Google Scholar] [CrossRef]
- Sherwood, B.; Wang, L.; Zhou, X. Weighted quantile regression for analyzing health care cost data with missing covariates. Stat. Med. 2013, 32, 4967–4979. [Google Scholar] [CrossRef]
- Sun, Y.; Wang, Q.; Gilbert, P. Quantile regression for competing risks data with missing cause of failure. Ann. Stat. 2012, 22, 703–728. [Google Scholar] [CrossRef]
- Chen, X.; Wan, T.K.; Zhou, Y. Efficient quantile regression analysis with missing observations. J. Am. Stat. Assoc. 2015, 110, 723–741. [Google Scholar] [CrossRef]
- Kim, S.Y. Imputation methods for quantile estimation under missing at random. Stat. Its Interface 2013, 6, 369–377. [Google Scholar]
- Nageswara, S.; Rao, V. Nadaraya-Watson estimator for sensor fusion. Opt. Eng. 1997, 36, 642–647. [Google Scholar]
- Wong, H.; Guo, S.J.; Chen, M.; Wai-Cheung, I.P. On locally weighted estimation and hypothesis testing on varying coefficient models with missing covariates. J. Stat. Plan. Inference 2009, 139, 2933–2951. [Google Scholar] [CrossRef]
- Knight, K. Limiting distributions for L1 regression estimators under general conditions. Ann. Stat. 1998, 26, 755–770. [Google Scholar]
- Parzen, E. On estimation of a probability density function and model. Ann. Math. Stat. 1962, 33, 1065–1076. [Google Scholar] [CrossRef]


| Model Error | n | MSE | |||||
|---|---|---|---|---|---|---|---|
| WLLCQR | NWLLCQR | IWLLCQR | INWLLCQR | WLLCQR | |||
| Error(1) | 100 | 0.1219 | 0.1213 | 0.1192 | 0.1201 | 0.1182 | |
| 200 | 0.1017 | 0.1012 | 0.0997 | 0.1003 | 0.0973 | ||
| 100 | 0.1845 | 0.1792 | 0.1701 | 0.1715 | 0.1645 | ||
| 200 | 0.1701 | 0.1698 | 0.1641 | 0.1654 | 0.1583 | ||
| 100 | 0.2685 | 0.2518 | 0.2346 | 0.2371 | 0.2207 | ||
| 200 | 0.1976 | 0.1903 | 0.1826 | 0.1842 | 0.1612 | ||
| Error(2) | 100 | 0.0789 | 0.0775 | 0.0719 | 0.0728 | 0.0696 | |
| 200 | 0.0646 | 0.0612 | 0.0598 | 0.0609 | 0.0559 | ||
| 100 | 0.1124 | 0.1102 | 0.1019 | 0.1027 | 0.0921 | ||
| 200 | 0.0997 | 0.0904 | 0.0898 | 0.0905 | 0.0802 | ||
| 100 | 0.3954 | 0.3542 | 0.3257 | 0.3302 | 0.3024 | ||
| 200 | 0.3356 | 0.3298 | 0.3021 | 0.3075 | 0.2814 | ||
| Error(3) | 100 | 0.0598 | 0.0568 | 0.0514 | 0.0529 | 0.0498 | |
| 200 | 0.0528 | 0.0515 | 0.0498 | 0.0502 | 0.0439 | ||
| 100 | 0.0687 | 0.0665 | 0.0621 | 0.0632 | 0.0596 | ||
| 200 | 0.0579 | 0.0558 | 0.0523 | 0.0545 | 0.0495 | ||
| 100 | 0.1102 | 0.1017 | 0.0987 | 0.1004 | 0.0812 | ||
| 200 | 0.0957 | 0.0922 | 0.0892 | 0.0904 | 0.0759 | ||
| WLLCQR | NWLLCQR | IWLLCQR | INWLLCQR | WLLCQR | |
|---|---|---|---|---|---|
| −0.312 (0.046) | −0.307 (0.045) | −0.315 (0.042) | −0.30 (0.044) | −0.316 (0.041) | |
| −0.379 (0.104) | −0.378 (0.102) | −0.375 (0.099) | −0.376 (0.101) | −0.374 (0.098) |
© 2019 by the authors. Licensee MDPI, Basel, Switzerland. This article is an open access article distributed under the terms and conditions of the Creative Commons Attribution (CC BY) license (http://creativecommons.org/licenses/by/4.0/).
Share and Cite
Luo, S.; Zhang, C.-y.; Wang, M. Composite Quantile Regression for Varying Coefficient Models with Response Data Missing at Random. Symmetry 2019, 11, 1065. https://doi.org/10.3390/sym11091065
Luo S, Zhang C-y, Wang M. Composite Quantile Regression for Varying Coefficient Models with Response Data Missing at Random. Symmetry. 2019; 11(9):1065. https://doi.org/10.3390/sym11091065
Chicago/Turabian StyleLuo, Shuanghua, Cheng-yi Zhang, and Meihua Wang. 2019. "Composite Quantile Regression for Varying Coefficient Models with Response Data Missing at Random" Symmetry 11, no. 9: 1065. https://doi.org/10.3390/sym11091065
APA StyleLuo, S., Zhang, C.-y., & Wang, M. (2019). Composite Quantile Regression for Varying Coefficient Models with Response Data Missing at Random. Symmetry, 11(9), 1065. https://doi.org/10.3390/sym11091065