Abstract
Natural rock masses have many internal joints, fractures and faults, which greatly influence their mechanical properties during geological processes. In this paper, considering different joint angles and rock-bridge angles, uniaxial compression numerical tests on double-fractured red sandstone based on particle flow code (PFC) were carried out. The influence laws of the mechanics, acoustic emission (AE) and damage evolution characteristics of double-fractured sandstone under different crack geometry conditions were analysed. The results indicated that the peak stress and elastic modulus increase with increasing fracture angle. The peak stress and elastic modulus of rock samples first increase and then decrease with the increase in the rock-bridge angle, exhibiting a nonlinear distribution; when the angle β (rock-bridge angle) is less than or equal to 45°, the peak strain differs only slightly and decreases gradually with the increase in the rock-bridge angle. There are three stages in the AE evolution of fractured red sandstone: The initial emission of AE, the increase in AE and the decline in AE. The influences of different fracture angles and rock-bridge angles on the AE characteristic rule of rock samples vary. The damage evolution process of sandstone specimens with different joints can be divided into four stages: Initial damage, stable increase, accelerated development and stable damage. The fracture angle mainly affects the damage stage. The smaller the angle of the crack is, the greater the strain value in this stage. The rock-bridge angle mainly influences the damage variable evolution during the stable increase, accelerated damage development and stable damage stages.
1. Introduction
With the increase in mining scale and development depth, coal mine disasters, such as rock burst and roof collapse are becoming increasingly serious. Many studies have shown that these disasters are closely related to the instability and failure of the coal–rock body [1,2]. Due to geological action, natural rock is composed of mineral particles and contains many defects, such as fractures and noncontinuous joints. The existence of internal noncontinuous joints leads to the anisotropy of the rock mass, and the mechanical properties are very complex. Therefore, it is of great engineering significance to study the mechanical characteristics of defective rock to determine the instability mechanism of the rock mass.
In recent years, scholars have conducted significant work on the strength characteristics, deformation characteristics and crack evolution rules of defective rocks, and some achievements have been obtained. For example, Walsh [3] studied the influence of internal fractures on the strength and deformation properties of rock. Goodman [4] explored the mechanical model of jointed rock mass. Lasanyi [5] gave a numerical analysis of the shear mechanical behaviour of jointed rock mass, and the failure criterion of jointed rock mass was modified by Hoek [6]. In recent years, Lin [7] investigated the failure mechanism and peak strength of jointed rock mass samples under uniaxial and biaxial stresses and found that the failure mode and mechanical characteristics of rock mass are influenced by the precast joint length, the rock-bridge length, etc. Wong [8] used gypsum and marble samples containing prefabricated cracks in a uniaxial compression test. It was found that the marble specimens appeared to have antiwing cracks as well as different crack types including tensile cracks, shear cracks and mixed tensile–shear cracks, and the time sequence of different types of cracks was determined. A uniaxial compression test of intermittent precast fractured marble with different geometric distributions was carried out by Yang [9]. The results showed that the peak strength and elastic modulus of rock samples decrease with the increase in the crack angle, and the regularity among the rock-bridge angle, the gap of the cracks and the mechanical parameters were not obvious. There are four main coalescence models: Tension, compression, shearing and mixing coalescence. These studies have great significance in the determination of the mechanical behaviour and failure mechanisms of jointed rock mass. However, due to the complexity of the rock cracks, the research results on jointed rock cannot completely solve actual engineering problems at present. The mechanical behaviour and damage evolution characteristics of the different joints in precast fractured rock mass still need to be studied.
In addition, when the rock material is subjected to external force, the internal stresses will continuously cause damage, and during the damage process, the internal energies will be released in the form of an elastic wave and spread rapidly in the rock mass, producing the acoustic emission (AE) phenomenon [10]. Obert and Duvall [11] discovered AE in a rock structure under pressure, and since then, many scholars have studied the AE characteristics of rock. They found that the emergence, expansion and penetration of microcracks in coal rock could be monitored continuously and in real time by the AE phenomenon, even enabling the effective monitoring and prediction of rock stability [12,13,14]. However, as a result of the restriction of laboratory test conditions, there are few studies on the AE characteristics of fractured, especially double-fractured, rock mass; therefore, it is necessary to further study the AE characteristics of rock damage processes. The AE characteristics of rock can well describe its deformation and damage evolution characteristics. The study of rock damage evolution is of great significance to deeply understand rock fracture mechanism and prevent disasters and accidents caused by rock damage.
In this manuscript, based on the above researches, particle flow code (PFC) was first used to establish a uniaxial compression model of double-fractured rock with different geometries, and then the characteristics of the mechanics and AE of double-fractured red sandstone under the conditions of different joints and rock-bridge angles were analysed. Finally, a damage constitutive model of rock mass based on AE characteristics was proposed, and the damage evolution law of double-fractured rock mass was explored.
2. Numerical Model of Joint Red Sandstone
2.1. Particle Flow Introduction
P.A. Cundall and O.D. Strack [15] created the theory of particle flow based on the discrete element method. The theory is suitable for the analysis of the damage evolution mechanism and large deformation process of a material at the microscopic level. Many scholars have carried out research work in the field of rock engineering [16,17,18]. PFC is a discrete element simulation software. As the motion of particles follows the Newton’s second law of motion and the interaction between particles obeys the law of force displacement, this software can analyse the movements and interactions between microscopic particles and use microscopic changes to reflect the macroscopic mechanical behaviours of materials.
The force–displacement behavior of each contact between particles is based on the microscopic parameters of particles. The total force and moment acting on each contact point are composed of a force Fi, which is generated by the overlap of particles and particles. The contact force vector, Fi (which represents the action of two contact particles), can be resolved into normal and shear components with respect to the contact plane as [19]
where Fn and Fs denote the normal and shear force components, respectively, and ni and ti are the unit vectors that define the contact plane. The normal force is calculated by
where kn is the contact normal stiffness, Un is the overlap.
The shear force is computed in an incremental fashion. When the contact is formed, Fs is initialized to zero. Each subsequent relative shear–displacement increment, ΔUs; produces an increment of elastic shear force, ΔFs; the increment of elastic shear force is given by
where ks is the contact shear stiffness.
When simulating particle bond failure, PFC uses the contact constitutive model to simulate the material constitutive model, including contact-bond and parallel-bond models. In the contact-bond model, the elastic spring has constant normal (kn) and shear (ks) stiffness values, and the model is a point contact, representing a force. The parallel-bond model consists of a parallel bond of finite size (circular or rectangular section), characterized by a force and a torque, as shown in Figure 1. In this experiment, the parallel-bond model was used to reconstruct the red sandstone. The size of the particle flow model was in accordance with the size of the laboratory test specimen, and the selected size was 50 mm × 100 mm. The microscopic parameters can be solved by applying Equation (1) [21].
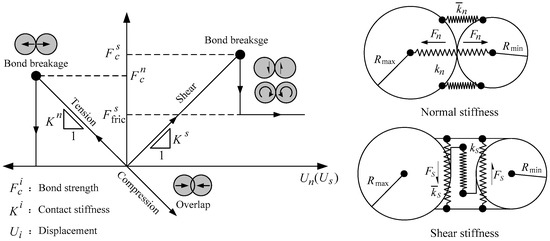
Figure 1.
Diagrammatic sketch of the bonding model [19,20].
In the formula, Ec is the elastic modulus of particle contact; is the elastic modulus of particle parallel bonding; kn and ks are the particle contact stiffness; and are the parallel bonding stiffness; and is the average radius of the two contact particles.
2.2. Parameters of the Microscopic Physical and Mechanical Properties of Red Sandstone
Since the PFC simulation uses microscopic physical mechanical property parameters to characterize particles and bonding mechanical properties, the macroscopic variables obtained in the laboratory cannot be directly applied to the microscopic parameters of the PFC model. Therefore, before the numerical simulation, a large number of experiments need to be carried out, through the method of “trial and error” involving repeated adjustments and comparisons, to make the macroscopic mechanical parameters of the particle flow model close to the experimental mechanical parameters obtained from the laboratory rock specimen. Under the precondition of fixed particle size range, the relationship between the microparameters of PFC model and the macroparameters of red sandstone should be established by corresponding numerical simulation experiments, and this experiment mainly is the study of the rock characteristics under uniaxial compression, therefore, the mesomechanical parameters of sandstone model are determined by elastic modulus, Poisson’s ratio and uniaxial compressive strength [22].
In the present work, a laboratory compression test of a red sandstone specimen was used for parameter verification. The size of the laboratory test specimen was 50 mm × 100 mm, and the loading mode was the displacement loading mode of a moving top loading plate. The loading speed was 0.03 mm/s, and the basic mechanical parameters of the red sandstone were 7.99 GPa, a peak stress of 119.08 MPa, and a peak strain of 1.77 × 10⁻². The numerical model used the same size and loading speed as the laboratory experiment. After repeated adjustments and comparisons, the finalized parameters of the microscopic physical mechanical properties were determined, as shown in Table 1. Under these parameters, the numerical simulation gave the basic mechanical parameters as 7.24 GPa, a peak stress of 124.77 MPa and a peak strain of 1.74 × 10⁻². The difference between the experimental data and the laboratory experiment was less than 5%. At the same time, the numerical simulation results were consistent with the stress–strain curve of the laboratory rock specimen and the failure mode (Figure 2 and Figure 3). The obtained parameters can better reflect the physical and mechanical properties of red sandstone. Therefore, it can be seen that the simulated failure mode and stress–strain curve are in good agreement with the laboratory test results, which indicates that the selection is reasonable and can be used in subsequent calculation and analysis.

Table 1.
Microscopic physical mechanical parameters of the particle flow code (PFC) red sandstone model.
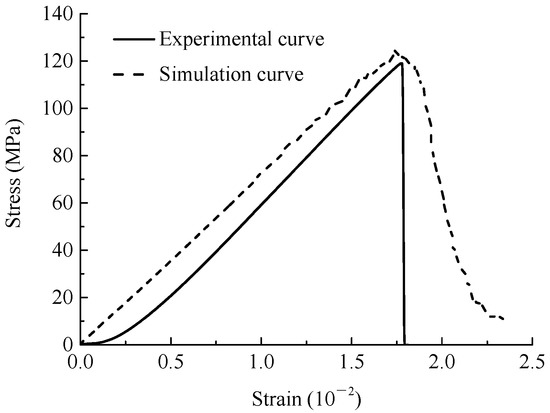
Figure 2.
Comparison between the numerical and experimental stress–strain curves of intact sandstone specimens.
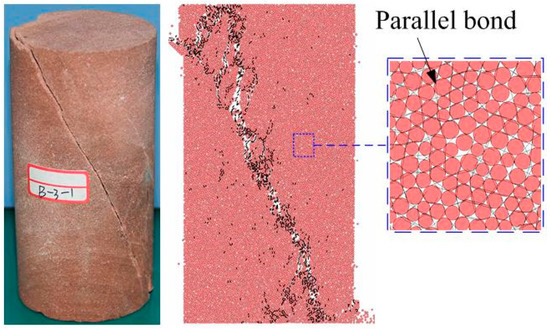
Figure 3.
Failure modes of intact red sandstone specimens obtained experimentally and through simulation.
2.3. PFC Simulation of AE
The rock in the PFC model can reproduce many behavioural characteristics observed in real rock samples, such as stress–strain response, cracking and failure mode. The AE of rock is directly related to the formation of microscopic cracks in the rock. A link breakage in the PFC model generates a strain energy release; that is, an AE occurs, and the rock AE event [23,24] can be simulated by the statistics of the number of particle links that break.
2.4. Construction of Particle Flow Model and Simulation Working Conditions
To analyse the effect of the geometric distribution of fractures on the mechanical properties and the AE characteristics rule of the double-fractured red sandstone specimens, a complete rock model the same size as the standard rock (50 mm × 100 mm) was established based on the parameters given in Table 1, and 13,561 grains were generated. Later, prefractures were made by deleting particles of certain lengths, widths and angles. The length of the fracture (2a) and the length of the rock bridge (2b) are fixed at 12 mm and 16 mm, respectively, as shown in Figure 4. The fracture angle α and the rock-bridge angle β have different values, and the specific working conditions are shown in Table 2. When the rock-bridge angle β equals 45°, the fracture angle α values include 0°, 30°, 45°, 60° and 90°. When the fracture angle α equals 45°, the rock-bridge angle β values include 0°, 15°, 30°, 45°, 60°, 75° and 90°. In total, 12 different working conditions were simulated. The model load was applied by moving the upper wall, and the loading speed was 0.03 mm/s.
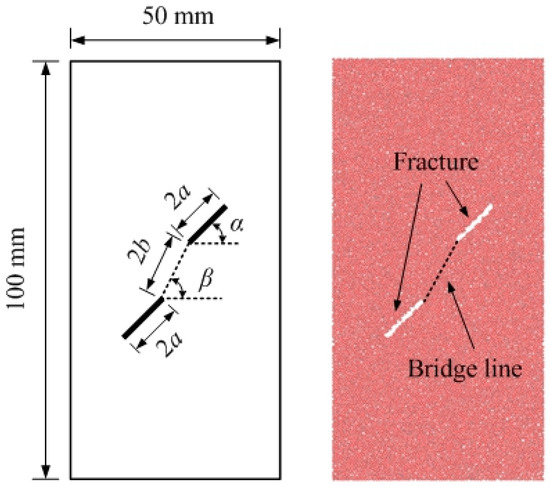
Figure 4.
Geometric parameters of the sample.
Table 2.
Simulation test conditions.
3. Analysis of the Test Results
3.1. Analysis of the Mechanical Characteristics
The numerical test results are shown in Figure 5, Figure 6 and Figure 7 and in Table 3. Figure 5 reveals that the fracture angle α influences the rock mechanical characteristics under the angle of rock equal to 45°. The peak stress and elastic modulus of the specimens increase with increasing α, and the trends of the two changes are similar (Figure 7). The postpeak stress decreases with increasing α, and the stress–strain curves at fracture angles of 45° and 60° are similar. The fracture angle α and the peak strain show a nonlinear distribution, and the amplitude of the change is small; the peak strain is smallest when α equals 30°, and the maximum value is reached when α equals 90°. The quantitative difference between these two degrees is 12.10%.
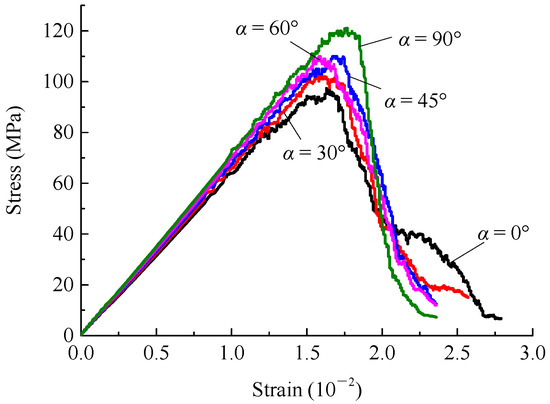
Figure 5.
Stress–strain curves of rock samples with different fracture angles.
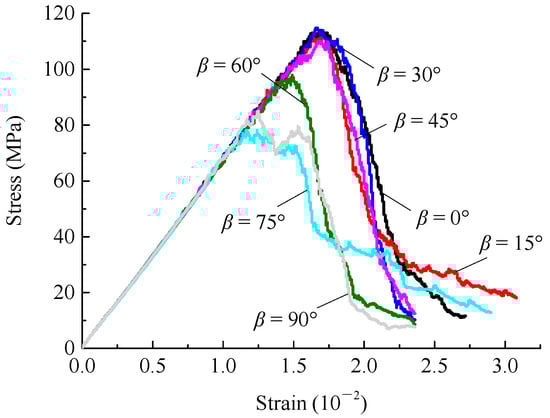
Figure 6.
Stress–strain curves of rock samples with different rock-bridge angles.
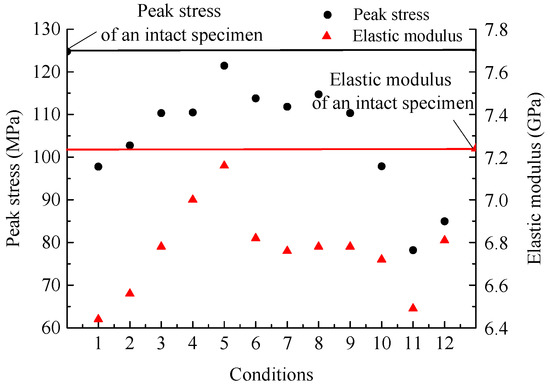
Figure 7.
Peak stress and modulus of elasticity of jointed red sandstone.
Table 3.
Parameters of the mechanical characteristics.
When the fracture angle is 45°, the stress–strain curves for rock-bridge angle β equal to 0°, 15°, 30°, 45°, 60°, 75° and 90° are shown in Figure 6. According to the figure, the rock-bridge angle β has a great influence on the peak strength, postpeak stress and peak strain. The peak stress and elastic modulus of the rock samples first decrease and then increase with the increase in the rock-bridge angle, exhibiting a nonlinear distribution. When β is less than or equal to 45°, the rock peak stress is large. When β is equal to 30°, the peak stress is the maximal value. When β increases from 45° to 75°, the jointed rock mass peak stress decreases from 110.32 MPa to 78.2 MPa. When β increases from 75° to 90°, the peak stress increases from 78.2 MPa to 84.96 MPa, an increase of 8.63%. The trends of the elastic modulus and peak stress of specimens with different rock-bridge angles show similarities. When β is less than or equal to 45°, the rock peak strain varies little, and the peak strain gradually decreases with the increase in the rock-bridge angle.
3.2. Analysis of the Failure Mode
Figure 8 shows the failure modes of the double-fractured specimens with different fracture angles when the rock-bridge angle is 45°. This figure reveals that with the increase in the fracture angle, the final rupture mode changes of the sample can be divided into three categories. When the fracture angle α equals 0° or 30°, the failure mode of the specimen is approximately a positive Y shape. When the fracture angle α equals 45° or 60°, the failure mode of the specimen is approximately an inverse Y type, and when α equals 90°, the failure mode of the specimen is inclined failure. Owing to the similarity in the failure modes of the specimens with fracture angles of 0° or 30° and 45° or 60°, the mechanical properties of these specimens do not exhibit large differences. The coalescence failure is coplanar. Secondary cracks develop in the upper prefabricated cracks, and wing cracks develop in the lower prefabricated fissures with α angles of 0° and 30°. This mode is caused by the coalescence of the shear cracks and occurs mostly when α is less than or equal to 45°. When α is equal to 45° or 60°, cross coalescence failure between the wing cracks of the tip of the lower prefabricated fissure and the secondary cracks occurs. The failure modes for α equal to 90° and the intact rock specimen are similar, and the mode is mainly shearing and coalescence failure.
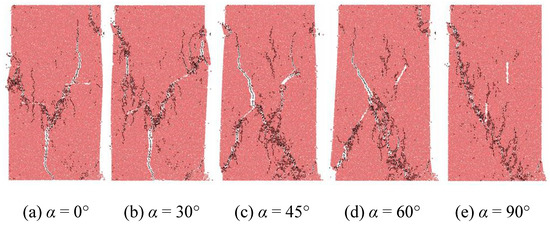
Figure 8.
Failure modes of red sandstone specimens with different double fracture angles.
Figure 9 shows the failure mode of double-fractured specimens with different rock-bridge angles under a fracture angle of 45°. The failure modes of specimens with different rock-bridge angles are roughly classified as follows: β less than or equal to 45°: No coalescence failure; β greater than or equal to 45°: Coalescence failure. Under noncoalescence failure, when β equals 0°, the failure shape of the rock sample is approximately a V type; when β equals 15°, the failure shape of the rock sample is approximately a positive Y type; and when β equals 30° or 45°, the failure shape of the rock sample is an X type. Under coalescence failure, the failure of the rock sample is inclined failure. In addition, the coalescence failure modes of the rock bridge are mostly tensile cracking and shear cracking. For example, when β equals 90°, typical tensile crack failure occurs, and this failure mode reduces the compressive strength of the specimen.
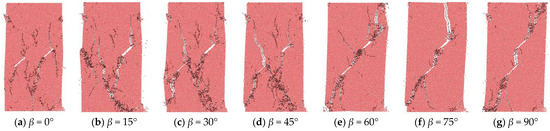
Figure 9.
Failure modes of red sandstone specimens with different rock-bridge angles.
3.3. Analysis of the AE Characteristics of Rock Mass Damage
Deformation or fracture will occur when rock is subjected to stress, and the release of strain energy in the form of elastic wave is called acoustic emission (AE). According to the relationship between AE characteristics and stress, it can be found that original microcracks are compacted in the elastic deformation stage, and few AE events generate. In the elastoplastic stage, new microcracks begin appearing or the original microcracks expand, the AE events increase greatly. As coming into the fracture stage, macro cracks appear, and AE events increase rapidly. Then, AE events reach the maximum after the specimen failure. That is why the maximum value of AE events might slightly lag behind the peak stress.
Figure 10 and Figure 11 are stress–strain–AE characteristic curves and strain–AE cumulative ringing count curves of double-fractured rock samples with different fracture angles α. It can be seen from the figures that the evolution process of AE consists of three stages. The first stage is the initial stage of AE, which corresponds to the elastic phase of the stress–strain curve, and AE events are rare or do not occur. This phenomenon is different from that of real rock specimen, and the initial stage of the real rock specimen will have certain AE events because the PFC parallel-bond model has no initial damage, whereas the real rock mass has some initial damage. The second stage is the stage in which AE increases gradually, which corresponds to the plastic stage of the rock, and the AE signals constantly increase until the peak. The third stage is the stage of AE decline, which corresponds to the stage of rock damage, and the AE signals continue to decrease until reaching a smooth or zero state. The fracture angle has little influence on the AE characteristic rules of the rock sample. The strength of the AE signal and the count of the cumulative ringing of AE first increase and then decrease with the fracture angle. However, the amplitudes of the changes are not significant. When α equals 30° for the rock sample, the AE signal strength is the weakest, and when α equals 45° for the rock sample, the AE signal is the strongest. The strain range of the rock mass that produces obvious AE events has a gradually decreasing trend under different fracture angles. When α equals 0°, the strain range of the apparent AE events is the most extensive, at a strain value of approximately 1.9% (0.8–2.7%). When α equals 90°, the strain range of the apparent AE events is the smallest, at a strain value of approximately 1.35% (0.85–2.2%).
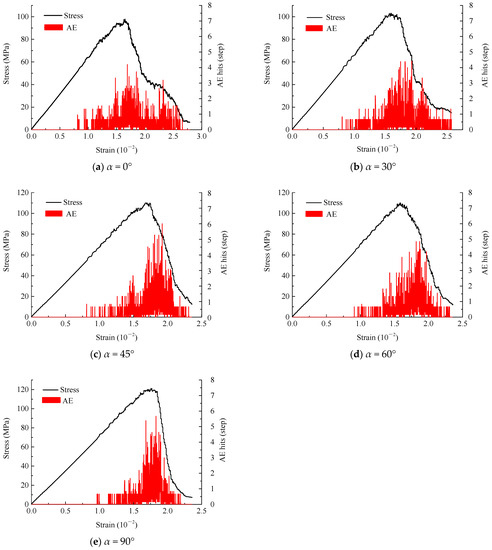
Figure 10.
Stress–strain–AE (acoustic emission) characteristic curves of double-fractured rock samples with different fracture angles.
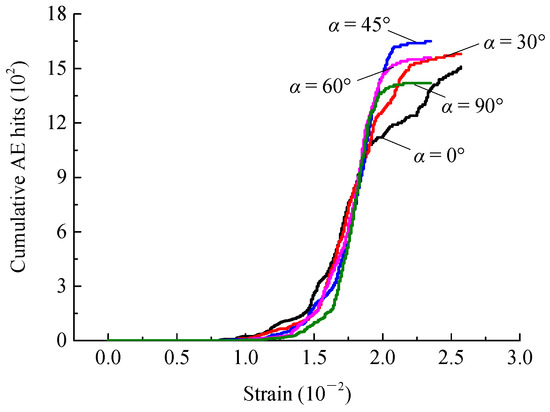
Figure 11.
AE cumulative ringing count curves of double-fractured rock samples with different fracture angles.
Figure 12 shows the stress–strain–AE relationship of double-fractured rock samples under different rock-bridge angles β. The influence of the rock-bridge angle on the AE characteristics of rock samples is mainly reflected in the AE signal strength and the corresponding strain values. When the rock-bridge angle is in the range from 0° to 90°, the ringing count strength of AE has decreases first and then increases. When β equals 75°, the minimum strength is observed. The peak of two or three AE ringing bursts appears when β equals 75° or 90°. The stress is reduced to a certain extent after the peak, exhibiting a rebound phenomenon, and the strain value corresponding to the initial peak value is smaller, mainly due to the different failure modes of the rock samples (as per Figure 8). A wing crack appears in the tip of the crack, and rock-bridge fracture occurs through prefabricated fissure coalescence, which makes the basic failure of the rock mass reach the peak stress. However, the rock sample is not completely coalesced and exhibits a residual stress. By continuing loading, a new peak stress occurs when the rock sample is completely coalesced, and then the stress drops.
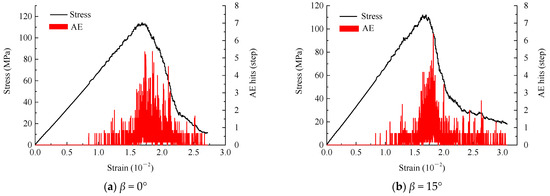
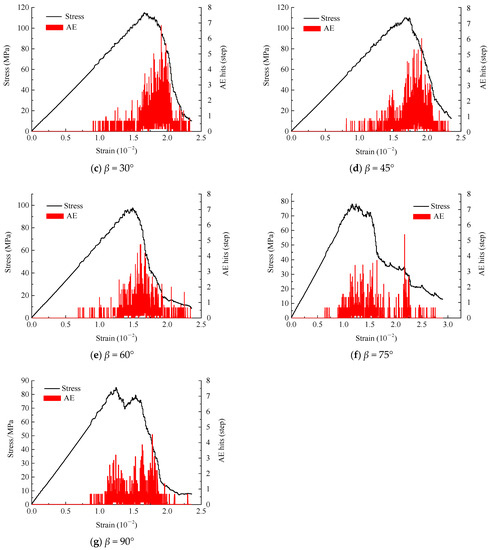
Figure 12.
Stress–strain–AE characteristic curves of double-fractured rock samples under different rock-bridge angles.
Figure 13 shows the strain-AE cumulative ringing count curves for double-fractured specimens under different rock-bridge angles. The cumulative ringing count of AE during the rock loading process has the same trend as the peak stress intensity. When α is 30°, the AE cumulative ringing count of rock samples reaches the maximum value of 1.78 × 10³ times. When α is 75°, the AE cumulative ringing count of rock samples reaches the minimum value of 9.67 × 10² times. That is, the peak stress of the rock mass is directly proportional to the AE cumulative ringing count.
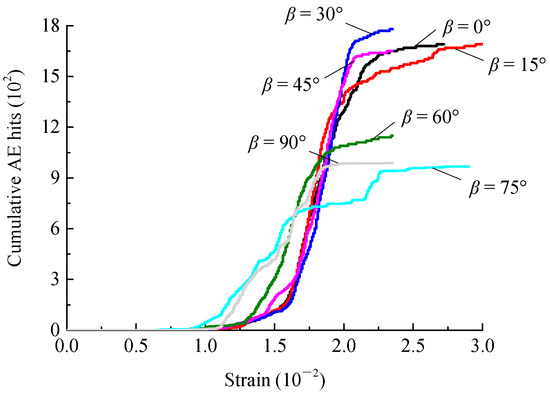
Figure 13.
Strain-AE cumulative ringing count curves of double-fractured rock samples under different rock-bridge angles.
4. Influence of Joint Geometric Properties on the Damage Evolution Characteristics of the Rock Mass
The AE information of the rock can be used to study the damage in the rock to reveal the evolution of the rock dynamic disaster and the generation mechanism of the time effect of the disaster. The AE characteristics of rock can describe its deformation and damage evolution characteristics, and they are closely related to the internal compression of primary fractures and the formation, expansion and penetration of new fractures. The study of the evolution characteristics of rock damage is of great guiding significance for the deep understanding of the rock fracture mechanism and the prevention of disasters and accidents caused by rock fracture and instability.
4.1. Rock Mass Damage Model Based on AE Characteristics
Many studies have shown that AE ringing counts are proportional to the strain energy released by material dislocation, fracture and fracture propagation and that they can reflect the change in material properties [25]. In this work, the characteristics of damage evolution of sandstone are characterized by AE ringing counts.
The scholar Kachanov [26] defined the damage variable as
where D is the damage variable that represents cumulative damage, Ad is the cross-sectional area of material damage in a certain period and A is the cross-sectional material area without initial damage.
Suppose that, when the rock specimen loses its bearing capacity completely, the number of total cumulative AE events is C. The number per unit area damage is Cw:
When the cross-sectional area of damage reaches Ad, the cumulative AE ringing count Cd is
Thus,
Because it is difficult for the sandstone specimen to be completely damaged during compression, the damage variable can be corrected to [27,28]
where Du is the critical value of damage.
According to the transformation of the linear function, the critical value of damage is normalized.
In the formula, σp is the peak intensity, and σc is the residual strength.
Based on AE characteristics and the strain equivalence principle [29], a damage constitutive model of the sandstone specimen under uniaxial compression is established:
The stress–strain curve fitted by the damage constitutive Equation (8) that uses AE characteristics is shown in Figure 14. The fitted curve is in agreement with the actual numerical curve. Equation (6) defines the damage variable based on the normalized cumulative AE ringing count, which is reasonable.
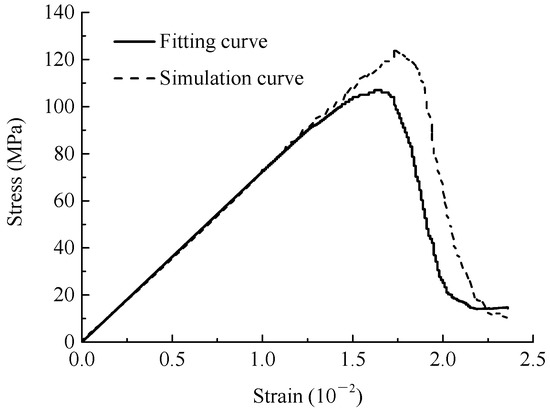
Figure 14.
Stress–strain relation curves.
4.2. Damage Evolution Law of Double-Jointed Rock Mass Based on AE Characteristics
Using the damage variable established according to Equation (6), the relationship curve between the strain and damage of red sandstone samples is obtained, as shown in Figure 15 and Figure 16. The figures reveal that the damage evolution process of different jointed sandstone specimens can be divided into four stages. The first stage is the initial stage of damage. This phase corresponds to the elastic stage of the stress–strain curve of the jointed rock mass. The jointed rock mass sample is in the compaction elastic deformation process, the internal portion of the rock sample has almost no damage, and the damage variable goes towards zero. The second stage is the stable increase stage, which corresponds to the elastic-plastic stage of the stress–strain curve of the jointed rock mass, and a new microcrack in the specimen begins to appear or a microcrack expands gradually. The third stage is the stage of accelerated development, which corresponds to the plastic flow stage of the stress–strain of the jointed rock mass. The microcracks in the specimen are rapidly expanded and converge, and the local macroscopic damage is increased. The bearing capacity drops rapidly, and the damage variable rises sharply. The fourth stage is the stage of stable damage and failure, which corresponds to the residual damage phase of the stress–strain curve of the jointed rock mass. The microcracks in the specimen coalesce, and the damage variable gradually becomes equal to the damage critical value.
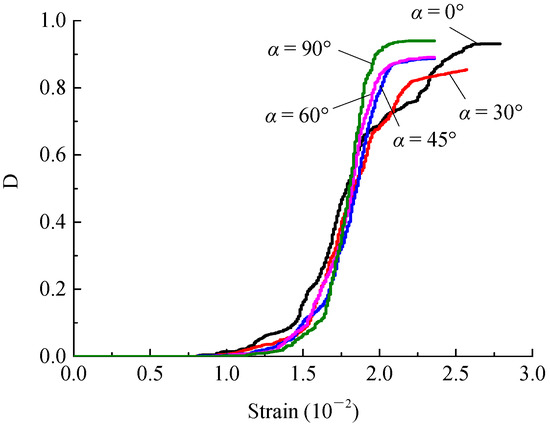
Figure 15.
Strain-damage variable curve of rock samples with different fracture angles.
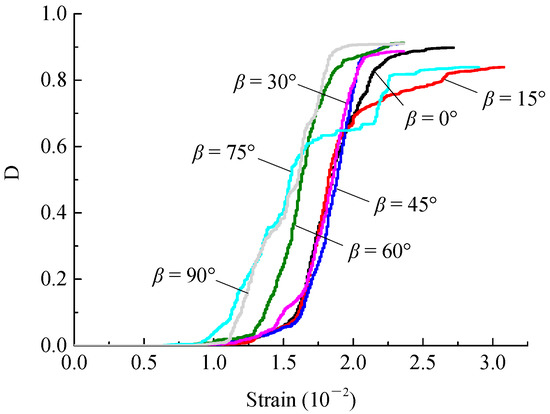
Figure 16.
Strain-damage variable curve of rock specimens with different rock-bridge dip angles.
Figure 15 reveals that the damage decreases with the increase in the fracture angle. The influence of the fracture angle on the initial stage of damage, the steady increase stage and the accelerated development stage is not very large. This parameter mainly affects the stable damage stage. The smaller the crack angle is, the greater the strain value reached in the stable damage stage. In addition, the stable damage values for different fracture angles differ. For example, the stable damage value is approximately 0.97 when the fracture angle is 0° or 90°, while the stable damage value is approximately 0.88 when the fracture angle is 30°.
From Figure 16, it can be seen that the rock-bridge angle mainly influences the evolution of the damage variable in the stable damage increase, accelerated damage development and stable damage stages. In the stage of stable damage increase, when β is less than or equal to 45°, the trends of the sample damage variable are similar. The occurrence time of damage at this stage is later than that of the samples with a β value of greater than or equal to 45°. In the stage of accelerated damage development, the greater the angle of the rock bridge is, the slower the change in the damage variable and the higher the relaxation strain extent, which is related to the failure mode of the jointed rock mass. At the damage stabilization stage, different rock-bridge angles also show different stable damage values. Through the analysis of the above damage evolution rule, it is further revealed that the transformation from rock deformation to failure can be regarded as a gradual development process: Through the formation and expansion of deformation and damage, a macroscopic crack appears, at which point the crack is extended throughout the failure process. The formation of a rock dynamic disaster exhibits strain evolution.
5. Conclusions
In this work, a uniaxial compression numerical test was carried out on double-fractured red sandstone specimens with different joints using PFC. The mechanical characteristics, AE characteristics and damage evolution characteristics of rock samples with different fracture conditions were studied. The following conclusions can be drawn:
- The peak stress and elastic modulus of samples increase with the increase in α, and their change trends are similar. The postpeak stress decreases with the increase in α. The fracture angle α has a nonlinear distribution, and the amplitude of the change is small. The peak stress and elastic modulus of rock samples first decrease and then increase with the increase in the rock-bridge angle, exhibiting nonlinear distributions. The variation trends of the elastic modulus and peak stress of specimens with different rock-bridge angles are similar. When β is less than or equal to 45°, the rock peak strain differs little and the peak strain decreases gradually as the rock-bridge angle increases.
- With the increase in the fracture angle, the final fracture mode of the sample can be divided into three categories: A positive Y shape, an inverted Y type and inclined failure. The failure modes of specimens with different rock-bridge angles are roughly classified as follows: When β is less than or equal to 45°: No coalescence failure; when β is greater than or equal to 45°: Coalescence failure. Under noncoalescence failure, the failure shapes of rock samples include V type, positive Y type, X type and inclined failure.
- The evolution process of AE in fractured rock mass includes three stages: The initial stage of AE, the increasing stage of AE and the stage of AE decrement. The fracture angle has little influence on the characteristics of AE from rock samples. The intensity of the AE signal and the count of the cumulative ringing of AE first increase and then decrease with the fracture angle, but the amplitudes of the changes are not significant. The strain range of rock mass that produces obvious AE events has a gradually decreasing trend under different fracture angles. The influence of the rock-bridge angle on the AE characteristics of the rock is mainly reflected in the intensity of AE signals and the corresponding strain values. With the increase in the rock-bridge angle, the intensity of the AE ringing counts first decreases and then increases.
- The damage evolution process of sandstone specimens with different joints can be divided into four stages: The initial damage stage, the stable increase stage, the accelerated development stage, and the stable damage stage. The effect of the fracture angle on the initial damage, steady increase and accelerated development stages is not great; this parameter mainly affects the stable damage stage. The smaller the fracture angle, the greater the strain value reached in the stable damage stage. The rock-bridge angle mainly influences the evolution of the damage variables of the specimen in the damage stable increase, accelerated damage development and stable damage stages. In the stage of stable damage increase, when β is less than or equal to 45°, the failure variation trends are similar. The occurrence time of damage at this stage is later than that for samples with β greater than or equal to 45°. In the stage of accelerated damage development, the greater the angle of the rock bridge is, the slower the change in the damage variable and the higher the degree of strain relaxation, which is related to the failure mode of the jointed rock mass. In the stage of damage stabilization, different rock-bridge angles also show different stable damage values.
Author Contributions
Y.T. and Y.Y. designed research; J.Z. and X.C. performed the numerical simulation; D.H. and X.C. analysed the data; D.H. wrote the manuscript; all authors reviewed the manuscript. Correspondence should be addressed to D.H and X.C.
Funding
This research was supported by the National Natural Science Foundation of China (no. 51704179), Natural Science Foundation of Shandong Province (no. ZR2016EEB23), Science and Technology Program of Shandong Province University (no.J15LH02), First-class discipline construction projects(no. 01AQ03703, 01CK05902) and Open Funds of State Key Laboratory (no.MDPC2016ZR03).
Conflicts of Interest
The authors declared no potential conflicts of interest.
References
- Park, B.; Min, K.B. Bonded-particle discrete element modeling of mechanical behavior of transversely isotropic rock. Int. J. Rock Mech. Min. 2015, 76, 243–255. [Google Scholar] [CrossRef]
- Guo, W.Y.; Tan, Y.L.; Yu, F.H.; Zhao, T.B.; Hu, S.C.; Huang, D.M.; Qin, Z. Mechanical behavior of rock-coal-rock specimens with different coal thicknesses. Geomech. Eng. 2018, 15, 1017–1027. [Google Scholar] [CrossRef]
- Walsh, J.B. The effect of cracks on the compressibility of rock. J. Geophys. Res. 1965, 70, 381–389. [Google Scholar] [CrossRef]
- Goodman, R.E.; Tayor, R.L.; Breke, T.L. A model for the Mechanics of Jointed Rock. Soil Mech. Found. Div. 1968, 94, 637–659. [Google Scholar]
- Ladanyi, B.; Archambault, G. Simulation of shear behavior of a jointed rock mass. In Proceedings of the 11th U.S. Symposium on Rock Mechanics, Berkeley, CA, USA, 16–19 June 1969; pp. 105–125. [Google Scholar]
- Hoek, E.; Wood, D.; Shah, S. Modified Hoek-Brown failure criterion for jointed rock masses. In Proc ISRM Symposium; Hoek, E., Wood, D., Shah, S., Eds.; Thomas Telford: London, UK, 1992. [Google Scholar] [CrossRef]
- Lin, P.; Wong, R.H.C.; Chau, K.T.; Tang, C.A. Multi-Crack Coalesence in Rock-Like Material under Uniaxial and Biaxial Loading. Key Eng. Mater. 2000, 183–187, 809–814. [Google Scholar] [CrossRef]
- Wong, L.N.Y.; Einstein, H.H. Systematic evaluation of cracking behavior in specimens containing single flaws under uniaxial compression. Int. J. Rock Mech. Min. 2009, 46, 239–249. [Google Scholar] [CrossRef]
- Yang, S.Q.; Dai, Y.H.; Han, L.J.; Jin, Z.Q. Experimental study on deformation and failure characteristics of brittle marble with intermittent prefabricated cracks under uniaxial compression. Chin. J. Rock Mech. Eng. 2009, 28, 2391–2404. [Google Scholar]
- Qin, S.Q. An Introduction to Acoustic Emission Technology of Rock; Li, T.X., Yang, Y., Eds.; Southwest Jiaotong University Press: Chengdu, China, 1993; ISBN 7-81022-575-8. [Google Scholar]
- Blake, W. Microseismic Applications for Mining—A Practical Guide; U.S. Bureau of Mines, US Department of the Interior: Washington, DC, USA, 1982; pp. 52–83. [CrossRef]
- Lockner, D.A.; Byerlee, J.D.; Kuksenko, V.; Ponomarev, A.; Sidorin, A. Quasi-static fault growth and shear fracture energy in granite. Nature 1991, 350, 39–42. [Google Scholar] [CrossRef]
- Guo, W.Y.; Zhao, T.B.; Tan, Y.L.; Yu, F.H.; Hu, S.C.; Yang, F.Q. Progressive mitigation method of rock bursts under complicated geological conditions. Int. J. Rock Mech. Min. Sci. 2017, 96, 11–22. [Google Scholar] [CrossRef]
- Yin, D.W.; Chen, S.J.; Liu, X.Q.; Ma, H.F. Effect of joint angle in coal on failure mechanical behavior of rock-coal combined body. Q. J. Eng. Geol. Hydrogeol. 2018, 51, 202–209. [Google Scholar] [CrossRef]
- Cundall, P.A.; Strack, O.D. A discreate numerical model for granula assemblies. Geotechnique 1979, 29, 47–65. [Google Scholar] [CrossRef]
- Lee, H.; Jeon, S. An experimental and numerical study of fracture coalescence in pre-cracked specimens under uniaxial compression. Int. J. Solids Struct. 2011, 48, 979–999. [Google Scholar] [CrossRef]
- Guo, W.Y.; Gu, Q.H.; Tan, Y.L.; Hu, S.C. Case Studies of Rock Bursts in Tectonic Areas with Facies Change. Energies 2019, 12, 1330. [Google Scholar] [CrossRef]
- Wang, X.; Tian, L.G. Mechanical characteristics of coal-rock under different fracture-holes conditions: A numerical study based on particle flow code. Environ. Earth Sci. 2018, 77, 1–10. [Google Scholar] [CrossRef]
- Potyondy, D.O.; Cundall, P.A. A bonded-particle model for rock. Int. J. Rock Mech. Min. 2004, 41, 1329–1364. [Google Scholar] [CrossRef]
- Cho, N.; Martin, C.D.; Sego, D.C. A clumped particle model for rock. Int. J. Rock Mech. Min. 2007, 44, 997–1010. [Google Scholar] [CrossRef]
- Yin, Y.C.; Zhao, T.B.; Tan, Y.L.; Yu, F.H. Reconstruction and numerical test of rock microscopic model based on Otsu image processing. J. China Coal Soc. 2015, 36, 2532–2540. [Google Scholar]
- Fakhimi, A.; Carvalho, F.; Ishida, T. Simulation of failure around a circular opening in rock. Int. J. Rock Mech. Min. 2002, 39, 507–515. [Google Scholar] [CrossRef]
- Wen, Z.J.; Wang, X.; Chen, L.J.; Lin, G.; Zhang, H. Size effect on acoustic emission characteristics of coal-rock damage evolution. Adv. Mater. Sci. Eng. 2017, 2017. [Google Scholar] [CrossRef]
- Wang, Y.F.; Huang, Z.J.; Cui, F. Microscopic mechanical damage evolution mechanism of coal and rock failure process. J. Coal 2014, 39, 2390–2396. [Google Scholar]
- Liu, X.W.; Shi, Z.Y. Research on Evaluation of material Fatigue Damage by Acoustic Emission Technology. China Railw. Sci. 1997, 4, 74–81. [Google Scholar]
- Kachanov, L.M. Time of the Rupture Process under Creep Conditions, Izy Akad. Nank S. S. R. Otd Tech. Nauk 1958, 8, 26–31. [Google Scholar]
- Liu, B.X.; Huang, J.L.; Wang, Z.Y.; Liu, L. Study on damage evolution and acoustic emission character of coal-rock under uniaxial compression. Chin. J. Rock Mech. Eng. 2009, 28, 3234–3238. [Google Scholar]
- Wang, X.; Wen, Z.J.; Jiang, Y.J.; Huang, H. Experimental Study on Mechanical and Acoustic Emission Characteristics of Rock-Like Material Under Non-uniformly Distributed Loads. Rock Mech. Rock Eng. 2018, 3, 729–745. [Google Scholar] [CrossRef]
- Lemaitre, J.; Sermage, J.P.; Desmorat, R. A two scale damage concept applied to fatigue. Int. J. Fract. 1999, 97, 67–81. [Google Scholar] [CrossRef]
© 2019 by the authors. Licensee MDPI, Basel, Switzerland. This article is an open access article distributed under the terms and conditions of the Creative Commons Attribution (CC BY) license (http://creativecommons.org/licenses/by/4.0/).