The size of Taiwan soldiers’ uniforms is modified from the folk size specifications nowadays. However, if the soldiers’ body types do not conform to the regulations they will be eliminated by medical examination before enlisting. It cannot meet the current situation, because we lack a uniform system for soldiers, which focuses on their body type. In particular, the wave of big data has swept the world and brought amazing profits to enterprises. Although the purpose of the military sector is not for profit, we cannot ignore the agility and innovation that big data brings. This study was expected to apply anthropometric data effectively, and let the military make quick, sensible decisions as much as possible. We have the following two goals to reach in this paper:
Modern military science and technology policies are moving toward integrated research and development while taking into account commercial interests and reducing the development costs of national defense science and technology. Therefore, the introduction of relevant assessment methods into military research has emerged. Yang et al. [
3] used an operation loop with realistic link rules to model the cooperation relationships among weapons in the defense system. Wan et al. [
4] proposed a lookahead behavior model examining simulations. Lu and You [
5] employed a new model with a route map and evaluated driven forces improvement of new technology to study real environment of defense skills. In the literature on size systems, Tryfos [
6] suggested an integer programming method for optimizing the number of sizes or minimizing an aggregate index to maximize expected sales. McCulloch et al. [
7] constructed a size system using a nonlinear optimization approach to maximize the quality of fit. Laing et al. [
8] used the K-means cluster analysis method to establish size charts for protective clothing used by firemen in New Zealand. Moon and Nam [
9] used the same method to classify the lower body shapes of senior women into a few figure types and subsequently employed a control dimension and size interval to establish a lower garment size system. Gupta and Gangadhar [
10] applied multivariate analysis to develop size charts for young females in India. Hsu and Wang [
11] utilized a decision tree-based data mining method to develop size systems for the pants of Taiwanese soldiers. Gupta et al. [
12] adopted a linear programming approach to classify size groups. Hsu et al. [
13] proposed a two-stage cluster analysis approach to classify the anthropometric data of adult females in Taiwan and develop size charts. Chung et al. [
14] employed data mining to establish size systems for elementary and high school students. Zakaria et al. [
15] used multivariate statistical analysis to explore anthropometric data and develop a size system. They surveyed 629 schoolgirls aged between 7 to 12 years belonging to three major ethnic groups, namely, Malays, Chinese, and Indians. Mason et al. [
16] used analysis of variance (ANOVA) to identify unique body shapes based on anthropometric data from female teachers in Africa. Vinue et al. [
17] proposed two algorithms based on a new hierarchical partitioning around medoids (HIPAM) clustering method originally developed for defining optimal prototypes for apparel design. Recent scholars used statistical analysis or 3D body scanning for different groups to develop sizing systems appropriate to particular groups of people. Maria et al. [
18] developed a new approach to examine anthropometric data through statistical analysis to obtain a customization model and evaluate satisfaction performance. The approach of Bagherzadeh et al. [
19] consists of three phases: factor analysis, two-step cluster analysis, and decision tree analysis. Esfandarani and Shahrabi [
20] used principal component analysis to cut sizing variables to partition a heterogeneous population into a homogeneous community such that the resulting size chart is estimated by the aggregate loss of the fitness method. Xia and Istook [
21] considered the sizing system creation process including natural log-transformation, principle component analysis, multivariate linear regression, size range determination, and measurements calculation. Hamad et al. [
22] defined an exhaustive methodology to obtain a clustering of human morphology shapes representative of a population and to extract the most significant morphotype of each class. The method of Lee and Ko [
23] also defined three misfit measures: landmark point misfit, landmark line misfit, and circumferential misfit. Some researchers proposed a neural network data mining framework to generate useful patterns for developing standard size charts to improve manufacturing competitiveness. Hsu [
24] proposed an Artificial Neural Network (ANN)-based data mining framework to generate useful patterns for developing standard size charts. For Iranian male suits, Vadood et al. [
25] presented a novel sizing chart by artificial neural network approaches. To cluster different body sizes, the Kohonen neural network was adopted with ten sizing parameters. Most researchers have used methods of statistical analysis, including principal component analysis. They have determined body size from several measurement variables and subsequently made classifications by one-way ANOVA, multivariate statistical analysis, cluster analysis, or optimal technology. However, these methods yield inferior results when the sample is large or when it has irregular cluster types or when examined under many classes. To address this problem, Ben-Hur et al. [
26] have recently developed support vector clustering (SVC), a new and excellent clustering and classification method. SVC is an unmonitored support vector machine (SVM) and a clustering analysis method for kernels. It requires few parameters and no assignment of cluster quantity, makes derivations by quadratic programming, and manages all types of clusters and extreme points (Ben-Hur et al. [
27]). In addition, it has been widely applied in several studies to solve problems in the fields of classification, regression, and new knowledge. For example, Chih [
28] demonstrated that kernel based Eigen-decomposition can integrate spatial statistics and support vector clustering can evaluate the number of deficiency clusters to divide convex and non-convex deficiency clusters at the same time. Through Garcia and Moreno [
29], accurate surface representations distributed in its volume of the objects from data can be obtained. The advantage of their approach can be applied for medical imaging, because it is noise robust and without complex partitions. Gianfranco and Ilie [
30] employed an SVC-based approach to integrate several support vectors by the traditional method of the Gaussian kernel where the clusters are packed together by a deterministic algorithm. Pei et al. [
31] constructed a new hierarchical classification algorithm to construct support vector machine learning by developing mirrors of the class hierarchy. The SVC model is valuable for reducing the time consumed in SVM training, developing the matrix of performance, and determining proper parameter values (
C and
q). It also determines cluster quantity (Wang and Chiang [
32]). Ben-Hur et al. [
26] did not locate the optimal parameter. There are three related papers: Cho and Seo [
33], Park et al. [
34], and Geem and Kim [
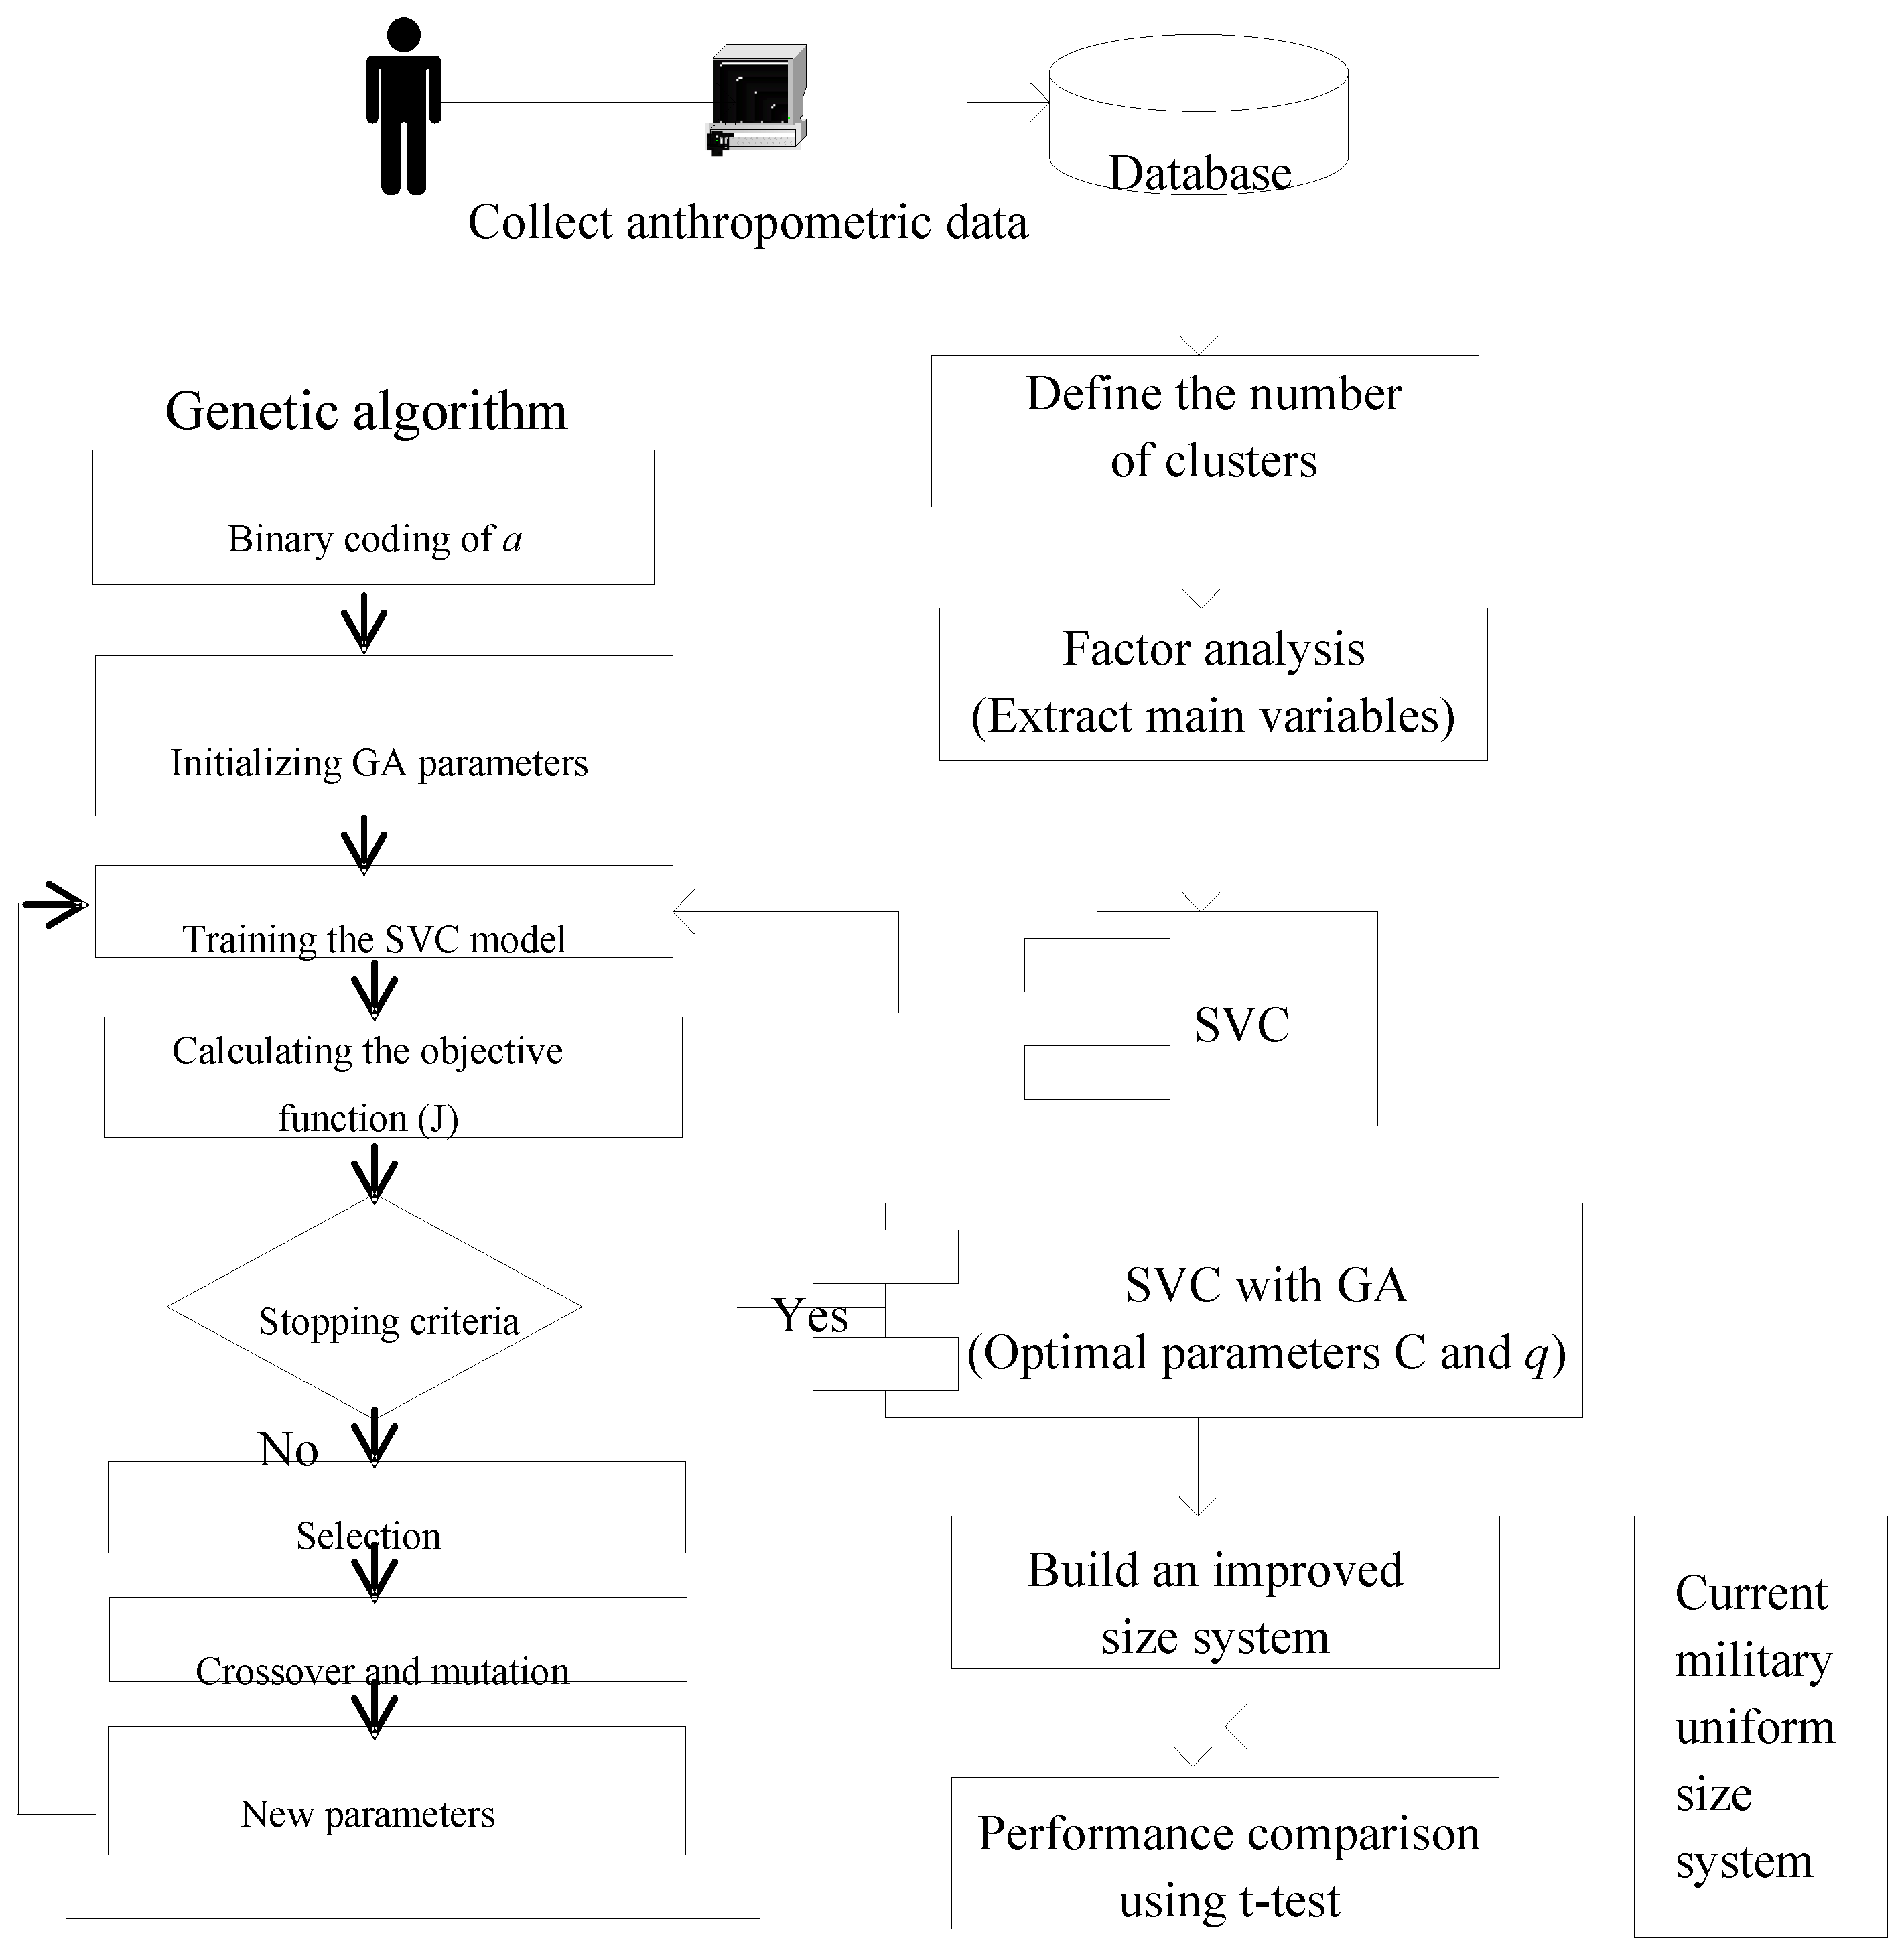
35] that are worth mentioning. In this manuscript we apply a genetic algorithm (GA) to search for the optimal parameter such that we can reach the best effect for non-audit training. Samples were first processed by principal component analysis to determine the crucial size variable. The GA was subsequently used to determine the optimal parameters for the SVC model. The proposed calculation process can be used to determine optimal parameter values for the SVC model and thereby alleviate calculation complexity and reduce the time required for training. For completeness, we provide a detailed description of the GA used in this paper.
In this paper, 1500 male anthropometric data samples on sleeve length, height, collar size, chest perimeter, and chest front horizon were collected from a military supply unit. We applied SVC on 1000 samples to classify military uniform sizes and verified such classification using 500 samples. To reduce inventory, decrease cost, and ease warehouse staff workload, we established an improved military uniform size system for males which uses total loss as a fitness function and alleviates the complexity of the current uniform size system. In the future, if female data is provided, we will reapply our methodology and update our results and techniques if necessary.


 is the minimum fitness value.
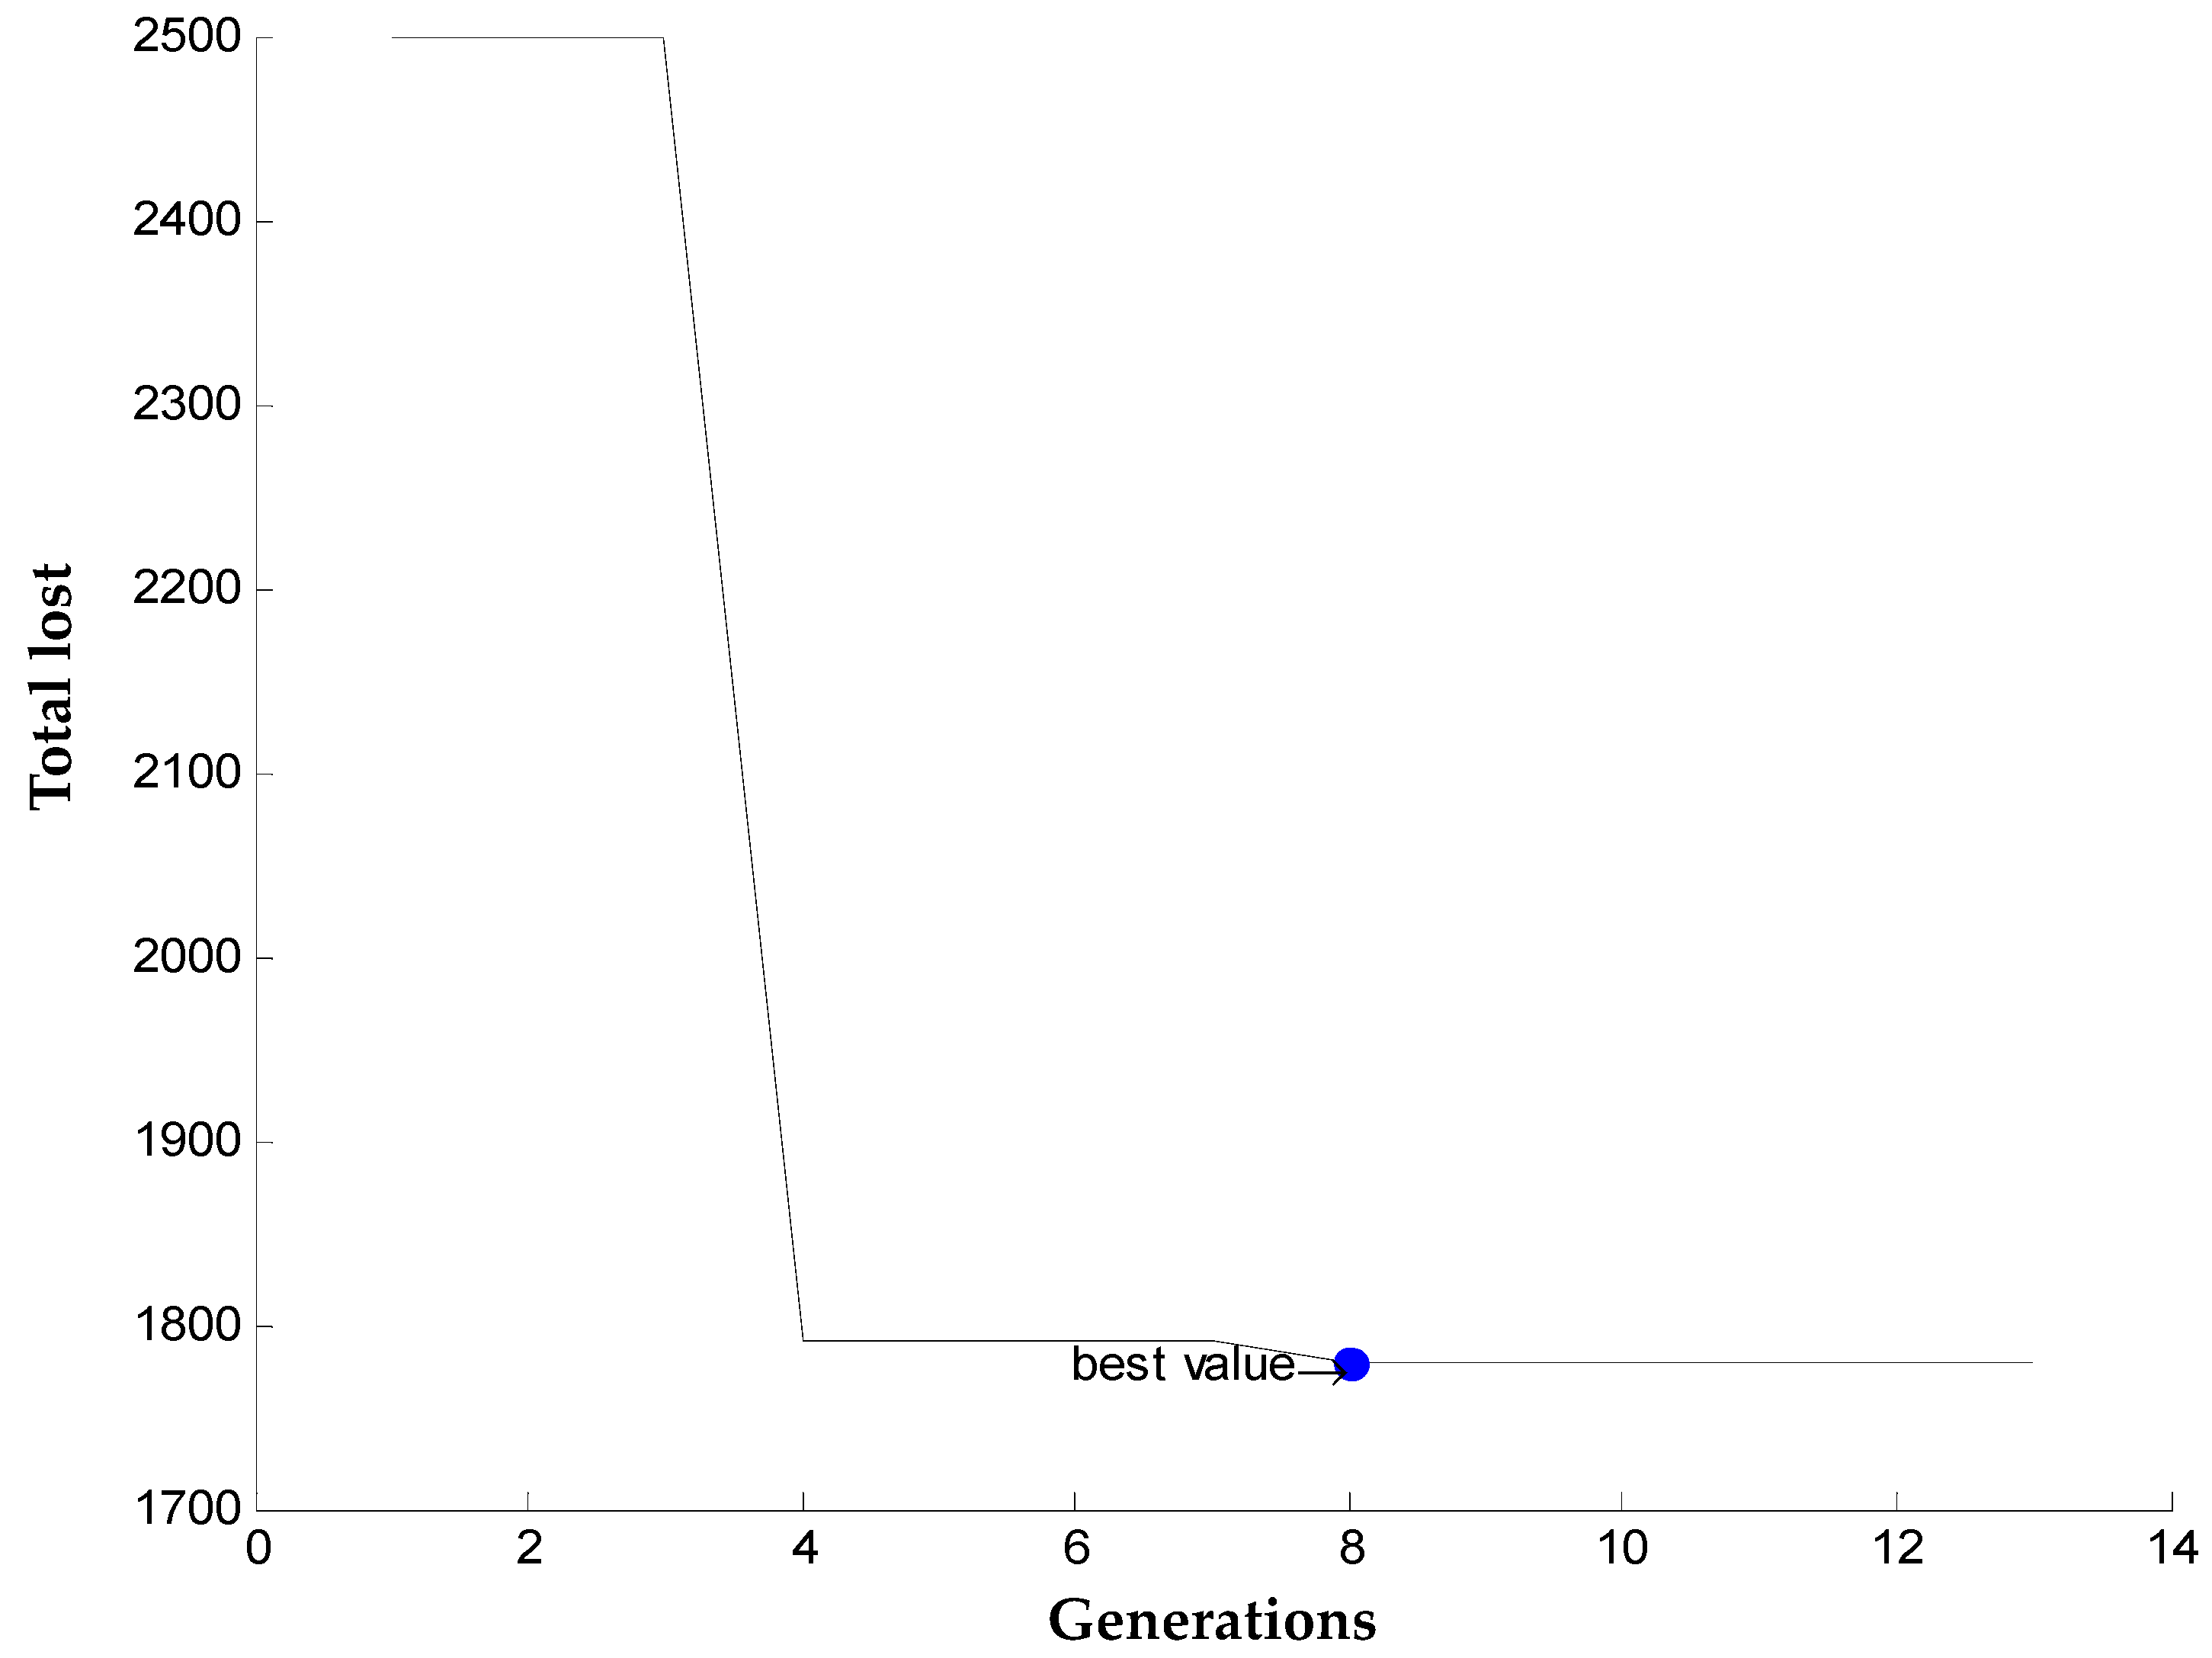
 is the minimum fitness value.


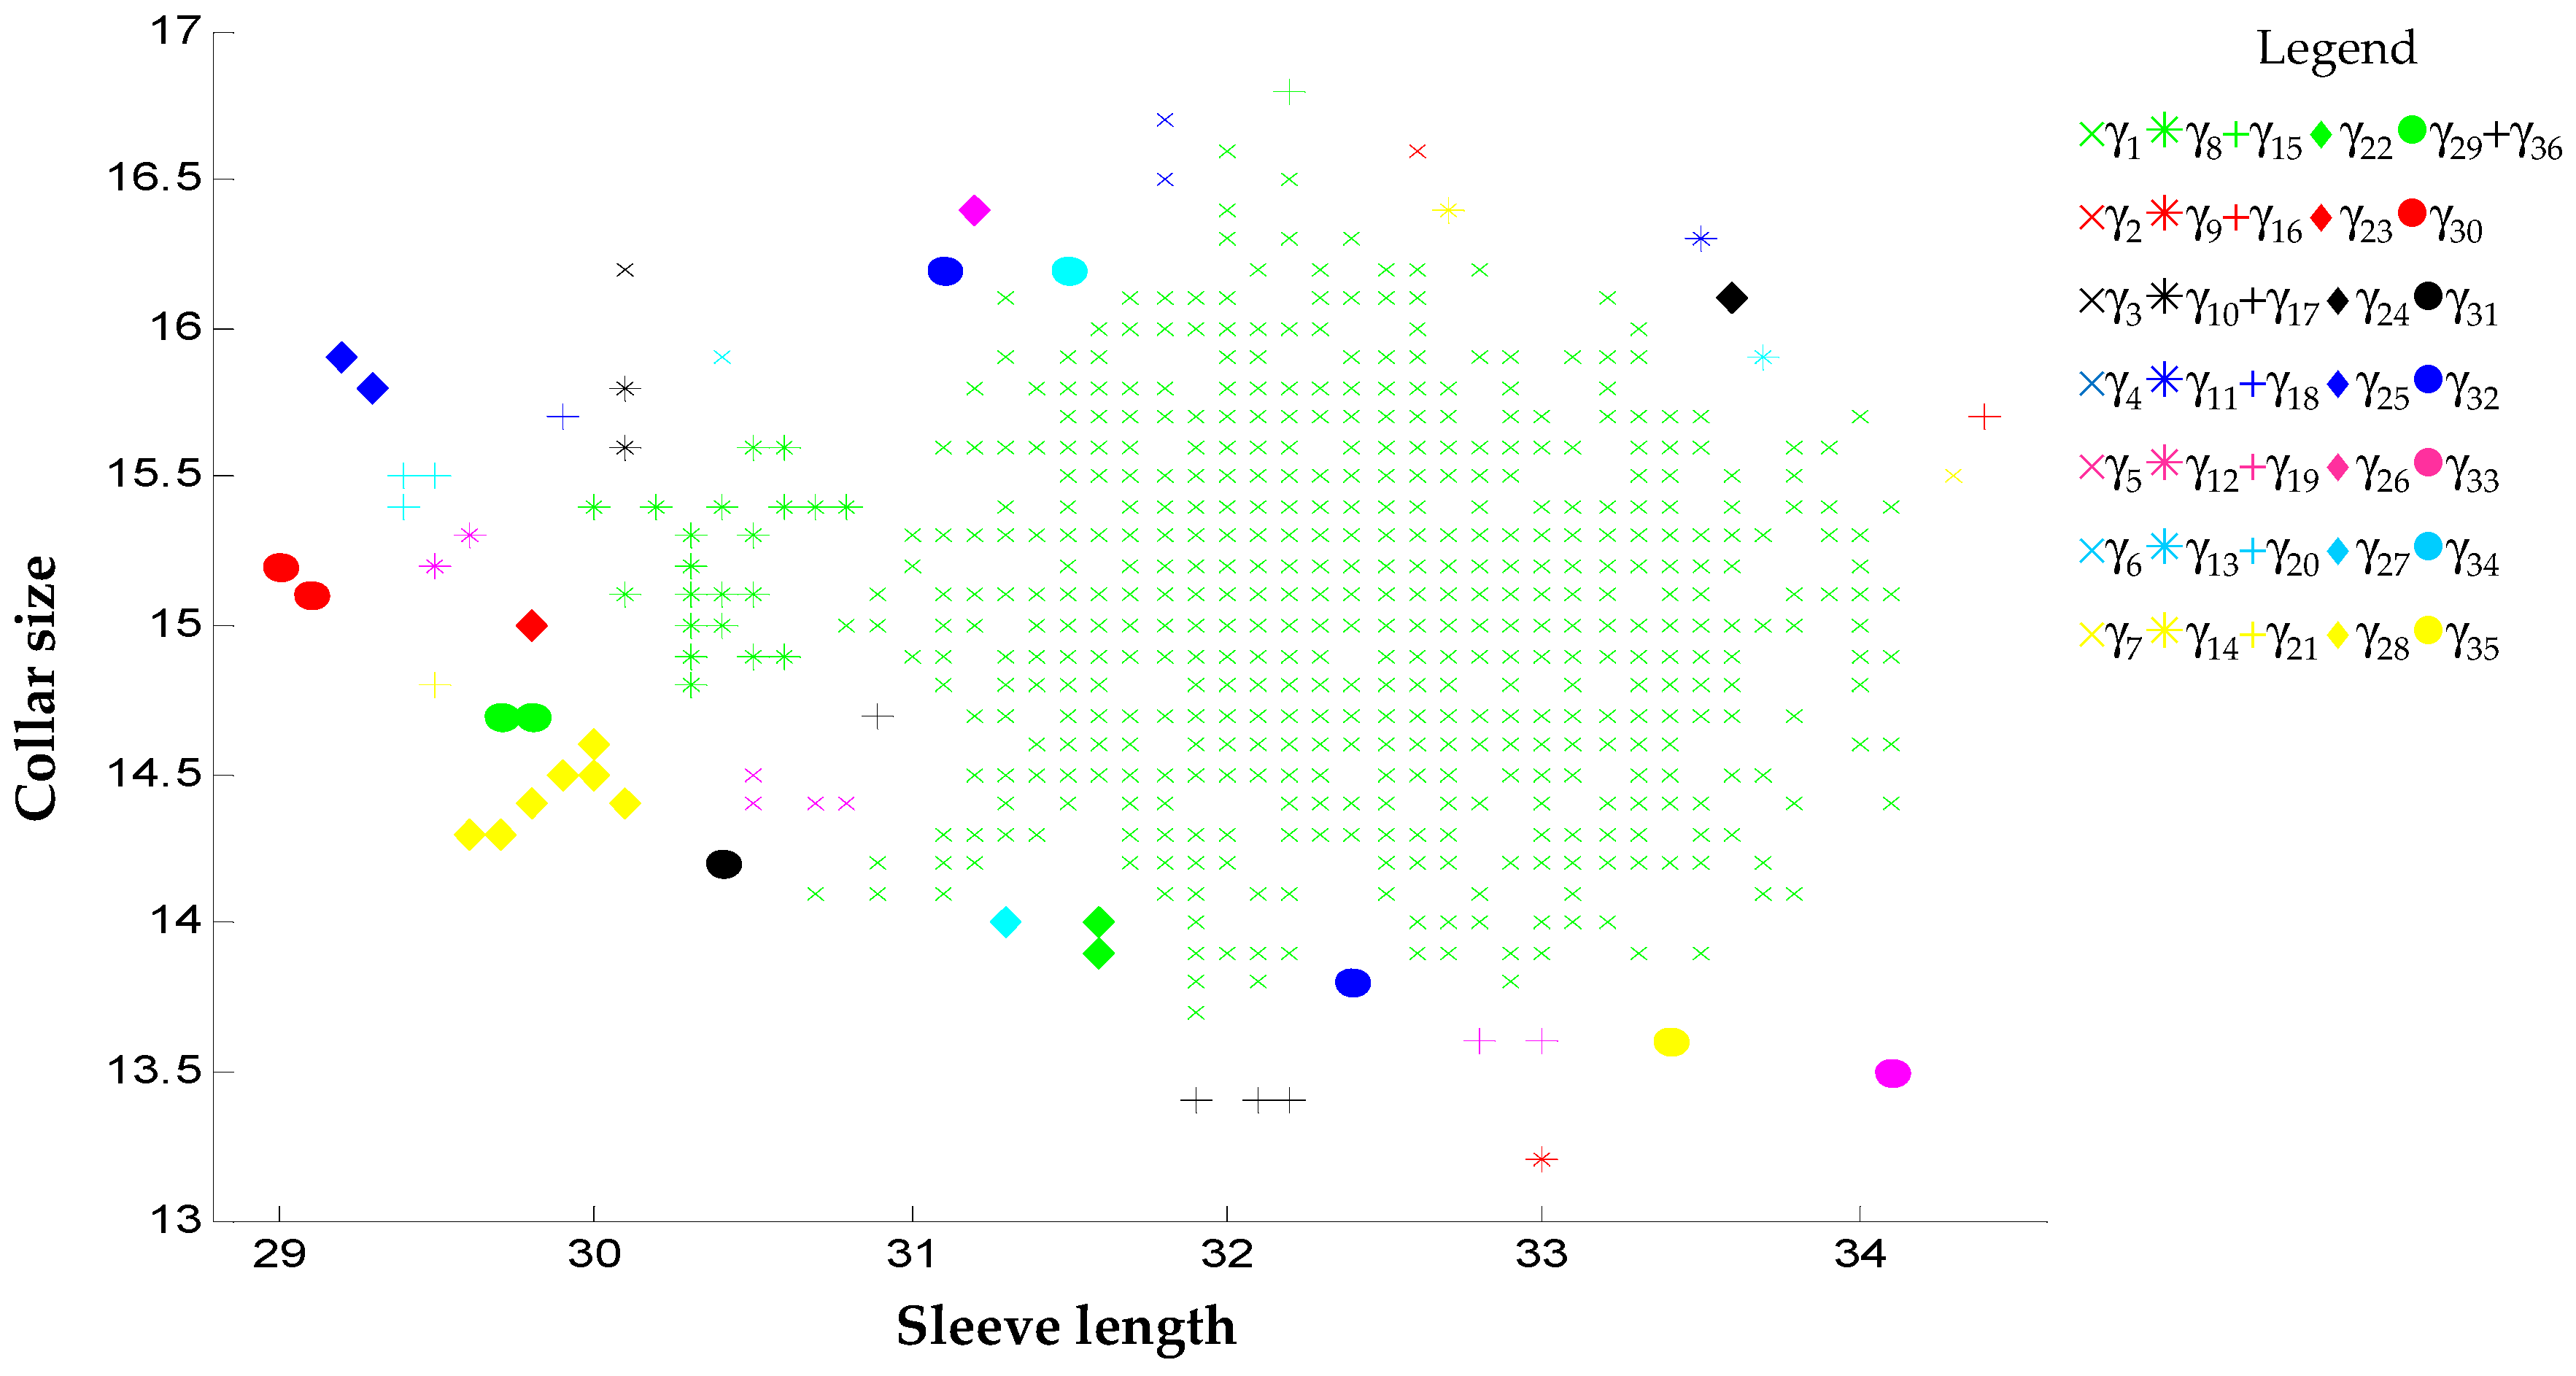
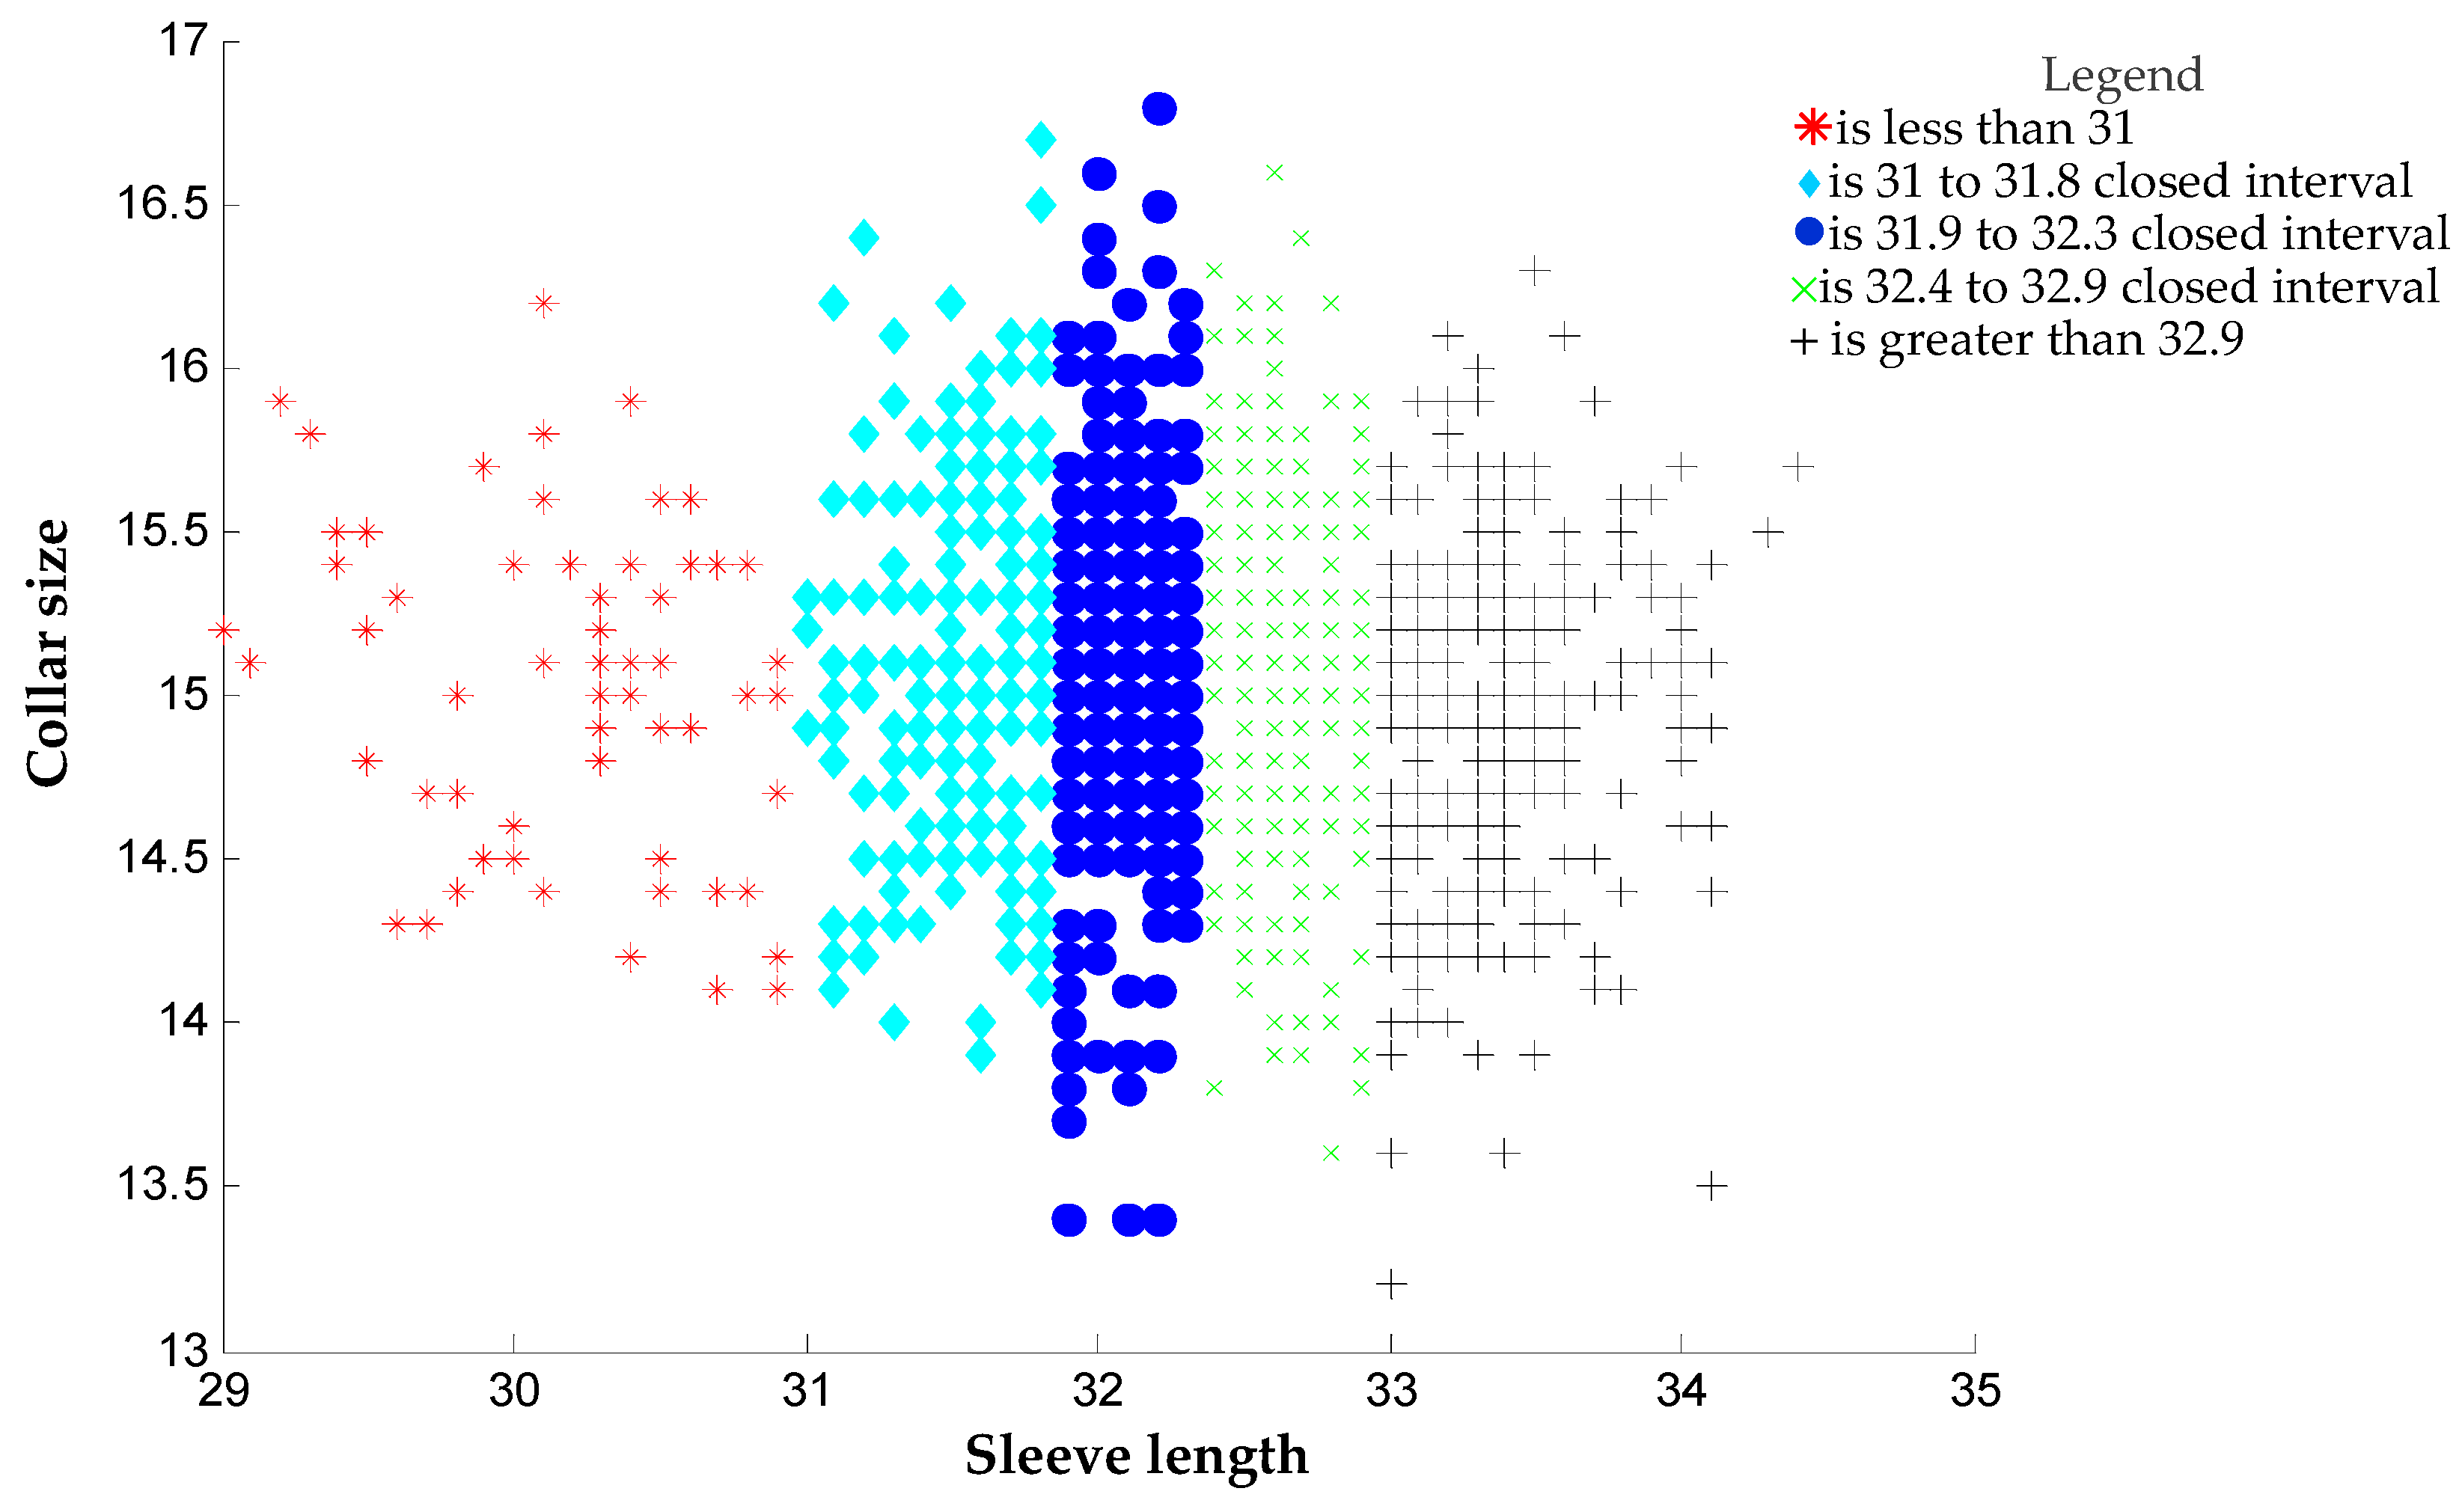
 : Size is unnecessary. Note: 15.1 XS means that the collar size is 15.1 inches, sleeve length is 29.1 inches, and the rest may be deduced by analogy.