1. Introduction
Defect Prediction in Software (DeP) is the process of determining parts of a software system that may contain defects [
1]. Application of DeP models early in the software lifecycle allows practitioners to focus their testing manpower in a manner that the parts identified as “prone to defects” are tested with more rigor in comparison to other parts of the software system [
2]. This leads to the reduction of manpower costs during development and also relaxes the maintenance effort [
3,
4]. DeP models are built using two approaches: First, by using measurable properties of the software system called Software Metrics and second, by using fault data from a similar software project. Once built, the DeP model can be applied to future software projects and hence practitioners can identify defects prone parts of a software system.
Initially, the models used for DeP were built using statistical techniques, but to make the model intelligent, i.e., capable of adapting to changing data in such a manner that as the development process matures the DeP model also matures; it is important that learning techniques are used while building DeP models. In the past, a large number of DeP studies have made use of machine learning techniques. For instance, some authors used Decision Tree (DT) [
5] and Artificial Neural Network (ANN) [
6] to build DeP models using Object-Oriented (OO) metrics [
7].
Although a large number of studies have been conducted in this domain, more efforts need to be explored. New algorithms are developed periodically, keeping in mind the shortcomings of the previous ones. The development processes also keep changing; this affects the type of data being maintained for a software project (defect data). Such factors require that new modeling techniques be built and benchmarked with the previous work to evaluate their efficacy. In short, the following challenges are encountered:
To identify lacking areas and facilitate the building and benchmarking of new DeP models it is important to study the previous works in a systematic manner and extract meaningful information. Literature surveys and systematic mappings have attempted to answer various questions about DeP models in the past. The authors in Reference [
6] study 106 papers published between 1991 and 2011 to identify software metrics that are important for software defect prediction [
8,
9,
10,
11]. They answered five research questions corresponding to various aspects of the software defect prediction problem with their focus on data used in model building. The authors [
12] examined 36 defect prediction studies between 2000 and 2010. The focus is on independent variables and techniques used to build models. They also paid attention to whether feature selection on independent variables has been done or not. The authors in Reference [
13] examined 148 studies between 2000 and 2009 with the focus on model building and performance evaluation techniques. Authors [
14,
15] reviewed 74 studies in 11 journals and seven conference proceedings. The focus of their study is on model building methods, metrics used, and datasets used. Other works can be seen in [
16].
To the best of our knowledge, no systematic review, till date, brings all aspects of DeP together. To help researchers and practitioners, it is imperative that good quality literature surveys and reviews that9 are concerned with the literature available for DeP be conducted and their results made available to the software engineering community. In this systematic mapping, we address various questions, including the above-stated questions (
Section 2.1). For this mapping, we collect all DeP studies between 1995 and 2018.
Remainder of the paper is organized as follows, in
Section 2 describe the research questions addressed in this systematic mapping and the process for selection of primary studies,
Section 3 gives the answers to the research questions identified in this work,
Section 4 concludes this systematic mapping and also provides future directions extracted from this system mapping.
2. Review Method
The mapping method in this study is taken from Reference [
1].
Figure 1 outlines the process diagram.
The first step is to identify the need for conducting the systematic mapping and establishing a protocol for the mapping. After this, research questions that the systematic mapping attempts to address are formulated. Once the questions have been identified and evaluated, a search query is designed which is used to extract studies from digital libraries. The studies collected are then passed through a four-stage process:
Application of Inclusion-Exclusion Criteria.
Quality Analysis of Included Studies.
Extraction of Data from selected Studies.
Identification of means to report results.
2.1. Research Questions
The objective of this mapping is to establish a starting point for future research in DeP and simultaneously provide practitioners with a summary of all the work done in the area of DeP allowing them to pick a prediction policy that suits them. The research questions identified in this context are given in
Table 1.
2.2. Literature Review
Primary studies by definition correspond to the literature being mappings. To provide a strong mapping it is essential that selection of primary studies for mapping must be done carefully. While it is good that an exhaustive search is conducted for the selection of primary studies, in some cases it is not possible because of the number of primary studies available. In such cases the search criteria become important. For DeP studies, we can conduct an exhaustive search because the number of primary studies is not very large and since we are only concerned with those studies which are empirical in nature, the number shrinks further. We have selected the list of following digital libraries to perform our search:
IEEE Xplore
Springer Link
Science Direct
Wiley Online Library
ACM Digital Library
Google Scholar
The Search String: A search string is the combination of characters and words entered by a user into a search engine to find desired results. The information provided to the search engine of the digital library directly impacts the results provided by it. To ensure that all the primary studies that our mapping plans to address are covered we need to be careful in the selection and placement of keywords used in the search string.
| Search string. |
software .( defect + fault ) . ( software metrics + object oriented metrics + design metrics )
Here, ‘.’ corresponds to the Boolean AND operation, and
‘+’ Corresponds to the Boolean OR operation |
The search string was executed on all six electronic databases mentioned above and the publication year was restricted to the range 1995–2018. The literature hence obtained was processed further using a carefully designed inclusion-exclusion criteria and quality analysis criteria as described in the following sections.
The Inclusion-Exclusion Criteria: The search results obtained by execution of the search string may still fetch some primary studies that either do not add value to the mapping or do not fall within the purview of what the mapping aims to accomplish.
Once all the primary studies have been obtained, a carefully designed inclusion-exclusion criteria are applied to the resultant set in order to eliminate entities that do not match the objectives of the mapping.
Inclusion Criteria:
Empirical studies for DeP using software metrics.
Studies that provide empirical analysis using statistical, search-based and machine learning techniques.
Exclusion Criteria:
Literature Reviews and Systematic Reviews.
Studies that do not use DeP as the dependent variable.
Studies of non-empirical nature.
If two studies by the same author(s) exist, where one is an extension of the previous work the former is discarded. But if the results differ, both are retained.
Review Committee: We formed a review committee that comprises of two Assistant Professors and two senior researchers to mapping in order to rate all primary studies captured from the search. All studies were examined independently on the basis of the criteria defined in The Inclusion-Exclusion Criteria. Application of the inclusion-exclusion criteria resulted in 98 studies out of the total 156 studies being selected for quality analysis.
Quality Analysis: Assessing the quality of a set of primary studies is a challenging task. A quality analysis questionnaire is prepared as part of this systematic mapping to assess the relevance of studies taking part in this mapping. The questionnaire takes into consideration suggestions given in Reference [
5]. A total of 18 questions, given in
Table 2, together form the questionnaire and each question can be answered as “Agree” (1 point), “Neutral” (0.5 points) and “Disagree” (0 points). Hence, a study can have a maximum 18 points and minimum 0 points.
The same review committee enforces the quality analysis questionnaire.
Data Extraction: To extract meaningful information for each study such that the research questions can be answered, the data extraction method should be objectively defined. We created the data form shown in
Figure 2 and filled it for each of the primary study (SE) that passes the quality analysis criteria. The review committee filled the data extraction card and any conflicts raised during the data extraction process were resolved by taking suggestions from other researchers. The resultant data was converted to an Excel (.xlsx) Workbook for usage during the data synthesis process.
Data Synthesis: Data synthesis involves the accumulation of facts from the data collected during the data extraction process to build responses to the research questions [
5]. In the data synthesis process, we identify SEs that have similar viewpoints regarding a particular research question. This allows for reaching conclusive answers to the research questions identified as part of the systematic mapping. Details of the techniques used to answer the selected research questions are given below:
RQ1: To answer this question we use a bar chart that shows the number of studies using machine learning; search-based techniques, and statistical techniques and threshold-based techniques.
RQ2: This question has two parts. The first part is concerned with multi-co linearity analysis techniques and the second part deals with feature sub-selection techniques used. To answer this question, we make use of bar charts and tables. The bar charts show the number of studies using a particular technique for multi-co linearity analysis or feature sub selection. The tables show what techniques were used in which SE.
RQ3: This research question deals with the data used in SEs. It has three parts, the first part deals with the various datasets used for DeP studies, the second part deals with the independent variables found significant in the identified SEs, and the third part deals with the independent variables found insignificant in the selected SEs. The first part and the second part are answered with the help of a bar chart/pie chart combination while the third part does not use any diagramming method.
RQ4: The fourth question deals with the performance measures and statistical tests used in DeP studies. We use a combination of bar charts/pie charts to address this question.
RQ5: This question makes use of a bar chart. The bars are used to denote the comparative performance of a learning technique.
RQ6: This question is addressed using a table. Since the number of studies is limited, tables are used to summarize which study uses what search-based technique.
RQ7: This question uses bar charts and tables to show the distribution of studies that address security related defects and vulnerabilities.
RQ8: This question does not use any diagramming method.
RQ9: This question does not use any diagramming method.
3. Results and Discussion
3.1. Description of SEs
This study is very useful for developers. Upon the application of quality analysis criteria, we have selected 98 primary studies that we call primary studies (SEs) using a mix of learning techniques, including machine learning, search-based techniques, statistical techniques and some hybrid frameworks. Most of the studies made use of public domain data and standard performance measures like accuracy, error rate, precision, recall and ROC analysis.
3.1.1. Quality Assessment Questions
Table 3 shows the results of the quality analysis. It shows the percentage and number of SEs that Agree to, Disagree to, and stands Neutral towards each quality question.
From the results of the quality assessment procedure, it is clear that QQ4, QQ8, and QQ18 have been answered negatively by most of the study. This is an important finding and strongly suggests that the available literature lacks the use of multi-co-linearity analysis procedures, statistical tests of significance and machine learning technique vs. statistical technique comparison. Also, the results of QQ5, QQ10, QQ11, and QQ17 are well distributed on the positive and negative end. We also found out that the abstracts of most studies were partially informative about what will the reader extract by reading the entire study. The majority of the studies have not given any limitations of their work clearly, but by reading the entire manuscript some limitations can be extracted.
The scores obtained by SEs in the quality analysis step are separated into four groups, Low, Average, High and Very High. The SEs that obtained High and Very High scores were considered for the mapping.
Table 4 summarizes the percentage of SEs and the number of SEs in each of the four categories.
We also assign a unique identifier to each SE.
Table 5 presents the SE identifier along with its reference number. The identifiers allow for easy interpretation of results as they are used in all subsequent sections.
Table 6 provides the quality analysis score for all studies which obtained quality scores in “very high” category. A total of 22 studies obtained at least 13 points in the quality analysis process. The primary study identifier along with the quality score is given.
3.1.2. Publication Source
After quality analysis, 98 studies are left, and 10 studies are discarded.
Table 7 provides the details of the studies published in journals and conferences of high repute. It can be noted that IEEE Transactions on Software Engineering has the highest percentage of selected studies (11.22%) followed by the Journal of Systems and Software (10.20%).
3.1.3. Publication Year
Figure 3 shows the distribution of DeP studies from the year 1995 to 2018. It shows that the research in DeP picked up in the year 2005 when five studies were conducted. Out of the total 98 studies selected for this mapping, only 12 were conducted till 2004. In 2007, 2008, 2009, 2010, 2011, 2012 and 2013 the number of DeP studies conducted is 11, 15, 10, 15,9, 12, and 5 respectively. These account for 77 out of the selected 98 studies. For 2018, we could find only one quality publication till date, but the data for 2018 should not be considered complete. One of the reasons for the surge in DeP studies after 2005 could be the availability of the public domain data on the PROMISE repository.
3.2. RQ1: What Techniques Have Been Used for Building DeP Models?
In this section, we elaborate on the distribution of model building techniques used in DeP studies. As shown in
Figure 4 the most used learning method is the Decision Tree, 44 out of 98 studies selected for this systematic mapping use some variant of the decision tree method. Techniques like C4.5, J48, CART, and Random Forest come under the decision tree class. Bayesian learners [
65] i.e., Naïve Bayes, Bayes Net, etc. have been used by 39 studies. Regression, Discriminant analysis and Threshold based classification have been performed in 35, 8 and 4 studies respectively. Both support vector machine and neural network have been used in 21 studies.
3.3. RQ2: What Are the Different Data Pre-Processing Techniques Used in DeP Models?
Research question #2 summarizes all the techniques that deal with data pre-processing. This study answers this question in two parts; the first part summarizes all methods that are used to analyze the degree of multi-co-linearity among features and the second part deals with the techniques used to select relevant features from the dataset.
3.3.1. What Are the Different Techniques Used for Multi-Co-Linearity Analysis in DeP Studies?
Analysis of data multi-co-linearity is an important step of data pre-processing, because it ascertains that the data being used for the study is not collinear. Collinear data does not add value to the study as one variable can be used to predict another variable hence reducing the independence among variables. This affects the final results in two ways.
The predictive capability of independent variables cannot be assessed effectively as at least one independent variable ‘x’ is highly dependent on another independent variable ‘y’. If the variable ‘y’ a significant predictor of defects, then the independent variable ‘x’ can also present itself as a significant predictor even if ‘x’ by itself does not carry any meaningful information that is different to the information available with ‘y’.
The final results reported by the prediction model are affected.
Table 8 shows all studies that apply multi-co-linearity procedures and the corresponding procedure applied. Only seven out of 98 studies have stated in their work that they make use of multi-co linearity procedures.
Figure 5 shows the graphical representation of the distribution of multi-co-linearity analysis techniques used across seven studies. We can see that the Condition Number method is the most popular in DeP studies, four studies make use of this method. VIF (variable inflation factor) and PCA (principal component analysis) were applied in two studies each.
The reports corresponding to RQ2.1 show that only 7.14% of all studies make use of multi-co-linearity analysis techniques. This is a very small number and reflects the fact the very little emphasis has been laid on the analysis of multi-co-linearity among data elements present in datasets used for DeP studies in the past.
3.3.2. What are Different Techniques Used for Feature Sub Selection in DeP Studies?
In this section, we determine the number of studies that state the use of feature sub-selection techniques and what feature sub-selection techniques are widely used. It is important that we conduct feature sub-selection on the input data before it is supplied to the learning algorithm, because the data could contain redundant and irrelevant features. Out of the 98 studies selected for this systematic mapping, there are 44 studies that use feature sub-selection methods, i.e. exactly 50 percent of the studies use feature sub-selection methods.
Figure 6 shows the distribution of feature sub-selection techniques across all 44 studies. The most frequently used technique for feature selection is correlation-based feature selection (CFS), 19 studies make use of CFS. After CFS, the most used technique is Principal Component Analysis (PCA). It should be noted that while the number of studies that apply multi-co-linearity analysis is only seven (7.14%) the number of studies that apply feature sub selection is 44 (50%).
Since DeP studies are heavily dependent on data and their primary aim is to identify metrics that are relevant to DeP, the result of our analysis towards RQ2 is not very encouraging. Every DeP study must ensure that the data used for model building is free from multi-co-linearity and only consists of relevant metrics so that highly accurate estimates of metric relevance and model performance can be made.
3.4. RQ3: What Is the Kind of Data Used in DeP Studies?
In this question, we deal with various questions relating to data used in a DeP model. We answer this question in three parts. In the first part, we analyze existing studies to find out what type of data has been used in model training and testing. In the second part, we examine all studies to find out which metrics were found relevant and what percentage of studies is reporting a particular metric as relevant for DeP. And finally, we examine all the studies to find out which metrics were found unsuitable for DeP.
3.4.1. Which Data Sets Are Used for SFP?
In this question, we attempt to summarize the various datasets that are used by DeP studies in the past. A wide variety of public domain datasets like NASA, Eclipse, Apache have been used by multiple researchers to build DeP models; at the same time, there are instances where studies have used data from systems built by students while some have used industrial systems to generate data.
Figure 7 shows the distribution of datasets used for building DeP models. The most popular datasets for DeP model building come from NASA MDP program, a total of 42 studies out of 98 use data provided under this program. Eclipse dataset has been used by 10 studies while Apache datasets are used by four studies. The data from PROMISE repository has been used by 17 studies. The Mozilla foundation has also provided data to four studies, three of these studies are addressing security-related defects. The “Others” category includes all industrial software systems, legacy systems and data sources which were not stated in the studies.
3.4.2. Which Metrics Are Found to Be Significant Predictors for DeP?
In this part, we identify the metrics that are found to be significant predictors of software defects.
Figure 8 clearly shows that the most significant predictor of defects is found to be LOC, a total of 26 studies have reported LOC as a significant predictor of defects. Coupling metric (CBO) and RFC have been reported as significant by 25 and 22 studies, respectively. Complexity metric WMC is also reported significant by 15 studies. Only nine studies found DIT to be a significant predictor of software defects and NOC is found to be significant in six studies.
3.4.3. Which Metrics Are Found to Be Insignificant Predictors for DeP?
In this part, we identify metrics that are not found suitable for software defect prediction. It has been widely recognized that the inheritance metrics are the weakest predictors of defects. In this mapping, we observed that both the Chidamber and Kemerer inheritance metrics, DIT and NOC, have been widely reported insignificant predictors for software defect prediction. DIT has been reported insignificant by 23 studies while NOC is reported weak by 28 studies. Some studies have reported other metrics like LCOM3 and LCOM as weak predictors of defects. LCOM3 and LCOM have been reported insignificant by 7 and 11 studies respectively.
3.5. RQ4: What Are the Methods Used for Performance Evaluation in DeP Models?
In this question, we summarize the various performance evaluation methods used in DeP studies. This question is answered in two parts, in this first part we analyze the various performance measures used to capture the performance of a DeP model and in the second part, we summarize the statistical tests used to conduct a comparative analysis of performance measures.
3.5.1. What are Different Performance Measures Used for DeP Studies?
There are a large number of performance measures available for use. Some standard performance measures are Accuracy, Sensitivity, Specificity, and Area under the ROC Curve, Precision and Recall. From
Figure 9 it is clear that many of these popular performance measures have been used in DeP studies. The most popular measure is the Recall which is used by 39 out of 98 studies. ROC Area, Accuracy and Precision have been used in 28, 25 and 27 studies, respectively.
3.5.2. What are Different Statistical Tests of Significance Used in DeP studies?
Here, we analyze how many studies have made use of statistical tests in their evaluation of the results. By using such methods, the researcher can give a mathematical foundation to the evaluation process. Some advantages of using statistical tests are:
Statistical tests are standardized and allow for suppression of author bias.
Every statistical test follows a mathematical procedure and hence the reader(s) can better understand how the results were processed. The author is not required to illustrate the entire result processing algorithm if it chooses to use a standard statistical test.
Based on the above facts, we strongly suggest that statistical tests should be part of all research studies that involve large datasets. In the 98 primary study s selected for this mapping, 12 statistical tests have been used by 18 studies (
Figure 10). The Wilcoxon test has been used by five studies. Wilcoxon test is a two sample non-parametric test. Such tests are used to evaluate the difference between two samples (for defect prediction studies, the sample is the result(s) generated by an algorithm). The drawback of two sample tests is that does not allow comparison of multiple techniques at once. For this reason, we need k sample tests. Examples of k sample tests are Friedman test,
t-Test, etc. The analysis of 98 primary study s suggests that k sample tests have been rarely used in literature. The Friedman test has been used in three studies and the t Test has been used in only one study. Two sample tests are better suited for post hoc analysis of results.
3.6. RQ5: What Is the Performance of Various Learning Techniques across Datasets?
In this question, we attempt to approximate the learning ability of various learning techniques. To answer this question, we follow a systematic approach consisting of the following steps:
Identification of performance measure(s) to examine the predictive capability of the proposed models.
Identification of datasets to consider for performance validation.
A collection of the performance related data corresponding to the identified performance measure(s) for the identified datasets.
Comparison of performance of each technique pair for all datasets identified.
Reporting the results.
While a good number of performance measures have been studied in this mapping, we selected the Area under the ROC Curve for performance evaluation, because it is found to suppress the effects of data imbalance on the resultant model. Any dataset that has an unequal distribution of defective and non-defective classes can be considered to be imbalanced [
4]. Since the data distribution is skewed in imbalanced datasets, learning from these datasets requires a different approach [
4]. ROC curves [
8] aim at maximizing both the sensitivity (True Positive Rate) and 1-Specificity (True Negative Rate) of the model and, therefore, overcome any issue relating to data imbalance. For the final analysis, we imposed the following restrictions:
Only those techniques were selected that were used in five or more studies. This ensures that only those techniques are evaluated which have been widely used in literature. Techniques that are used in fewer studies cannot be compared to studies that have been evaluated in varied experimental setups. Factors such as researcher bias, selection of test parameters, etc., affect the performance of a technique greatly. Summarizing the results of techniques reported in at least five studies will diminish the impact of such factors.
Only those datasets were considered which have been evaluated using ROC analyzes in at least two studies. The objective of this constraint is to eliminate those datasets that have been used only once and could get included in the analysis severely impacting the overall performance of a learning algorithm.
Finally, we assess the performance of 10 learning techniques over 11 datasets (KC1 is used at method level, as well as a class level). Details of the techniques and datasets are given in
Table 9.
The relation given below summarizes the comparison procedure,
for each [(a, b): where a and b are learning techniques and a ≠ b]
compare AUC(a) and AUC(b)
if(AUC(a)>AUC(b))
set 1
else
set 0
calculate sum(1) and sum(0) as ‘better_than’ and ‘not_better_than’ |
Summarily, for each pair of algorithms, we check the performance of the AUC measure at the dataset level. Only when the AUC value is available for both techniques (for a given dataset), a comparison is made.
Figure 11 provides a detailed description of the performance analysis.
It can be seen that Random Forest is the best performing algorithm. Its performance is inferior to Discriminant Analysis at two datasets and against KStar and CART, it performs better in all cases. The worst learner based on this analysis is the CART algorithm. The CART algorithm is better compared to SVM in three cases while BayesNet, Discriminant Analysis and Naïve Bayes reported better AUC than CART in all comparisons. Not far behind Random Forest is the Discriminant Analysis with better results than CART and KStar in all comparisons, but in comparison to Random Forest, it is lagging against the other techniques. On the downside, KStar did better than CART and the comparison shows that in all comparisons except the ones against CART, KStar performed poorly. Other learning techniques, as can be seen in the graph, had an average performance. The average, maximum and minimum ROC area for the above learning techniques are given in
Table 10.
3.7. RQ6: What Is the Performance of Search-Based Techniques in Defect Prediction?
Evolutionary computation techniques are learning techniques based on the theory of biological evolution. Techniques of this kind have been successfully used in various software engineering domains like Test Case Prioritization, Automated Test Data Generation [
90,
91], etc. In the last five years, considerable work has been done on evaluating the applicability of these techniques to the defect prediction problem. The authors in [
115] argued that the performance measures of a model can be used as fitness function for search-based techniques and these techniques are better suited for software engineering problems given their superior ability to handle noisy data, better tolerance to missing data and ability to search globally with less probability of returning the local optimal solution.
The most studied techniques on the basis of
Table 11 are the Artificial Immune Recognition System (AIRS), Ant Colony Optimization (ACO) and Genetic Programming (GP); all three techniques have been evaluated by two studies. Evolutionary Programming (EP), Evolutionary Subgroup Discovery (ESD), Genetic Algorithm (GA), and Gene Expression Programming (GeP) and Particle Swarm Optimization (PSO) have been studied only once.
To evaluate the performance of a technique, it is important that a good number of independent studies be conducted and the results of all such studies are considered. Out of eight techniques, only three have been used more than once. Hence, for the performance evaluation we consider only these three techniques.
3.7.1. Ant Colony Optimization
In this mapping, two studies have evaluated the performance of ACO. One study uses a derivative of ACO, i.e., AntMiner+ while the other uses the traditional ACO algorithm. Both the studies have reported the prediction accuracy of the resultant models. The study using AntMiner+ has a prediction accuracy of 90.87 while the study using conventional ACO has a prediction accuracy of 64 percent.
3.7.2. Artificial Immune Recognition System
The AIRS technique reports an average recall of 74 percent in SE22 on the KC1 dataset which is very good while SE57 reports a recall of 82 percent on telecommunication software.
3.7.3. Genetic Programming
In SE57, the GP algorithm has reported a recall of 98 percent which is very high. It is evident that search-based techniques have a good predictive capability and this domain should be explored further. Algorithms like Artificial Bee Colony (ABC) have been used widely and in most cases the ABC algorithm has produced better results than other search-based techniques. It is necessary that the performance of the ABC algorithm be evaluated for defect prediction.
3.8. RQ7: How Many DeP Studies Attempt to Predict Security Related Defects and Vulnerabilities?
The question related to the identification of security related defects has not been discussed in any systematic mapping to the best of the authors’ knowledge. In this study, we estimate the number of studies which take steps in this direction. We try to visit every aspect of security related defects in our response to this question. It was found that only 3% have tried to address security related defects and vulnerabilities.
In
Table 12 we present the different datasets that have been used in these three studies. Out of three, two studies use datasets provided by Mozilla Foundation, one study uses data given by Red Hat and one study uses data from an unspecified source.
Table 13 gives the details about the learning methods used for the three studies and it can be seen that all three studies have used statistical techniques. There is no use of machine learning or search-based approaches for security related defect prediction.
Table 14 shows various statistical tests that are used to evaluate the results of studies working on security related defects and system vulnerabilities. It is encouraging to see that only one out of three studies did used statistical tests.
3.9. RQ8: How Many DeP Studies atTempt to Identify Defects of Varying Severity Levels?
Severity is a very important attribute of a defect. When a defect is detected in a software system, the severity assigned to it helps project managers identify the level of impact it can have on the system. A DeP model that can estimate the severity of a possible defect is very helpful to practitioners, because it makes them aware of the modules which can have defects of high severity, moderate severity and low severity and the order of action ideally should be testing of modules with high severity defects first, then modules with defects having moderate severity level and finally those modules which have defects of low severity. Out of the total 98 studies, only four studies (SE20, SE41, SE50, and SE62) have attempted to build DeP models that identify multiple severity levels.
3.10. RQ9: How Many DeP Studies Perform Cross-Project DeP?
Cross-project defect prediction is a very important aspect of DeP in software. There are software organizations that do not have enough historical data that can be used in DeP in current projects. Cross-project DeP uses historical data from different projects of a similar nature and this data can be used by software organizations lacking historical data to build and train DeP models. These trained models can then be used to identify defect prone parts of running projects. Cross-project defect prediction means that the DeP model trained on one set of data and is validated on the data obtained from different software. Essentially, this is what makes a DeP model applicable in a real-life situation. A DeP model is useful only if it can predict defects in future projects, but to apply a DeP model to future projects it must be trained on past project data. To test the effectiveness of such a model and to simulate this real-life application scenario, cross-project defect prediction models are constructed. These models are trained on data from project X and tested on data from project Y. In literature, most of the studies use the same data for training and validation using various types of cross-validation techniques like hold-out, k-cross-validation, etc. Only six studies (SE46, SE54, SE56, SE84, SE85, and SE96) of the total 98 studies have attempted to build cross-project DeP models.
It is important that a good amount of work in future is done on cross-project DeP. The work should cover a diverse range of software projects so that the applicability of a DeP model to projects on which is not trained is thoroughly evaluated.
4. Conclusions
In this systematic mapping, we address nine research questions corresponding to different stages of development of a DeP model. We explored each aspect of the process ranging from data collection; data pre-processing, and techniques used to build DeP models to measures used to evaluate model performance and statistical evaluation schemes used to mathematically validate the results of a DeP model. We also looked into the existing literature to find out how many studies address security related defects and software vulnerabilities, how many cross-project DeP studies have been conducted and how many studies address defects of varying severity levels. To achieve these goals, we carried out an elaborate search on six digital libraries and collect 156 studies which are then processed using a carefully designed inclusion-exclusion criteria and quality analysis questionnaire. Out of the total 156 studies, we selected 98 studies for addressing nine research questions formed for this systematic mapping.
The research questions in this systematic mapping were constructed by taking into account the following definition of an ideal DeP model: “An ideal DeP model should be able to classify defects on the basis of severity, should detect security-related defects and system vulnerabilities and should have the ability to detect defects on systems on which it was not trained”.
Results of this study showed that the existing literature has covered some of the parts of the DeP process fairly well, for example, the sizes of datasets used are large, and nearly all machine learning methods have been examined. But when taking into account the overall approach and effectiveness of DeP studies, there are a lot of shortcomings. Studies have not made much use of multi-co-linearity analysis techniques and only half of the studies selected for mapping have used feature sub-selection techniques. There are only three studies that perform DeP for security related defects and system vulnerabilities, only 6% of the total studies perform cross-project DeP and only four studies have worked on defects of varying severity levels. The number of studies that use statistical tests for model comparison is also limited at 23 studies. Overall, we conclude that although the literature available for software defect prediction has high-quality work, it lacks in the overall methodology that is used to construct defect prediction models.
The following future guidelines are provided on the basis of the results of this study:
Datasets used for DeP studies should undergo thorough pre-processing that includes multi-co-linearity analysis and feature sub selection.
Most of the researches in defect prediction involve data obtained from open source software systems. Few studies use industrial datasets. It is important that industrial data be used for building defect prediction models so that the models can be generalized.
Future studies should make extensive comparisons between search-based techniques, machine learning techniques and statistical techniques. This mapping found out that few search-based techniques like AIRS and GP have good performance in predicting defects, but that number of studies that support this finding is very small. Machine learning and statistical techniques, on the other hand, have been evaluated extensively. To reach conclusions it is important that search-based techniques are also extensively evaluated [
173,
174,
175,
176,
177,
178,
179,
180,
181,
182,
183,
184,
185,
186,
187].
Since the amount of data is large, it is necessary that statistical evaluation of the performance of resultant DeP models be performed to reach the conclusion that is backed by mathematical principals.
Security is an important aspect of any software system. It is necessary that researchers explore the applicability of DeP models specifically to security related defects and vulnerabilities.
Severity is a basic component of any defect detected in a software system. If the testing resources are limited in number, then it makes sense to test those modules first that have a possibility of carrying high severity defects. It is essential that more studies that address security related defects be conducted.
For organizations looking to start new projects, it is important that they can make use of training data from existing DeP models. In reality, a DeP model is useful only if it can apply the rules learned from project A to project B. to explore the possibility of this application, cross-project DeP models should be built, and the focus should be on identification of metrics that provide maximum information about defects.
Author Contributions
N.P.: Conceived of the presented idea, Verified the analytical methods submitted the second author; M.K.: Select literature and discuss the findings, Monitored the results; L.H.S.: Started the literature findings, Conceived the overview and background study, Supervised the findings of this work; R.K.: Contributed to the overview and background study, Explained various issues; P.H.T.: Checked and verified the mathematical models, Supervised the findings of this work, Contributed to conclude the paper; P.T.M.P.: Contributed to the overview and background study, Discussion of experimental results.
Funding
This research received no external funding.
Acknowledgments
The authors would like to thank the Editor-in-Chief and the anonymous reviewers for their valuable comments and suggestions.
Conflicts of Interest
The authors declare that they do not have any conflict of interest.
References
- Kitchenham, B.A. Guidelines for Performing Systematic Literature Review in Software Engineering; Technical Report EBSE-2007-001; Keele University and Durham University: Staffordshire, UK, 2007. [Google Scholar]
- Catal, C.; Diri, B. A Systematic Review of Software Fault Prediction studies. Expert Syst. Appl. 2009, 36, 7346–7354. [Google Scholar] [CrossRef]
- Radjenovic, D.; Hericko, M.; Torkar, R.; Zivkovic, A. Software fault prediction metrics: A Systematic literature review. Inf. Softw. Technol. 2013, 55, 1397–1418. [Google Scholar] [CrossRef]
- He, H.; Garcia, E.A. Learning from Imbalanced Data. IEEE Transactions on Knowledge and Data Engineering. IEEE Trans. Knowl. Data Eng. 2009, 21. [Google Scholar] [CrossRef]
- Wen, S.; Li, Z.; Lin, Y.; Hu, C.; Huang, C. Systematic literature review of machine learning based software development effort estimation models. Inf. Softw. Technol. 2012, 54, 41–59. [Google Scholar] [CrossRef]
- Naeem Seliya, T.M.; Khoshgoftaar, J.; VanHulse, J. Predicting Faults in High Assurance Software. In Proceedings of the 2010 IEEE 12th International Symposium on High Assurance Systems Engineering, San Jose, CA, USA, 3–4 November 2010; pp. 26–34. [Google Scholar]
- Beecham, S.; Hall, T.; Bowes, D.; Gray, D.; Counsell, S.; Black, S. A Systematic Review of Fault Prediction Approaches used in Software Engineering; The Irish Software Engineering Research Centre: Limerick, Ireland, 2010. [Google Scholar]
- Fawcett, T. An Introduction to ROC Analysis. Pattern Recognit. Lett. 2006, 27, 861–874. [Google Scholar] [CrossRef]
- Hall, T.; Beecham, S.; Bowes, D.; Gray, D.; Counsell, S. Asystematic Literature Review on Fault Prediction Performance in Software Engineering. IEEE Trans. Softw. Eng. 2012, 38, 1276–1304. [Google Scholar] [CrossRef]
- Zhou, Y.; Hareton, L. Empirical analysis of object-oriented design metrics for predicting high and low severity faults Software Engineering. IEEE Trans. 2006, 32, 771–789. [Google Scholar]
- Hassan, A.E.; Holt, R.C. The top ten List: Dynamic Fault Prediction. In Proceedings of the 21st IEEE International Conference on Software Maintenance, Budapest, Hungary, 26–29 September 2005. [Google Scholar]
- Okutan, A.; Yıldız, O.T. Software Defect Prediction Using Bayesian Networks. In Empirical Software Engineering; Springer: Berlin/Heidelberg, Germany, 2012. [Google Scholar]
- Cruz, A.E.C.; Ochimizu, K. Towards Logistic Regression Models for Predicting Fault-Prone Code across Software Projects. In Proceedings of the Third International Symposium on Empirical Software Engineering and Measurement, Lake Buena Vista, FL, USA, 15–16 October 2009; pp. 460–463. [Google Scholar]
- de Carvalho, A.B.; Pozo, A.; Vergilio, S.R. A Symbolic Fault-Prediction Model Based on Multi objective Particle Swarm Optimization. J. Syst. Softw. 2010, 83, 868–882. [Google Scholar] [CrossRef]
- de Carvalho, A.B.; Pozo, A.; Vergilio, S.; Lenz, A. Predicting Fault Proneness of Classes Trough a Multi objective Particle Swarm Optimization Algorithm. In Proceedings of the 2008 20th IEEE International Conferenceon Tools with Artificial Intelligence, Dayton, OH, USA, 3–5 November2008; pp. 387–394. [Google Scholar]
- Koru, G.; Liu, H. Building Effective Defect-Prediction Models in Practice. IEEE Softw. 2005. [Google Scholar] [CrossRef]
- Monden, A.; Hayashi, T.; Shinoda, S.; Shirai, K.; Yoshida, J.; Barker, M.; Matsumoto, K. Assessing the Cost Effectiveness of fault Prediction in Acceptance Testing. IEEE Trans. Softw. Eng. 2013, 39, 1345–1357. [Google Scholar] [CrossRef]
- Marcus, A.; Poshyvanyk, D.; Ferenc, R. Using the Conceptual Cohesion of Classes for Fault Prediction in Object-Oriented Systems. IEEE Trans. Softw. Eng. 2008, 34, 287–300. [Google Scholar] [CrossRef]
- Glasberg, D.; El Emam, K.; Melo, W.; Madhavji, N. Validating Object-Oriented Design Metrics on a Commercial Java Application; National Research Council Canada: Ottawa, ON, Canada, 2000. [Google Scholar]
- Briand, L.; Devanbu, P.; Melo, W. An investigation into coupling measures for C++. In Proceedings of the (19th) International Conference on Software Engineering, Boston, MA, USA, 17–23 May 1997. [Google Scholar]
- Seifert, T.; Paech, B. Exploring the Relationship of a File’s History and Its Fault-Proneness: An Empirical Method and Its Application to Open Source Programs. Inf. Softw. Technol. 2010, 52, 539–558. [Google Scholar] [CrossRef]
- Guo, L.; Ma, Y.; Cukic, B.; Singh, H. Robust Prediction of Fault-Proneness by Random Forests. In Proceedings of the 15th International Symposium on Software Reliability Engineering, Bretagne, France, 2–5 November 2004. [Google Scholar]
- Dejaeger, K.; Verbraken, T.; Baesens, B. Towards comprehensible software fault Prediction Models Using Bayesian Network Classifiers. IEEE Trans. Softw. Eng. 2013, 39, 237–257. [Google Scholar] [CrossRef]
- Quah, T.S.; Thwin, M.T. Prediction of Software Development Faultsin PL/SQL Files Using Neural Network Models. Inf. Softw. Technol. 2004, 46, 519–523. [Google Scholar] [CrossRef]
- Khari, M.; Kumar, M. Analysis of software security testing using meta heuristic search technique. In Proceedings of the 2016 3rd International Conference on Computing for Sustainable Global Development (INDIACom), New Delhi, India, 16–18 March 2016; pp. 2147–2152. [Google Scholar]
- Ambros, M.D.; Lanza, M.; Robbes, R. An Extensive Comparison of Bug Prediction Approaches. In Proceedings of the 2010 7th IEEE Working Conference on Mining Software Repositories (MSR2010), Cape Town, South Africa, 2–3 May 2010. [Google Scholar]
- Bezerra, M.E.R.; Oliveira, A.L.I.; Meira, S.R.L. Of Defectsin Software Modules. In Proceedings of the International Joint Conference on Neural Networks, Orlando, FL, USA, 12–17 August 2007; pp. 1–6. [Google Scholar]
- Elish, M.O.; Al-Yafei, A.H.; Al-Mulhem, M. Empirical Comparison of Three Metrics Suites for Fault Prediction in Packages of Object-Oriented Systems: A Case Study of Eclipse. Adv. Eng. Softw. 2011, 42, 852–859. [Google Scholar] [CrossRef]
- Hall, T.; Bowes, D. The State of Machine Learning Methodology in Software Fault Prediction. In Proceedings of the 2012 11th International Conference on Machine Learning and Applications, BocaRaton, FL, USA, 12–15 December 2012; pp. 308–313. [Google Scholar]
- Olague, H.M.; Etzkorn, L.H.; Gholston, S.; Quattlebaum, S. Empirical Validation of Three Software Metrics Suites to Predict Fault-Proneness of Object-Oriented Classes Developed Using Highly Iterative or Agile Software Development Processes. IEEE Trans. Softw. Eng. 2007, 33, 402–419. [Google Scholar] [CrossRef]
- Shatnawi, R.; Li, W.; Swain, J.; Newman, T. Finding software metrics threshold values using ROC curves. J. Softw. Maint. Evol. Res. Pract. 2010, 22, 1–16. [Google Scholar] [CrossRef]
- Mausa, G.; Ing, M. Search Based Software Engineering and Software Defect Prediction; Springer: Berlin/Heidelberg, Germany, 2012. [Google Scholar]
- Shatnawi, R.A. Quantitative Investigation of the Acceptable Risk Levels of Object-Oriented Metricsin Open-Source Systems. IEEE Trans. Softw. Eng. 2010, 36, 216–225. [Google Scholar] [CrossRef]
- Vandecruys, O.; Martens, D.; Baesens, B.; Mues, C.; de Backer, M.; Haesen, R. Mining Software Repositories for Comprehensible Software Fault Prediction Models. J. Syst. Softw. 2008, 81, 823–839. [Google Scholar] [CrossRef]
- Zhang, H.; Zhang, X. Comments on Data mining static code attributes to learn defect predictors. IEEE Trans. Softw. Eng. 2007, 33, 635–636. [Google Scholar] [CrossRef]
- Gondra, I. Applying Machine Learning to Software Fault-Proneness Prediction. J. Syst. Softw. 2008, 81, 186–195. [Google Scholar] [CrossRef]
- Moser, R.; Pedrycz, W.; Succi, G. A Comparative Analysis of the Efficiency of Change Metrics and Static Code Attributes for Defect Prediction. In Proceedings of the 13th International Conference on Software Engineering, Leipzig, Germany, 10–18 May 2008. [Google Scholar]
- Hall, T.; Beecham, S.; Bowes, D.; Gray, D.; Counsell, S. Developing Fault-Prediction Models: What the Research Can Show Industry. IEEE Softw. 2011, 28, 96–99. [Google Scholar] [CrossRef]
- Watanabe, S.; Kaiya, H.; Kaijiri, K. Adapting a Fault Prediction Model to Allow Inter Language Reuse. In Proceedings of the 4th International Workshop on Predictor Models in Software Engineering, Leipzig, Germany, 12–13 May 2008. [Google Scholar]
- Challagulla, V.U.B.; Yen, I. A Unified Framework for Defect Data Analysis Using the MBR Technique. In Proceedings of the 2006 18th IEEE International Conference on Tools with Artificial Intelligence (ICTAI’06), Arlington, VA, USA, 13–15 November 2006. [Google Scholar]
- Khoshgoftaar, T.M.; Seliya, N.; Sundaresh, N. An Empirical Study of Predicting Software Faults with Case-Based Reasoning. Softw. Qual. J. 2006, 14, 85–111. [Google Scholar] [CrossRef]
- Shatnawi, R.; Li, W. The Effectiveness of Software Metrics in Identifying Error-Prone Classes in Post-Release Software Evolution Process. J. Syst. Softw. 2008, 81, 1868–1882. [Google Scholar] [CrossRef]
- Kim, S.; Whitehead, E.J., Jr.; Zhang, Y. Classifying Software Changes: Clean or Buggy? IEEE Trans. Softw. Eng. 2008, 34, 181–196. [Google Scholar]
- Tosun, A.; Turhan, B.; Bener, A. Validation of Network Measures as Indicators of Defective Modules in Software Systems. In Proceedings of the 5th International Workshop on Predictive Models in Software Engineering, PROMISE 2009, Vancouver, BC, Canada, 18–19 May 2009. [Google Scholar]
- Di Martino, S.; Ferrucci, F.; Gravino, C.; Federica, S. A Genetic Algorithm to Configure Support Vector Machines for Predicting Fault-Prone Components. In Proceedings of the 12th International Conference on Product-focused Software Process Improvement, Torre Canne, Italy, 20–22 June 2011; pp. 247–261. [Google Scholar]
- Matsumoto, S.; Kamei, Y.; Monden, A.; Matsumoto, K. Comparison of Outlier Detection Methods in Fault-proneness Models. In Proceedings of the First International Symposium on Empirical Software Engineering and Measurement, Madrid, Spain, 20–21 September 2007. [Google Scholar]
- Gray, A.R.; MacDonell, S.G. A Comparison of Techniques for Developing Predictive Models of Software Metrics. Inf. Softw. Technol. 1997, 39, 425–437. [Google Scholar] [CrossRef]
- Khari, M.; Kumar, N. Comparison of six prioritization techniques for software requirements. J. Glob. Res. Comput. Sci. 2013, 4, 38–43. [Google Scholar]
- Kamiya, T.; Kusumoto, S.; Inoue, K. Prediction of Fault-Proneness at Early Phase in Object-Oriented Development. In Proceedings of the 2nd IEEE International Symposium on Object-Oriented Real-Time Distributed Computing (ISORC’99) (Cat.No.99-61702), Saint-Malo, France, 2–5 May 1999. [Google Scholar]
- Zimmermann, T.; Premraj, R.; Zeller, A. Predicting Defects for Eclipse. In Proceedings of the Third International Workshop on Predict or Models in Software Engineering (PROMISE’07: ICSEWorkshops2007), Washington, DC, USA, 20–26 May 2007. [Google Scholar]
- Twala, B. Software Faults Prediction using Multiple Empirical validation Classifiers. Softw. Qual. J. 2011, 26, 525–552. [Google Scholar]
- Luo, X.; Lv, Y.; Li, R.; Chen, Y. Webservice QoS prediction based on adaptive dynamic programming using fuzzy neural networks for cloud services. IEEE Access 2015, 3, 2260–2269. [Google Scholar] [CrossRef]
- Zhang, Z.W.; Jing, X.Y.; Wang, T.J. Label propagation based semi-supervised learning for software defect prediction. Autom. Softw. Eng. 2017, 24, 47–69. [Google Scholar] [CrossRef]
- Maua, G.; Galinac Grbac, T. Co-evolutionary multi-population genetic programming for classification in software defect prediction. Appl. Soft Comput. 2017, 55, 331–351. [Google Scholar]
- Chen, X.; Zhao, Y.; Wang, Q.; Yuan, Z. MULTI: Multi-objective effort-aware just-in-time software defect prediction. Inf. Softw. Technol. 2018, 93, 1–13. [Google Scholar] [CrossRef]
- Menzies, T. The Unreasonable Effectiveness of Software Analytics. IEEE Softw. 2018, 35, 96–98. [Google Scholar] [CrossRef]
- Kersten, M. What Flows through a Software Value Stream? IEEE Softw. 2018, 35, 8–11. [Google Scholar] [CrossRef]
- Yuan, X.; Goftaar, T.M.K.; Ganesan, K.; Allen, E.B. An Application of Fuzzy Clustering to Software Quality Prediction. In Proceedings of the 3rd IEEE Symposium on Application-Specific Systems and Software Engineering Technology, Richardson, TX, USA, 24–25 March 2000. [Google Scholar]
- Weyuker, E.J.; Ostrand, T.J.; Bell, R.M. Comparing the Effectiveness of Several Modelling Methods for Fault Prediction. Empir. Softw. Eng. 2010, 15, 277–295. [Google Scholar] [CrossRef]
- El Emam, K.; Benlarbi, S.; Goel, N.; Rai, S.N. The Confounding Effect of Class Size on the Validity-Oriented Metrices. IEEE Trans. Softw. Eng. 2001, 27, 630–650. [Google Scholar] [CrossRef]
- Sandhu, P.S.; Brar, A.S.; Goel, R.; Kaur, J.; Anand, S. A Model for Early Prediction of Faults in Software Systems. In Proceedings of the 2010 International Conference on Computer and Automation Engineering (ICCAE), Singapore, 26–28 February 2010; pp. 281–285. [Google Scholar]
- Maa, Y.; Luo, G.; Zeng, X.; Chen, A. Transfer Learning for Cross-Company Software Defect Prediction. Inf. Softw. Technol. 2012, 54, 248–256. [Google Scholar] [CrossRef]
- Jiang, Y.; Cukic, B. Misclassification cost-sensitive fault prediction models. In Proceedings of the 5th international conference on predictor models in software engineering, Vancouver, BC, Canada, 18–19 May 2009. [Google Scholar]
- Kaur, A.; Sandhu, P.S.; Brar, A.S. Early Software Fault Prediction Using Real Time Defect Data. In Proceedings of the 2009 Second International Conference on Machine Vision, Dubai, UAE, 28–30 December 2009; pp. 242–245. [Google Scholar]
- Kaur, A.; Brar, A.S.; Sandhu, P.S. An Empirical Approach for Software Fault Prediction. In Proceedings of the 5th International Conference on Industrial and Information Systems, ICIIS2010, Mangalore, India, July 29–1 August 2010. [Google Scholar]
- Mahaweerawat, A.; Sophatsathit, P.; Lursinsap, C. Adaptive self-organizing map clustering for software fault prediction. In Proceedings of the Fourth International Joint Conference on Computer Science and Software Engineering, Khon Kaen, Thailand, 2–4 May 2007; pp. 35–41. Available online: http://pioneer.chula.ac.th/~sperapho/pub/jcsse_2007.pdf (accessed on 2 January 2019).
- Mahaweerawat, A.; Sophasathit, P.; Lursinsap, C. Software fault prediction using fuzzy clustering and radial basis function network. In Proceedings of the International Conference on Intelligent Technologies, Hanoi, Vietnam, 3–5 December 2002; Available online: http://pioneer.netserv.chula.ac.th/~sperapho/pub/fzintcam.pdf (accessed on 2 January 2019).
- Arisholm, E.; Briand, L.C. Predicting Fault-Prone Components in a Java Legacy System. In Proceedings of the 2006 ACM/IEEE International Symposium on Empirical Software Engineering, Rio de Janeiro, Brazil, 21–22 September 2006. [Google Scholar]
- Upadhya, G.K.; Das, S.; Chandra, U.; Paul, A.J. Modelling the Investment Casting Process: A Novel Approach for View Factor Calculations and Defect Prediction. Appl. Math. Model. 1995, 19, 354–362. [Google Scholar] [CrossRef]
- Tomaszewski, P.; Håkansson, J.; Grahn, H.; Lundberg, L. Statistical Model svs. Expert Estimation for Fault Prediction in Modified Code—An Industrial Case Study. J. Syst. Softw. 2007, 80, 1227–1238. [Google Scholar] [CrossRef]
- Menzies, T.; Dekhtyar, A.; Distefano, J.; Greenwald, J. Problems with Precision: A Response to‘ Comments on Data Mining Static Code Attributes to Learn Defect Predictors. IEEE Trans. Softw. Eng. 2007, 33, 637–640. [Google Scholar] [CrossRef]
- Misirh, A.T.; Bener, A.B.; Turhan, B. An industrial case study of classifier ensembles for locating software defects. Softw. Qual. J. 2011, 19, 515–536. [Google Scholar] [CrossRef]
- Harman, M.; McMinn, P. A theoretical and empirical study of search-based testing: Local, global, and hybrid search. IEEE Trans. Softw. Eng. 2010, 36, 226–247. [Google Scholar] [CrossRef]
- Mishra, B.; Shukla, K.K. Impact of attribute Selection on Defect Proneness Prediction in OO Software. In Proceedings of the International Conference on Computer and Communication Technology, Allahabad, India, 15–17 September 2011. [Google Scholar]
- Yang, B.; Yao, L.; Huang, H.Z. Early Software Quality Prediction Based on a Fuzzy Neural Network Model. In Proceedings of the Third International Conference on Natural Computation (ICNC2007), Haikou, China, 24–27 August 2007; pp. 760–764. [Google Scholar]
- Turhan, B.; Bener, A. Analysis of Naive Bayes’ Assumptions on Software Fault Data: An Empirical Study. Data Knowl. Eng. 2009, 68, 278–290. [Google Scholar] [CrossRef]
- Afzal, W.; Torkar, R.; Feldt, R. Search-Based Prediction of Fault Count Data. In Proceedings of the 2009 1st International Symposium on Search Based Software Engineering, Windsor, UK, 13–15 May 2009; pp. 35–38. [Google Scholar]
- Cartwright, M.; Shepperd, M. An Empirical Investigation of an Object-Oriented Software System. IEEE Trans. Softw. Eng. 2000, 26, 786–796. [Google Scholar] [CrossRef]
- Azar, D.; Vybihal, J. An Ant Colony Optimization Algorithm to Improve Software Quality Prediction Models: Case of Class Stability. Inf. Softw. Technol. 2011, 53, 388–393. [Google Scholar] [CrossRef]
- Seliya, N.; Khoshgoftaar, T.M. Software Quality Estimation with Limited Fault Data: A Semi-Supervised Learning Perspective. Softw. Qual. J. 2007, 15, 327–344. [Google Scholar] [CrossRef]
- Pai, G.J.; Dugan, J.B. Empirical Analysis of Software Fault Content and Fault Proneness Using Bayesian Methods. IEEE Trans. Softw. Eng. 2007, 33, 675–686. [Google Scholar] [CrossRef]
- Briand, L.C.; Wust, J.; Daly, J.W.; Porter, D.V. Exploring the Relationships between Design Measures and Software Quality in Object-Oriented Systems. J. Syst. Softw. 2000, 51, 245–273. [Google Scholar] [CrossRef]
- El Emam, K.; Melo, W.; Machado, J.C. The Prediction of Faulty Classes Using Object-Oriented Design Metrics. J. Syst. Softw. 2001, 56, 63–75. [Google Scholar] [CrossRef]
- Zheng, J. Cost-Sensitive Boosting Neural Networks for Software Defect Prediction. Expert Syst. Appl. 2010, 37, 4537–4543. [Google Scholar] [CrossRef]
- Khoshgoftaar, T.M.; Seliya, N. Fault Prediction Modelling for Software Quality Estimation: Comparing Commonly Used Techniques. Empir. Softw. Eng. 2003, 8, 255–283. [Google Scholar] [CrossRef]
- Basili, V.R.; Briand, L.; Melo, W.L. A Validation of Object-Oriented Design Metrics as Quality Indicators; Technical Report; University of Maryland, Department of Computer Science: College Park, MD, USA, 1995. [Google Scholar]
- Menzies, T.; Milton, Z.; Turhan, B.; Cukic, B.; Jiang, Y.; Bener, A. Defect Prediction from Static Code Features: Current Results, Limitations, New Approaches. Autom. Softw. Eng. 2010, 17, 375–407. [Google Scholar] [CrossRef]
- Turhan, B.; Bener, A.B. Software Defect Prediction: Heuristics for Weighted Naïve Bayes. In Proceedings of the ICSOFT (SE), Barcelona, Spain, 22–25 July 2007; pp. 244–249. [Google Scholar]
- Catal, C.; Diri, B. Investigating the effect of dataset size, metrics sets, and feature selection techniques on software fault prediction problem. Inf. Sci. 2009, 179, 1040–1058. [Google Scholar] [CrossRef]
- Lo, J.H. Predicting software reliability with support vector machines. In Proceedings of the Second International Conference on Computer Research and Development, Kuala Lumpur, Malaysia, 7–10 May 2010; pp. 765–769. [Google Scholar]
- Turhan, B.; Kutlubay, O. Mining Software Data. In Proceedings of the 29th International Conference on Software Engineering (ICSE’07Companion), Minneapolis, MN, USA, 20–26 May 2007; pp. 912–916. [Google Scholar]
- Khoshgoftaar, T.M.; Gao, K. Feature Selection with Imbalanced Data for Software Defect Prediction. In Proceedings of the 2009 International Conference on Machine Learning and Applications, Miami Beach, FL, USA, 13–15 December 2009; pp. 235–240. [Google Scholar]
- Afzal, W.; Torkar, R.; Feldt, R.; Wikstrand, G. Search-Based Prediction of Fault-Slip-through in Large Software Projects. In Proceedings of the 2nd International Symposium on Search Based Software Engineering, Benevento, Italy, 7–9 September2010; pp. 79–88. [Google Scholar]
- Pelayo, L.; Dick, S. Evaluating Stratification Alternatives to improve Software Defect Prediction. IEEE Trans. Reliab. 2012, 61, 516–525. [Google Scholar] [CrossRef]
- Kanmani, S.; Rhymend Uthariaraj, V.; Sankaranarayanan, V.; Thambidurai, P. Object-Oriented Software Fault Prediction Using Neural Networks. Inf. Softw. Technol. 2007, 49, 483–492. [Google Scholar] [CrossRef]
- Turhan, B.; Kocak, G.; Bener, A. Software Defect Prediction Using Call Graph Based Ranking (CGBR) Framework. In Proceedings of the 2008 34th Euro micro Conference Software Engineering and Advanced Applications, Parma, Italy, 3–5 September2008; pp. 191–198. [Google Scholar]
- Turhan, B.; Menzies, T.; Bener, A.B.; di Stefano, J. On the Relative Value of Cross-Company and within-Company Data for Defect Prediction. Empir. Softw. Eng. 2009, 14, 540–578. [Google Scholar] [CrossRef]
- Ramani, R.G.; Kumar, S.V.; Jacob, S.G. Predicting Fault Prone Software Modules Using Feature Selection and Classification through Data Mining Algorithms. In Proceedings of the 2012 IEEE International Conference on Computational Intelligence and Computing Research, Coimbatore, India, 18–20 December 2012; pp. 1–4. [Google Scholar]
- Shafi, S.; Hassan, S.M.; Arshaq, A.; Khan, M.J.; Shamail, S. Software Quality Prediction Techniques: A Comparative Analysis. In Proceedings of the 2008 4th International Conference on Emerging Technologies, Rawalpindi, Pakistan, 18–19 October 2008. [Google Scholar]
- Kpodjedo, S.; Ricca, F.; Galinier, P.; Guéhéneuc, Y.G.; Antoniol, G. Design Evolution Metrics for Defect Prediction in Object Oriented Systems. Empir. Softw. Eng. 2011, 16, 141–175. [Google Scholar] [CrossRef]
- Catal, C.; Diri, B.; Ozumut, B. An Artificial Immune System Approach for Fault Prediction in Object-Oriented Software. In Proceedings of the 2nd International Conference on Dependability of Computer Systems (DepCoS-RELCOMEX’07), Szklarska, Poland, 14–16 June2007; pp. 1–8. [Google Scholar]
- Khari, M. Heuristic search-based approach for automated test data generation: A survey. Int. J. Bio-Inspired Comput. 2013, 5, 1–18. [Google Scholar]
- Mertik, M.; Lenic, M.; Stiglic, G.; Kokol, P. Estimating Software Quality with Advanced Data Mining Techniques. In Proceedings of the international conference engineering advantages, Shanghai, China, 20–28 May 2006. [Google Scholar]
- Catal, C.; Sevim, U.; Diri, B. Clustering and Metrics Thresholds Based Software Fault Prediction of Unlabeled Program Modules. In Proceedings of the 2009 Sixth International Conference on Information Technology: New Generations, Las Vegas, NV, USA, 27–29 April 2009; pp. 199–204. [Google Scholar]
- Lessmann, S.; Baesens, B.; Mues, C.; Pietsch, S. Benchmarking Classification Models for Software Defect Prediction: A Proposed Framework and Novel Findings. IEEE Trans. Softw. Eng. 2008, 34, 485–496. [Google Scholar] [CrossRef]
- Catal, C.; Sevim, U.; Diri, B. Practical development of an Eclipse-based software fault prediction tool using Naive Bayes algorithm. Expert Syst. Appl. 2011, 38, 2347–2353. [Google Scholar] [CrossRef]
- Chiu, N. Combining techniques for software quality classification: An integrated decision network approach. Expert Syst. Appl. 2011, 38, 4618–4625. [Google Scholar] [CrossRef]
- Rodríguez, D.; Ruiz, R.; Riquelme, J.C.; Aguilar–Ruiz, J.S.S. Searching for Rules to Detect Defective Modules: A Subgroup Discovery Approach. Inf. Sci. 2012, 191, 14–30. [Google Scholar] [CrossRef]
- Khari, M.; Singh, N. Web Services Vulnerability Testing Using Open source Security Scanners: An experimental Study. Int. J. Adv. Eng. Glob. Technol. (Ijaegt) 2014, 2, 790–799. [Google Scholar]
- Pizzi, N.J.; Summerst, A.R.; Pedrycz, W. Software Quality Prediction Using Median-Adjusted Class Labels. In Proceedings of the 2002 International Joint Conference on Neural Networks. IJCNN’02(Cat.No.02CH37290), Honolulu, HI, USA, 12–17 May 2002. [Google Scholar]
- Rodriguez, D.; Ruiz, R.; Riquelme, J.C.; Harrison, R. A Study of Subgroup Discovery Approaches for Defect Prediction. Inf. Softw. Technol. 2013, 55, 1810–1822. [Google Scholar] [CrossRef]
- Baisch, E.; Liedtke, T. Comparison of Conventional Approaches and Soft-Computing Approaches for Software Quality Prediction. In Proceedings of the 1997 IEEE International Conference on Systems, Man, and Cybernetics. Computational Cybernetics and Simulation, Orlando, FL, USA, 12–15 October 1997; pp. 1045–1049. [Google Scholar]
- Arisholm, E.; Briand, L.C.; Johannessen, E.B. A Systematic and Comprehensive Investigation of Methods to Build and Evaluate Fault Prediction Models. J. Syst. Softw. 2010, 83, 2–17. [Google Scholar] [CrossRef]
- Arisholm, E.; Briand, L.C.; Fuglerud, M. Data Mining Techniques for Building Fault-Proneness Models in Telecom Java Software. In Proceedings of the 18th IEEE International Symposium on Software Reliability (ISSRE’07), Trollhattan, Sweden, 5–9 November 2007; pp. 215–224. [Google Scholar]
- Erturk, E.; Sezer, E.A. A comparison of some soft computing methods for software fault prediction. Expert Syst. Appl. 2015, 42, 1872–1879. [Google Scholar] [CrossRef]
- Peters, F.; Menzies, T.; Marcus, A. Better Cross Company Defect Prediction. In Proceedings of the 2013 10th Working Conference on Mining Software Repositories (MSR), San Francisco, CA, USA, 18–19 May 2013; pp. 409–418. [Google Scholar]
- Xing, F.; Guo, P.; Lyu, M.R. A Novel Method for Early Software Quality Prediction Based on Support Vector Machine. In Proceedings of the 16th IEEE International Symposium on Software Reliability Engineering, Chicago, IL, USA, 8–11 November 2005. [Google Scholar]
- Canfora, G.; Cerulo, L. Impact Analysis by Mining Software and Change Request Repositories. In Proceedings of the 11th IEEE International Software Metrics Symposium (METRICS’05), Como, Italy, 19–22 September 2005. [Google Scholar]
- Denaro, G.; Pezze, M. An Empirical Evaluation of Fault-Proneness Models. In Proceedings of the 24th International Conference on Software Engineering, Orlando, FL, USA, 19–25 May 2002. [Google Scholar]
- Cahill, J.; Hogan, J.M.; Thomas, R. Predicting Fault-Prone Software Modules with Rank Sum Classification. In Proceedings of the 20132 2nd Australian Software Engineering Conference, Melbourne, VIC, Australia, 4–7 June 2013; pp. 211–219. [Google Scholar]
- Al Dallal, J. The Impact of Accounting for Special Methods in the Measurement of Object-Oriented Class Cohesion on Refactoring and Fault Prediction Activities. J. Syst. Softw. 2012, 85, 1042–1057. [Google Scholar] [CrossRef]
- Hao, J.; Shu, F.; Yang, Y.; Wang, Q. Predicting fault-prone modules: A comparative study. In Software Engineering Approaches for Offshore and Outsourced Development; Springer: Berlin/Heidelberg, Germany, 2009; pp. 45–59. [Google Scholar]
- Elish, K.O.; Elish, M.O. Predicting Defect-Prone Software Modules Using Support Vector Machines. J. Syst. Softw. 2008, 81, 649–660. [Google Scholar] [CrossRef]
- Mira, K.; Canfora, G.; Chiorean, D.; Ihme, T.; Lehman, M.M.; Reiger, R. A Model of Maintainability–Suggestion for Future Research. Available online: http://citeseerx.ist.psu.edu/viewdoc/summary?doi=10.1.1.76.7677 (accessed on 2 January 2019).
- Kaminsky, K.; Boetticher, G. Building a Genetically Engineerable Evolvable Program (GEEP) Using Breadth-Based Explicit Knowledge for Predicting Software Defects. In Proceedings of the IEEE Annual Meeting of the Fuzzy Information, Budapest, Hungary, 27–30 June 2004. [Google Scholar]
- Sultan, K.; En-Nouaary, A.; Hamou-Lhadj, A. Catalog of Metrics for Assessing Security Risks of Software throughout the Software Development Life Cycle. In Proceedings of the International Conference on Information Security and Assurance, Busan, Korea, 24–26 April 2008. [Google Scholar]
- Khari, M.; Karar, A. Analysis on Intrusion Detection by Machine Learning Techniques: A Review. Int. J. Adv. Res. Comput. Sci. Softw. Eng. 2013, 3, 545–548. [Google Scholar]
- Guo, L.; Cukic, B.; Singh, H. Predicting Fault Prone Modules by the Dempster-Shafer Belief Networks. In Proceedings of the 18th IEEE International Conference on Automated Software Engineering, Montreal, QC, Canada, 6–10 October 2003; pp. 3–6. [Google Scholar]
- Yu, L. An Evolutionary Programming Based Asymmetric Weighted Least Squares Support Vector Machine Ensemble Learning Methodology for Software Repository Mining. Inf. Sci. 2012, 191, 31–46. [Google Scholar] [CrossRef]
- Peng, M.; Huang, T.; Yu, Y.R.; Pan, J. IEEE Access Special Section Editorial: Recent Advances in Software Defined Networking for 5GNetworks. IEEE Access 2015, 3, 3076–3078. [Google Scholar] [CrossRef]
- Briand, L.; Daly, W.; Wust, J. A unified framework for coupling measurement in object-oriented systems. IEEE Trans. Softw. Eng. 1999, 25, 91–121. [Google Scholar] [CrossRef]
- Li, W.; Shatnawi, R. An Empirical Study of the Bad Smells and Class Error Probability in the Post-Release Object-Oriented System Evolution. J. Syst. Softw. 2007, 80, 1120–1128. [Google Scholar] [CrossRef]
- Khoshgoftaar, T.M.; Seliya, N. Tree-Based Software Quality Estimation Models for Fault Prediction. In Proceedings of the Eighth IEEE Symposium on Software Metrics, Ottawa, ON, Canada, 4–7 June 2002. [Google Scholar]
- Zhao, M.; Wohlin, C.; Ohlsson, N.; Xie, M. A Comparison between Software Design and Code Metrics for the Prediction of Software Fault Content. Inf. Softw. Technol. 1998, 40, 801–809. [Google Scholar] [CrossRef]
- Ambros, M.D.; Lanza, M.; Robbes, R. Evaluating defect prediction approaches a benchmark and an extensive comparison. Empir. Softw. Eng. 2012, 17, 531–577. [Google Scholar] [CrossRef]
- Liu, Y.; Khoshgoftaar, T.M.; Seliya, N. Evolutionary Optimization of Software Quality Modeling with Multiple Repositories. IEEE Trans. Softw. Eng. 2010, 36, 852–864. [Google Scholar] [CrossRef]
- Evett, M.; Khoshgoftar, T.; Chien, P.D.; Allen, E. GP-based software quality prediction. In Proceedings of the Third Annual Conference Genetic Programming, July 1998; pp. 60–65. [Google Scholar]
- Masud, M.M.; Gao, J.; Khan, L.; Han, J.; Thuraisingham, B. Classification and Novel Class Detection in Concept-Drifting Data Stream sunder Time Constraints. IEEE Trans. Knowl. Data Eng. 2011, 23, 859–874. [Google Scholar] [CrossRef]
- Nagappan, N.; Zeller, A.; Zimmermann, T.; Herzig, K.; Murphy, B. Change Bursts as Defect Predictors. In Proceedings of the 2010 IEEE 21st International Symposium on Software Reliability Engineering, San Jose, CA, USA, 1–4 November 2010. [Google Scholar]
- Khari, M.; Kumar, P. A Novel Approach for Software Test Data Generation using Cuckoo Algorithm. In Proceedings of the Second International Conference on Information and Communication Technology for Competitive Strategies, Udaipur, India, 4–5 March 2016; p. 98. [Google Scholar]
- Bettenburg, N.; Nagappan, M.; Hassan, A.E. Think Locally, Act Globally: Improving Defects and Effort Prediction Models. In Proceedings of the 9th Working Conference on Mining Software Repositories, Zurich, Switzerland, 2–3 June 2012. [Google Scholar]
- Chen, N.; Hoi, S.C.H.; Xiao, X. Software Process Evaluation: A Machine Learning Framework with Application to Defect Management Process. Empir. Softw. Eng. 2013, 19, 1531–1564. [Google Scholar] [CrossRef]
- Pendharkar, P.C. Exhaustive and Heuristic Search Approaches for Learning a Software Defect Prediction Model. Eng. Appl. Artif. Intell. 2010, 23, 34–40. [Google Scholar] [CrossRef]
- Bishnu, P.S.; Bhattacherjee, V. Software Fault Prediction Using Quad Tree-Based K-Means Clustering Algorithm. IEEE Trans. Knowl. Data Eng. 2012, 24, 1146–1150. [Google Scholar] [CrossRef]
- Knab, P.; Pinzger, M.; Bernstein, A. Predicting Defect Densities in Source Code Files with Decision Tree Learners. In Proceedings of the 2006 International Workshop on Mining Software Repositories, Shanghai, China, 22–23 May 2006. [Google Scholar]
- Bangcharoensap, P.; Ihara, A.; Kamei, Y.; Matsumoto, K. Locating Source Code to Be Fixed Based on Initial Bug Reports—A Case Study on the Eclipse Project. In Proceedings of the 2012 Fourth International Workshop on Empirical Software Engineering in Practice, Osaka, Japan, 26–27 October 2012; pp. 10–15. [Google Scholar]
- Yu, P.; Systa, T.; Muller, H. Predicting Fault-Proneness using OO Metrics an Industrial Case Study. In Proceedings of the sixth Europe Conference on Software Maintenance and Reengineering, Budapest, Hungary, 13 March 2002. [Google Scholar]
- Singh, P.; Verma, S. Empirical Investigation of Fault Prediction Capability of Object Oriented Metrics of Open Source Software. In Proceedings of the 2012 International Joint Conference on Computer Science and Software Engineering (JCSSE), Bangkok, Thailand, 30 May−1 June 2012; pp. 323–327. [Google Scholar]
- Singh, P.; Verma, S. An Investigation of the Effect of Discretization on Defect Prediction Using Static Measures. In Proceedings of the 2009 International Conference on Advances in Computing, Control, and Telecommunication Technologies, Kerala, India, 28–29 December 2009; pp. 837–839. [Google Scholar]
- Wang, Q.; Yu, B.; Zhu, J. Extract Rules from Software Quality Prediction Model Based on Neural Network. In Proceedings of the International Conference on Tools with Artificial Independence (Ictai), BocaRaton, FL, USA, 15–17 November 2004. [Google Scholar]
- Rathore, S.S.; Gupta, A. Investigating object-oriented design metrics to predict fault-proneness of software modules. In Proceedings of the 2012 CSI Sixth International Conference on Software Engineering (CONSEG), Indore, India, 5–7 September 2012; pp. 1–10. [Google Scholar]
- Song, Q.; Jia, Z.; Shepperd, M.; Ying, S.; Liu, J. A General Software Defect-Proneness Prediction Framework. IEEE Trans. Softw. Eng. 2011, 37, 356–370. [Google Scholar] [CrossRef]
- Bibi, S.; Tsoumakas, G.; Stamelos, I.; Vlahavas, I. Regression via Classification Applied on Software Defect Estimation. Expert Syst. Appl. 2008, 34, 2091–2101. [Google Scholar] [CrossRef]
- Hou, S.; Li, Y. Short-Term Fault Prediction Basedon Support Vector Machines with Parameter Optimization by Evolution Strategy. Expert Syst. Appl. 2009, 36, 12383–12391. [Google Scholar] [CrossRef]
- Stasiak, A.; Chudzikiewicz, J.; Zieliński, Z. Software Metrics for Similarity Determination of Complex Software Systems. In KKIO Software Engineering Conference; Springer: Cham, Switzerland, 2018; pp. 175–191. [Google Scholar]
- Ostrand, T.J.; Weyuker, E.J.; Bell, R.M. Predicting the Location and Number of Faults in Large Software Systems. IEEE Trans. Softw. Eng. 2005, 31, 340–355. [Google Scholar] [CrossRef]
- Gyimothy, T.; Ferenc, R.; Siket, I. Empirical Validation of Object-Oriented Metrics on Open Source Software for Fault Prediction. IEEE Trans. Softw. Eng. 2005, 31, 897–910. [Google Scholar] [CrossRef]
- Menzies, T.; Turhan, B.; Bener, A.; Gay, G.; Cukic, B.; Jiang, Y. Implications of Ceiling Effects in Defect Predictors. In Proceedings of the 4th International Workshop on Predictor Models in Software Engineering, Leipzig, Germany, 12–13 May 2008. [Google Scholar]
- Menzies, T.; Greenwald, J.; Frank, A. Data mining Static Code Attributes to Learn Defect Predictors. IEEE Trans. Softw. Eng. 2007, 33, 2–13. [Google Scholar] [CrossRef]
- Challagulla, V.U.B.; Bastani, F.B.; Yen, I.; Raymond, A.P. Empirical Assessment of Machine Learning Based Software Defect Prediction Techniques. In Proceedings of the 10th IEEE International Workshop on Object-Oriented Real-Time Dependable Systems, Sedona, AZ, USA, 2–4 February 2005. [Google Scholar]
- Afzal, W.; Torkar, R. On the Application of Genetic Programming for Software Engineering Predictive Modeling: A Systematic Review. Expert Syst. Appl. 2011, 38, 11984–11997. [Google Scholar] [CrossRef]
- Afzal, W.; Torkar, R. A Comparative Evaluation of Using Genetic Programming for Predicting Fault Count Data. In Proceedings of the 2008 The Third International Conference on Software Engineering Advances, Siema, Malta, 26–31 October 2008; pp. 407–414. [Google Scholar]
- Afzal, W. Using Faults-Slip-Through Metric as a Predictor of Fault-Proneness. In Proceedings of the Asia Pacific Software Engineering Conference, Sydney, Australia, 30 November–3 December 2010; pp. 414–422. [Google Scholar]
- Shin, Y.; Williams, L. An Empirical Model to Predict Security Vulnerabilities using Code Complexity Metrics. In Proceedings of the ESEM, Kaiserslautern, Germany, 9–10 October 2008. [Google Scholar]
- Shin, Y.; Meneely, A.; Williams, L.; Osborne, J.A. Evaluating Complexity, Code Churn, and Developer Activity Metrics as Indicators of Software Vulnerabilities. IEEE Trans. Softw. Eng. 2011, 37, 772–787. [Google Scholar] [CrossRef]
- Jiang, Y.; Cukic, B.; Ma, Y. Techniques for Evaluating Fault Prediction Models. Empir. Softw. Eng. 2008, 13, 561–595. [Google Scholar] [CrossRef]
- Jiang, Y.; Cukic, B.; Menzies, T. Fault Prediction Using Early Life cycle Data. In Proceedings of the 18th IEEE International Symposium on Software Reliability Engineering (ISSRE’07), Trollhattan, Sweden, 5–9 November 2007; pp. 237–346. [Google Scholar]
- Zhou, Y.; Xu, B.; Leung, H. On the Ability of Complexity Metrics to Predict Fault-Prone Classes in Object-Oriented Systems. J. Syst. Softw. 2010, 83, 660–674. [Google Scholar] [CrossRef]
- Li, Z.; Reformat, M. A Practical Method for the Software Fault-Prediction. In Proceedings of the 2007 IEEE International Conference on Information Reuse and Integration, Las Vegas, IL, USA, 13–15 August 2007; pp. 659–666. [Google Scholar]
- He, Z.; Shu, F.; Yang, Y.; Li, M.; Wang, Q. An Investigation on the Feasibility of Cross-Project Defect Prediction. Autom. Softw. Eng. 2012, 19, 167–199. [Google Scholar] [CrossRef]
- Riggan, B.S.; Reale, C.; Nasrabadi, N.M. Coupled auto-associative neural networks for heterogeneous face recognition. IEEE Access 2015, 3, 1620–1632. [Google Scholar] [CrossRef]
- Wang, X.; Li, X.; Leung, V.C. Artificial intelligence-based techniques for emerging heterogeneous network: State of the Arts, Opportunities, and Challenges. IEEE Access 2015, 3, 1379–1391. [Google Scholar] [CrossRef]
- Yang, Y.; Flessi, D.; Menzies, T.; Hihn, J. Actionable analytics for software engineering. IEEE Softw. 2018, 35, 51–53. [Google Scholar] [CrossRef]
- Phuong, P.T.M.; Thong, P.H.; Son, L.H. Theoretical Analysis of Picture Fuzzy Clustering: Convergence and Property. J. Comput. Sci. Cybern. 2018, 34, 17–32. [Google Scholar] [CrossRef]
- Jha, S.; Kumar, R.; Chatterjee, J.M.; Khari, M.; Yadav, N.; Smarandache, F. Neutrosophic softest decision making for stock trending analysis. Evol. Syst. 2018, 1–7. [Google Scholar] [CrossRef]
- Ngan, R.T.; Son, L.H.; Cuong, B.C.; Ali, M. H-max distance measure of intuition stic fuzzy sets in decision making. Appl. Soft Comput. 2018, 69, 393–425. [Google Scholar] [CrossRef]
- Giap, C.N.; Son, L.H.; Chiclana, F. Dynamic structural neural network. J. Intell. Fuzzy Syst. 2018, 34, 2479–2490. [Google Scholar] [CrossRef]
- Ali, M.; Son, L.H.; Thanh, N.D.; Van Minh, N. A neutrosophic recommender system for medical diagnosis based on algebraic neutrosophic measures. Appl. Soft Comput. 2018, 71, 1054–1071. [Google Scholar] [CrossRef]
- Ali, M.; Son, L.H.; Khan, M.; Tung, N.T. Segmentation of dental X-ray images i in medical imaging using neutrosophic orthogonal matrices. Expert Syst. Appl. 2018, 91, 434–441. [Google Scholar] [CrossRef]
- Ali, M.; Dat, L.Q.; Son, L.H.; Smarandache, F. Interval complex neutrosophic set: Formulation and applications in decision-making. Int. J. Fuzzy Syst. 2018, 20, 986–999. [Google Scholar] [CrossRef]
- Son, L.H.; Tuan, T.M.; Fujita, H.; Dey, N.; Ashour, A.S.; Ngoc, V.T.N.; Chu, D.T. Dental diagnosis from X-Ray images: An expert system based on fuzzy computing. Biomed. Signal. Process. Control. 2018, 39, 64–73. [Google Scholar] [CrossRef]
- Nguyen, G.N.; Son, L.H.; Ashour, A.S.; Dey, N. A survey of the state-of-the-arts on neutrosophic sets in biomedical diagnoses. Int. J. Mach. Learn. Cybern. 2019, 10, 1–13. [Google Scholar] [CrossRef]
- Ngan, R.T.; Ali, M.; Son, L.H. δ-equality of intuition fuzzy sets: A new proximity measure and applications in medical diagnosis. Appl. Intell. 2018, 48, 499–525. [Google Scholar] [CrossRef]
- Ali, M.; Son, L.H.; Deli, I.; Tien, N.D. Bipolar neutrosophics of t-sets and applications in decision making. J. Intell. Fuzzy Syst. 2017, 33, 4077–4087. [Google Scholar] [CrossRef]
- Thanh, N.D.; Ali, M.; Son, L.H. A novel clustering algorithm in a neutrosophic recommender system for medical diagnosis. Cogn. Comput. 2017, 9, 526–544. [Google Scholar] [CrossRef]
- Son, L.H.; Viet, P.V.; Hai, P.V. Picture inference system: A new fuzzy inference system on picture fuzzy set. Appl. Intell. 2017, 46, 652–669. [Google Scholar] [CrossRef]
- Son, L.H.; Tien, P.V. Tune up fuzzy C-means for big data: Some novel hybrid clustering algorithms based on initial selection and incremental clustering. Int. J. Fuzzy Syst. 2017, 19, 1585–1602. [Google Scholar] [CrossRef]
Figure 1.
The mapping process.
Figure 1.
The mapping process.
Figure 2.
Extraction Card.
Figure 2.
Extraction Card.
| Author(s) |
| Title of Publication |
| Journal/Conference name |
| Year of Publication |
| Dataset(s) used |
| Independent Variables |
| Model Building Techniques Used |
| Feature Selection Techniques Used |
| Cross Project/Severity/Security Defects/Threshold Determining Studies |
| Research Questions Addressed (List) |
Figure 3.
Distribution of DeP studies on a year-by-year basis.
Figure 3.
Distribution of DeP studies on a year-by-year basis.
Figure 4.
Model building techniques used in DeP Studies.
Figure 4.
Model building techniques used in DeP Studies.
Figure 5.
Multi co-linearity analysis procedures applied to DeP studies.
Figure 5.
Multi co-linearity analysis procedures applied to DeP studies.
Figure 6.
Feature sub-selection procedures applied to DeP studies.
Figure 6.
Feature sub-selection procedures applied to DeP studies.
Figure 7.
Sources of data used across DeP studies.
Figure 7.
Sources of data used across DeP studies.
Figure 8.
Significant predictors of software defects.
Figure 8.
Significant predictors of software defects.
Figure 9.
Performance measures used for DeP studies.
Figure 9.
Performance measures used for DeP studies.
Figure 10.
Statistical Tests used by DeP Studies.
Figure 10.
Statistical Tests used by DeP Studies.
Figure 11.
Performance comparison of learning techniques.
Figure 11.
Performance comparison of learning techniques.
Table 1.
Research questions.
Table 1.
Research questions.
| RQ# | Research Question | Motivation |
|---|
| RQ1 | What techniques have been used for building Defect Prediction in Software (DeP) models? | Identification of the various techniques used to build DeP models. |
| RQ2 | What are the different data pre-processing techniques used in DeP models? | Identification of the techniques used to prepare the training data for DeP. |
| RQ2.1 | What are the different techniques used for multi-co linearity analysis in DeP studies? | Identification of techniques to analyze the degree of multi-co-linearity among data. |
| RQ2.2 | What are the different techniques used for feature sub selection in DeP studies? | Identification of techniques used to select relevant features in the input data. |
| RQ3 | What is the kind of data used in DeP studies? | Evaluating the type of data used for DeP studies. |
| RQ3.1 | Which data sets are used for DeP? | What are the popular datasets used in DeP studies? |
| RQ3.2 | Which metrics are found to be significant predictors for DeP? | Identification of metrics that are found to be relevant for DeP. |
| RQ3.3 | Which metrics are found to be insignificant predictors for DeP? | Identification of metrics that are found to be irrelevant for DeP. |
| RQ4 | What are the methods used for performance evaluation in DeP models? | Identify the methods used to evaluate the performance of DeP models. |
| RQ4.1 | What are the different performance measures used for DeP studies? | Identify the performance parameters that are used to evaluate how well a DeP model has worked. |
| RQ4.2 | What are the different statistical tests of significance used in DeP studies? | Identify the statistical tests that have been used to evaluate the results of DeP models. |
| RQ5 | What is the performance of various learning techniques across datasets? | Estimate the effectiveness of learning techniques for DeP. |
| RQ6 | What is the performance of search-based techniques in defect prediction? | Estimate the effectiveness of search-based techniques for DeP. |
| RQ7 | How many DeP studies attempt to predict security related defects and vulnerabilities? | Estimate the number of studies that work on security related defects and software vulnerabilities. |
| RQ8 | How many DeP studies attempt to identify defects of varying severity levels? | Estimate the number of studies that work on defects of various severity levels. |
| RQ9 | How many DeP studies perform cross-project DeP? | Estimate the number of studies that perform cross-project DeP. |
Table 2.
Quality analysis questions.
Table 2.
Quality analysis questions.
| No. | Description | Agree | Neutral | Disagree |
|---|
| QQ1 | Is the objective of the study clear? | | | |
| QQ2 | Does the study add value to the existing literature? | | | |
| QQ3 | Is the dataset size sufficient for this type of studies? | | | |
| QQ4 | Does the study perform multi-co linearity analysis? | | | |
| QQ5 | Does the study perform feature sub-selection? | | | |
| QQ6 | Are the independent variables clearly defined? | | | |
| QQ7 | Is the data collection procedure clearly defined? | | | |
| QQ8 | Does the study use statistical tests while evaluating results? | | | |
| QQ9 | Does the author provide sufficient detail about the experiment? | | | |
| QQ10 | Are the threats to validity given? | | | |
| QQ11 | Does the study provide parameters of test? | | | |
| QQ12 | Are the limitations of the study given? | | | |
| QQ13 | Does the study clearly define the performance parameters used? | | | |
| QQ14 | Are the learning techniques clearly defined? | | | |
| QQ15 | Are the results clearly stated? | | | |
| QQ16 | Does the abstract provide sufficient information about the content of the study? | | | |
| QQ17 | Is there a comparison among techniques? ML (Machine Learning) vs. ML? | | | |
| QQ18 | Is there a comparison among techniques? ML vs. Statistical? | | | |
Table 3.
Quality assessment questions.
Table 3.
Quality assessment questions.
| No. | Description | Agree | Neutral | Disagree |
|---|
| QQ1 | Is the objective of the study clear? | 98(100.0%) | 00 (00.00%) | 00 (00.00%) |
| QQ2 | Does the study add value to the existing literature? | 67 (68.36%) | 29 (29.59%) | 02 (02.04%) |
| QQ3 | Is the dataset size sufficient for this type of studies? | 81 (82.65%) | 15 (15.30%) | 02 (02.04%) |
| QQ4 | Does the study perform multi co linearity analysis? | 07 (07.14%) | 06(06.12%) | 85 (86.73%) |
| QQ5 | Does the study perform feature sub selection? | 45 (45.91%) | 20 (20.40%) | 32 (32.65%) |
| QQ6 | Are the independent variables clearly defined? | 65 (66.32%) | 22(22.44%) | 11 (11.22%) |
| QQ7 | Is the data collection procedure clearly defined? | 66 (67.34%) | 30 (30.61%) | 02 (02.04%) |
| QQ8 | Does the study use statistical tests while evaluating results? | 16 (16.32%) | 07 (07.14%) | 75 (76.53%) |
| QQ9 | Does the author provide sufficient detail about the experiment? | 48 (48.97%) | 49 (50.00%) | 01 (01.02%) |
| QQ10 | Are the threats to validity given? | 44 (44.89%) | 08 (08.16%) | 46 (46.93%) |
| QQ11 | Does the study provide parameters of test? | 14 (14.28%) | 44 (44.89%) | 40 (40.81%) |
| QQ12 | Are the limitations of the study given? | 22 (22.44%) | 63 (64.28%) | 13 (13.26%) |
| QQ13 | Does the study clearly define the performance parameters used? | 51 (52.04%) | 38 (38.77%) | 09 (09.18%) |
| QQ14 | Are the learning techniques clearly defined? | 64 (65.30%) | 30 (30.61%) | 04 (04.08%) |
| QQ15 | Are the results clearly stated? | 71 (72.44%) | 25 (25.51%) | 01 (01.02%) |
| QQ16 | Does the abstract provide sufficient information about the content of the study? | 27 (27.55%) | 62 (63.26%) | 09 (09.18%) |
| QQ17 | Is there a comparison among techniques? ML vs. ML? | 59 (60.20%) | 06 (06.12%) | 33 (33.67%) |
| QQ18 | Is there a comparison among techniques? ML vs. Statistical? | 26 (26.53%) | 10 (10.20%) | 62 (63.26%) |
Table 4.
Scores assigned to quality questions.
Table 4.
Scores assigned to quality questions.
| Score | No. of Primary Study s | Percentage |
|---|
| Very High (13 and Above) | 22 | 22.45% |
| High (9 to 12.5) | 66 | 67.35% |
| Average (6.5 to 8.5) | 7 | 7.14% |
| Low (6 and Below) | 3 | 3.06% |
Table 5.
Primary studies.
Table 5.
Primary studies.
| Primary Study | SE1 | SE2 | SE3 | SE4 | SE5 | SE6 | SE7 | SE8 | SE9 | SE10 |
| Reference | [17,18] | [19,20] | [21] | [22,23] | [24,25,26] | [27,28] | [29,30] | [31] | [32] | [33] |
| Primary Study | SE11 | SE12 | SE13 | SE14 | SE15 | SE16 | SE17 | SE18 | SE19 | SE20 |
| Reference | [34] | [35,36] | [37,38,39] | [40] | [41] | [42] | [43,44,45] | [46] | [47,48] | [49] |
| Primary Study | SE21 | SE22 | SE23 | SE24 | SE25 | SE26 | SE27 | SE28 | SE29 | SE30 |
| Reference | [50] | [51,52,53,54,55,56] | [57] | [58,59,60] | [61] | [62] | [63] | [64,65] | [66] | [67,68,69] |
| Primary Study | SE31 | SE32 | SE33 | SE34 | SE35 | SE36 | SE37 | SE38 | SE39 | SE40 |
| Reference | [70] | [71] | [72] | [73,74,75] | [76] | [77] | [78] | [79] | [80,81] | [82] |
| Primary Study | SE41 | SE42 | SE43 | SE44 | SE45 | SE46 | SE47 | SE48 | SE49 | SE50 |
| Reference | [83,84] | [85] | [86] | [87] | [88] | [89] | [90] | [91] | [92] | [93,94] |
| Primary Study | SE51 | SE52 | SE53 | SE54 | SE55 | SE56 | SE57 | SE58 | SE59 | SE60 |
| Reference | [95,96] | [97,98] | [99] | [100] | [101] | [102] | [103] | [104] | [105] | [106] |
| Primary Study | SE61 | SE62 | SE63 | SE64 | SE65 | SE66 | SE67 | SE68 | SE69 | SE70 |
| Reference | [107] | [108] | [109] | [110] | [111] | [112] | [113] | [114] | [115,116] | [117,118] |
| Primary Study | SE71 | SE72 | SE73 | SE74 | SE75 | SE76 | SE77 | SE78 | SE79 | SE80 |
| Reference | [119,120] | [121,122] | [123] | [124,125] | [126] | [127] | [128,129,130] | [131] | [132,133] | [134,135,136] |
| Primary Study | SE81 | SE82 | SE83 | SE84 | SE85 | SE86 | SE87 | SE88 | SE89 | SE90 |
| Reference | [137] | [138] | [139] | [140,141] | [142,143] | [144] | [145] | [146,147] | [148] | [149] |
| Primary Study | SE91 | SE92 | SE93 | SE94 | SE95 | SE96 | SE97 | SE98 | | |
| Reference | [150,151] | [152,153] | [154,155,156,157,158,159] | [160] | [161,162,163,164] | [165,166] | [167,168] | [169,170,171,172] | | |
Table 6.
Quality scores of primary studies obtaining at least 13 points.
Table 6.
Quality scores of primary studies obtaining at least 13 points.
| Primary Study | Quality Score | Primary Study | Quality Score |
|---|
| SE8 | 13 | SE31 | 14 |
| SE14 | 14 | SE57 | 14.5 |
| SE24 | 17.5 | SE41 | 13.5 |
| SE35 | 13 | SE75 | 13 |
| SE38 | 16.5 | SE58 | 14 |
| SE51 | 15 | SE86 | 14.5 |
| SE54 | 14 | SE98 | 15.5 |
| SE63 | 15 | SE2 | 13.5 |
| SE80 | 13.5 | SE66 | 13 |
| SE84 | 14 | SE45 | 15 |
| SE96 | 15.5 | SE33 | 14 |
Table 7.
Summary of top publications.
Table 7.
Summary of top publications.
| Publication Name | Type | Number | Percent |
|---|
| ACM/IEEE International Symposium on Empirical Software Engineering | Conference | 1 | 1.02% |
| Advances in Engineering Software | Journal | 1 | 1.02% |
| Applied Soft Computing | Journal | 1 | 1.02% |
| Automated Software Engineering | Journal | 1 | 1.02% |
| Empirical Software Engineering | Journal | 6 | 6.12% |
| Engineering Applications of Artificial Intelligence | Journal | 1 | 1.02% |
| Expert Systems with Applications | Journal | 2 | 2.04% |
| IEEE International Symposium on Software Reliability | Conference | 3 | 3.06% |
| IEEE Software | Journal | 1 | 1.02% |
| IEEE Transactions on Software Engineering | Journal | 11 | 11.2% |
| Information and Software Technology | Journal | 2 | 2.04% |
| Information Sciences | Journal | 3 | 3.06% |
| Journal of Systems and Software | Journal | 10 | 10.2% |
| LNCS–Springer | Journal | 1 | 1.02% |
| Software Quality Journal | Journal | 2 | 2.04% |
Table 8.
Studies applying multi co linearity procedures.
Table 8.
Studies applying multi co linearity procedures.
| Primary Study | VIF | Condition No. | PCA |
|---|
| SE4 | | X | |
| SE17 | | | X |
| SE26 | X | | |
| SE31 | | X | X |
| SE41 | X | | |
| SE50 | | X | |
| SE98 | | X | |
Table 9.
Datasets and learning techniques evaluated in RQ8.
Table 9.
Datasets and learning techniques evaluated in RQ8.
| Datasets | Learning Techniques |
|---|
| AR1, CM1, Eclipse, jEdit, JM1, KC1 (Method and Class Level), PC1, PC2, PC3, PC4 | Artificial Neural Network [27,164], Bayes Net, C4.5, Classification and Regression Trees (CART), Discriminant Analysis, KStar, Logistic Regression, Naive Bayes, Random Forest, Support Vector Machine |
Table 10.
Search-based techniques used in the literature.
Table 10.
Search-based techniques used in the literature.
| Learning Technique | Minimum ROC Area | Maximum ROC Area | Average ROC Area |
|---|
| Artificial NN | 0.66 | 0.94 | 0.76 |
| Bayes Net | 0.66 | 0.90 | 0.78 |
| C4.5 | 0.50 | 0.93 | 0.72 |
| CART | 0.61 | 0.87 | 0.73 |
| Discriminant Analysis | 0.73 | 0.88 | 0.81 |
| KStar | 0.60 | 0.83 | 0.69 |
| Logistic Regression | 0.49 | 0.89 | 0.73 |
| Naive Bayes | 0.63 | 0.85 | 0.75 |
| Random Forest | 0.73 | 0.97 | 0.82 |
| Support Vector Machine | 0.50 | 0.92 | 0.71 |
Table 11.
Search-based techniques used in literature.
Table 11.
Search-based techniques used in literature.
| Primary Study | ACO | AIRS | EP | ESD | GA | GP | GeP | PSO |
|---|
| SE22 | | X | | | | | | |
| SE45 | X | | | | | | | |
| SE57 | | X | | | | X | | |
| SE59 | | | | | | | | X |
| SE61 | | | | | | X | | |
| SE72 | X | | | | | | | |
| SE76 | | | | | X | | | |
| SE90 | | | | X | | | | |
| SE92 | | | X | | | | | |
Table 12.
Primary study used to answer research questions.
Table 12.
Primary study used to answer research questions.
| Primary Study | Dataset Used | Independent Variables Used |
|---|
| SE42 | Mozilla Based | Traditional Source Metrics (McCabe Cyclomatic Complexity, LOC) |
| SE43 | Unspecified | Security Metrics (Access Vector, Access Complexity, Authentication, Confidentiality Impact, Integrity Impact, Availability Impact) |
| SE79 | Mozilla Based, Red Hat Enterprise Linux Based | Traditional Source Metrics (Complexity, Coupling, Code Churn, Comments, Developer Activity, Developer Cluster, Contribution Centrality) |
Table 13.
Primary studies used to answer research questions.
Table 13.
Primary studies used to answer research questions.
| Primary Study | ML | ST | SB |
|---|
| SE42 | | X | |
| SE43 | | X | |
| SE79 | | X | |
Table 14.
Primary studies used to answer research questions.
Table 14.
Primary studies used to answer research questions.
| Primary study | Statistical Test Applied |
|---|
| SE42 | Wilcoxon Signed Rank Test |
| SE43 | - |
| SE79 | Weltch-t-Test, Bonferoni Test |
© 2019 by the authors. Licensee MDPI, Basel, Switzerland. This article is an open access article distributed under the terms and conditions of the Creative Commons Attribution (CC BY) license (http://creativecommons.org/licenses/by/4.0/).


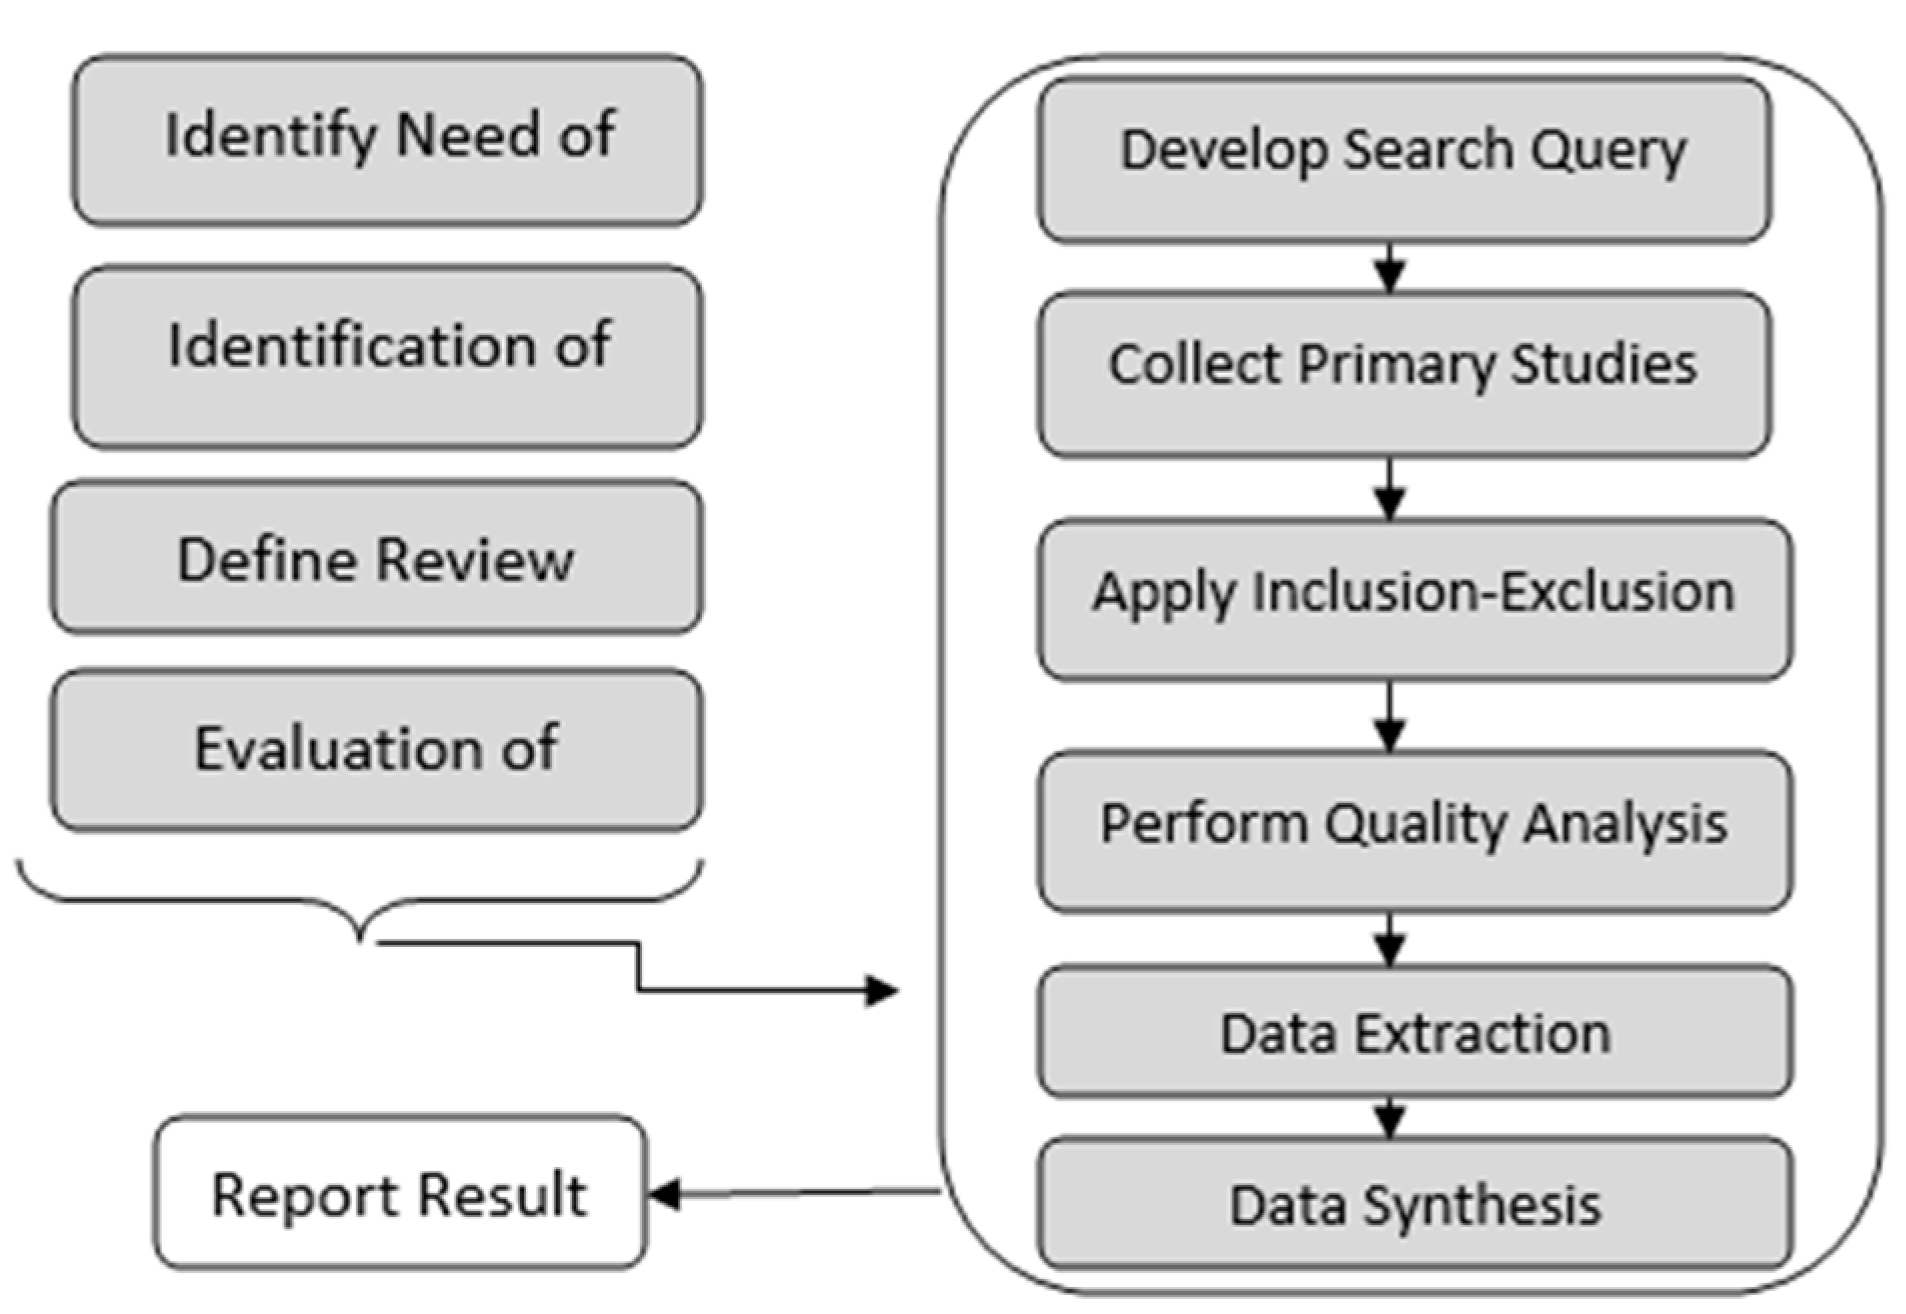
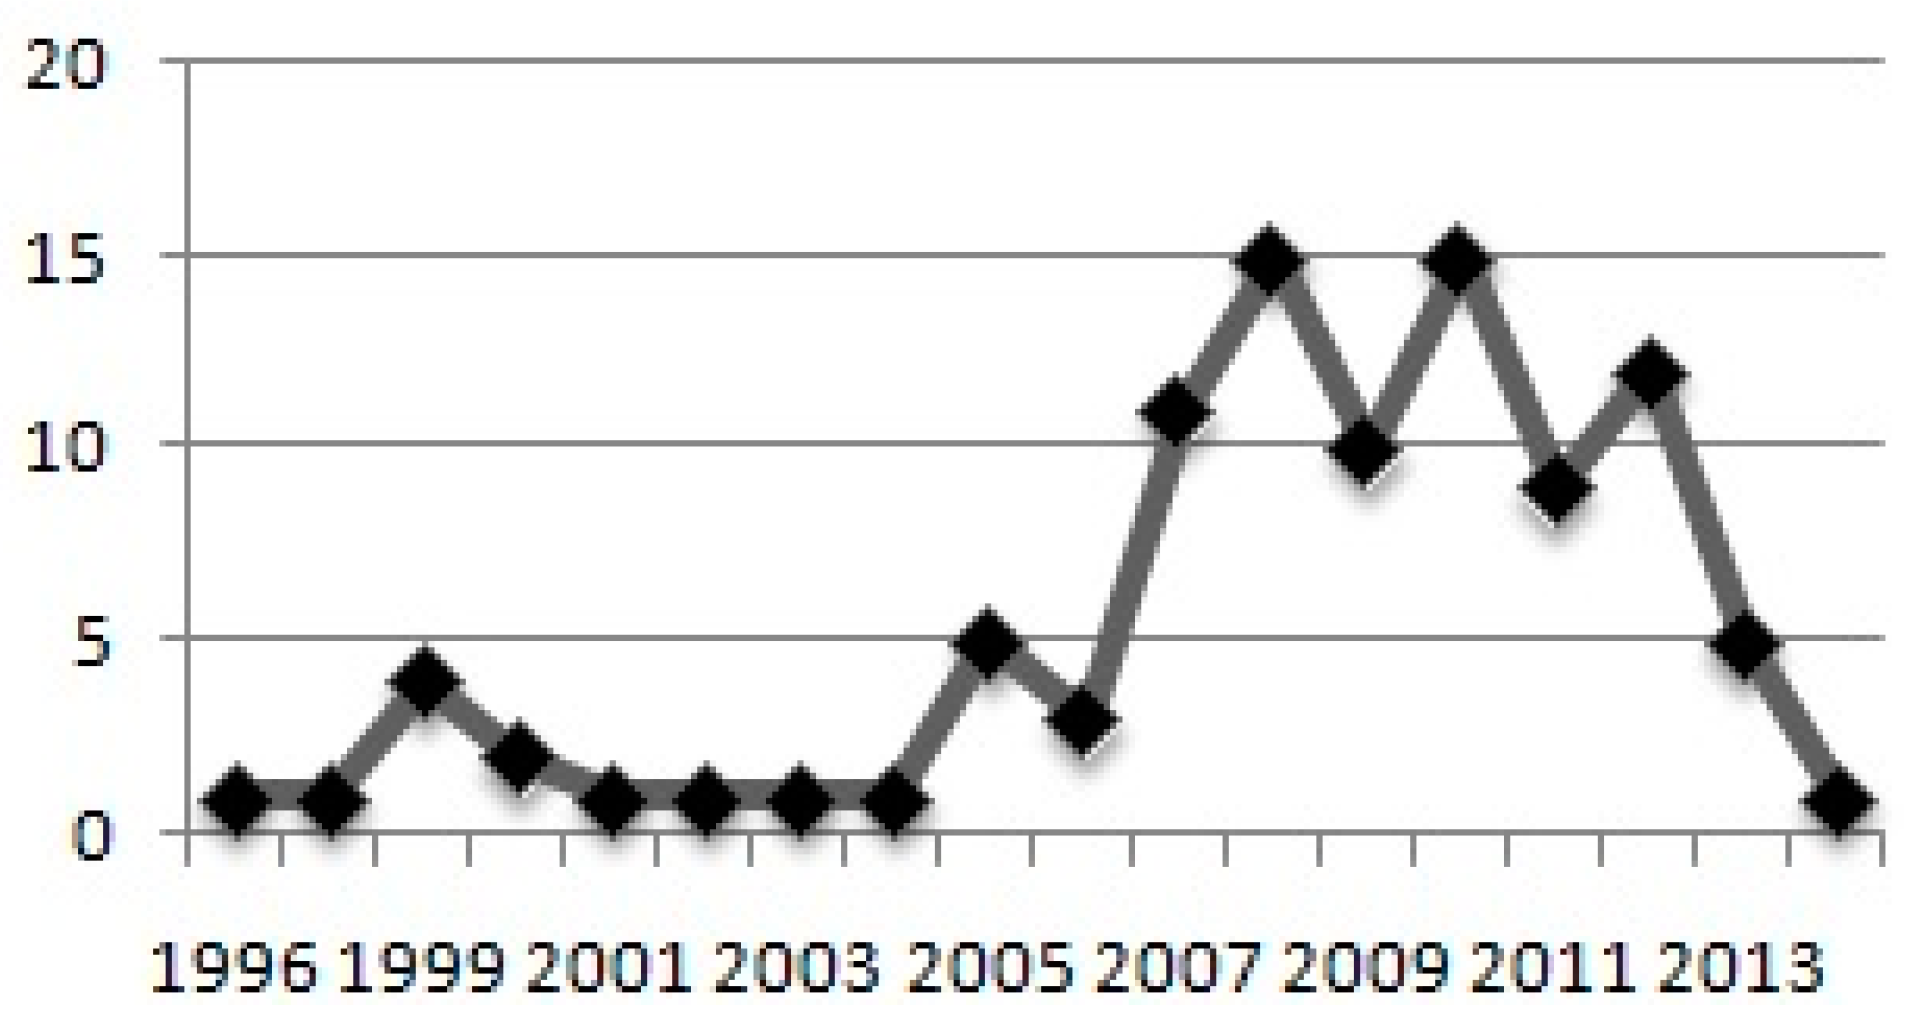
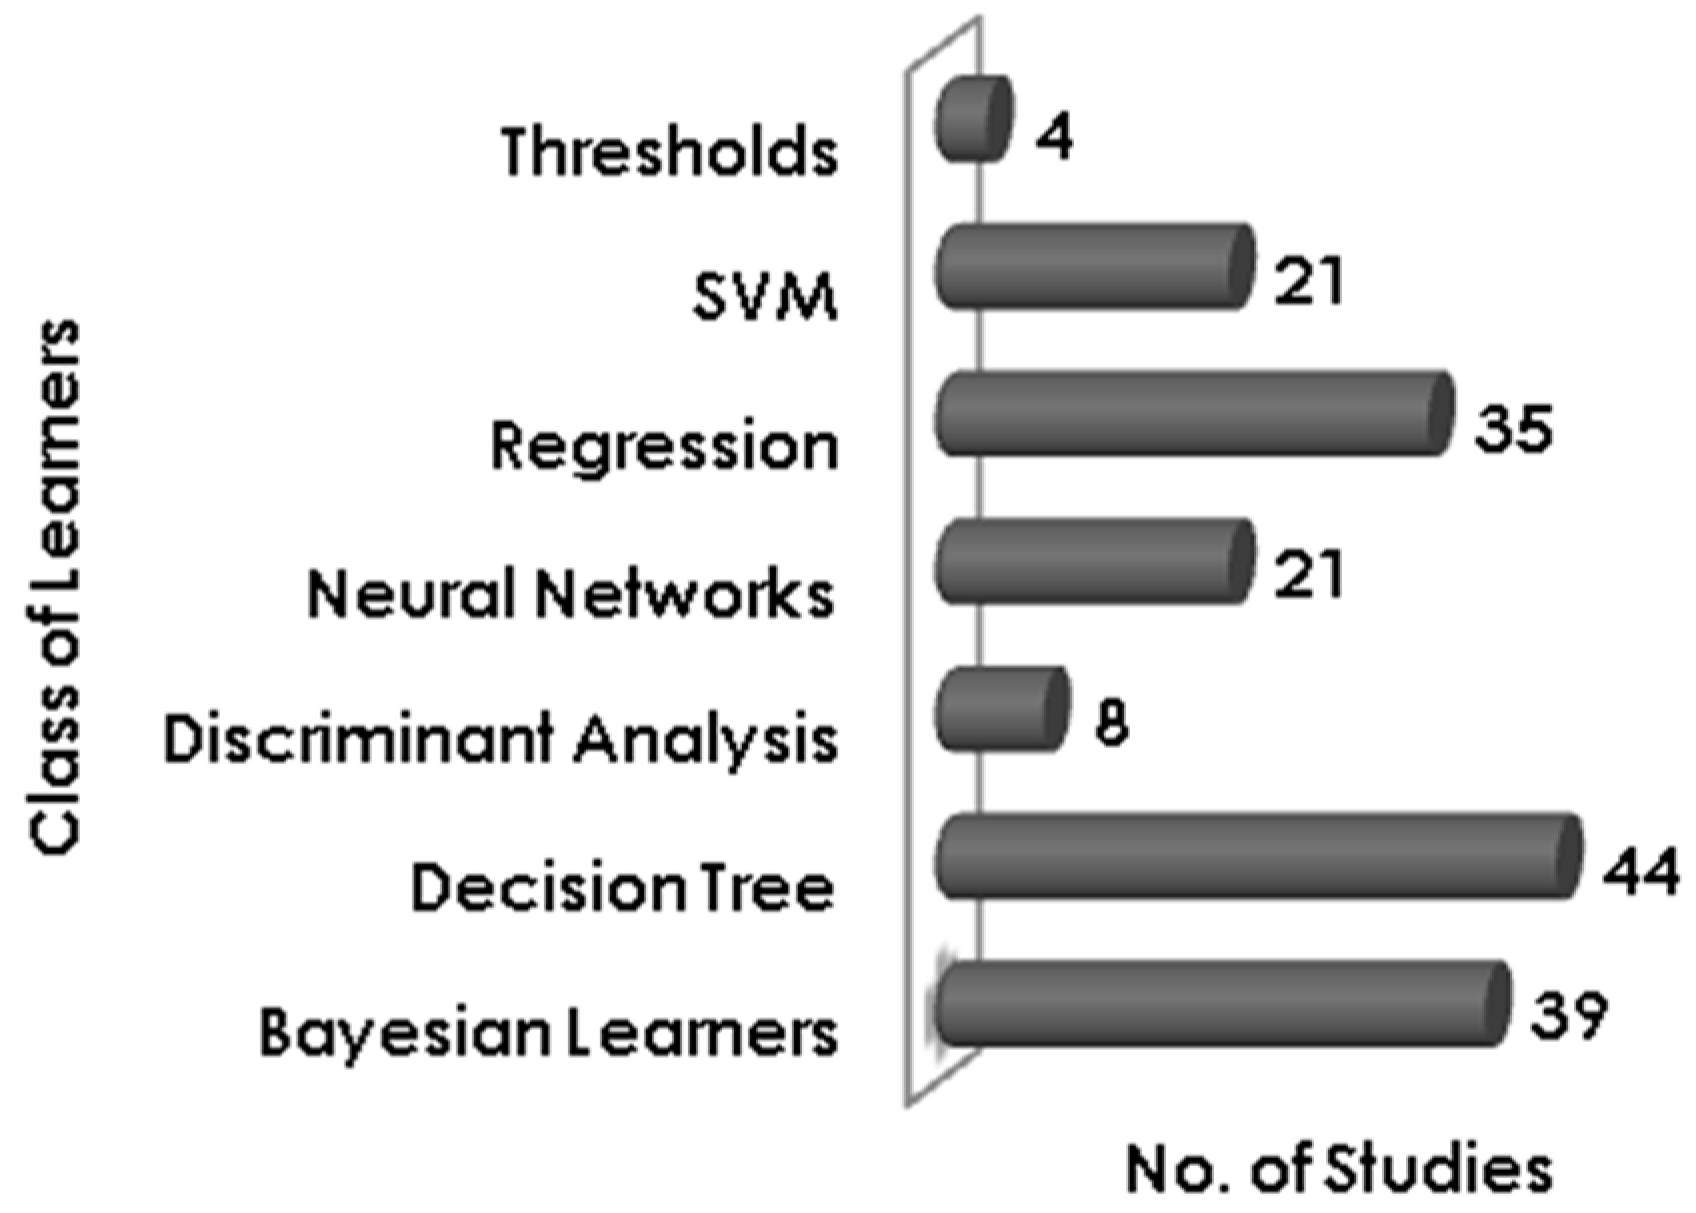
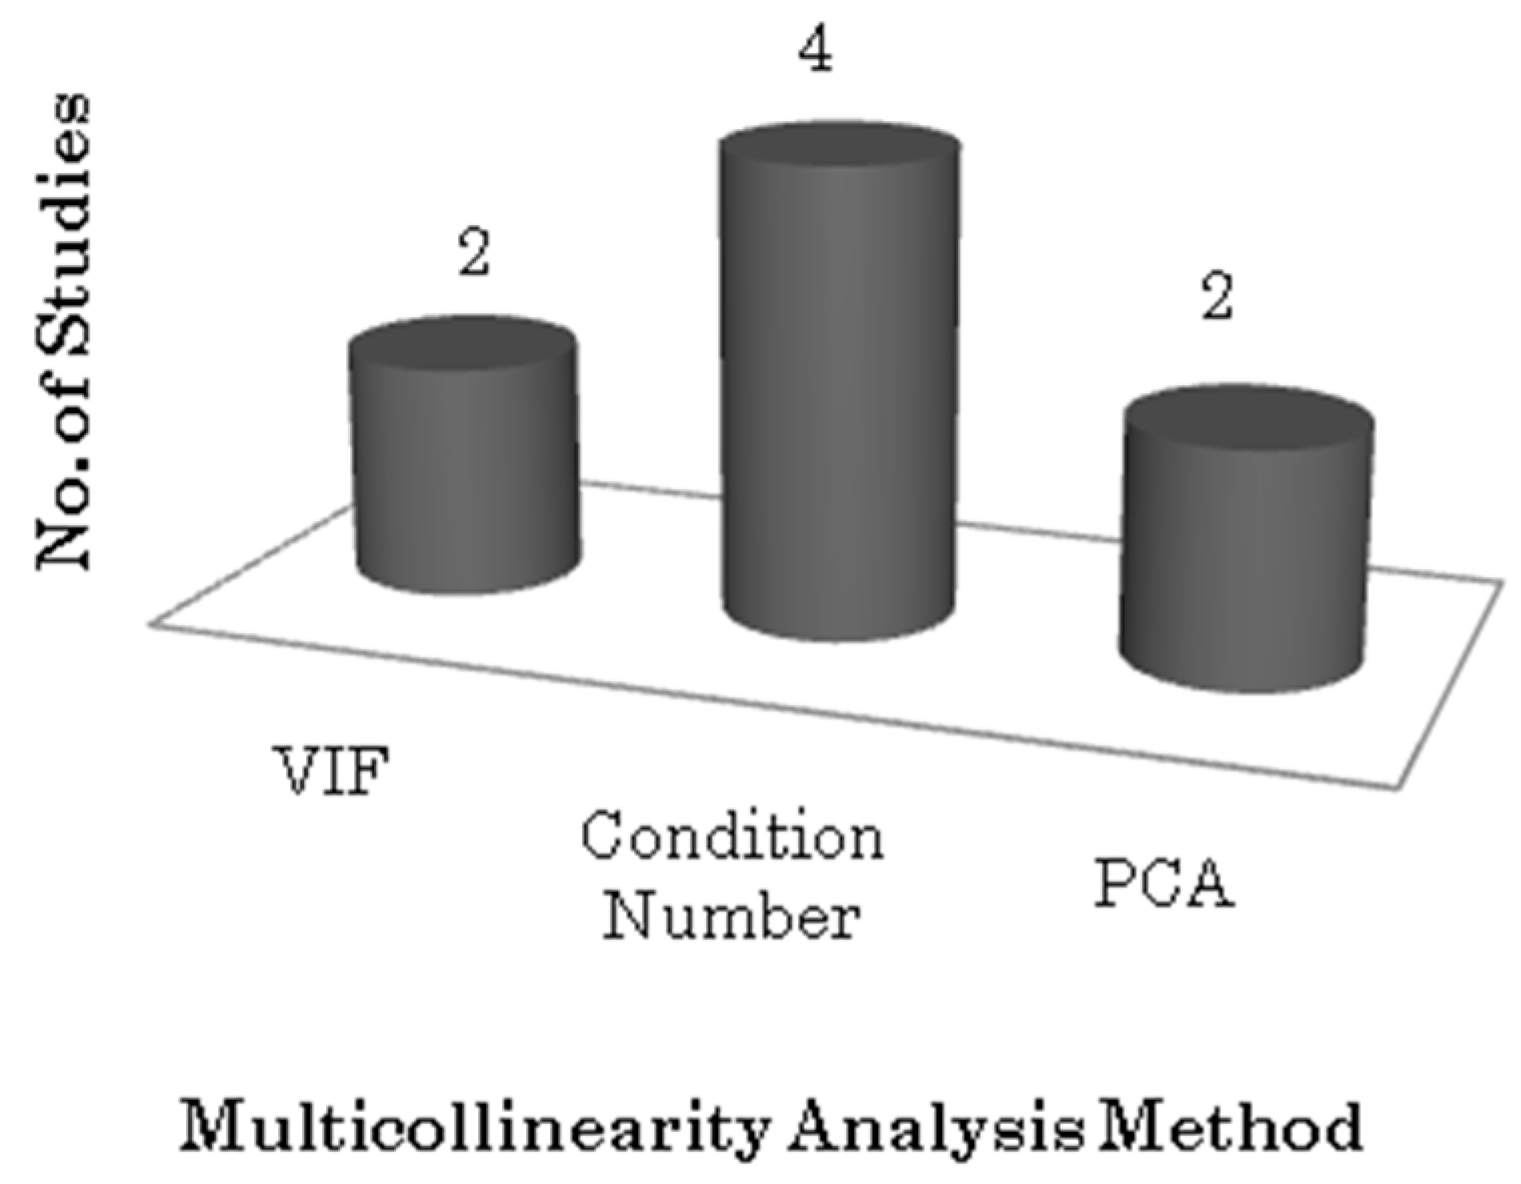
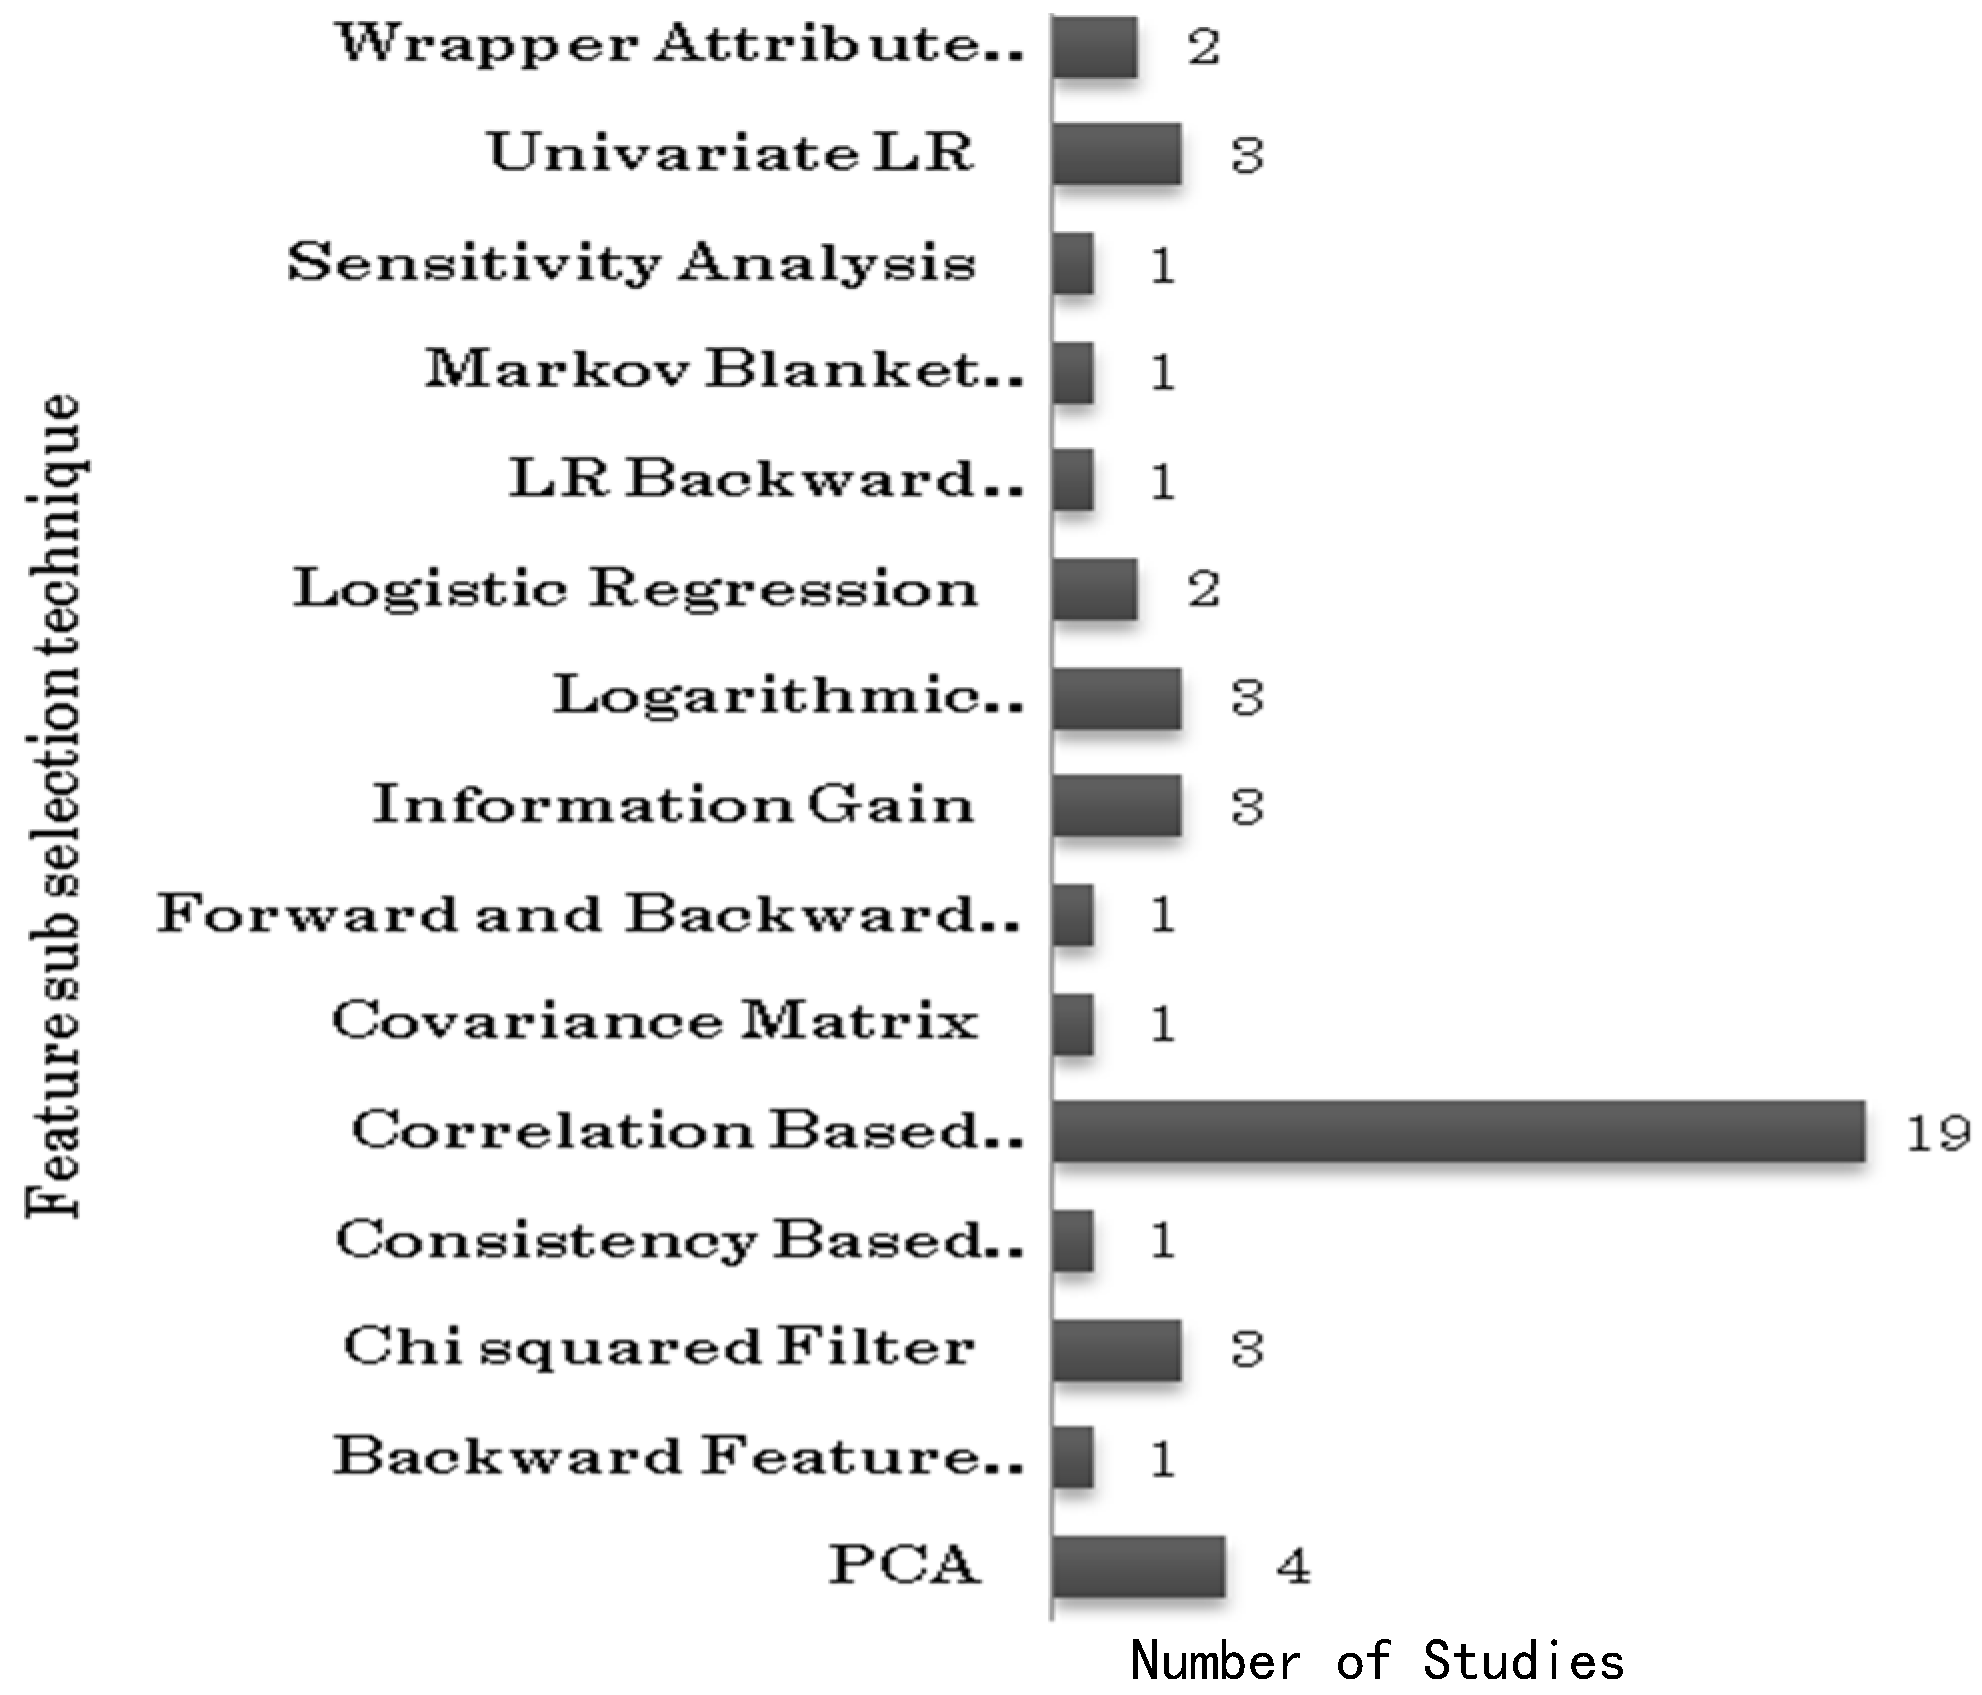
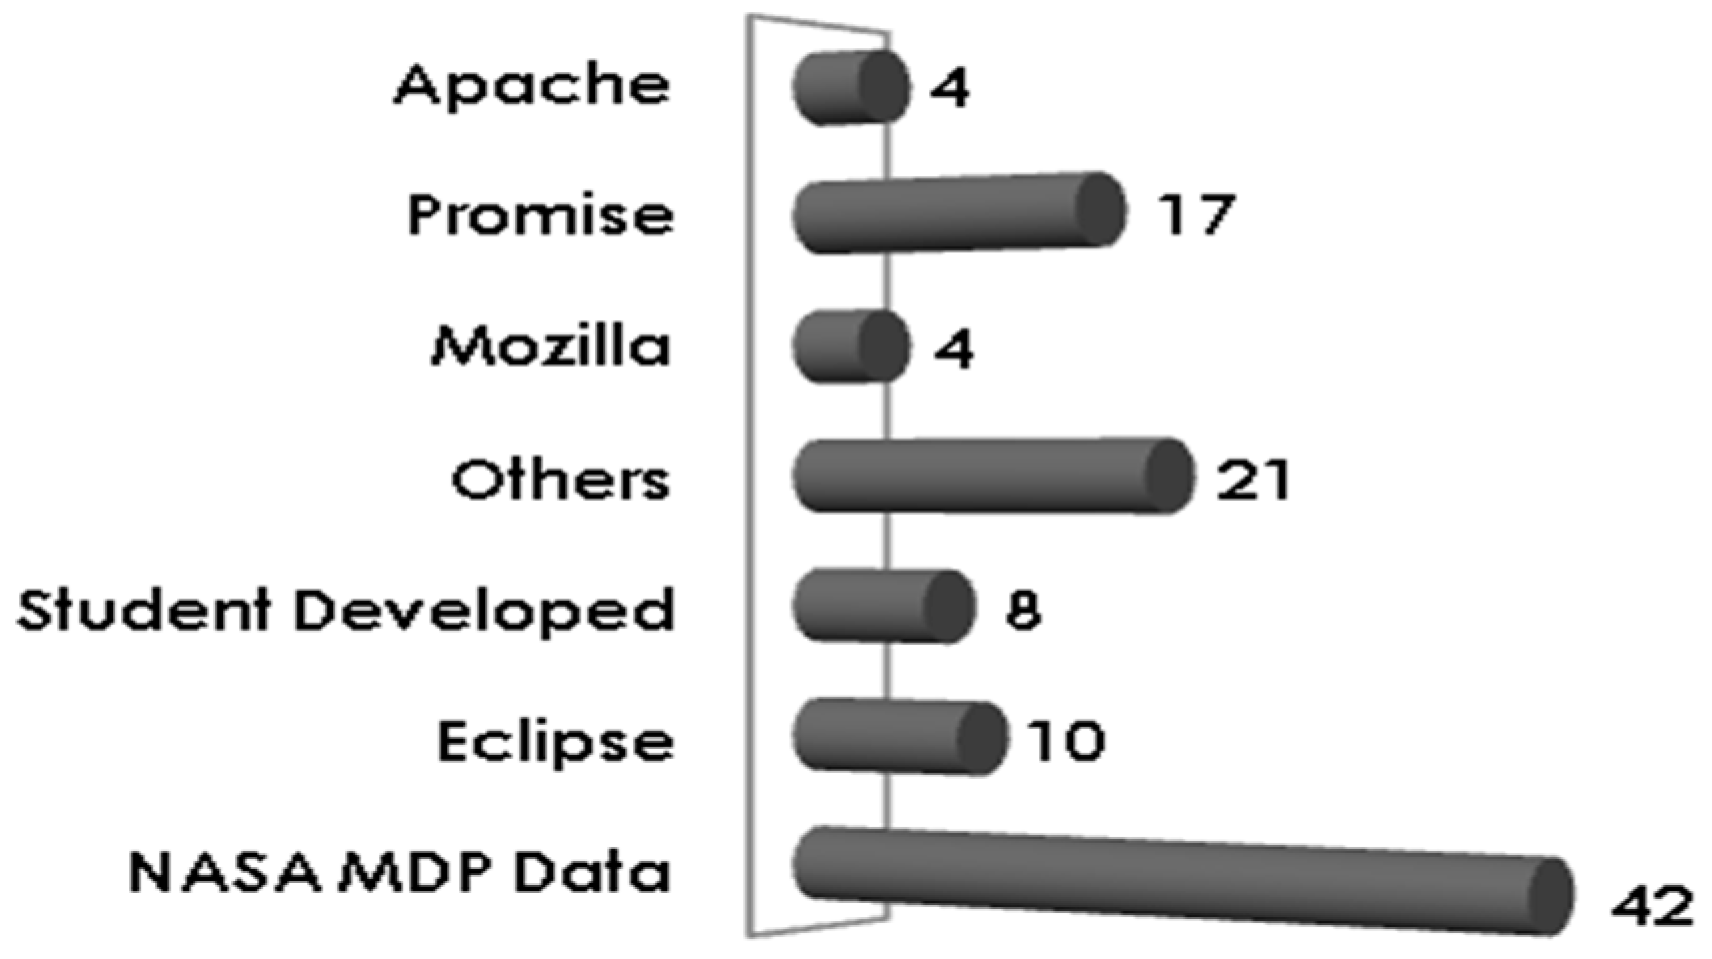
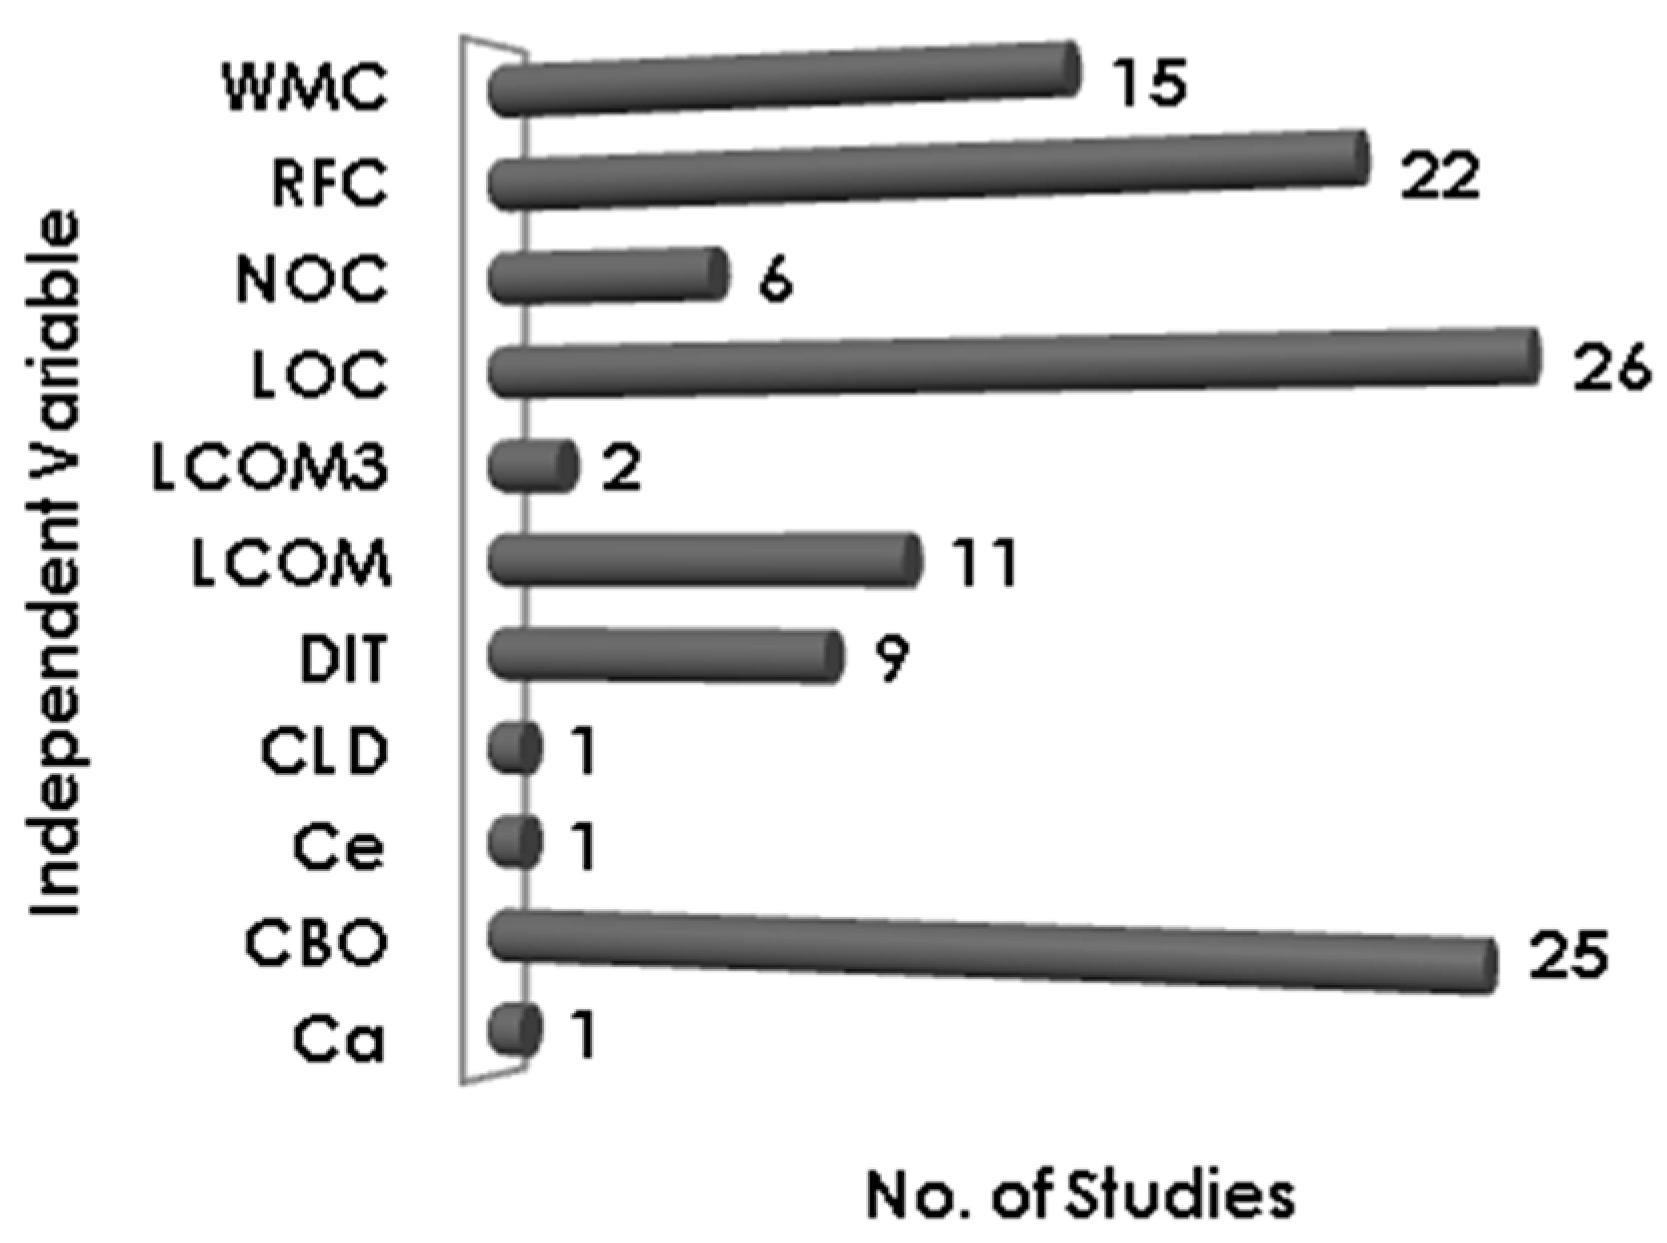
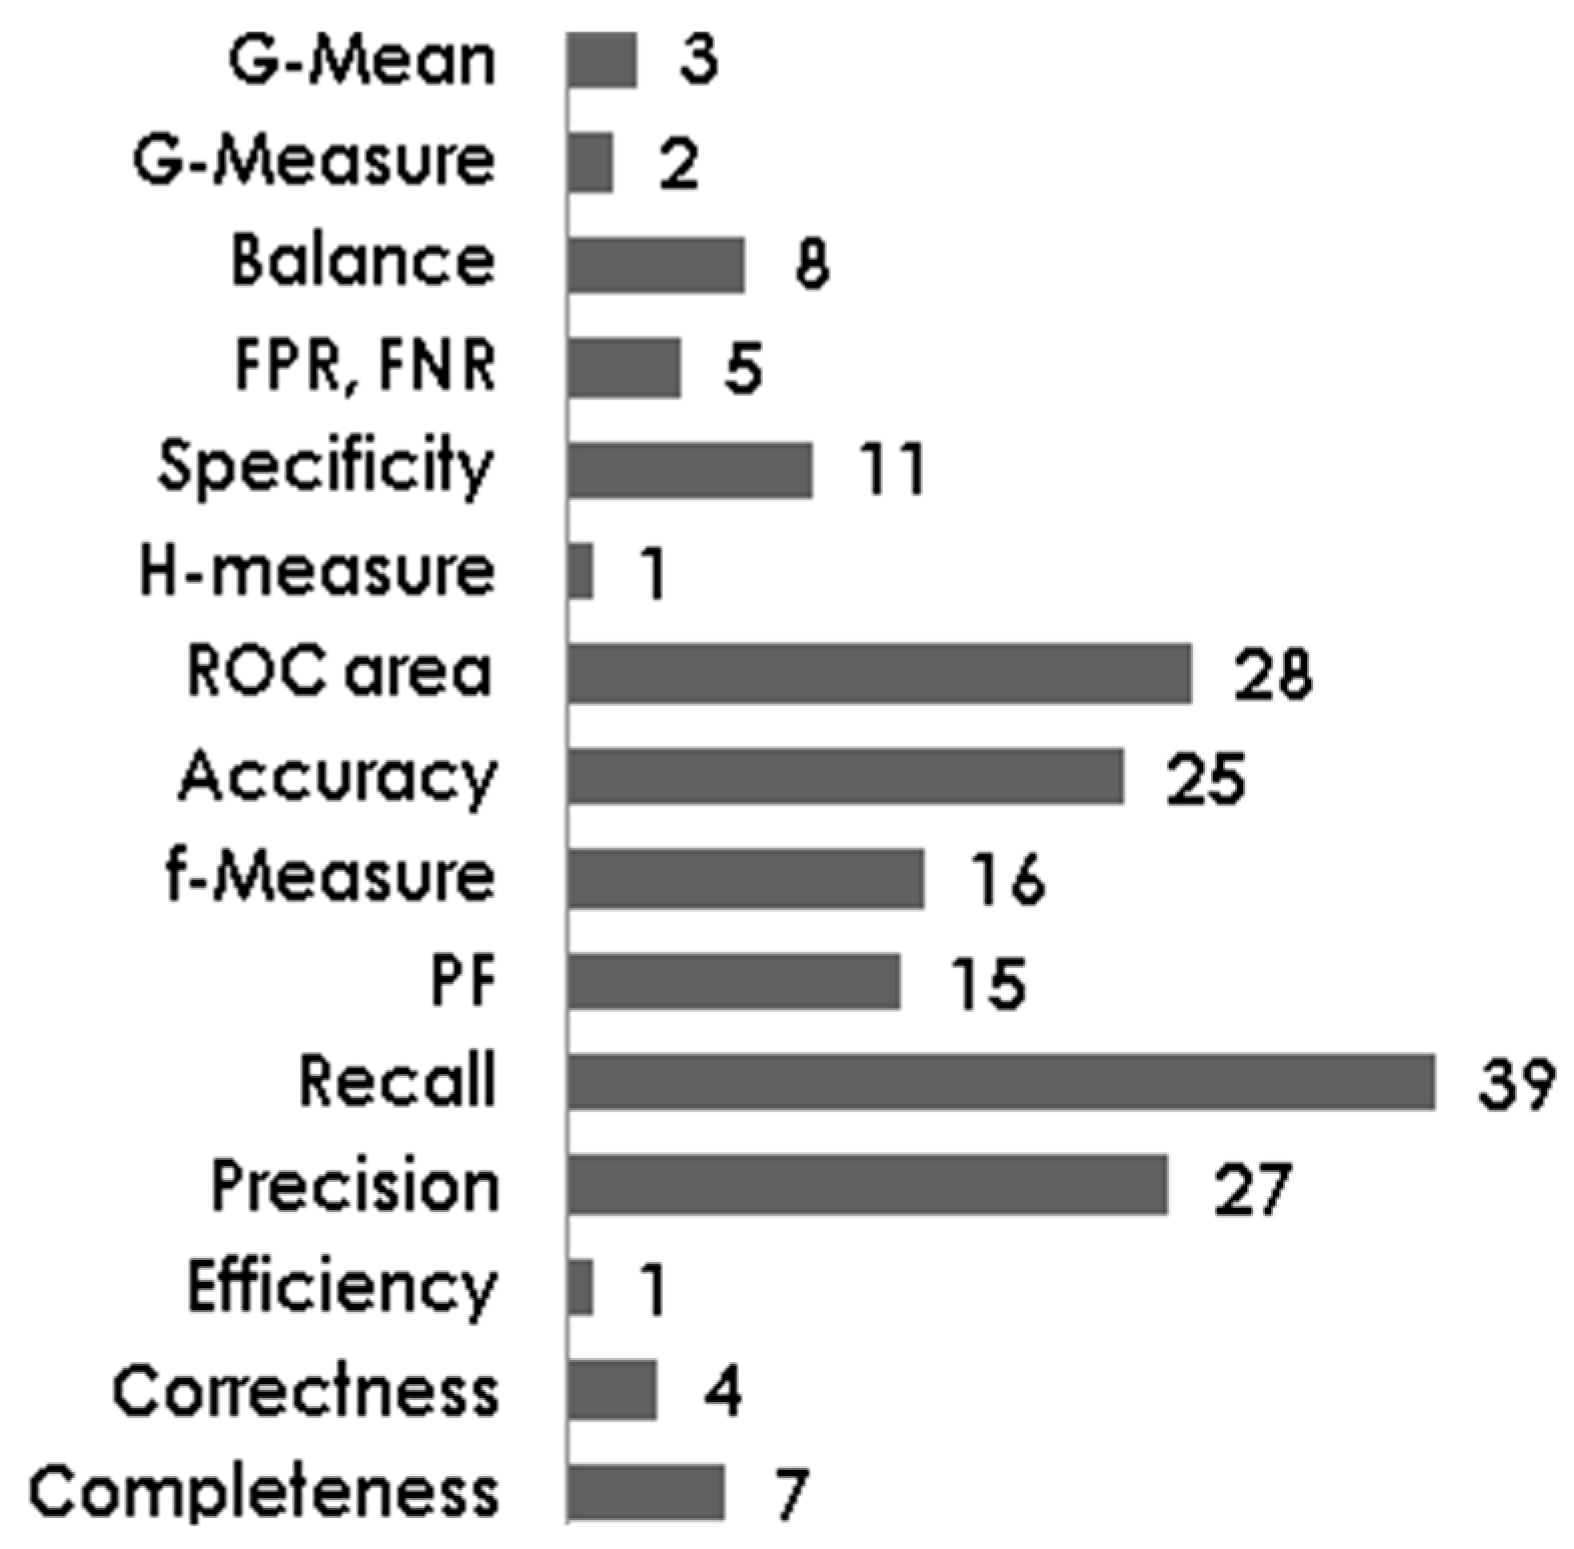
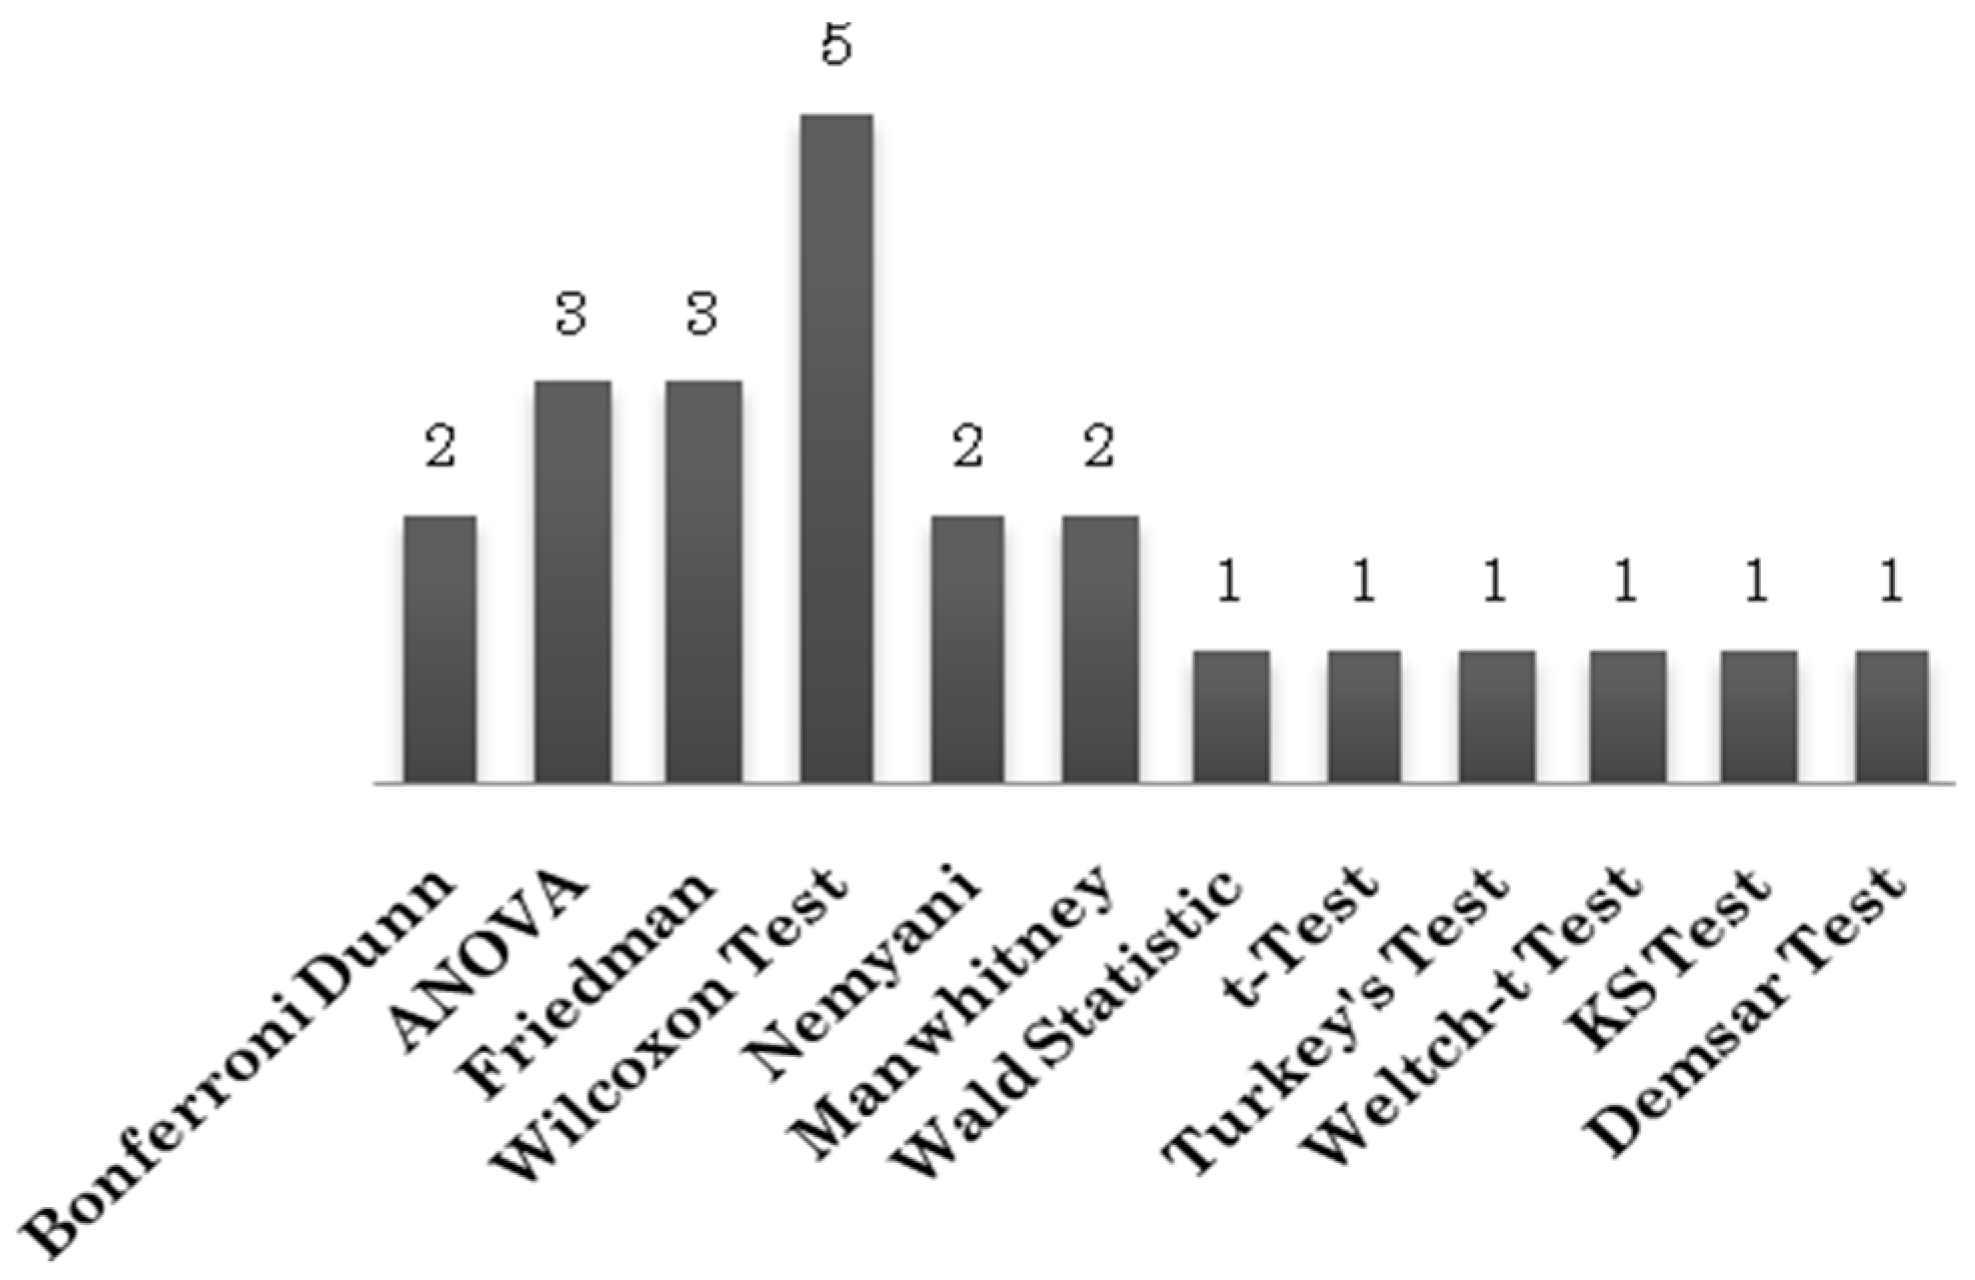
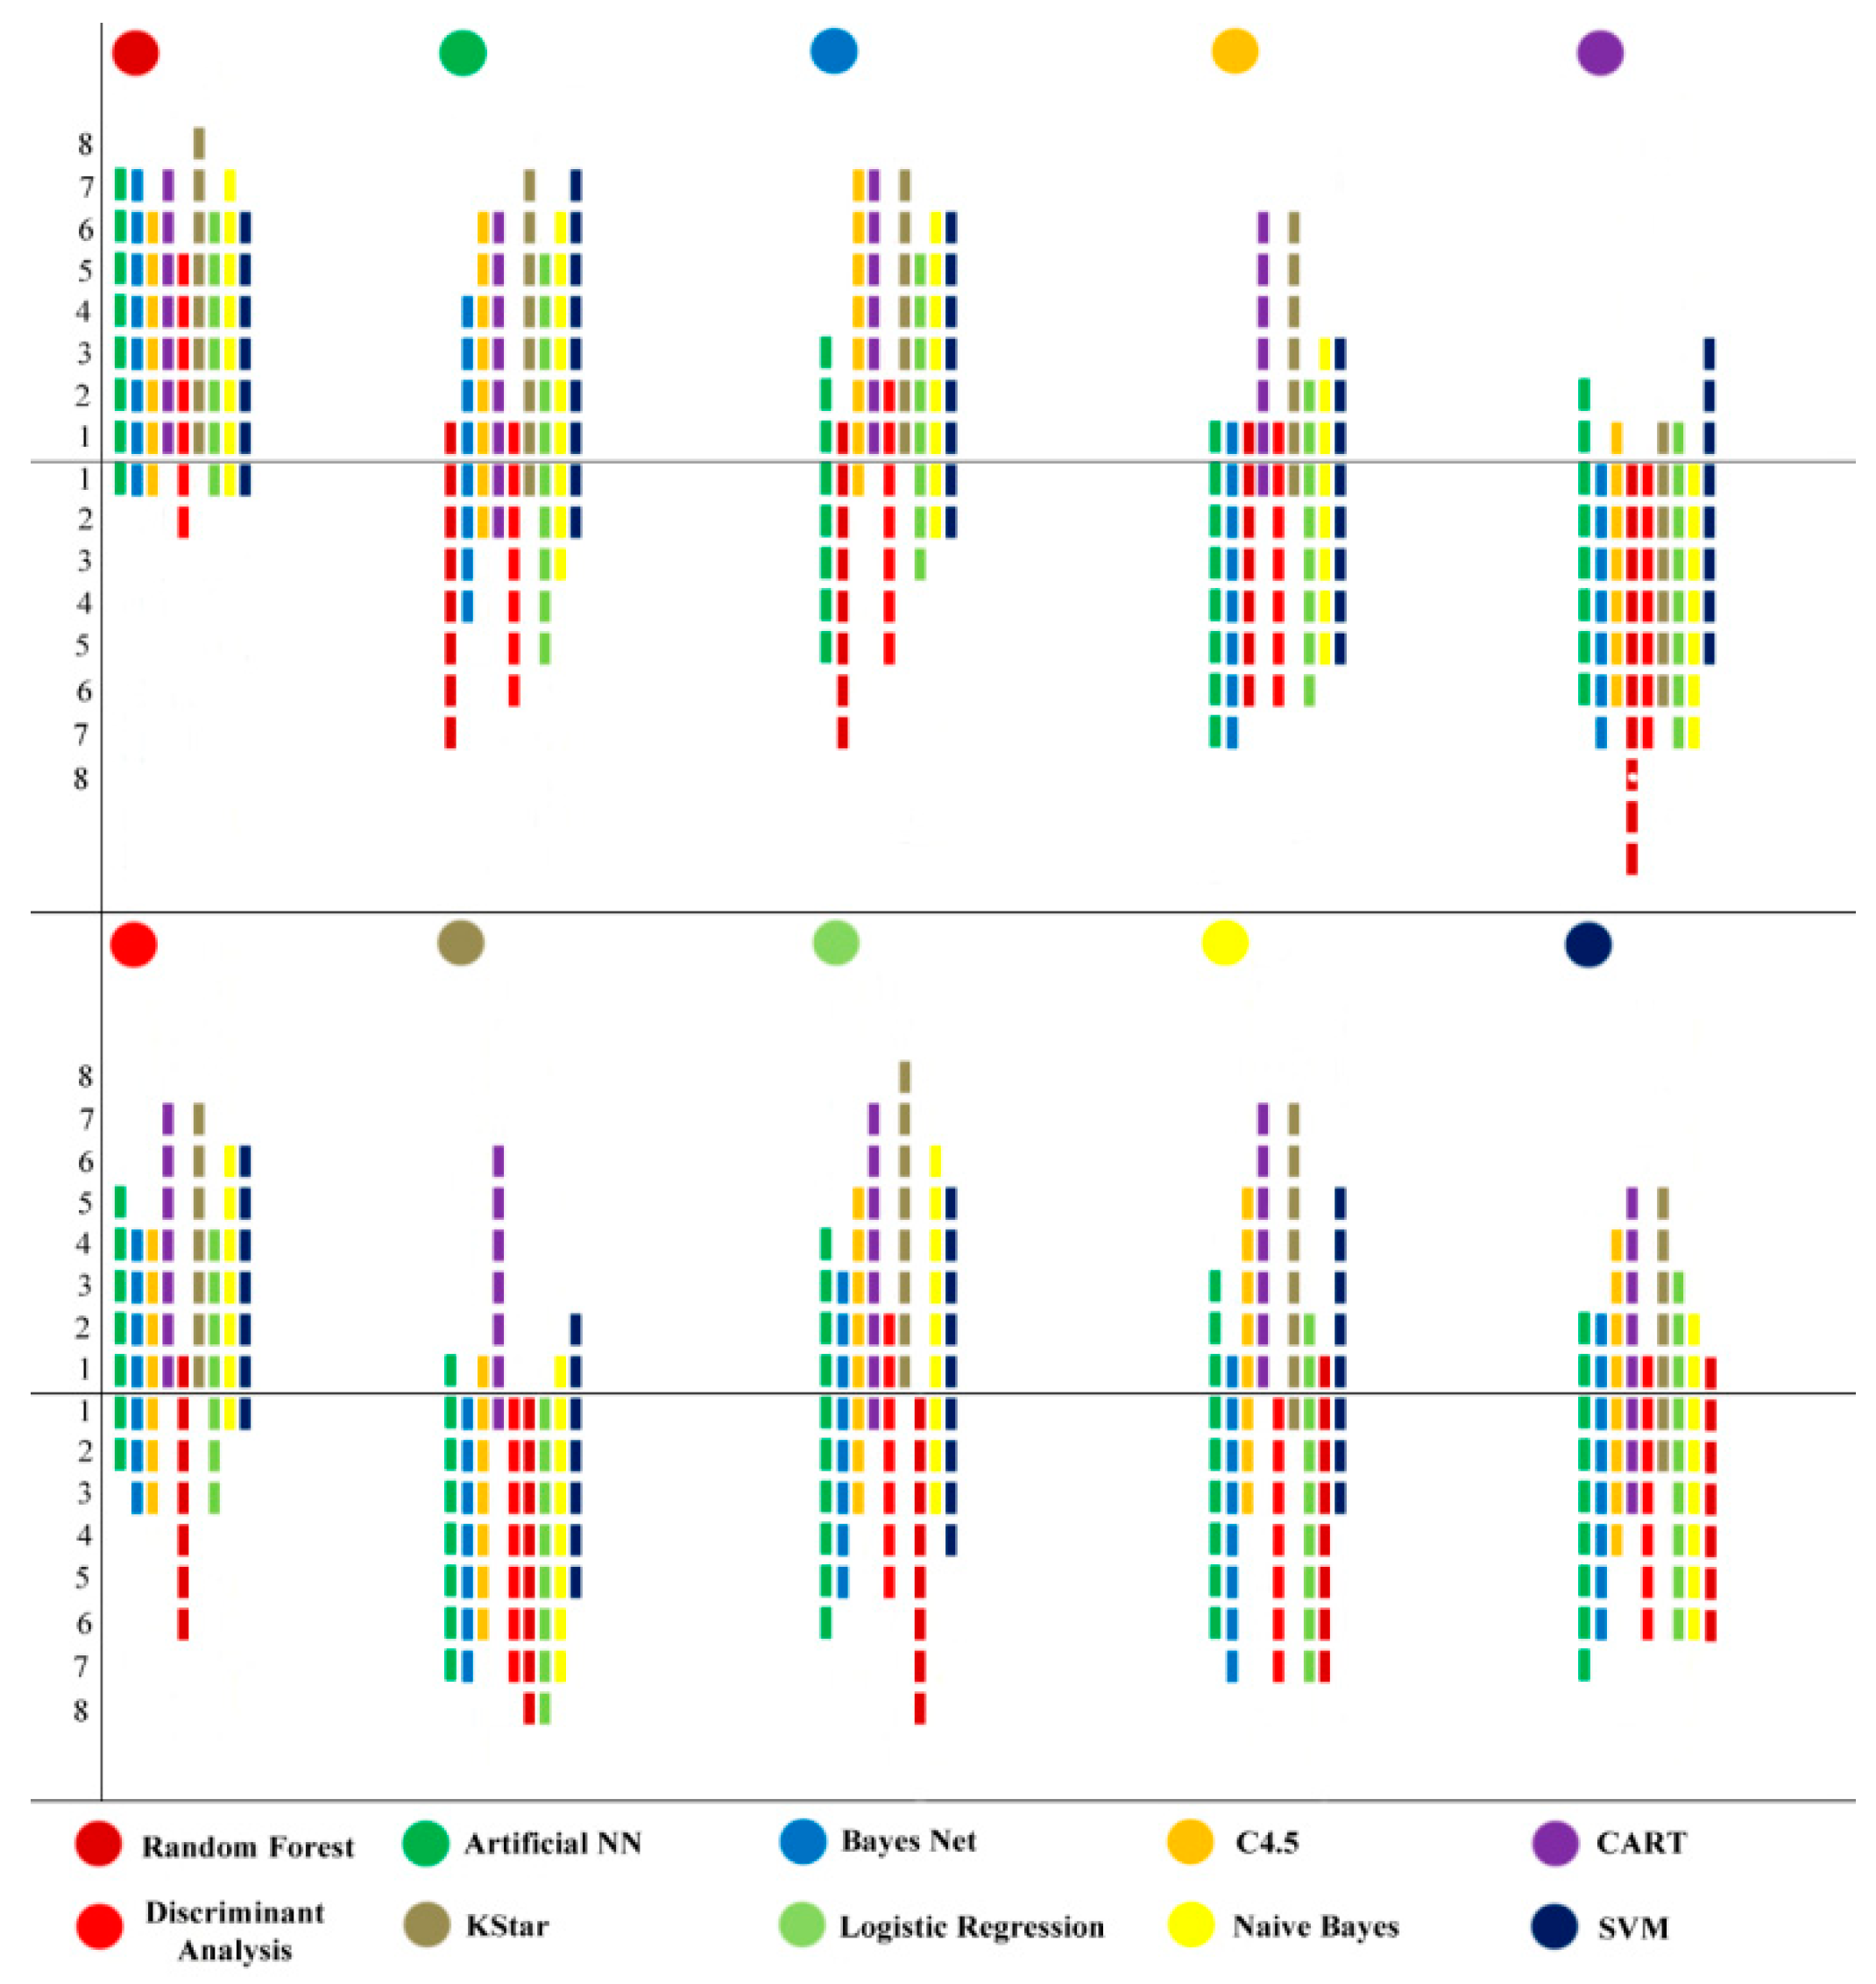