2. Materials and Methods
This is a comparison of two distinct cohorts. The first cohort comprised school children who have had a measurement of the shape of their back on a yearly basis from 2011 to 2017. The inclusion criteria were that there was neither scoliosis nor any other deformity of the torso. Exclusion criteria were any previous surgery to the torso or back to clinical examination. This was the non-scoliotic cohort.
The inclusion criteria for the scoliotic cohort were (1) adolescent idiopathic scoliosis, (2) no bracing undergone during treatment, (3) scoliosis treated by surgery, (4) Integrated Shape Imaging System 2 (ISIS2) back surface topography scans available pre- and post-surgery. The indication for surgery was a scoliosis in a patient that wished to pursue operative intervention for the curve, where the surgeon’s view was that surgery was appropriate. This scoliotic cohort contained all curve types who had been managed with operative intervention between 2008 and 2017 using posterior-based pedicle screw techniques (269 individuals; 93%) and anterior instrumentation and fusion (20 individuals; 7%). Posterior fusion was performed using current segmental pedicle screw fixation techniques following a standard posterior approach to the spine. Correction of scoliosis was obtained using the technique most suited to get the best outcome for the individual patient and included differential rod contouring, cantilever and derotation techniques. Anterior surgery in a smaller number of patients was performed through a 10th rib thoracoabdominal, transpleural and retroperitoneal approach to expose the spine, allowing excision of the intervertebral discs and endplates back to the posterior longitudinal ligament. The instrumentation was performed using a two-screw-per-level dual rod construct over the convexity of the deformity. In posterior fusion in the main thoracic group, the levels chosen depend on each individual curve morphology and flexibility; however, in the main, the proximal level of instrumentation and fusion was T3 or T4, and the distal level was L2 or L3. For the anterior fusions performed for some of the main thoracolumbar curves, the proximal level was T11, and the distal was L3. To prevent error from mixing right and left convex curves in the scoliosis cohort, only right thoracic and left thoracolumbar curves were analysed.
In both cohorts, the surface topography of the posterior torso was captured using ISIS2 [
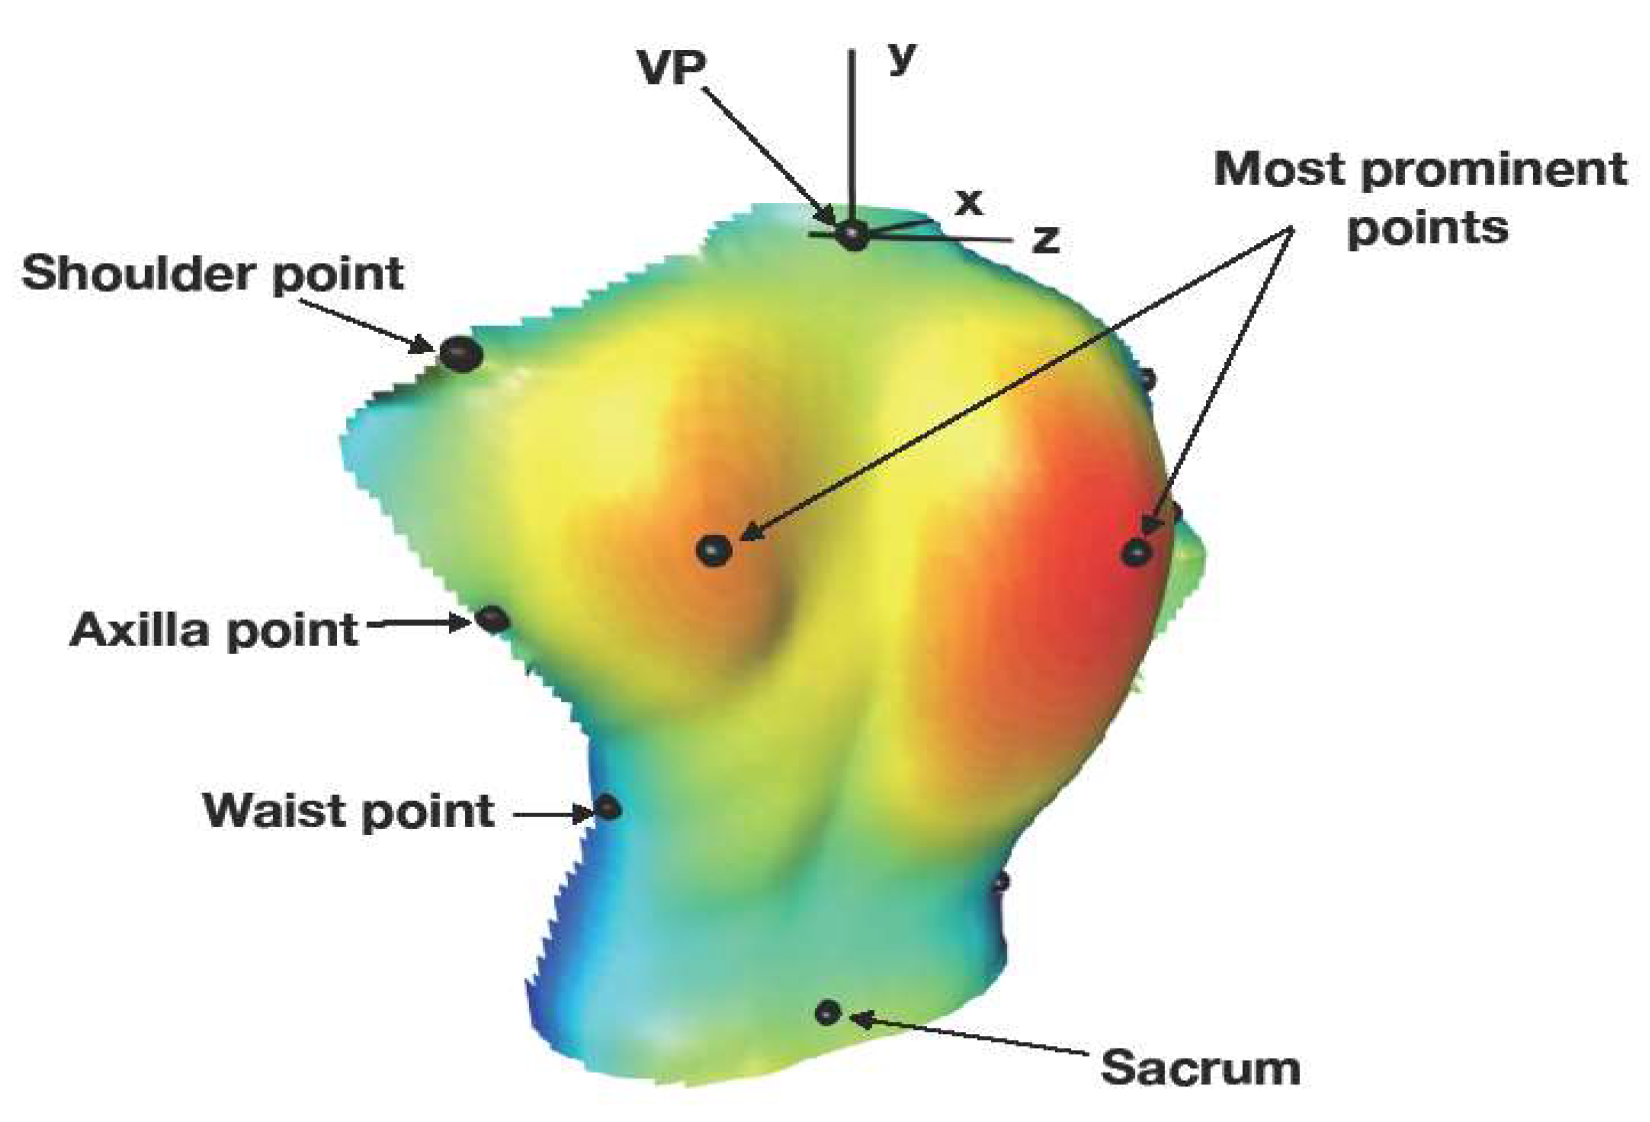
7]. All of the captured images were then reanalysed using a custom computer interface to identify pre-defined points around the edge of the torso marking the shoulders, the axillae and the waist (
Figure 1 and
Table 1). When combined with the most superior and inferior ends of the spine (the vertebra prominens (VP) and the sacrum) and with the most prominent points over the left and right scapular areas of the back (all automatically generated by ISIS2) (
Figure 1), there were 10 landmarks for analysis. These points are also defined in
Table 1. For definition, the
x-axis lies in the coronal plane, running horizontally from left to right. The
y-axis runs vertically from inferior to superior. The
z-axis lies in the sagittal plane and is perpendicular to the
x- and
y-axis. The
z-values thus represent the perpendicular distance of a point on the back from the coronal plane (positive towards the observer). The origin of the axes is at the vertebra prominens in all raw data sets.
As had been previously discovered from these data sets, there were two obvious patterns to the data [
4,
5]. Thus, prior to analysis, both the non-scoliotic and scoliotic cohorts were subdivided into a main thoracic curve pattern and a main thoracolumbar curve pattern (defined by the location of the largest curve) [
8]. The size and location of the apex of the scoliosis was measured using the ISIS2 parameter lateral asymmetry (LA), which gives a measure of curve size similar to Cobb angle in the non-scoliotic cohort. This was used rather than radiographs as, due to the risks of radiation [
9], it was not ethical to expose the non-scoliotic cohort to ionising radiation. The scoliotic cohort was measured using both LA and the Cobb angle [
10] from pre and post-operative radiographs.
Procrustes analysis of both the non-scoliotic and scoliotic cohorts was performed using the techniques described by Dryden and Mardia [
6] using the ‘R shapes’ package [
11]. Using the predefined landmarks, Procrustes analysis was used to remove the rotation, scale and location effects from a set of shapes so that 3D comparison can be carried out. Generalised Procrustes analysis (GPA) initially translates all the shapes to be analysed to a common centroid and then works out the scaling and rotation matrix needed to achieve a least-squares-defined best fit among all the landmark shape data under analysis. The GPA results in a mean shape which gives the mean locations of the translated, scaled and rotated landmarks. A scatter plot of the scaled and rotated landmarks shows the variability in the data around the mean shape. Principal component analysis (PCA) was then performed on the scaled and rotated landmark data to demonstrate the axes of most variability for each landmark. The three axes shown are not necessarily orthogonal but rather represent the vectors of maximum variability in position (otherwise known as the eigenvectors).
Using the mean shape for both the non-scoliotic and scoliotic cohorts, an ordinary Procrustes analysis (OPA) was performed. This allows a comparison of shape for the non-scoliotic and scoliotic cohorts and the pre-operative and post-operative cohorts. OPA differs from GPA as OPA is used to compare only two data sets rather than multiple data sets which are required for comparisons of the mean shape of the non-scoliotic, the pre-operative and the post-operative scoliotic cohorts. Three methods of testing the statistical significance of the differences between the non-scoliotic, pre-operative and post-operative mean shapes were used, namely Hotelling’s T test [
12], Goodall’s F test [
13] and James’s test [
14]. Significance was defined as
p < 0.05. This analysis was used to examine the differences in shape between the sexes in the non-scoliotic cohort and the differences in shape between the cohorts independent of sex. The statistical and graphical analyses were performed using R [
15]. A definition of clinical significance was made following the work of Akel et al. [
16].
Ethical approval for this study was given by the NRES committee West Midlands—South Birmingham (11/H1207/10) and the NRES committee East Midlands—Northampton (15/EM/0283).
3. Results
The non-scoliotic children were measured on a yearly basis, giving a total of 831 individual images for analysis comprising 479 in the main thoracic group, 307 in the main thoracolumbar group and 45 with no scoliosis. The cohort comprised 117 males and 79 females with a range of ages at the time of measurement of 9.2 to 17.3 years (
Table 2).
The scoliotic gcohort comprised 39 males and 250 females with a mean age of 13.9 years (SD 1.56 years, range 9.9 to 17.9 years) at the time of the pre-operative scan. This gave a total of 289 paired pre-operative and post-operative images for review. The pre-operative major curve, measured using the Cobb angle [
10], was mean 66° (SD 17°, range 32° to 133°) for the main thoracic curve and mean 60° (SD 16°, range 40° to 99°) for the main thoracolumbar curve. Post-operative values were mean 28° (SD 12°, range 12° to 88°) for the main thoracic curve and mean 23° (SD 12°, range 8° to 50°) for the main thoracolumbar curve. Following the Lenke classification [
8], there were 257 Lenke 1 curves, 2 Lenke 2 curves and 30 Lenke 5 curves. Body mass index was calculated for the non-scoliotic cohort, and it was mean 20.0 kg/m
2 (SD 3.2, range 13.5 to 31.6) for males and mean 19.7 kg/m
2 (SD 2.9, range 14.0 to 33.1) for females. In the pre-operative cohort, males had a mean BMI of 20.3 kg/m
2 (SD 4.2, range 15.6 to 30.3), and females had a mean BMI of 20.7 kg/m
2 (SD 4.2, range 14.1 to 41.9). There were 248 individuals in the main thoracic group and 41 in the main thoracolumbar group (
Table 3). The mean time from the pre-operative scan to surgery was 413 days (SD 304, range 1 to 2057), and the mean time from surgery to the post-operative scan was 263 days (SD 270, range 34 to 1984).
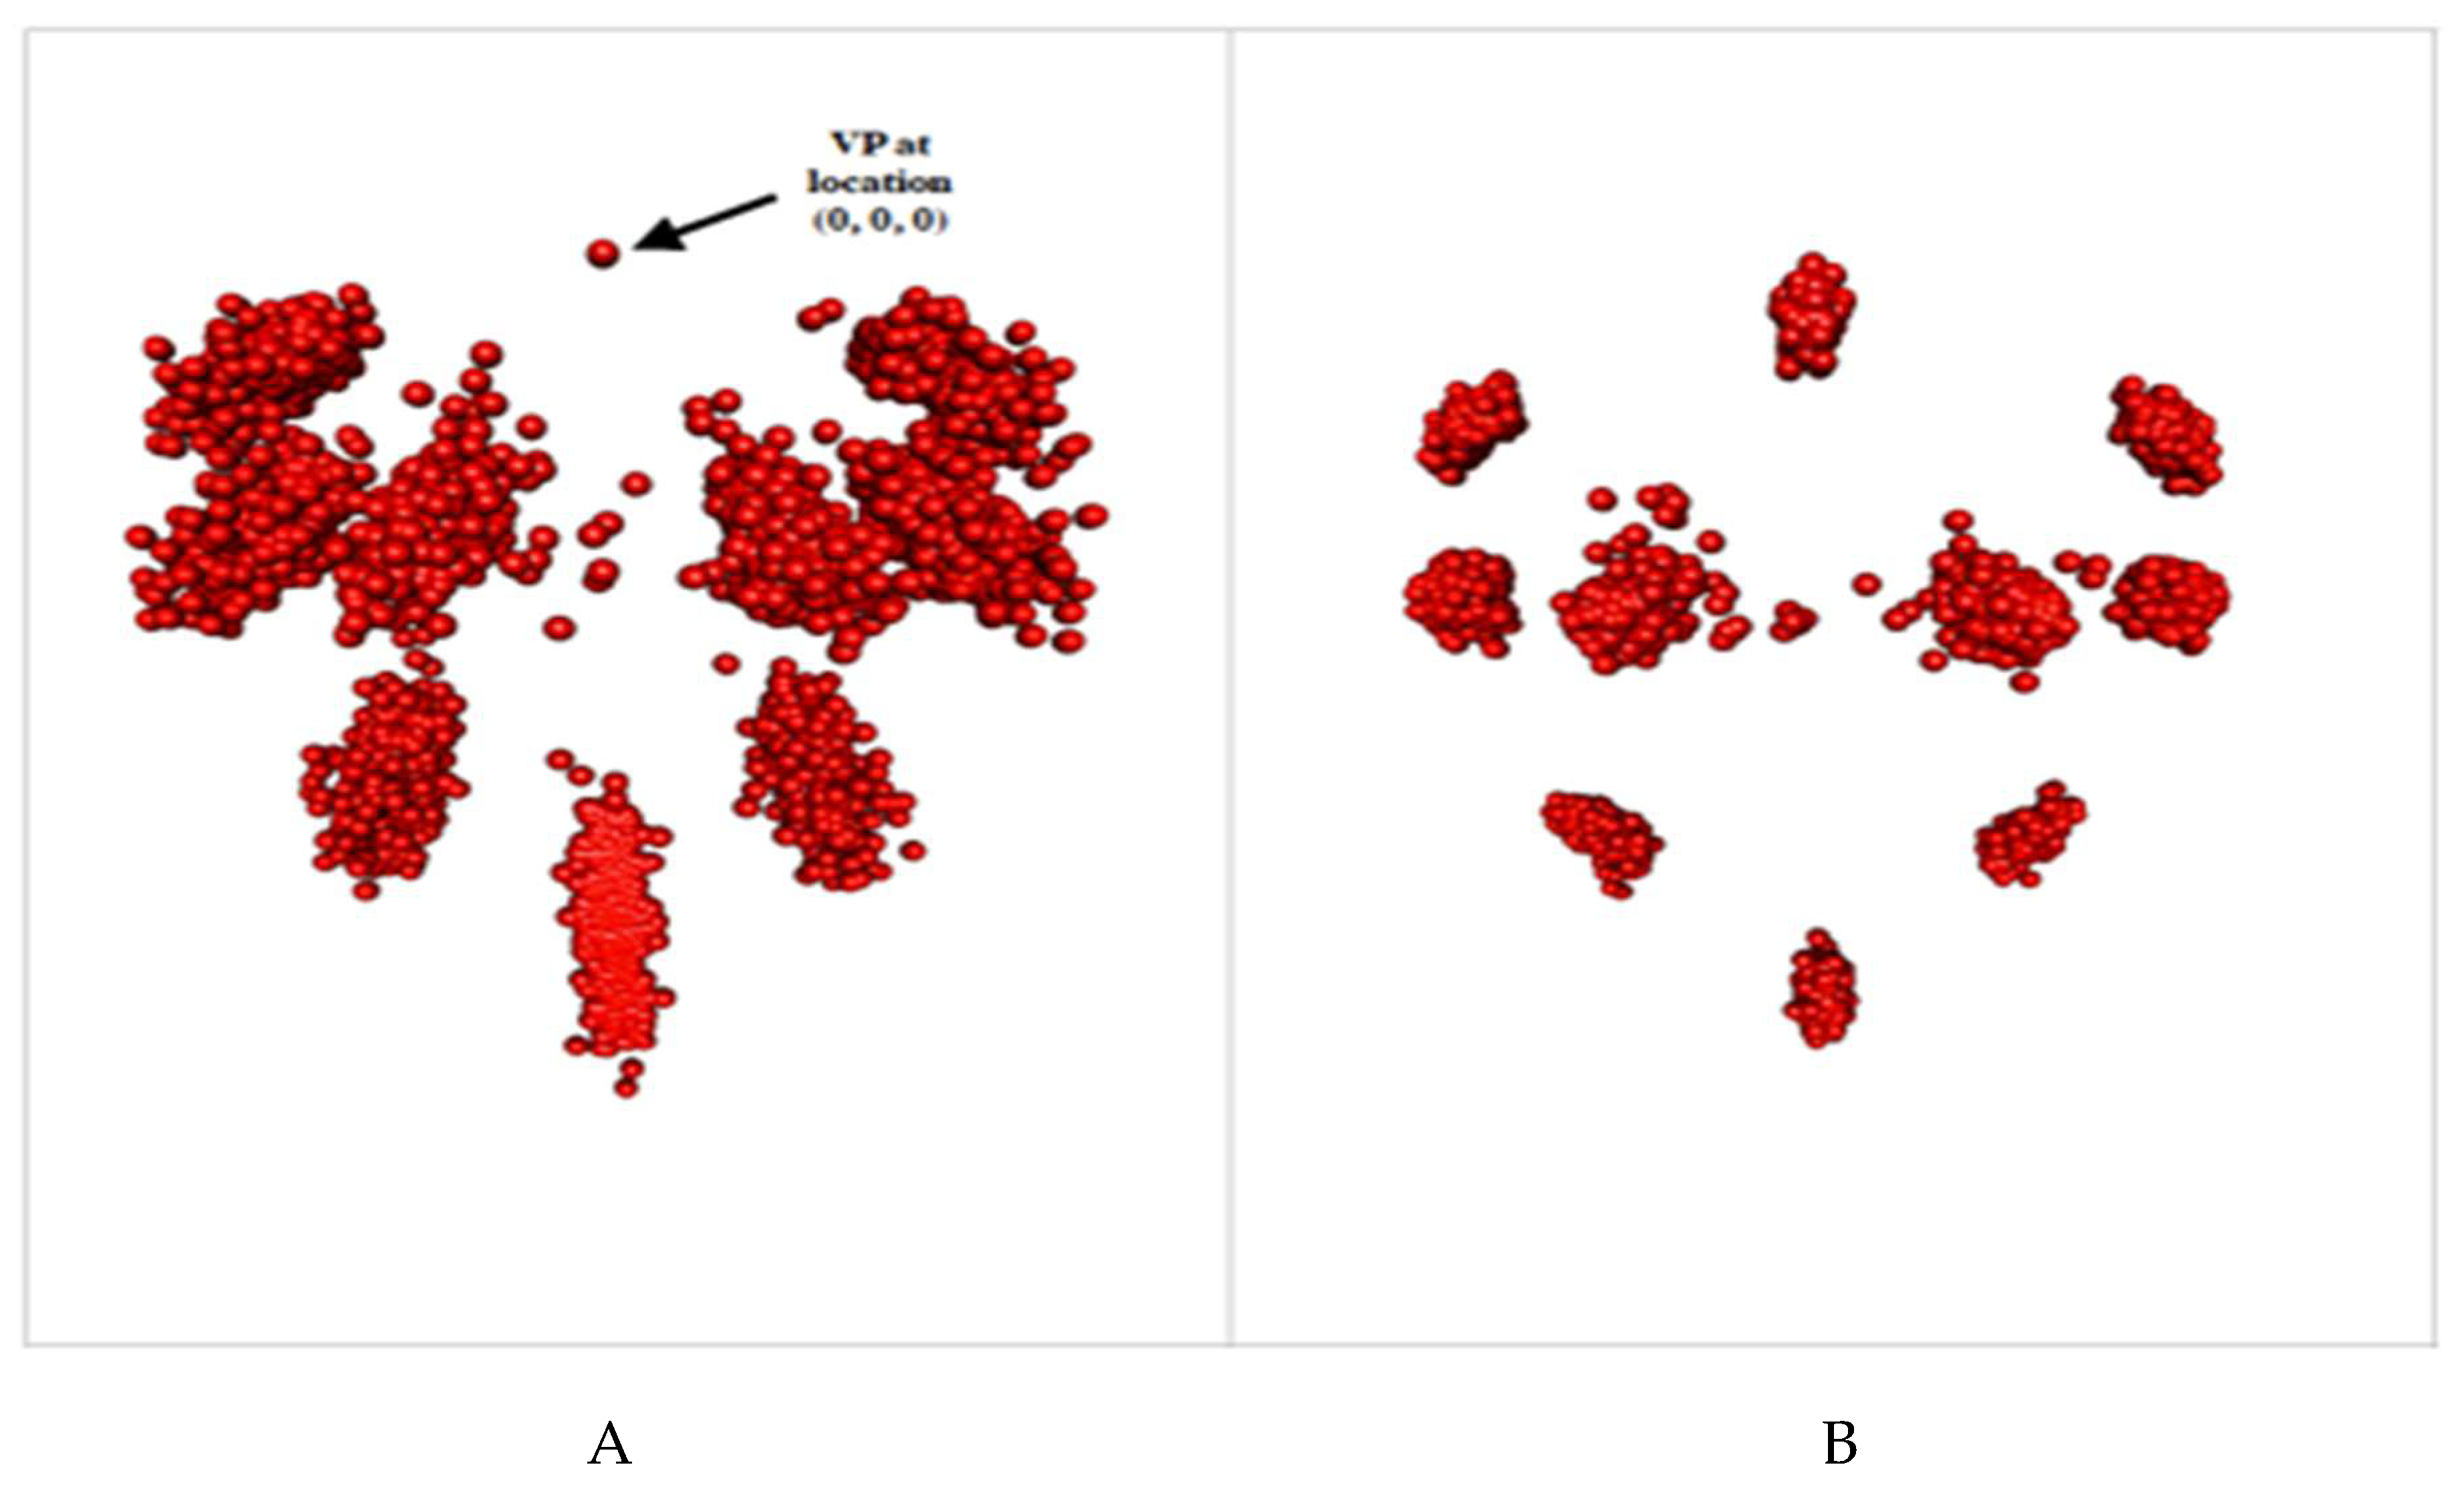
The raw landmark data and the scaled and rotated results after GPA were plotted for the two patterns of scoliosis already described (main thoracic and main thoracolumbar) for the non-scoliotic, the pre-operative and the post-operative cohorts. An example of these plots is shown in
Figure 2A (raw data) and
Figure 2B (translated, scaled and rotated data) for the main thoracic group of the non-scoliotic cohort.
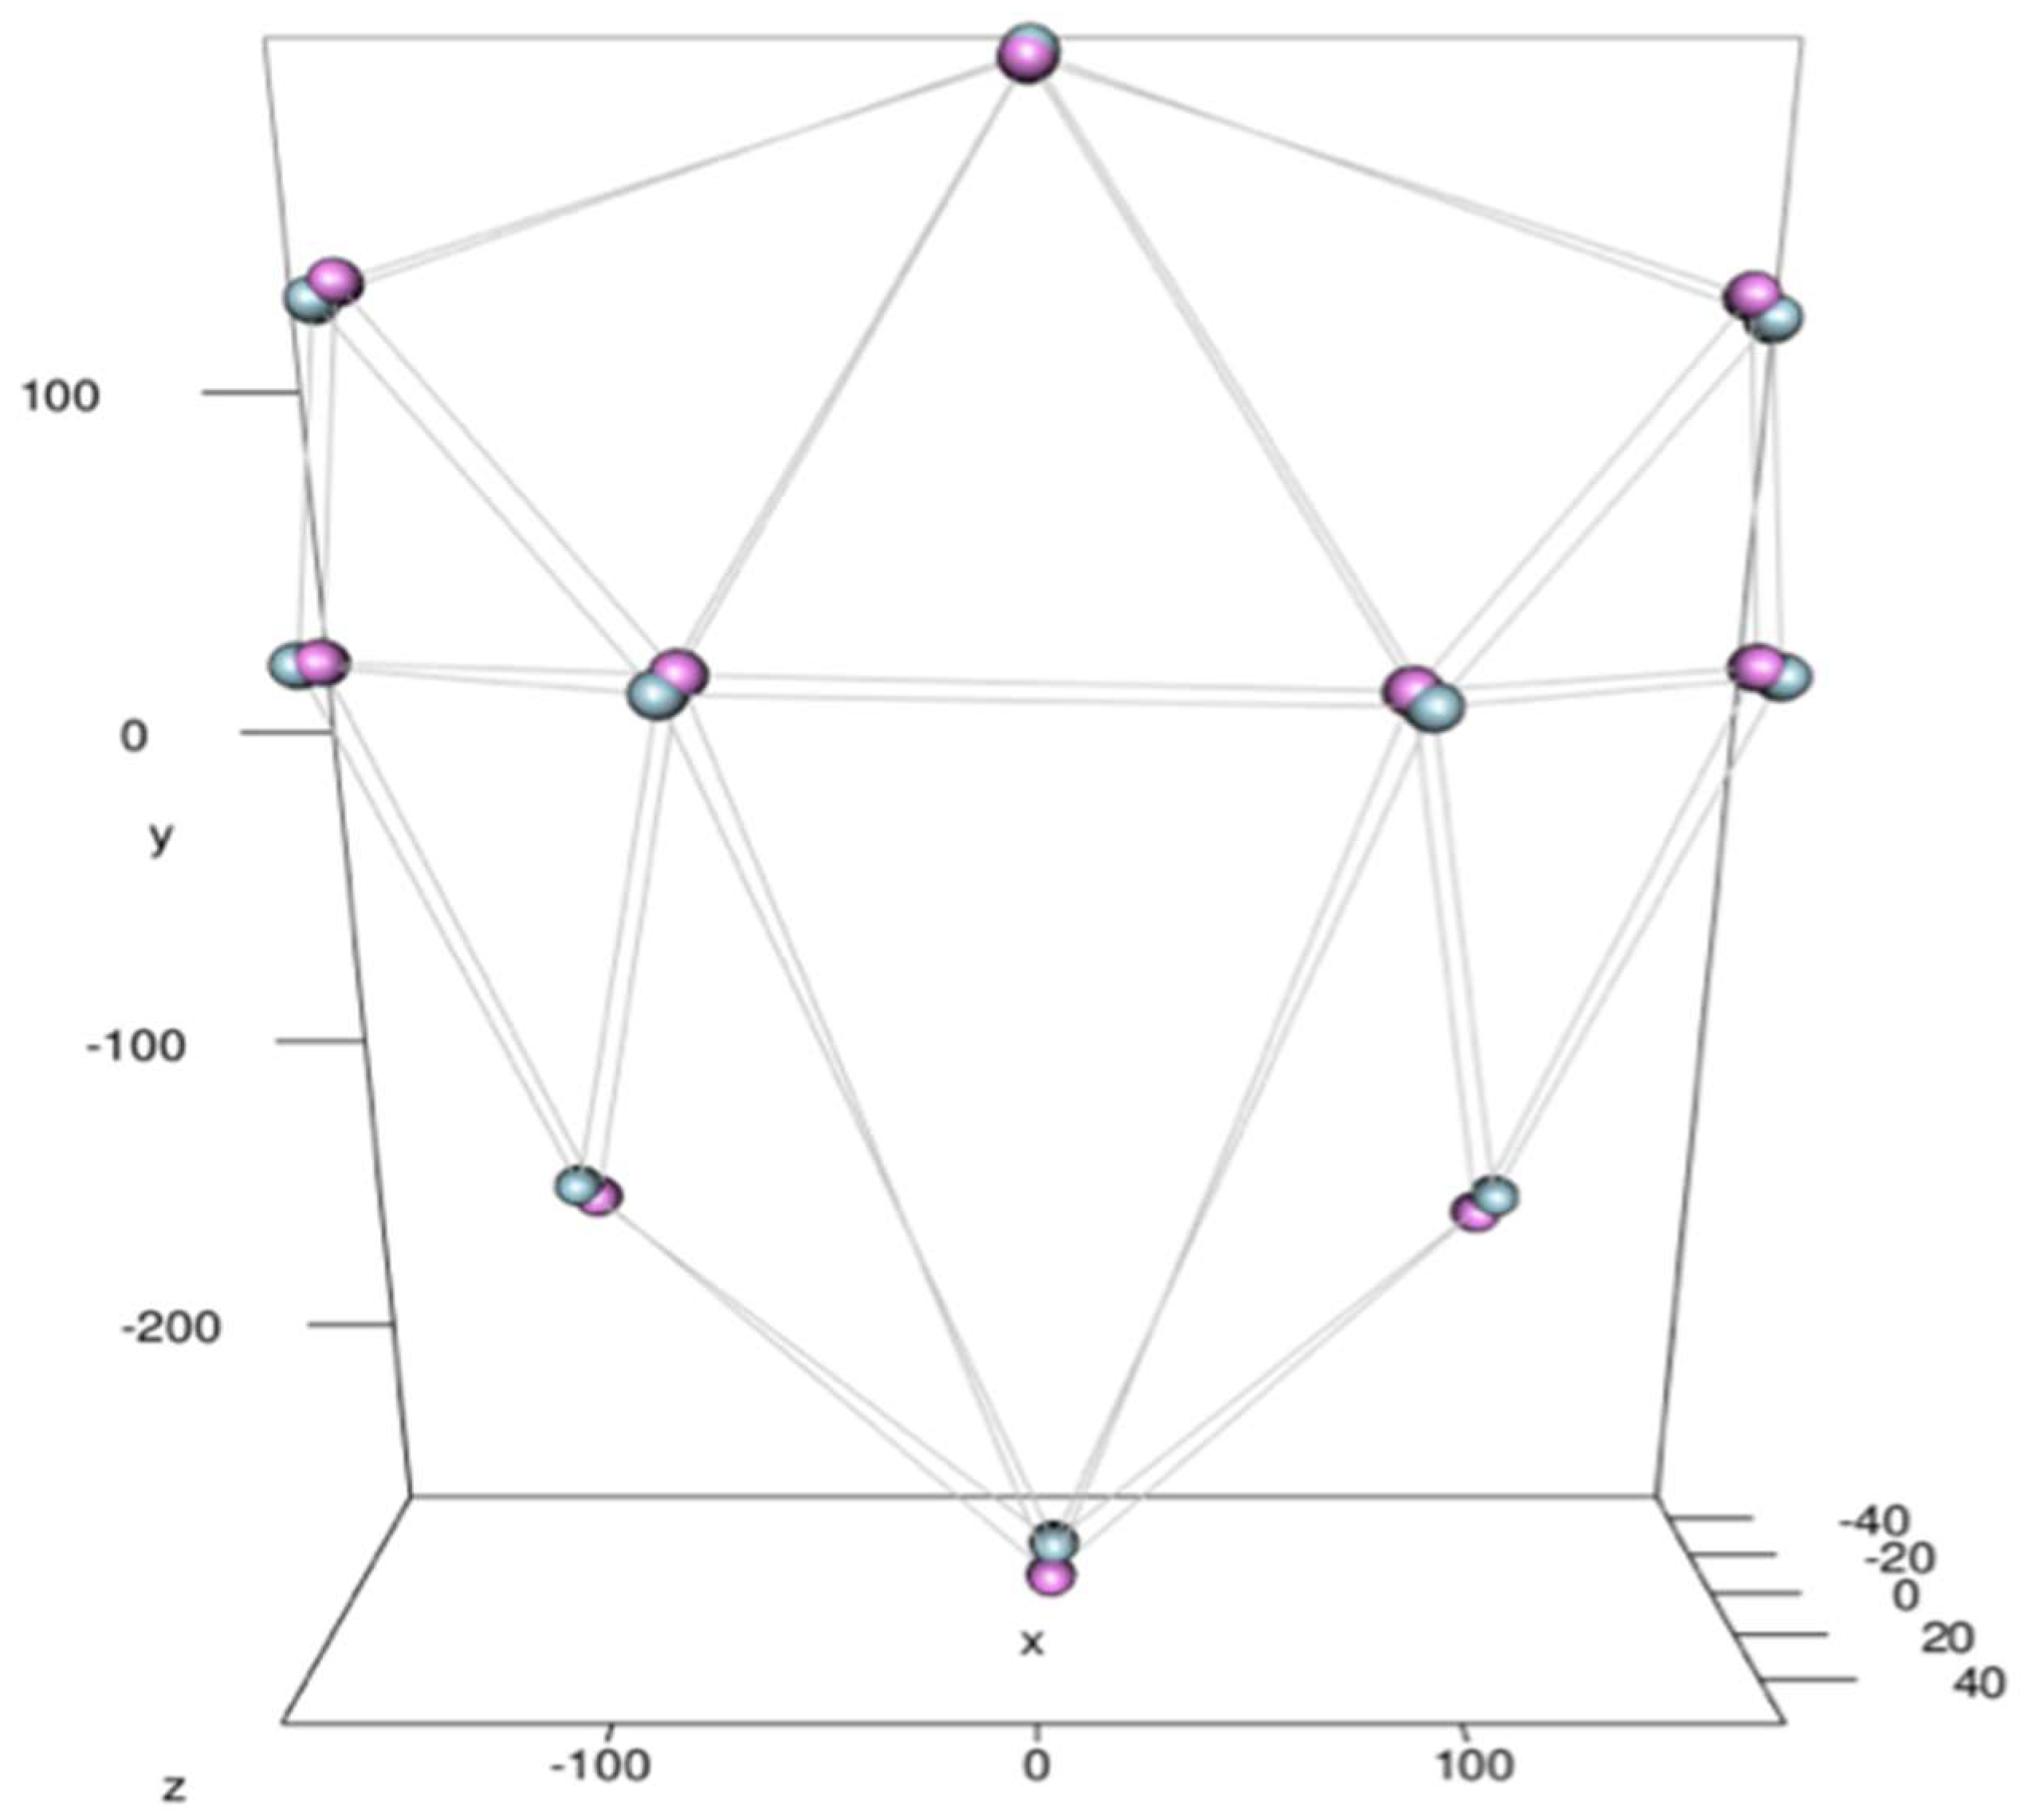
The results of the OPA for the non-scoliotic cohort demonstrating the difference in mean shape between males and females is shown in
Figure 3.
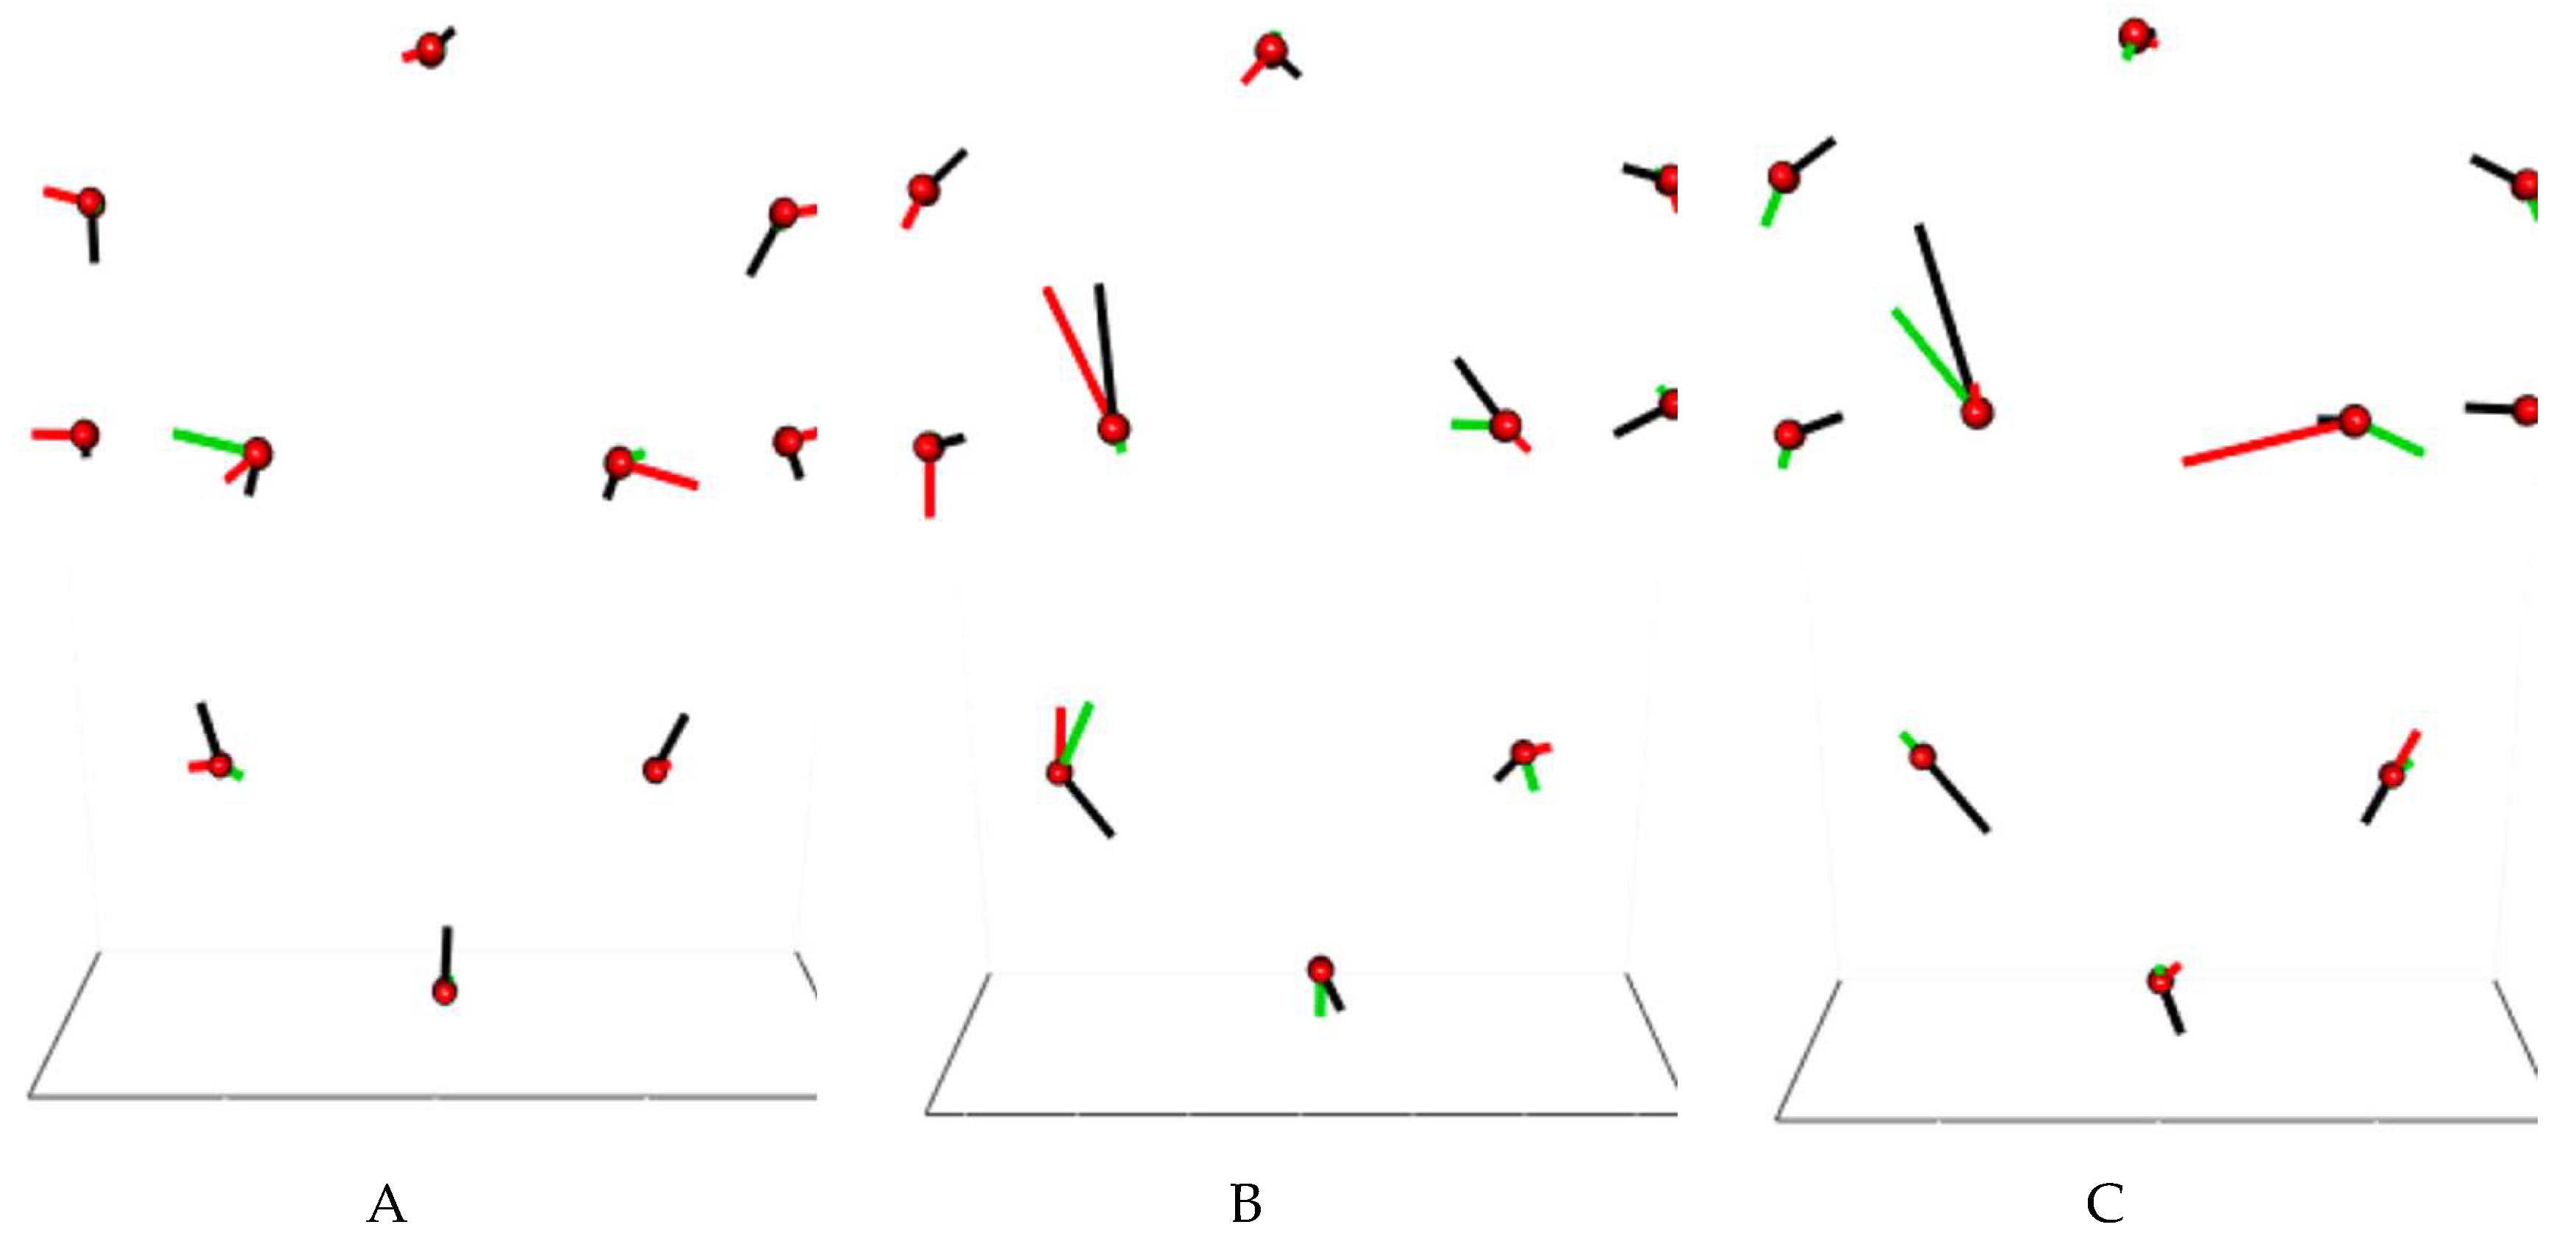
Plots of the mean shapes with PCA vectors are shown for all of the cohorts for the main thoracic curves (
Figure 4A–C) and the thoracolumbar curves (
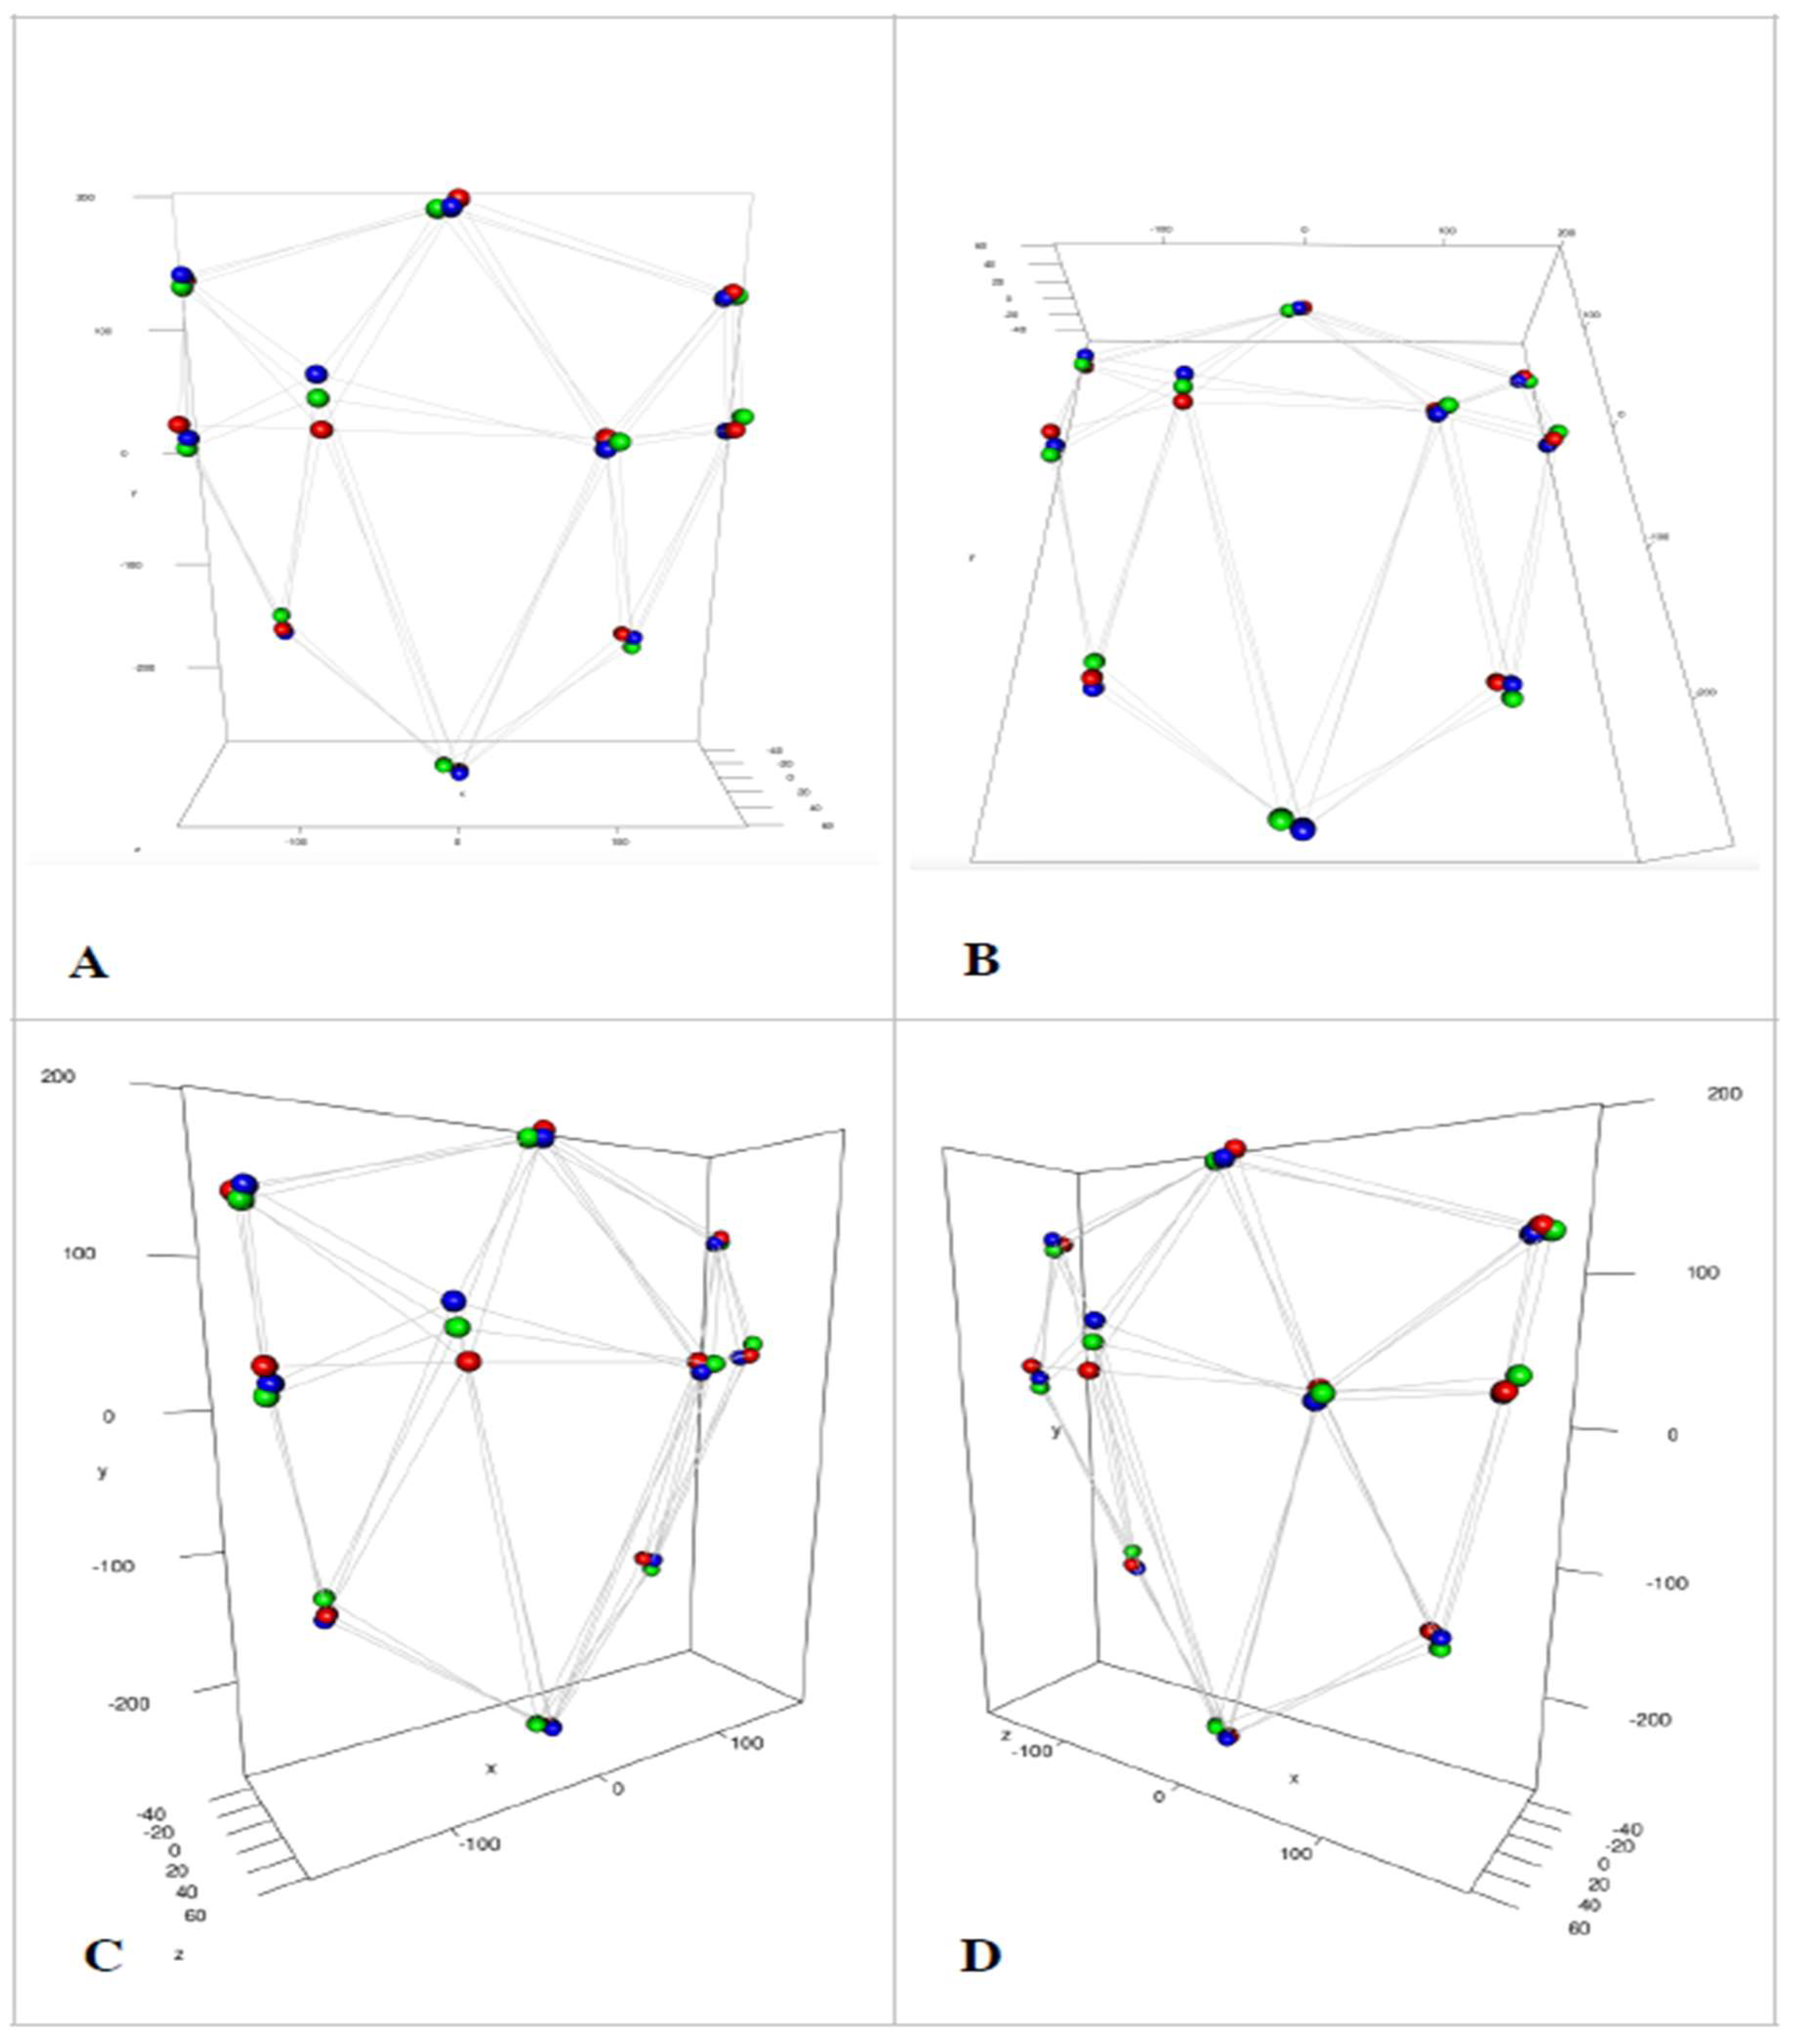
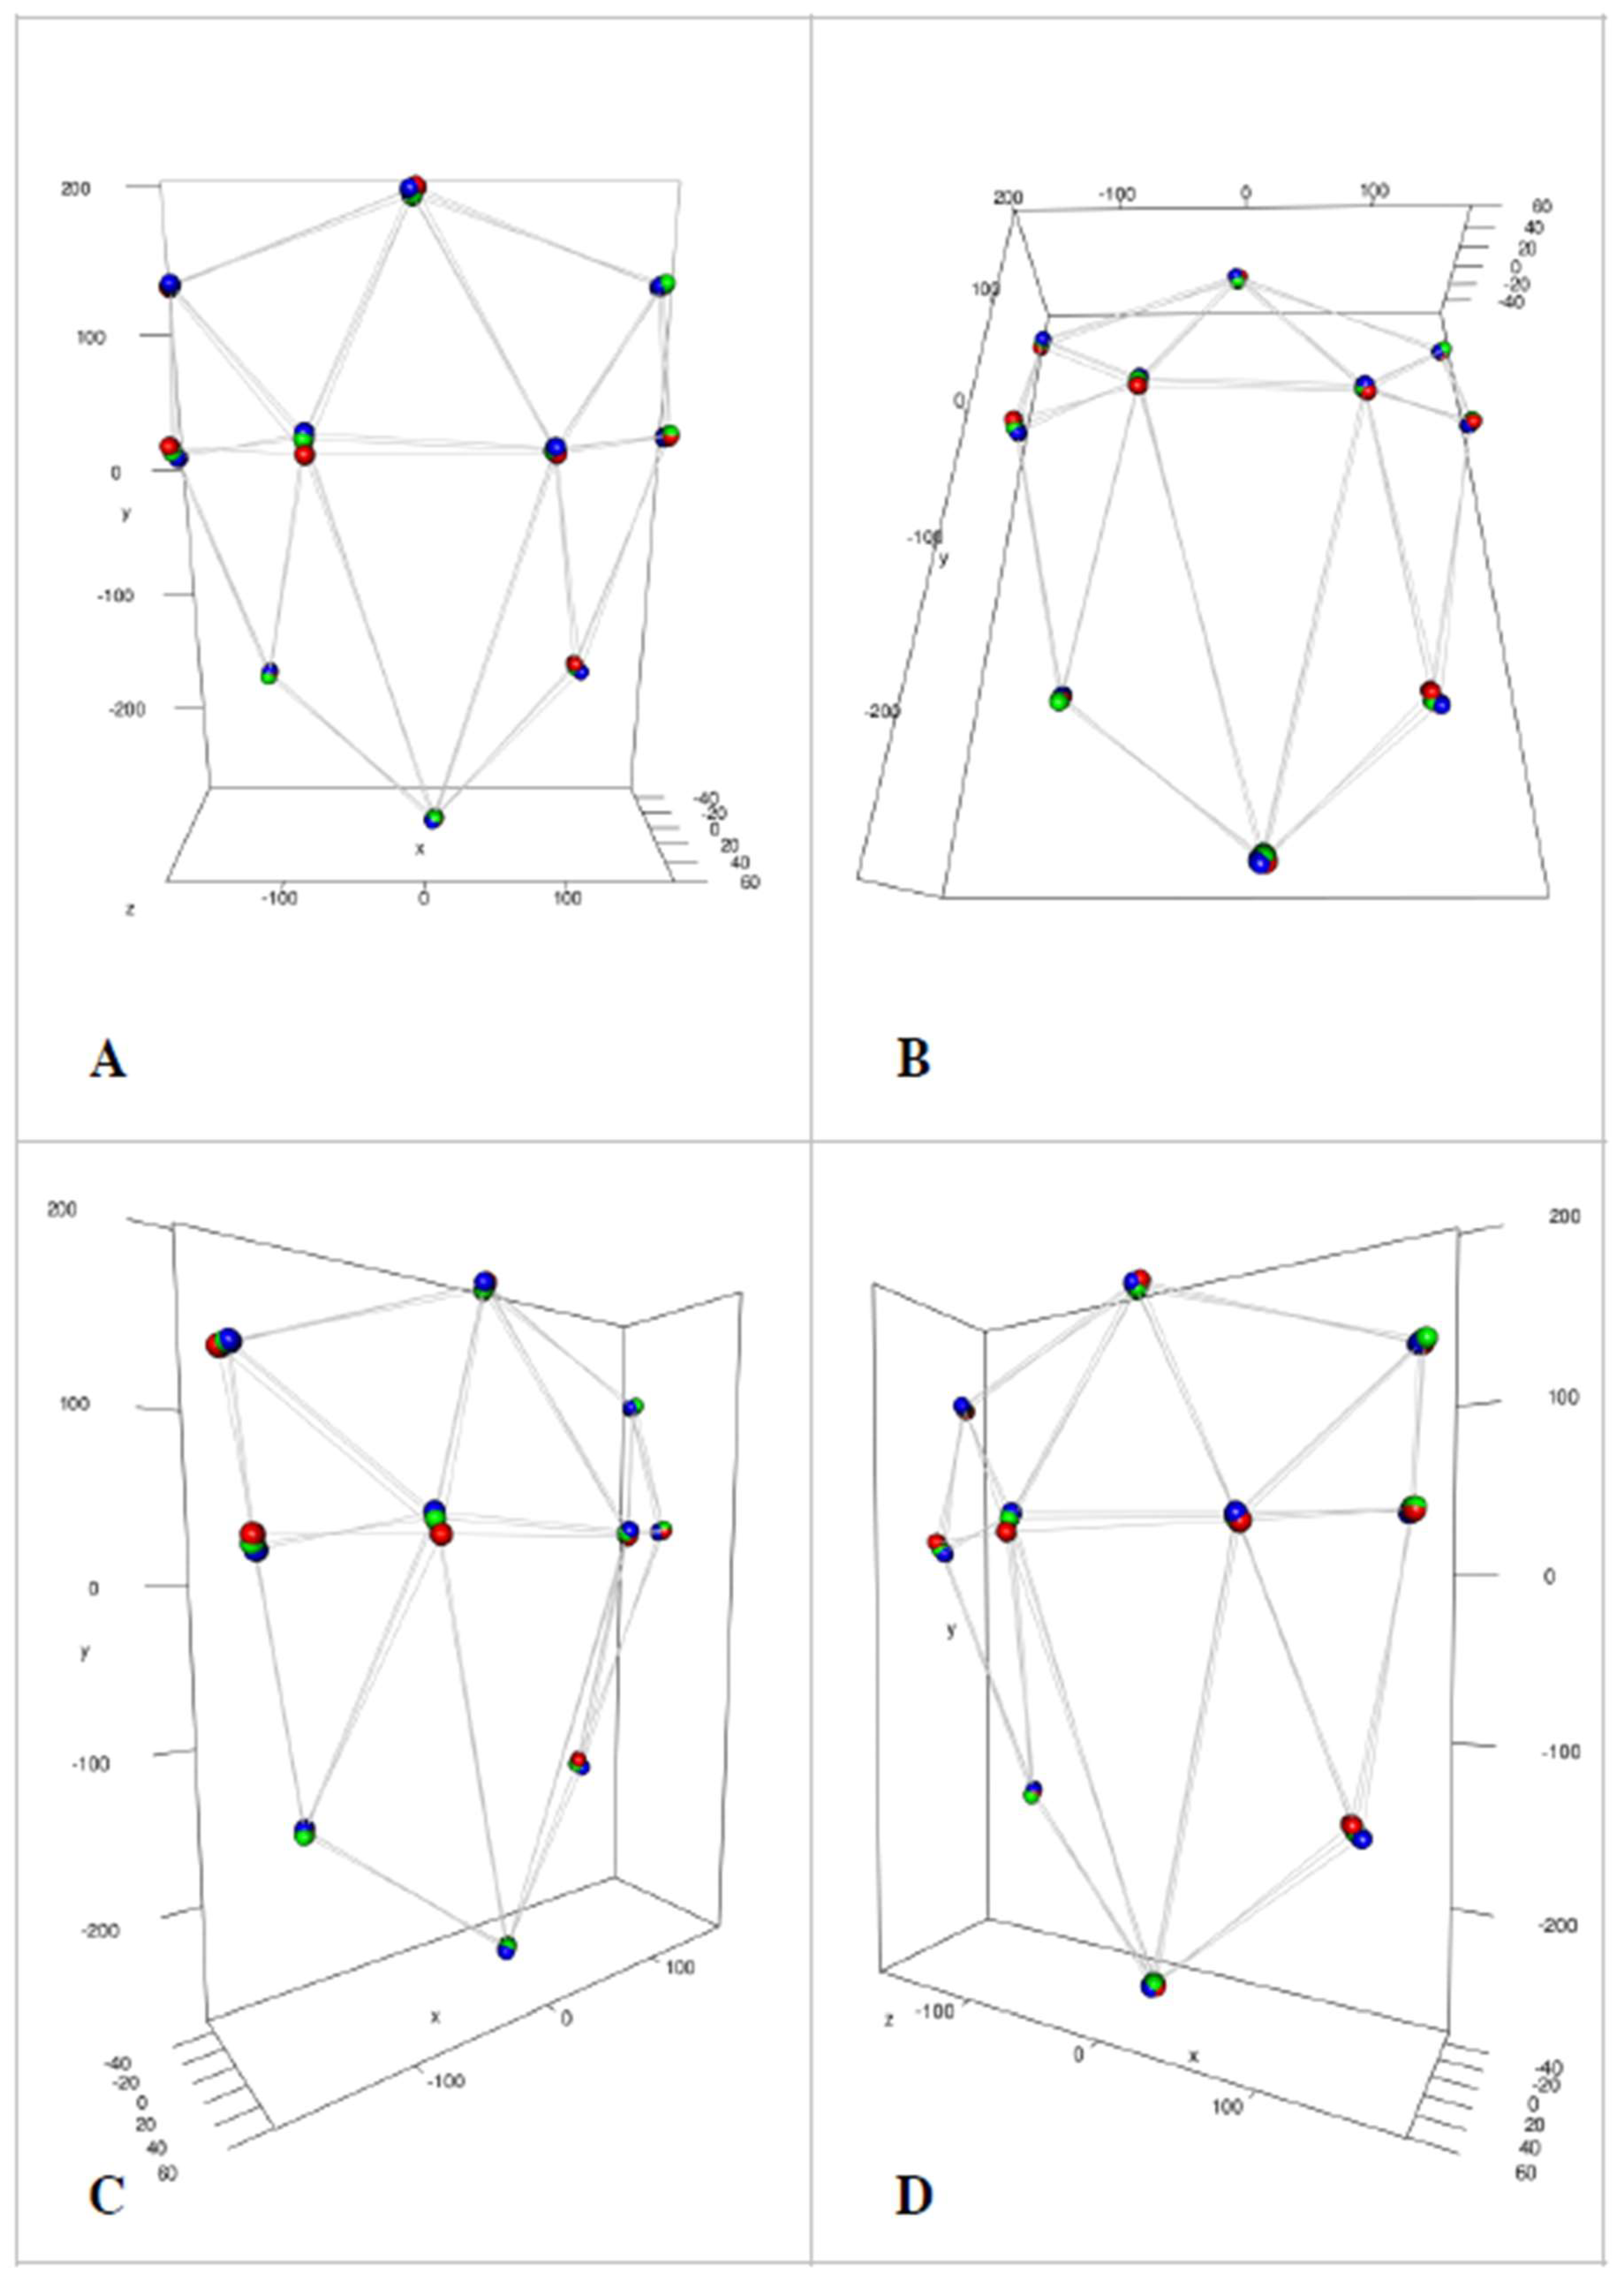
Figure 5A–C). The mean shapes of the non-scoliotic, pre-operative and post-operative cohorts are plotted together and viewed from different angles in
Figure 6 (main thoracic) and
Figure 7 (main thoracolumbar).
The mean shape of the non-scoliotic data (
Figure 6 and
Figure 7—red spheres) shows that, for both the main thoracic and main thoracolumbar curve patterns, there is little asymmetry seen. This is confirmed with the PCA analysis, where the axes of variability are in similar positions and of similar length (mirrored) between the two sides (
Figure 4A and
Figure 5A).
There were statistically significant differences between males and females in the non-scoliotic cohort by all three statistical tests (
p < 0.05). However, as can be seen in
Figure 3, there is little visual difference between the shapes of the males and the females, and these differences would not be within the range regarded by Akel et al. as clinically significant [
16]. For the scoliotic cohort, the small numbers of males when compared to the number of females made the analysis by sex unreliable. Thus, following the methodology that has already been established in the literature by Gardner et al. [
5], further analysis was performed independent of sex.
Using the plots of the mean shape, in the pre-operative main thoracic group, a difference is seen compared to the non-scoliotic cohort in the position of the most prominent points on the back (
Figure 6). This is seen in both the
y and
z dimensions with the left point being higher (
y) and less prominent (
z) than the corresponding right point. Whilst the mean shape is similar for the other landmarks, the PCA plots demonstrate the variability seen (
Figure 4A,B). Following surgery, the asymmetry in height increases but the difference in prominence decreases (
Figure 4A,C and
Figure 6).
In the main thoracolumbar group, pre-operatively, the asymmetry seen is less than that of the main thoracic group (
Figure 7). Surgery changes the asymmetry seen, particularly in the position of the most prominent points, but to a lesser amount than in the main thoracic group (
Figure 7). Again, the variability is reflected in the PCA plots (
Figure 5).
Using all three statistical tests (Hotelling [
11], Goodall [
12] and James [
13]), there was a statistically significant change (
p < 0.001) between the non-scoliotic and pre-operative data, non-scoliotic and post-operative data and the pre-operative and post-operative data in both main thoracic and main thoracolumbar curve types.
The possible errors in measurement are twofold: first, that from the interaction with the subject and second, from the subsequent identification of landmarks. The error that comes from the interaction with the subject is documented in the paper by Berryman et al. [
7]. The error from the placement of landmarks were assessed by inter- and intra-rater testing, and all intraclass correlation (one way agreement) values were greater than 0.935.
4. Discussion
Scoliosis is a disorder of the shape of the spine and torso [
17]. The visual appearance of the torso to the patient and family is often the trigger for a referral for a specialist opinion [
17]. Patients and surgeons are concerned about the spine and the asymmetry of the torso [
2,
3,
18]. Previous literature has identified the variability of the posterior torso shape in both a non-scoliotic cohort [
4] and scoliotic cohort [
5]. These papers examined the pre-operative and post-operative shape in comparison to the non-scoliotic cohort using data ellipses. These ellipses show that there is a degree of asymmetry in non-scoliotic children. Scoliosis increases the degree of asymmetry, and surgery decreases that asymmetry towards the range seen in the non-scoliotic cohort. However, these ellipses look at particular anatomical areas in isolation rather than the torso as a whole shape.
Procrustes analysis is a method of shape analysis described by Dryden and Mardia [
6] that has previously been used in the spine [
19] and in scoliosis [
20]. The method allows assessment of the whole posterior torso shape in 3D.
For both non-scoliotic and scoliotic cohorts, the subjects were sub-divided to allow for different curve types [
8]. This again followed previous methodology [
5] and was to ensure that any variability of shape seen between different curve types was identified. In the non-scoliotic cohort, there was a statistically significant but clinically insignificant difference in the mean shapes between males and females [
16]. Whilst the PCA analysis shows what is responsible for this statistical difference (as the spread of the data around each landmark is different in size and direction), there is minimal asymmetry between the left and right sides of the torso. Given the small numbers of males in the scoliotic cohort, and following the methodology of previous work [
5], further analysis was performed without sub-dividing for sex. The results of the analysis of shape in the non-scoliotic cohort provide reference data of normality for the future.
As expected from the work of Lenke [
8], in the scoliotic cohort, there were many more subjects with a main thoracic curve type compared to a main thoracolumbar curve type. In the main thoracic curve group, the most obvious asymmetry in both the mean shape and the PCA analysis is of the most prominent points over the back. This is not seen to the same degree in the main thoracolumbar group. This would be expected given the anatomical proximity of the scoliotic curve to the most prominent points in the main thoracic group as the most prominent points of the back are invariably seen over the scapulae; however, the points do not represent the underlying bony anatomy. They do, however, represent what the patient will see as part of their rib hump. In the main thoracic curve group, the right side is more inferior and more prominent than the left (
Figure 6). For the points around the edge of the torso, the amount of change in position is not as much as that for the most prominent points. This is also seen in the main thoracolumbar group (
Figure 7).
Surgery not only changes the shape of the spine but also the shape of the torso [
21]. One of the aims of a surgical procedure is to minimise any asymmetries in the torso and spine [
17]. It is of interest to see that the results of this paper show that surgery increases the difference in the
y-axis but decreases the difference in the
z-axis of the most prominent points between the left and right sides of the torso. It is not immediately clear why this occurs, but it can be hypothesised that it is caused by a change in the geometry of the underlying bony anatomy such that a different part of the scapula becomes more prominent. The scapula is a flat bone lying superficial to the thoracic cage and is only attached to the axial skeleton via the acromioclavicular joint. Thus, the 3D position of the scapula can be changed through surgery by changing the shape of the underlying thoracic cage, tilting the scapula and making a more superior part of the scapula prominent. The mean post-operative points around the edge of the torso, on the other hand, are in a similar position to the pre-operative and non-scoliotic cohorts.
Statistically, there was a significant change (p < 0.001) in 3D shape between the non-scoliotic, pre-operative and post-operative cohorts. This demonstrates the underlying variability of the data, which cannot be seen visually but would be appreciated by imagining the mean shape and PCA plots superimposed.
The effect of surgery is to change the shape of the torso but, in agreement with our previous work [
5], there is still a significant amount of variability and difference in the shape of the post-operative cohort compared to the non-scoliotic cohort.
The most prominent points represent just one measure of 3D shape. The 3D coordinates of these points do not describe the total 3D shape of the rib hump. The current analysis does not measure the totality of the rib hump, which can vary in shape and size. Future work will be aimed at the 3D analysis of the rib hump as a shape rather than one 3D point.
This work identifies the 3D shape of the posterior torso in both non-scoliotic and scoliotic cohorts. Scoliosis surgery does change the shape of the torso but to a lesser degree than it changes the spine [
21]. This information is of use to surgeons, allowing the planning of a procedure that will result in the least asymmetry.
The importance of this work is, first, in establishing a methodology that can be used to assess the 3D shape of the torso. Second, using this methodology, the 3D shape of the torso has been demonstrated in a non-scoliotic cohort and both a pre-operative and post-operative scoliotic cohort. This shows how different scoliotic curves alter the shape of the torso and, in particular, which part of the torso is most affected by scoliosis. This matters as one of the aims of scoliosis surgery is the equalisation of asymmetry. From this work, the conclusion can be drawn that scoliosis surgery does not always reduce, and in some areas actually increases, the asymmetry of the torso. Thus, future developments in scoliosis surgery need to be targeted to deal with this. This work will enable clinicians to understand the effects of scoliosis and scoliosis surgery on the torso such that future developments in surgery are aimed at achieving greater symmetry and less torso deformity.


