1. Introduction
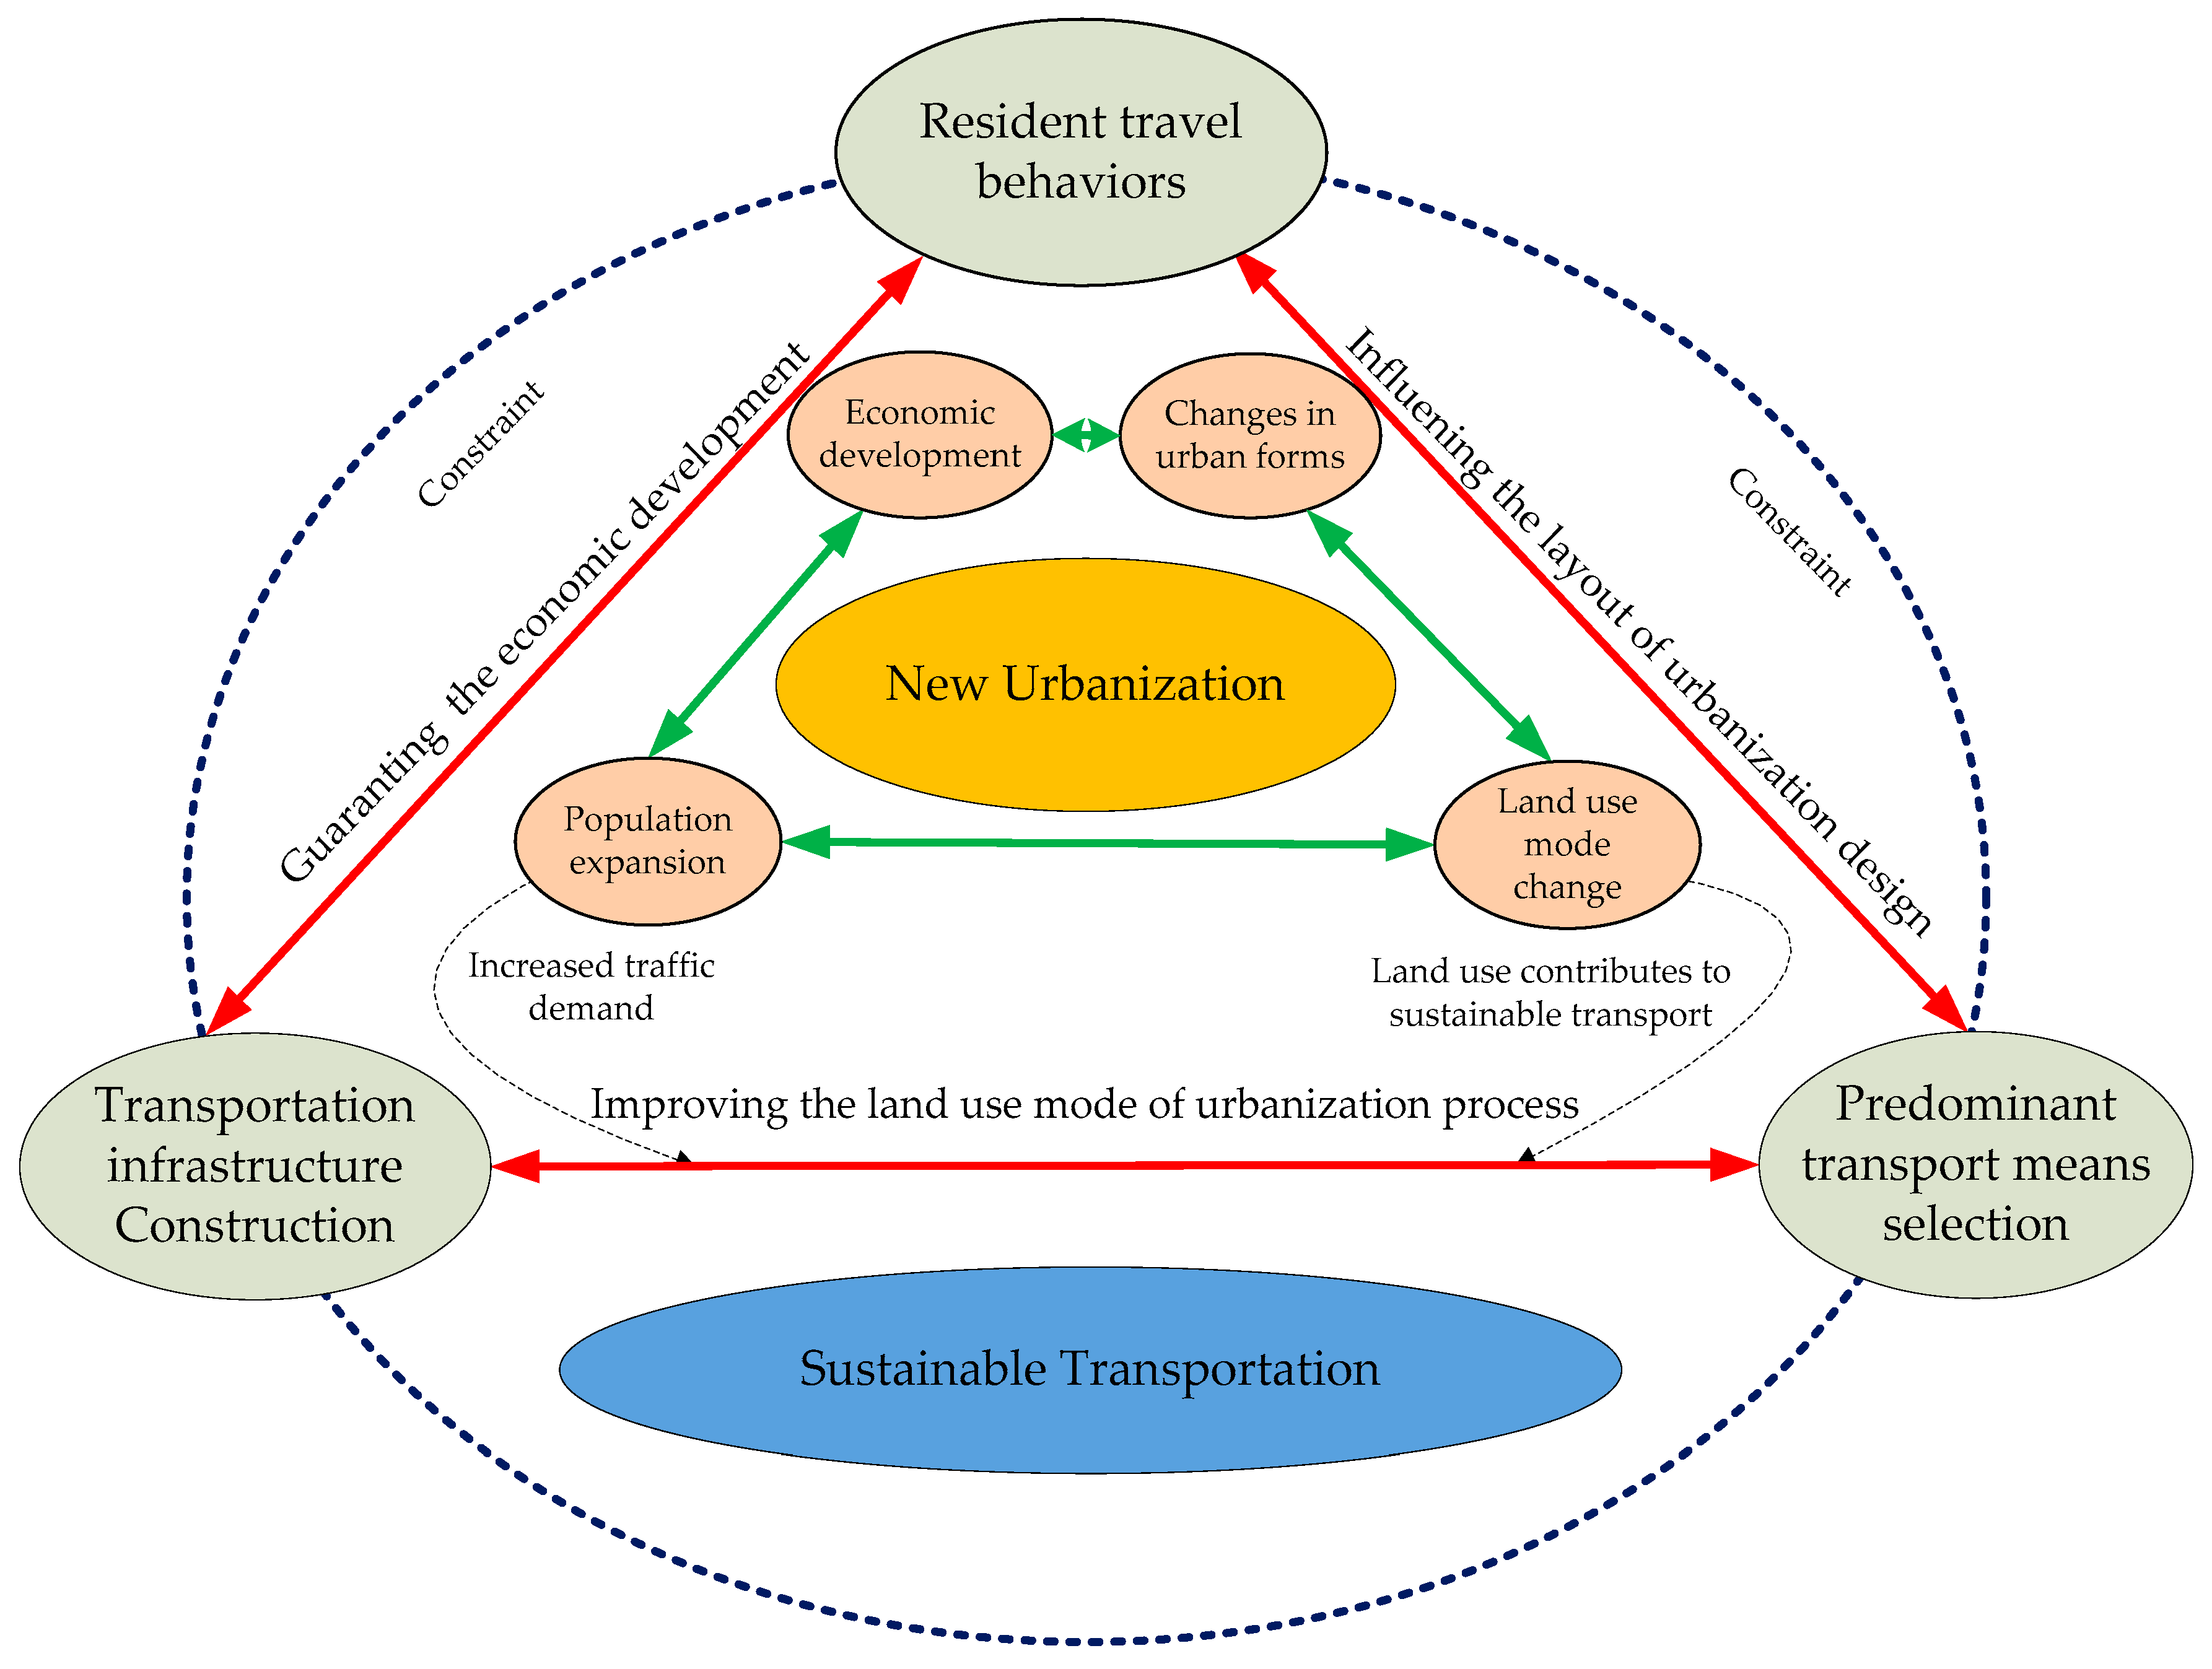
New urbanization (NU) and sustainable transportation (ST) are two important issues in the urbanization process, and the symmetrical coupling level between them is an important indicator of urbanization development [
1]. NU differs from traditional urbanization in its emphasis on the intensity of the urbanization process, with wider meanings associated with urban–rural integration and sustainability [
2]. ST is a mode of sustainable development which meets increasing transport demands in a way that promotes social equity, environmental friendliness and resource conservation, without damaging the natural environment [
3]. The relationship between NU and ST is symmetrical and coupled. On the one hand, NU and ST are two relatively independent aspects of the process of urbanization. On the other hand, they are related through certain coupling and coordination aspects. Urban transportation is of a great significance for guiding urban spatial layout and supporting industrial layout, which are also indispensable factors in urbanization [
4,
5]. At the same time, the realization of NU is inseparable from the support of ST. In fact, transit-oriented development (TOD) is a reflection of the idea of symmetrical and coupled development in urbanization and urban transportation, and emphasizes a design approach that maximizes the use of public transportation when planning a residential or commercial area. Therefore, to promote sustainable urban construction and urban economic development, special attention needs to be paid to the two important aspects of NU and ST. Only when these two systems are in a coordinated and balanced stage of development, can corresponding positive externalities be produced to promote the process of urban construction; such as, the reduction of environmental pollution and the improvement of resource utilization [
6]. If the NU is not aligned with the speed of development of ST, it will inevitably lead to management confusion and a large amount of resource wastage [
7,
8]. The existing literature suggests that a holistic view of the concepts of urbanization and transportation development is lacking. Without the proper coordination of ST and NU, outcomes will be inefficient. Therefore, to break this restrictive situation and achieve a virtuous circle of mutual promotion, it is imperative that the symmetrical coupling mechanism between NU and ST be clarified to finally obtain coordinated development of the two systems.
In recent years, with China’s economy shifting from a high-speed growth stage to today’s high-quality development stage, many cities, especially metropolises, have comprehensively promoted new urbanization [
9]. The urbanization rate has increased from 26.21% in 1989 to 58.52% in 2017, with an average annual growth rate of 1.15% [
10]. However, this rapid urbanization process has produced a series of problems, including environmental pollution, unreasonable land use, and a lack of transportation facilities, which are seriously hindering the development of urbanization [
11,
12]. According to data from the Ministry of Transport of China, national highway traffic congestion in 2015 totaled 0.39, of which the top five provinces in terms of congestion were Shanghai, Beijing, Guangdong, Zhejiang, and Shandong. In 2015, 78.4% of China’s urban ambient air quality exceeded the standard. Rapid urbanization requires sound public transport services and supporting infrastructure. Improved transportation infrastructure and reasonable transportation energy consumption will, in turn, have a positive effect on economic growth [
8,
13]. The unreasonable allocation of traffic resources and the imperfect public transport services will lead to transport deprivation (i.e., the travel of low-income groups is inhibited), further influencing the development of urbanization [
13]. Therefore, it is necessary to evaluate the symmetrical coupling level between urbanization development and sustainable transportation in the metropolises of China, and further to predict future development trends, so as to provide a theoretical basis for the government agency to formulate a scientific and comprehensive urban development plan.
To date, many scholars have studied the relationship between urbanization and transport infrastructure, land use and transport behavior, but few have researched the coordinated development of NU and ST. Existing studies can be grouped into three categories: (1) Research on the supporting role of transportation infrastructure in urban development. For example, Gössling et al. used high-resolution digital satellite imagery combined with the geographic information system to calculate space allocations and evaluate the spatial distribution of urban transportation infrastructure. They emphasized that different transportation space allocations should be applied for different transportation modes [
14]. Maparu et al. highlighted a long-term relationship between transportation infrastructure and economic development and urbanization, with this causal relationship extending from economic development to transportation infrastructure [
15]; (2) Research on the relationship between urban land use patterns and the main traffic tools chosen by urban residents. For instance, Branea et al. proposed an analytical framework containing 15 standards to identify and quantify the key aspects of the main traffic patterns. The framework included hard quantitative data such as digital simulation, and mobility pattern analysis, and soft data such as quality assessments, and perceived demand and satisfaction. Their study highlighted that the quality of traffic infrastructure and the most effective means of transportation used by each particular city type may make urban development more sustainable [
16]. Kwan et al. pointed out that travel duration, distance and purpose are important factors that affect residents’ willingness to transfer to rail transit on weekdays [
17]; (3) Research on the changes in urban morphology affecting travel behavior and, further, changing the choice of travel modes. For example, Loo et al. posited that urban expansion impacts sustainable transportation development, especially in Asian cities that have lower car ownership and more compact urban development. In these cities, changes in urban form impact travel behavior, and more people choose to avoid crowded urban centers [
18]. Rukmanal et al. analyzed rapid urbanization demand for sustainable transportation policies in Jakarta, Indonesia, highlighting the finding that rapid urbanization led to an increase in urban vehicles. This in turn caused traffic congestion in Jakarta [
19]. Therefore, the study proposed that Jakarta should vigorously promote public travel and encourage residents to ride bicycles or walk to alleviate traffic congestion during rapid urbanization. Ahmad et al. surveyed nationally representative households from the 98 largest cities in India and applied multivariate analyses to estimate the number and mode of public and private transportation (represented by out-of-pocket travel expenses). The survey showed that the densification of cities in India reduced the volume of traffic and increased the possibility of using public transport. Consequently, public transport development could improve the sustainability and inclusiveness of urban traffic [
20].
In summary, the above literature indicates that there is a symmetrical coupling relationship between urbanization and transportation development in the development process, and that they interact and influence each other. Symmetrical coupling refers to the measure of mutual dependence for two or more entities in a common system, that is, there is a relationship of mutual interaction between the symmetrical entities [
21,
22]. At present, many scholars have applied symmetric coupling in related research, including the symmetrical coupling relationship between urbanization and ecological environment [
23,
24,
25], as well as the interaction between economy, society and tourism [
26,
27,
28]. Such studies provide a scientific reference for the study reported in this paper. However, few studies have analyzed the development of NU and ST from the perspective of symmetrical coupling, and quantitatively expressed the degree of coupling and coordination between the two systems as well as the consequences of their coordinated development [
29].
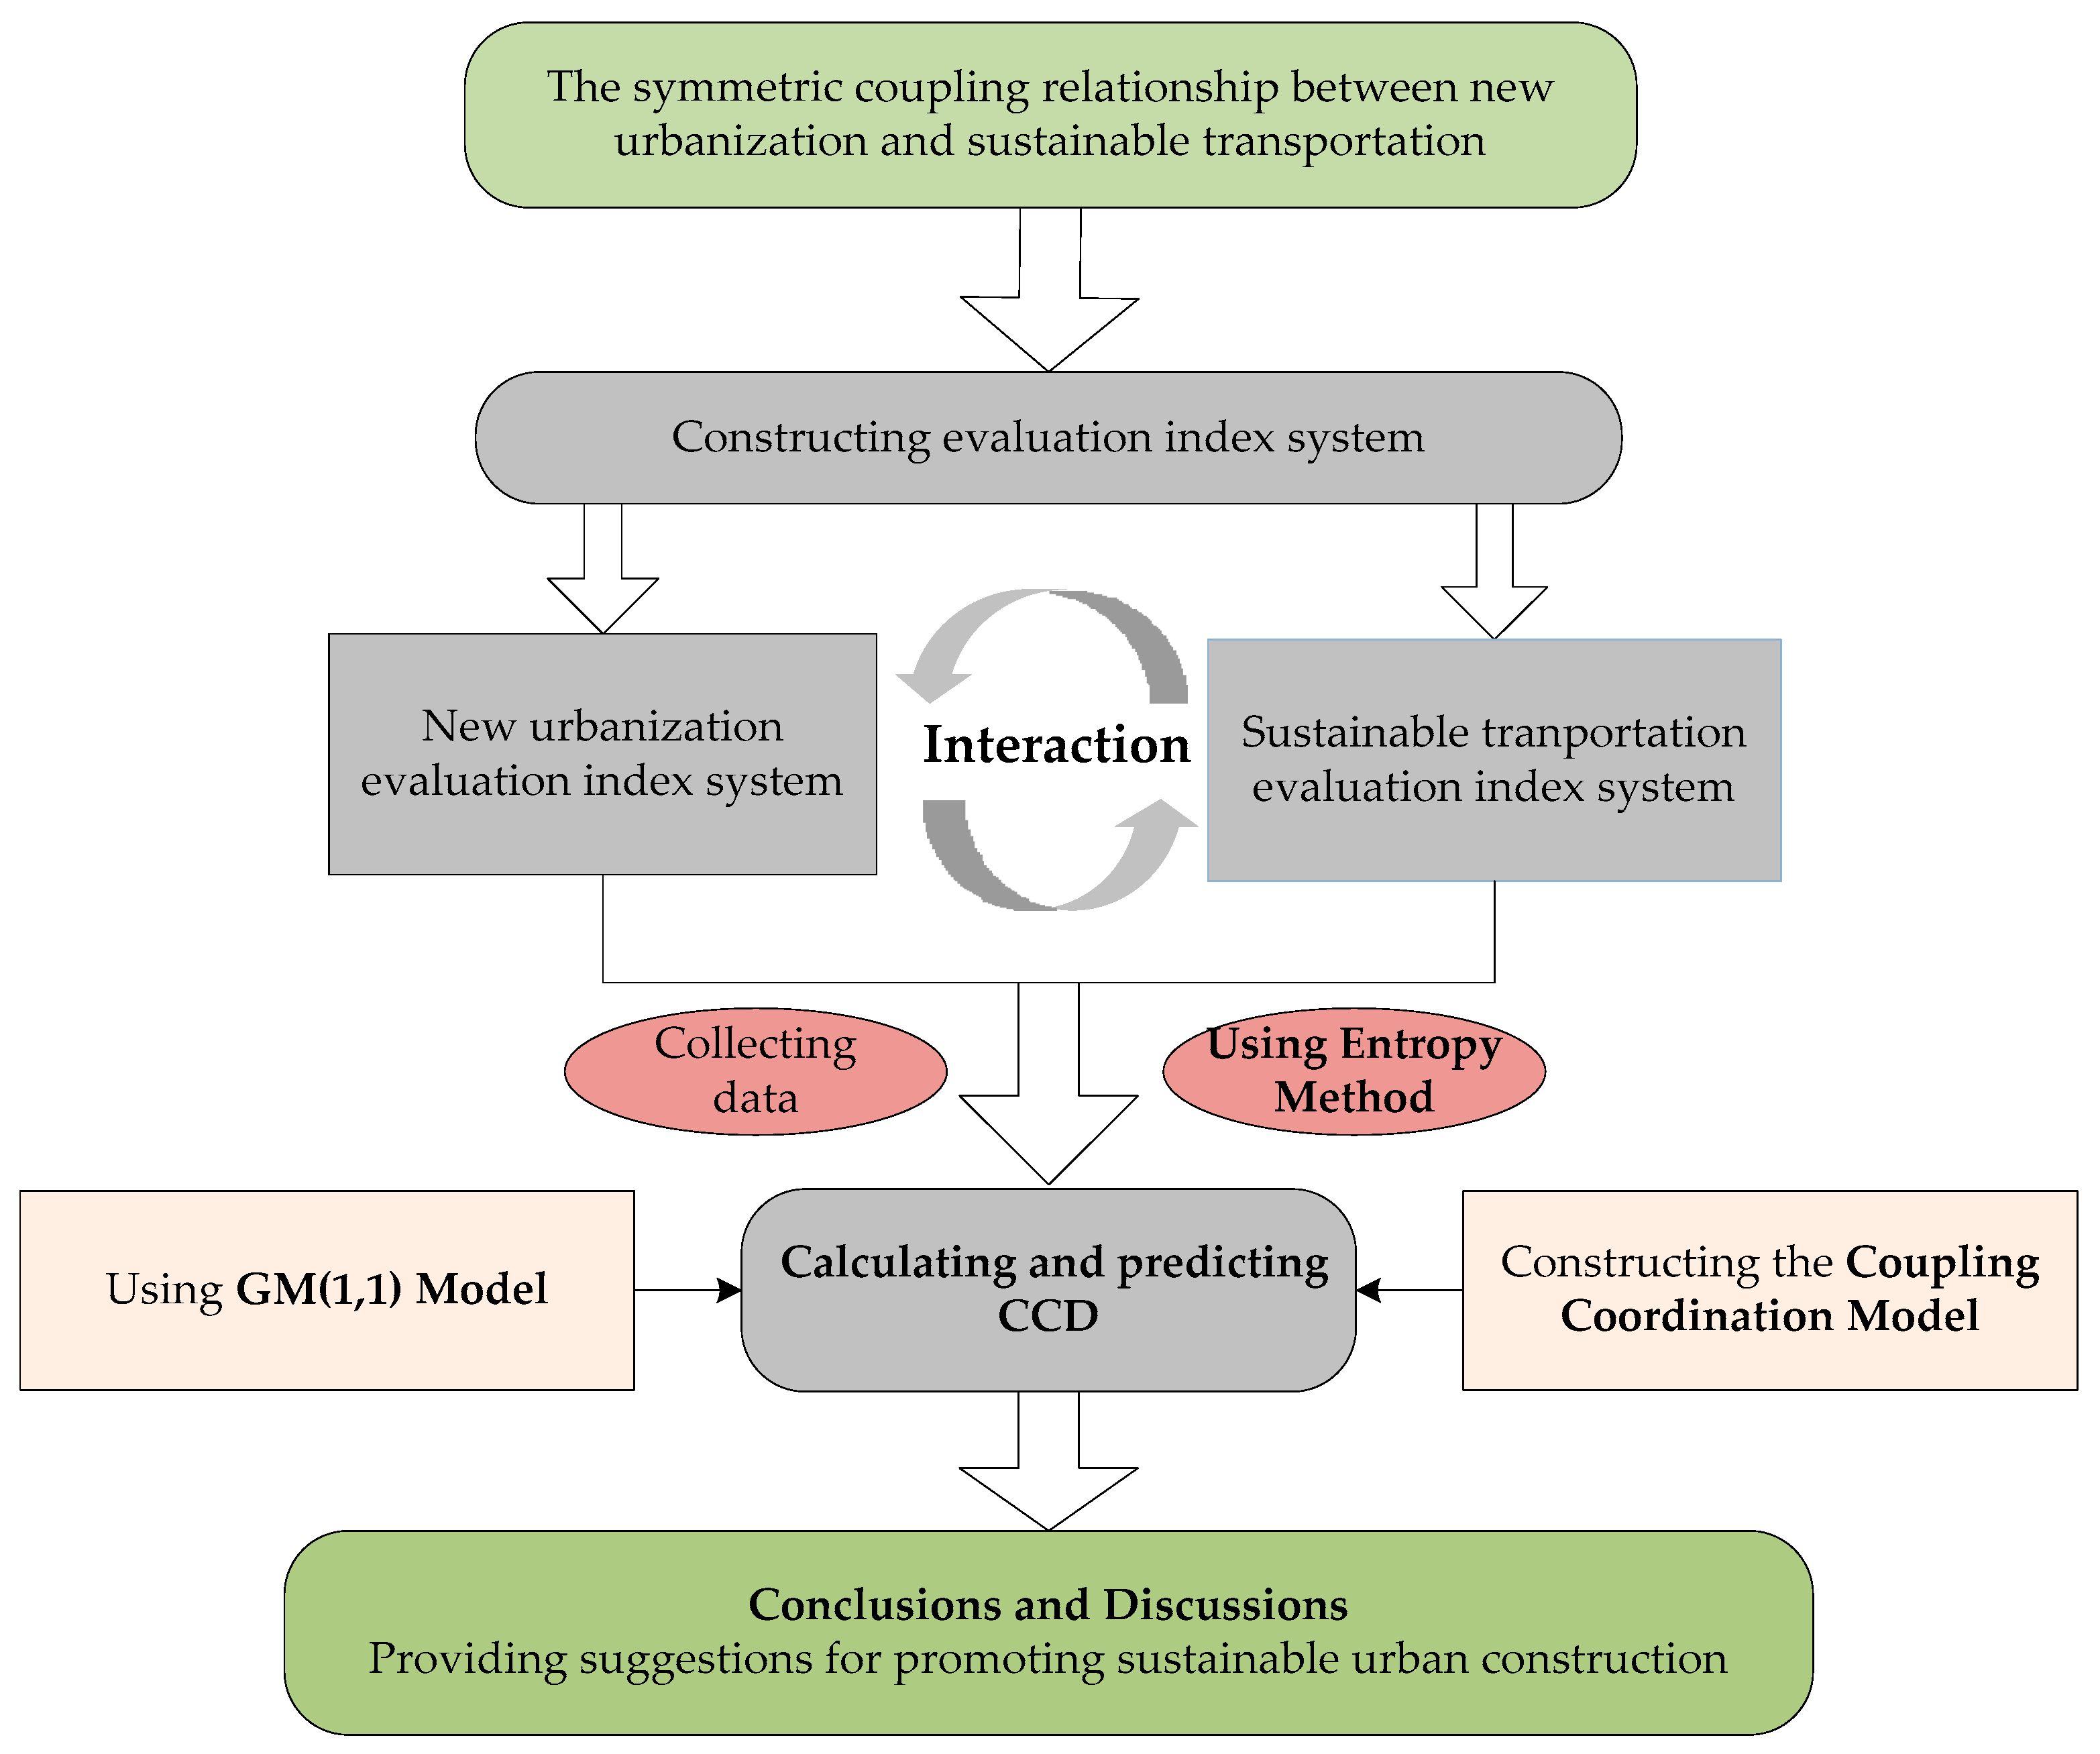
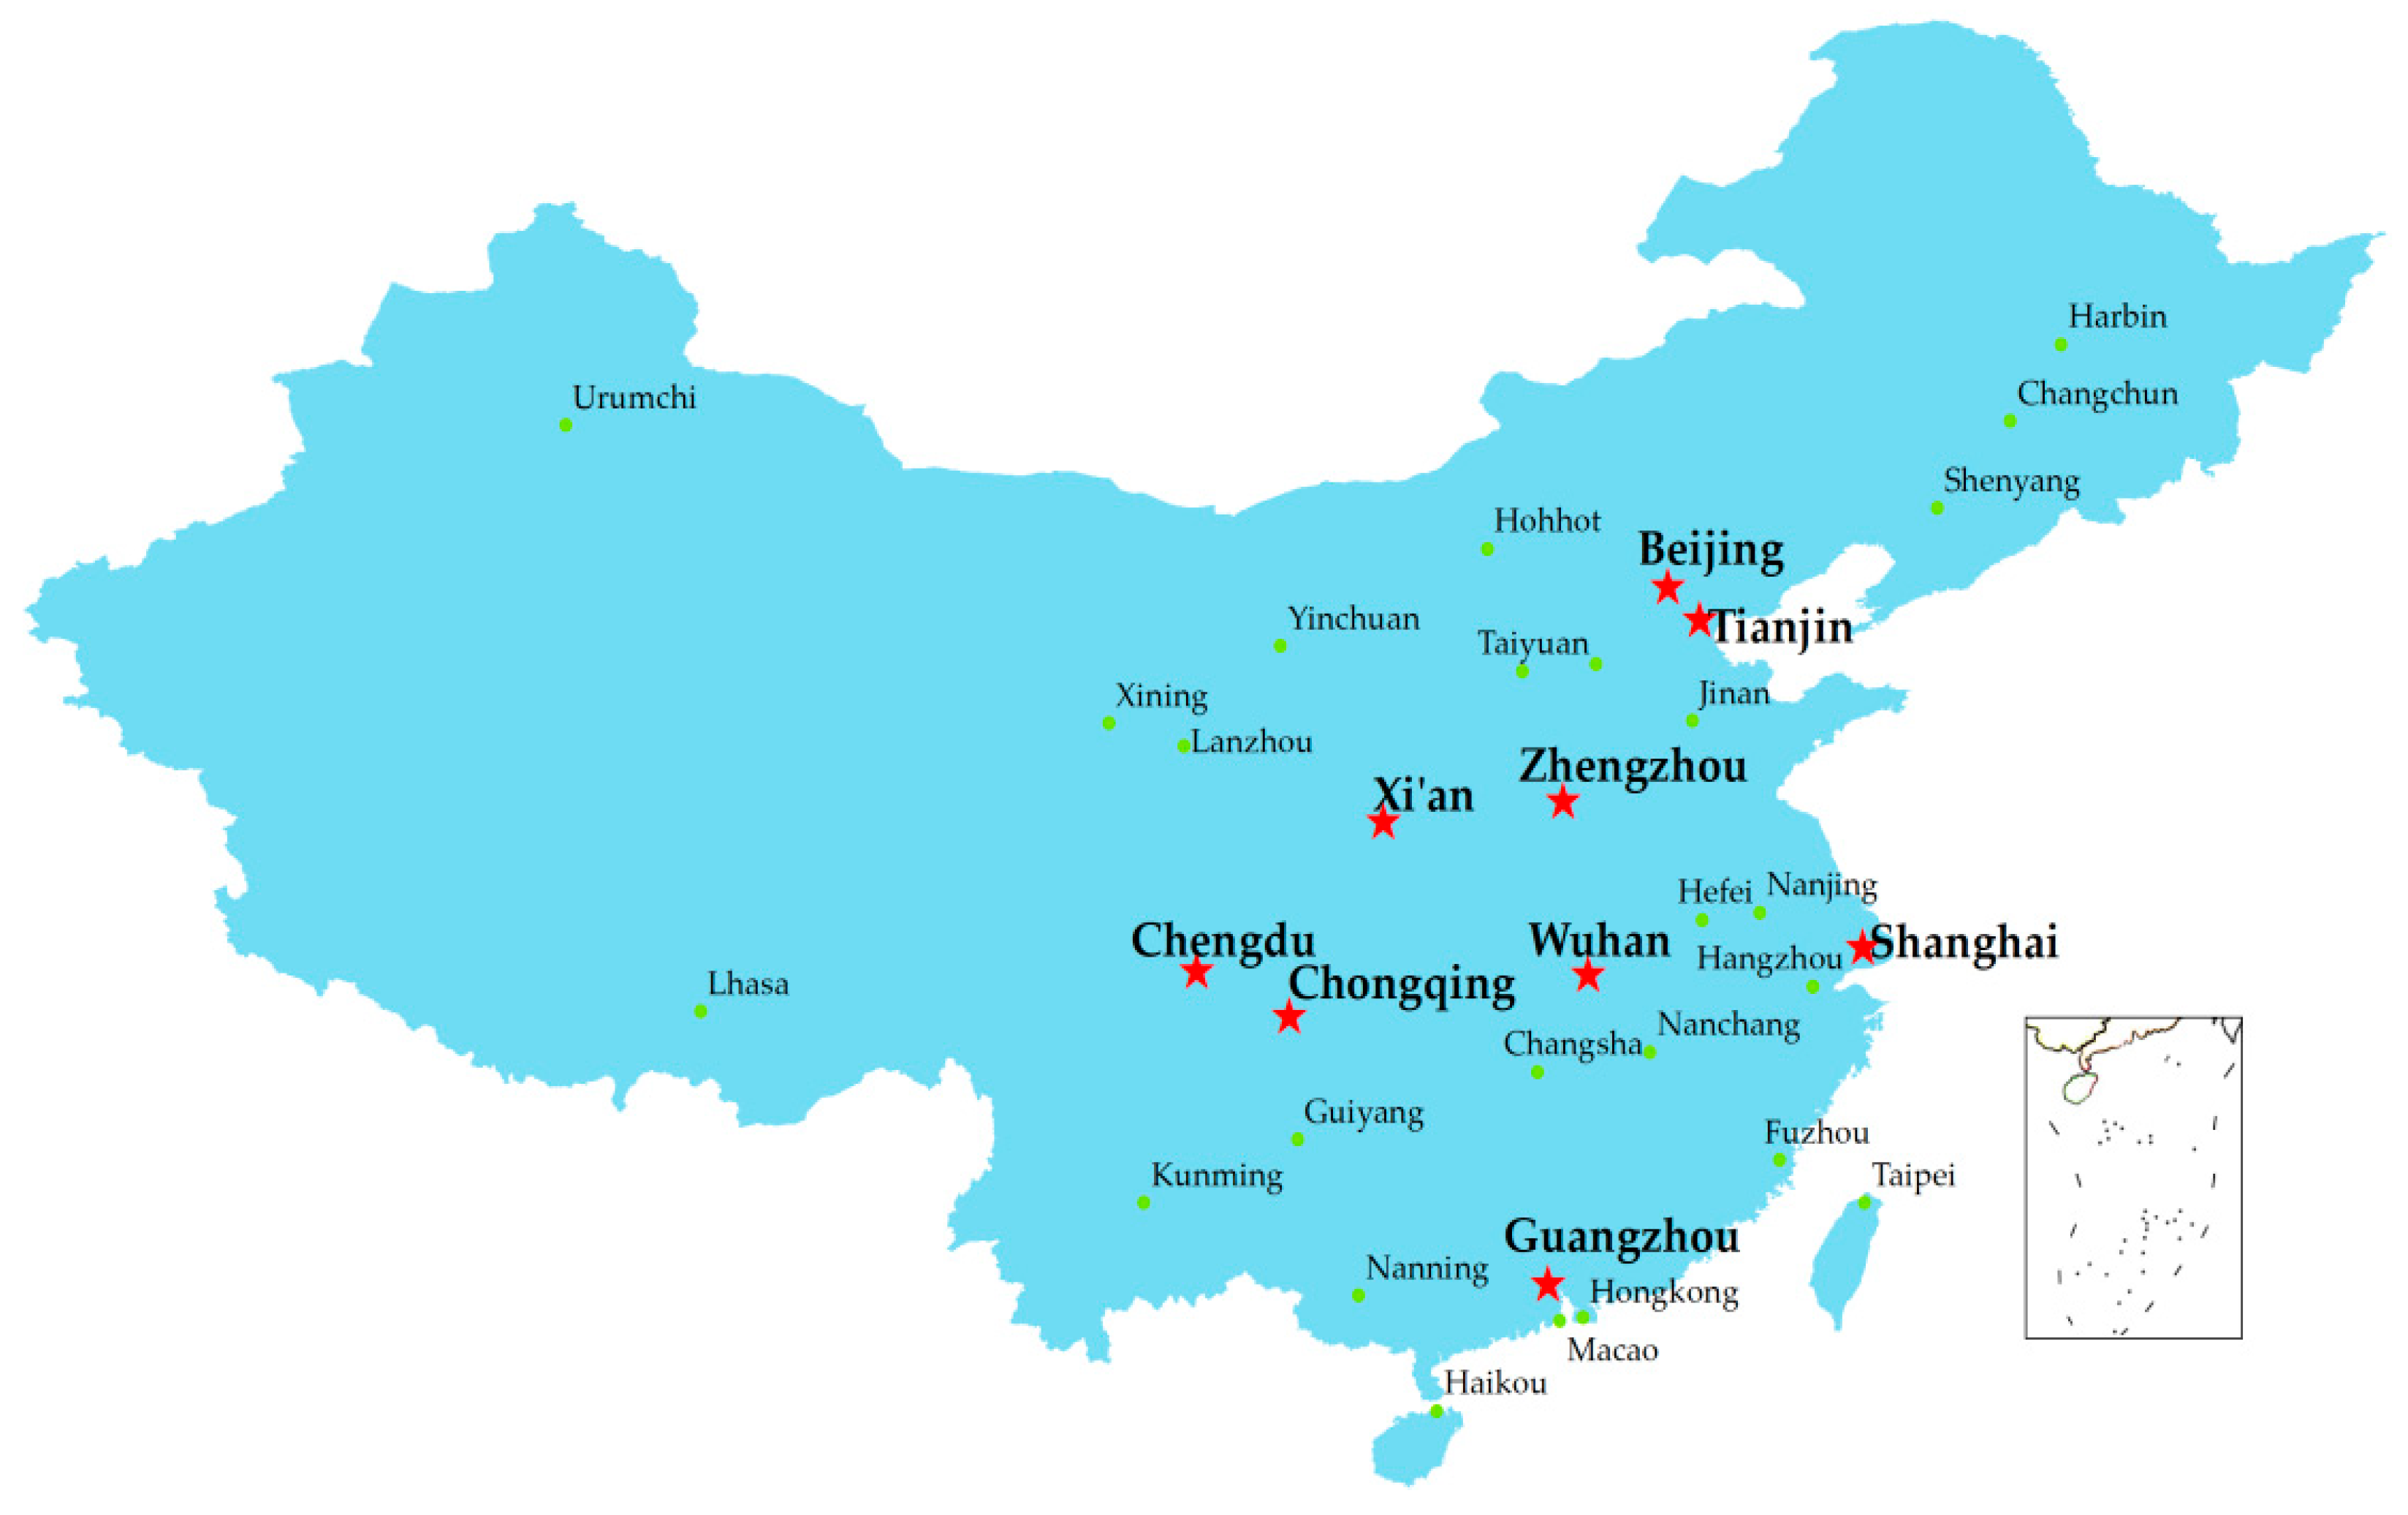
At present, the uncoordinated development of urbanization and transportation systems in China is very prominent, especially in large cities. It is necessary to explore the mechanism of symmetrical and coordinated development between new urbanization and sustainable transportation theoretically. This study aimed to explore the symmetrical coupling degree of NU and ST in big cities, and uses China’s nine metropolises (Beijing, Tianjin, Shanghai, Guangzhou, Chongqing, Chengdu, Wuhan, Zhengzhou and Xi’an) as research objects. Firstly, after referring extensively to the existing literature on evaluation indicators of urbanization and transportation system, this study constructed an evaluation index system for NU and ST. Thereafter, for measurement and analysis purposes, a coupling coordination degree (CCD) model was established to calculate the degree of symmetrical coupling between NU and ST, and the calculation results were analyzed with ArcGIS in different years. Next, combined with China’s future urbanization development plan [
30], a grey time series prediction method, namely the GM(1, 1) model, was used to predict the CCD values of the nine metropolises during the period 2019–2025. Finally, based on the results, we put forward optimization strategies for the future development of NU and ST in China, and provide suggestions for promoting comprehensive and sustainable urban development. The research framework of this study is shown in
Figure 1.
The rest of the paper is structured as follows.
Section 2 describes construction of the index systems, introduces the research model and method and calculates the coupling coordination degree (CCD) using the collected data.
Section 3 discusses and analyzes the calculation results. The last section of the paper presents the conclusions and recommendations of this study.
3. Empirical Research
3.1. Comprehensive Score Analysis of New Urbanization and Sustainable Transportation
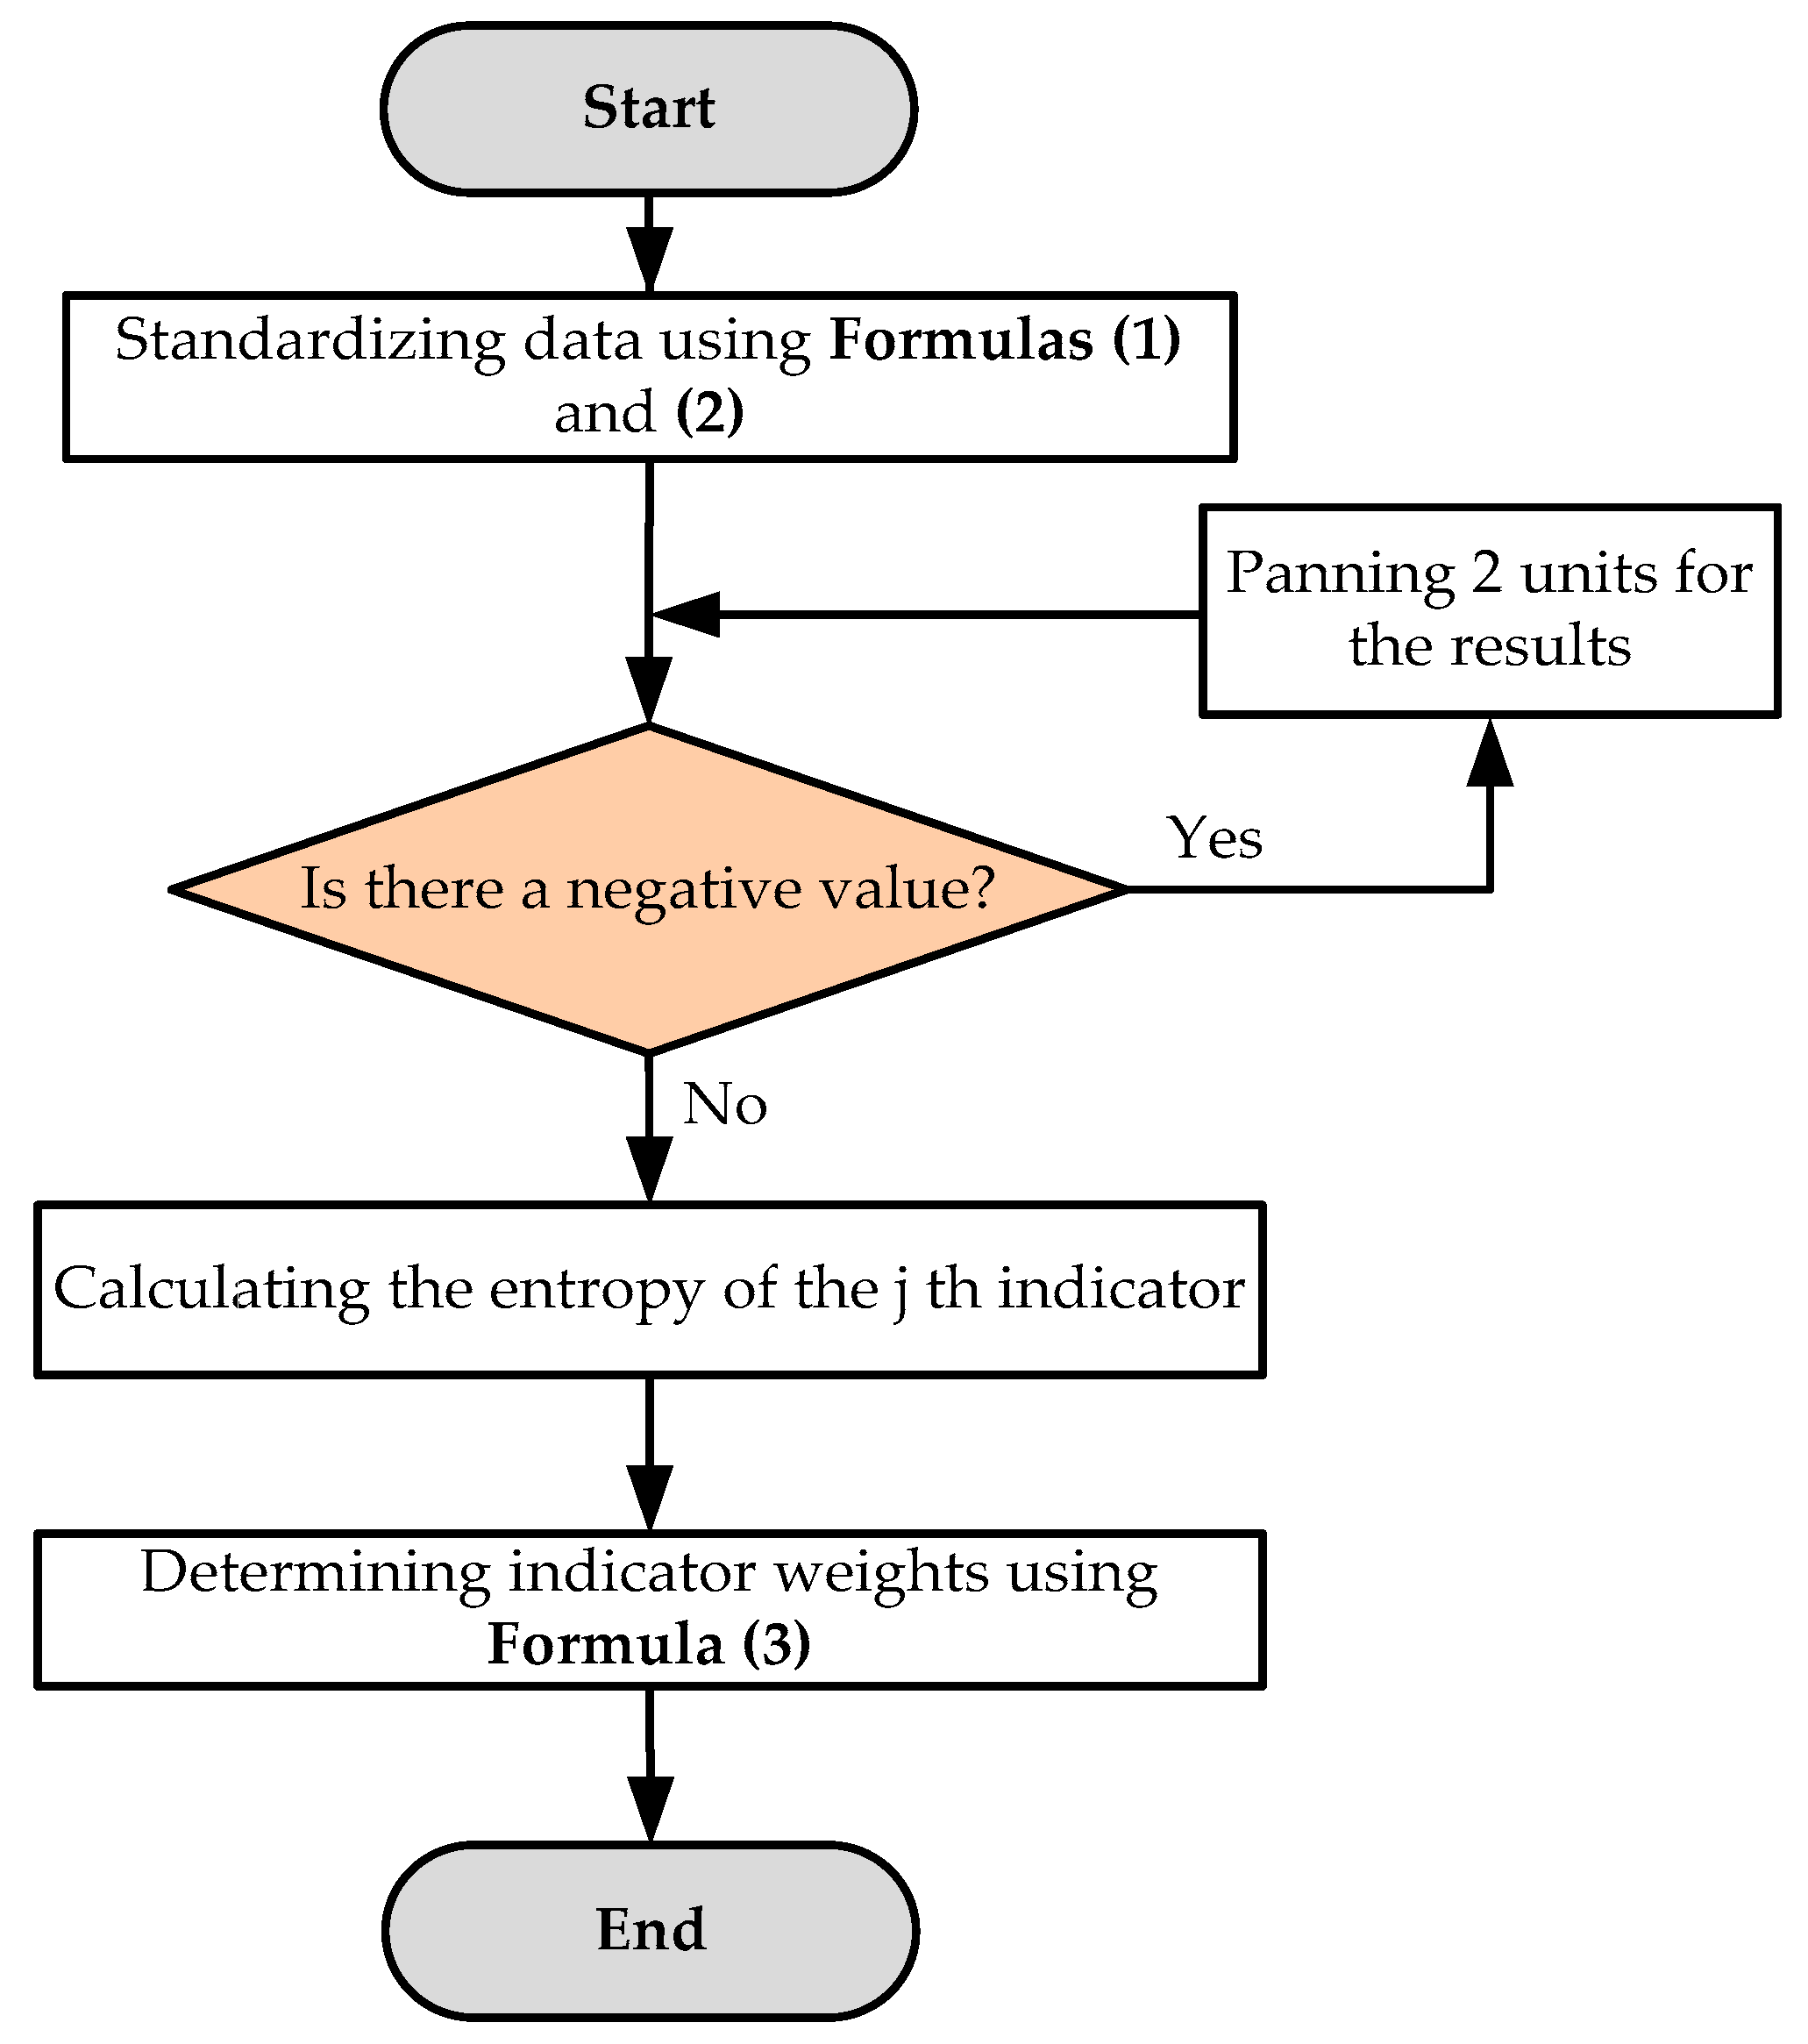
Using the original data for 2007–2016 from the nine national metropolises, Formulas (1)–(3) were used to calculate the corresponding index weights (the results are shown in
Table 1 and
Table 2), and Formula (4) was used to obtain the comprehensive score for new urbanization and sustainable transportation for each city (see
Table 4 and
Table 5, and
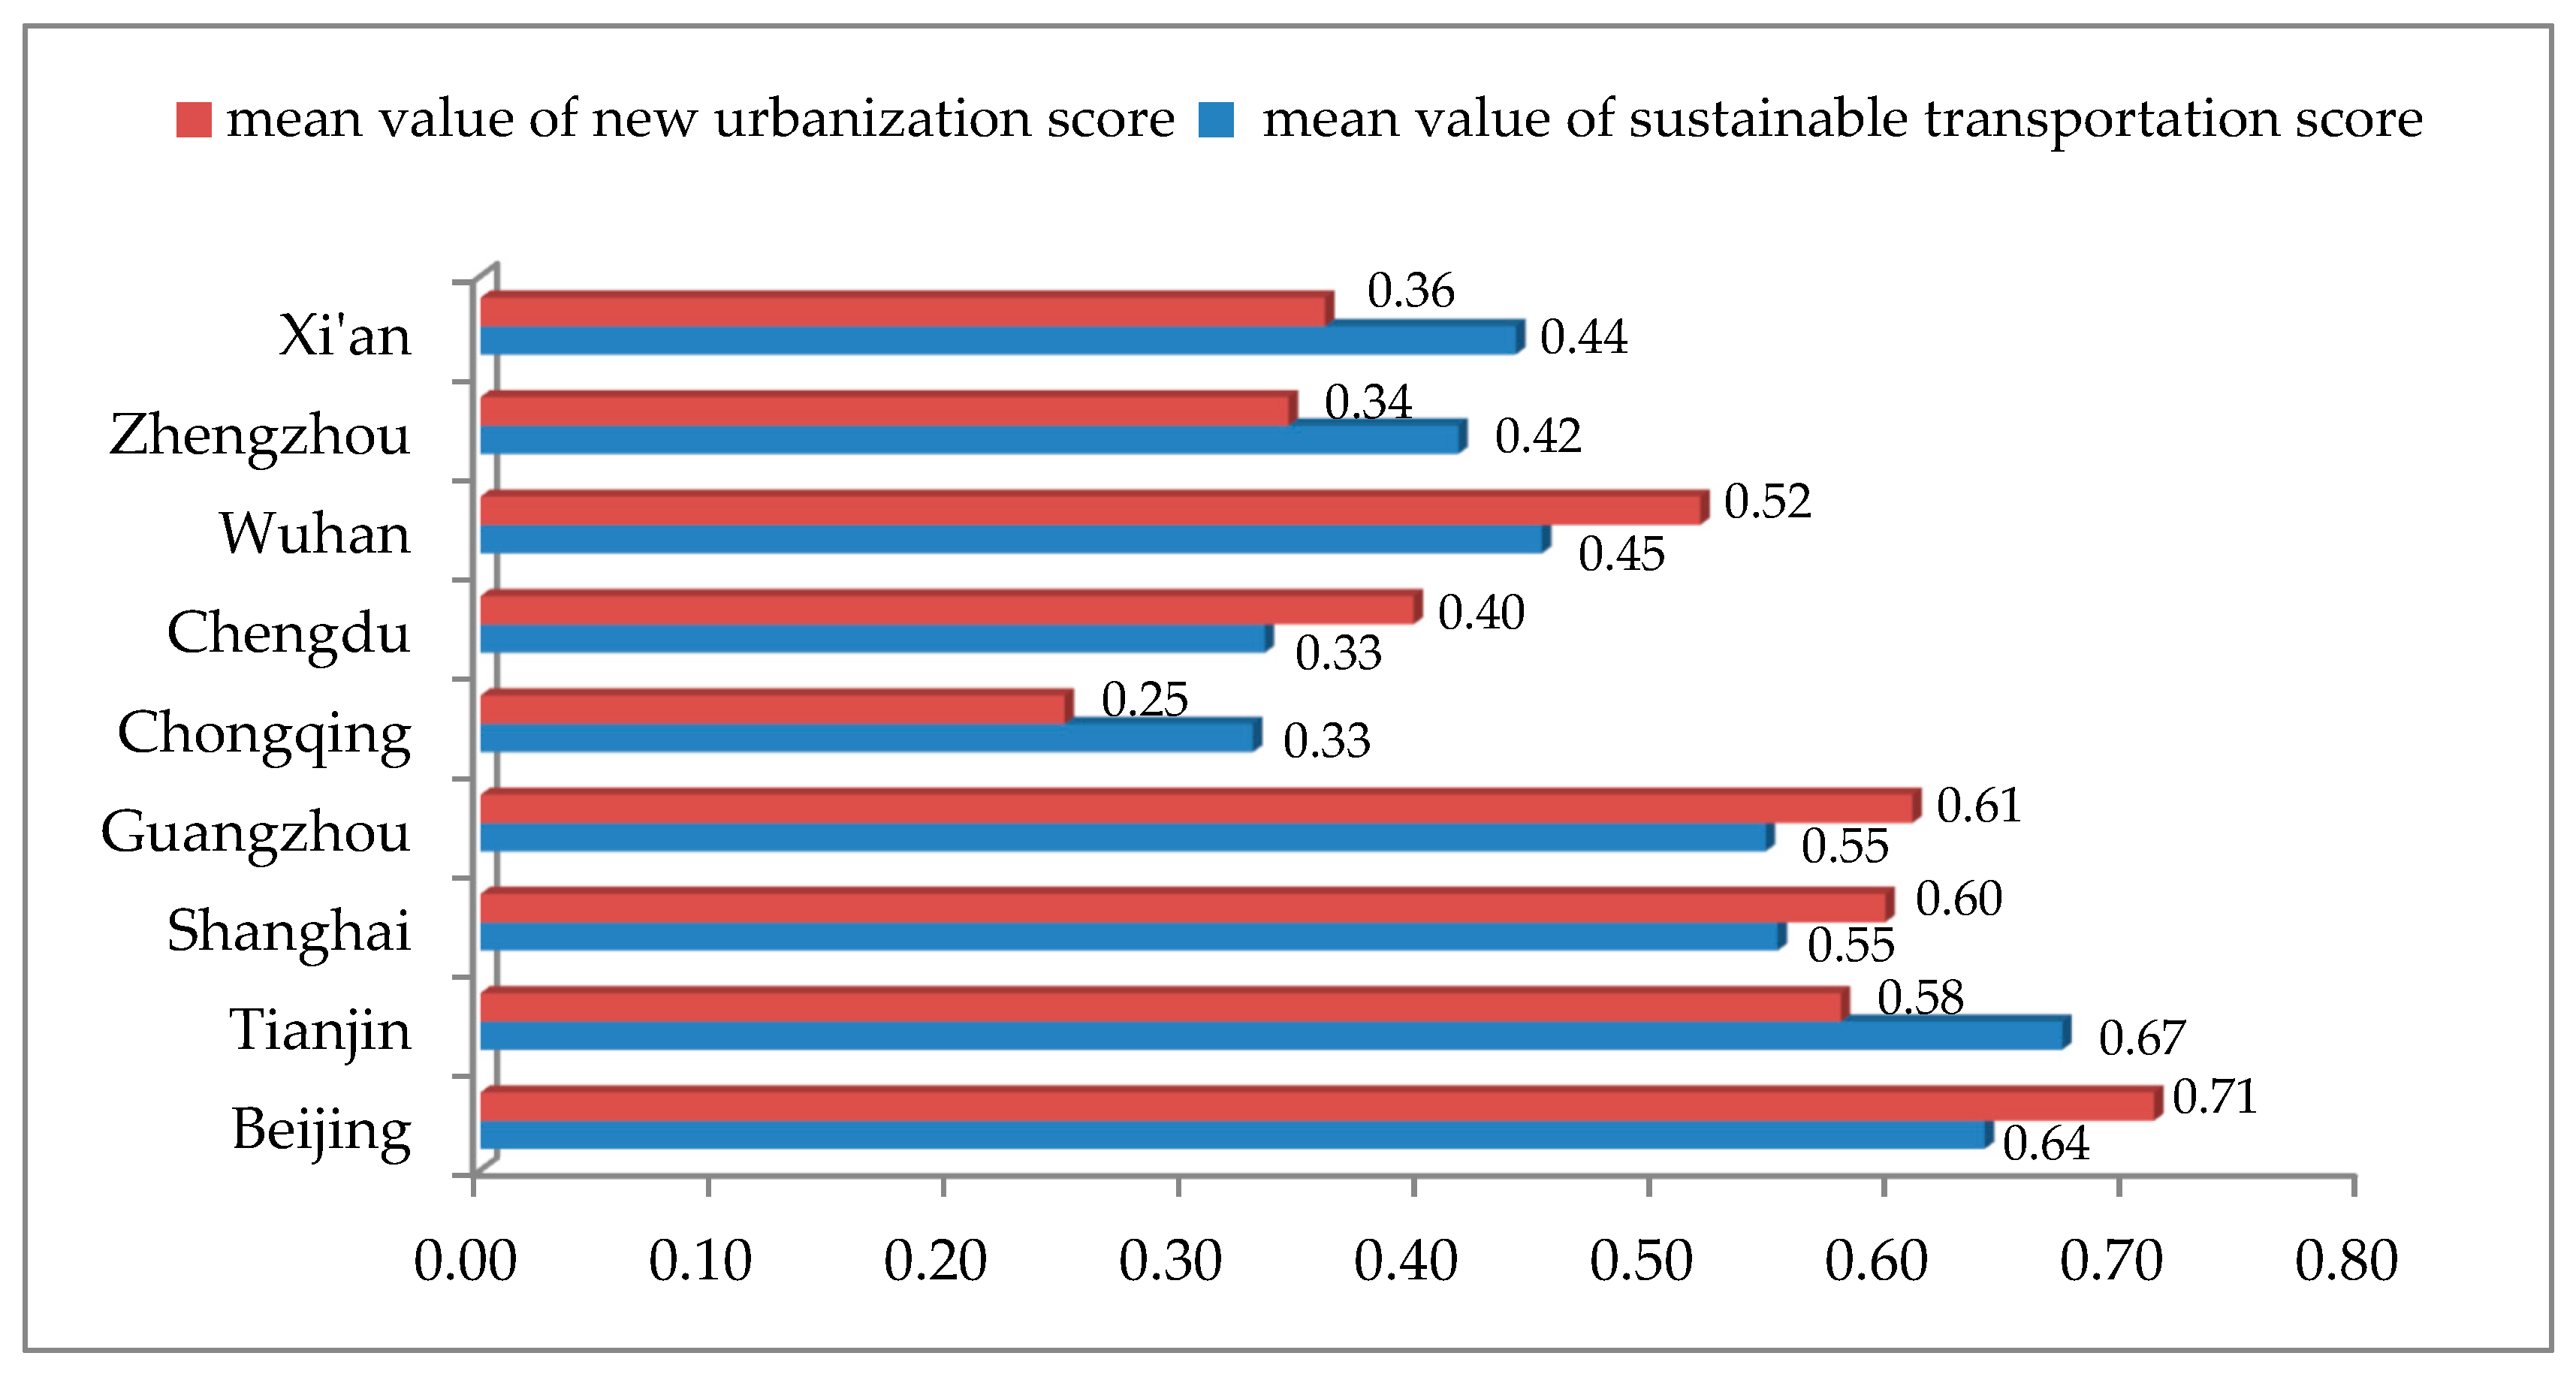
Figure 5). Beijing’s comprehensive new urbanization score fluctuated over time, dropping between 2012 and 2013 from 0.75 to 0.63. However, the value remained higher than the other eight cities in the same year. This indicates that Beijing’s new urbanization growth rate was the highest among the cities. In contrast, the comprehensive new urbanization score for Shanghai declined over time, from a maximum of 0.69 to 0.45. This is because of the large capital investments required to promote new urbanization. Government revenue is insufficient to support this need, and a shortage of construction land in the city also restricted new urbanization.
The new urbanization scores for Chongqing, Chengdu, Zhengzhou, and Wuhan were all small; however, they showed a positive increasing trend over time. This is mainly because these cities are rich in resources and have vast territories. This maximized the advantages of starting later and the rapid promotion of new urbanization. In addition, the new urbanization scores in the eastern cities (Beijing, Tianjin, Shanghai, and Guangzhou) decreased year by year, at a rate of 3.85%. In contrast, the NU scores for the central cities (Zhengzhou, Wuhan) and the western cities (Chongqing, Chengdu and Xi’an) increased, with some fluctuation. The NU growth rate for the central cities was 8.26%, and the NU growth rate for the western cities was 6.32%. This increase was mainly due to the support of national policies over the previous years. The central and western cities were able to maximize their respective advantages to achieve rapid development.
With respect to the comprehensive sustainable transportation score,
Figure 5 shows that the average scores of new urbanization in Beijing, Shanghai, Guangzhou, Chengdu, and Wuhan were greater than the average sustainable transportation scores. That is, sustainable transportation development lagged behind new urbanization. In contrast, for Tianjin, Chongqing, Zhengzhou and Xi’an the development of new urbanization lagged behind sustainable transportation.
3.2. Analysis of Coupling Coordination Degree
Data in
Table 4 and
Table 5 and Formulas (5)–(7) were used to calculate the COP, T and CCD.
Table 6 shows the resulting calculated CCD values and results of the analysis are shown in
Figure 6 and
Figure 7.
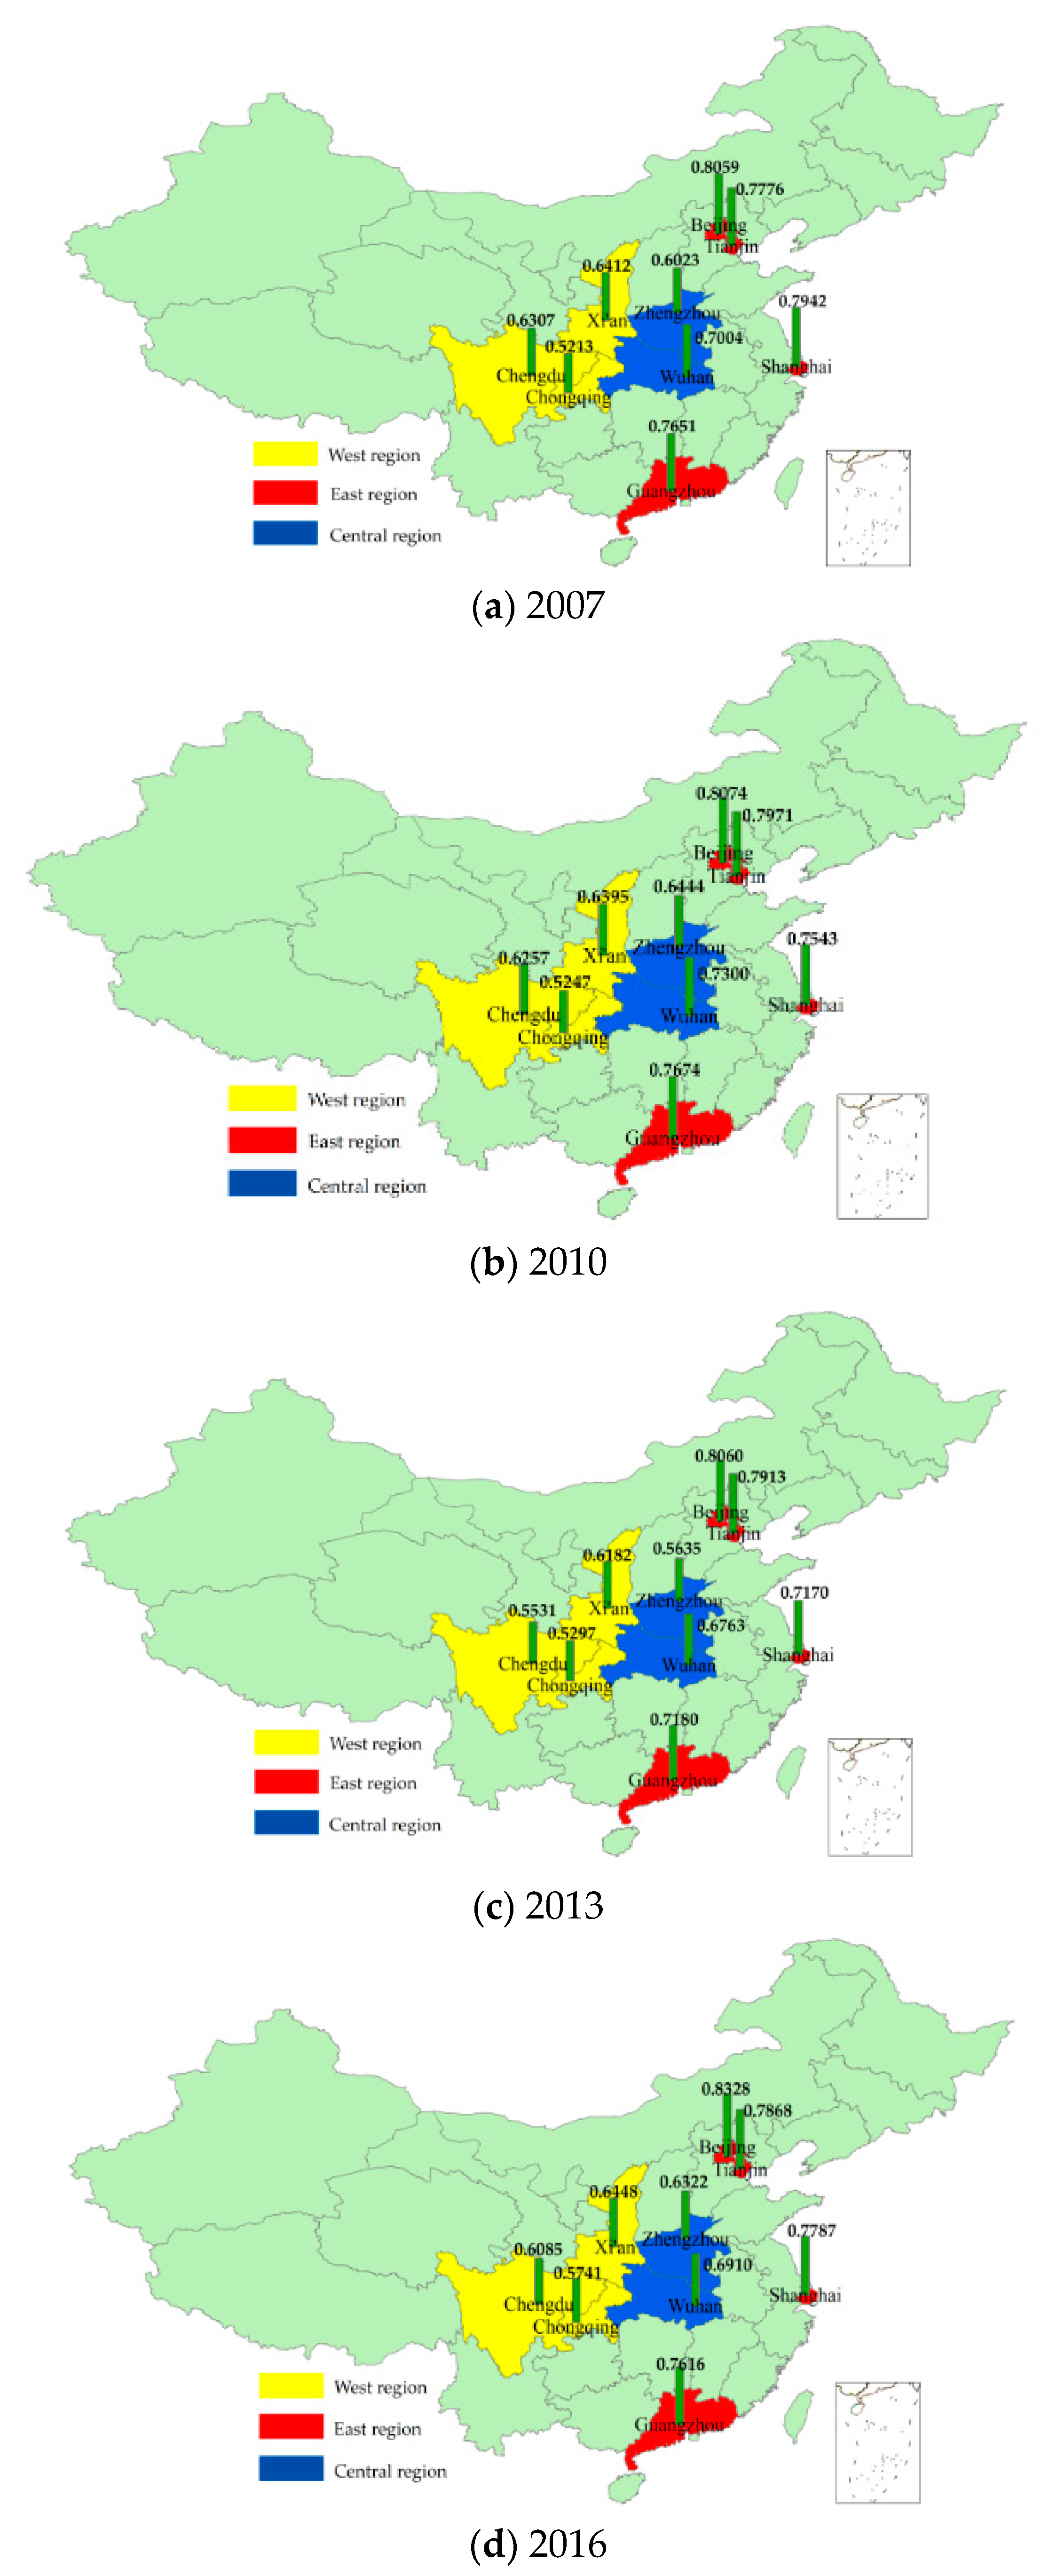
Table 6, and
Figure 6 and
Figure 7, show that the CCD values between NU and ST of three cities (Beijing, Tianjin and Chongqing) exhibited a fluctuating downward trend from 2007 to 2016. The CCD values for Beijing decreased by 2.4%; however, the
CCD values between the two systems consistently remained between 0.80 and 0.84, which is in the good coordination stage. The CCD values for Tianjin fell 1.3% but remained in the intermediate coordination stage. The CCD values for Chongqing decreased by 8.7%, which was in the basic coordination stage before 2014 and then fell into the dysfunctional stage in 2014, demonstrating that new urbanization lagged behind sustainable transportation development.
The CCD values for Shanghai, Guangzhou, Chengdu, and Wuhan all rose at a volatile rate. Shanghai showed a straight upward trend from 2011 to 2016 with a growth rate of 10.13%, representing an intermediate stage of coordinated development. The CCD value growth rate for Guangzhou was 1.3%, also in the intermediate coordination stage. The CCD values for Chengdu grew by 3.17%, developing from a grudging coordination stage to an initial coordination stage. The CCD values for Wuhan grew by 1.5%, developing from the primary coordination stage to the intermediate coordination stage.
The CCD for Zhengzhou was in a consistent state of decline before 2010. However, after 2010, it began to significantly recover and CCD values changed from 0.56 to 0.64, reflecting a change in the two systems from the reluctant coordination stage to the primary coordination stage. In Xi’an, the CCD values first declined and then rebounded, but remained in the primary coordination stage. Based on the location of the metropolises, the sustainable transportation comprehensive score in the eastern cities increased over time, at a growth rate of 6.33% which was consistently higher than the central and western cities. The central cities experienced a downward fluctuating trend, but were consistently higher than the western cities. The CCD values of the western cities experienced slow growth, at a rate of 0.30%. The consistently higher CCD values of the eastern cities highlight the significant differences in new urbanization and sustainable transportation development between the eastern, western, and central cities.
3.3. GM(1, 1) Prediction Result Analysis
Formula (8) was used to calculate the grade ratio of the CCD time series in the eastern, central and western cities, which are shown in
Table 7. The results indicate that the ratios of the three time series fell between 0.83 and 1.20. As such, the GM(1, 1) model could be used to make predictions.
After the tests above, the time series data were inserted into Formulas (9)–(11), resulting in the following three prediction models for the eastern, western, and central cities, respectively:
where
. The cumulative prediction values
of each year were calculated using the models, subtracting the sequence
to obtain the sequence
,
.
The predicted sequences
and
were substituted into Formulas (11) and (12), and the applicability of the model was verified. The results are shown in
Table 8.
Table 8 shows that the grade ratio deviations of Model 1, Model 2, and Model 3 were all less than 0.1. Model 1 and Model 2 residuals were both less than 0.1, making those models more satisfactory. As such, the models could be applied to predict the coordination degree of the three regions.
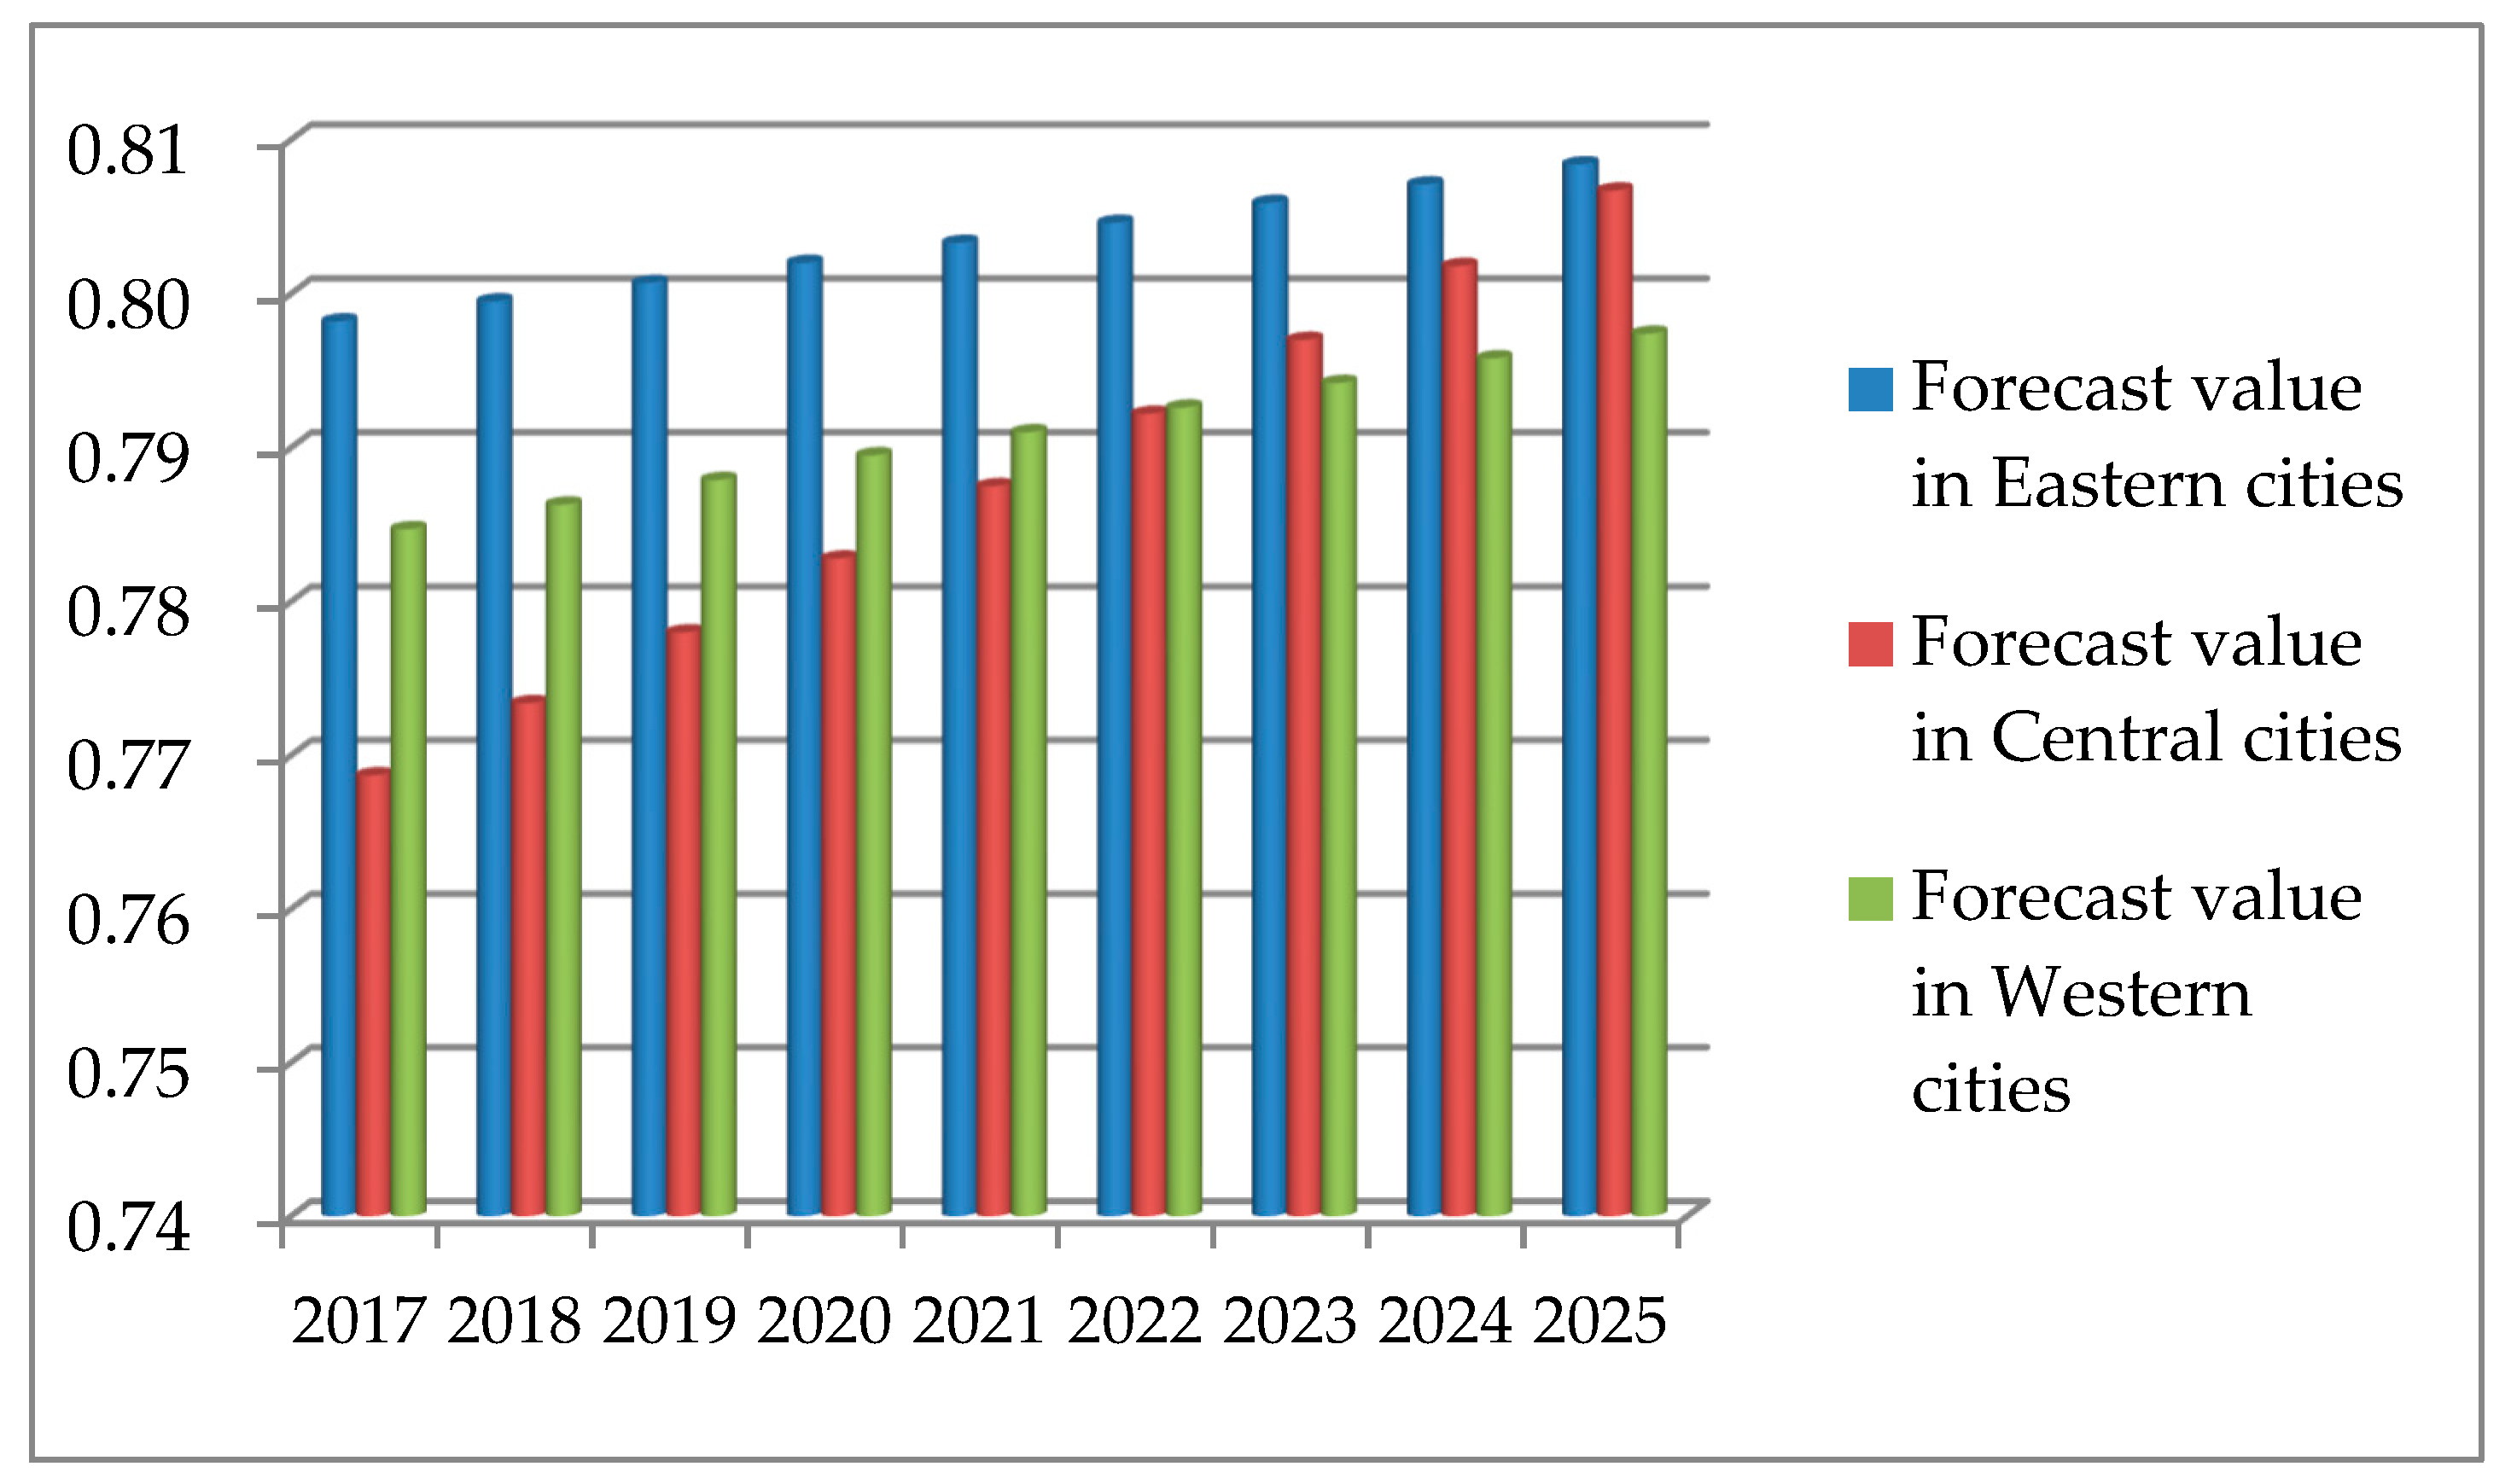
Table 9 and
Figure 8 show the prediction results.
Figure 8 shows a general annual decrease in the coordination gap between the eastern Cities, the central Cities and the western Cities with respect to NU and ST. In 2025, the coupling coordination degree of each region is predicted to reach 0.79, 0.80; when the two systems will be in the intermediate coordination stage, and regional balanced development will be achieved. This is mainly driven by Beijing, Tianjin, Shanghai, Guangzhou, and the other areas considered to be national first-tier cities, which have the opportunities needed to attract a large number of talented people from across the country.
Although NU has developed rapidly, urban–rural development is not synchronous in China. Some small towns and village governments have insufficient capital investment and weak infrastructure. These result in many migrants moving into larger towns, causing urban housing to become denser and road travel volumes to increase sharply. This creates significant pressure for urban traffic. Urban scale development cannot provide sufficient support for transportation infrastructure, hindering coordinated development between NU and ST.
Zhengzhou and Wuhan are important transportation hubs in China and are industrial and scientific education centers. These cities rely on their own geographical advantages, which play a leading role in the development of the central cities. In the past few years, Zhengzhou and Wuhan have accelerated inter-city transportation construction, vigorously developing their advantages in transportation, education, medical care, and other public resources. The rapid development of public transportation, and its national policy support, has also accelerated the speed of new urbanization in the central cities.
The Western Cities have rich historical and cultural resources and relatively low labor costs. In recent years, these cities have been strengthening their economic cooperation, seeking group development opportunities, maximizing their advantages, and increasing the level of new urbanization, all of which cause the western cities to show a more balanced development trend when compared to the eastern and central cities.
4. Conclusions and Implications
This study constructed a CCD model to explore the symmetrical coupling between NU and ST. Specifically, it used nine metropolises in China as a case study. The results showed that the CCD values in each city followed different trends. The CCD values of the eastern cities (Beijing, Tianjin, Shanghai, Guangzhou), western cities (Chongqing, Chengdu and Xi’an), and central cities (Zhengzhou and Wuhan) all exhibited growth trends. The western cities had the highest growth rate. Finally, based on the GM(1, 1) model, this study predicted that the CCD values of NU and ST in the eastern, central and western cities will be very similar by 2025, with the eventual achievement of balanced development across all of China’s regions. Based on the above findings, this study concludes with the following recommendations.
The current level of new urbanization in central cities and the western cities remains below that of the eastern cities. This is because of the rapid economic development of the eastern cities, the ability to attract talent from different industries, regional advantages, and their strong economic development. For these cities, promoting the urbanization of migrant workers is needed to improve the new urbanization level. These cities can learn from the series of policies and measures promoted by the state to promote population movement to urban areas. This includes giving migrant workers the same rights as urban citizens. Further, promoting regional industrial reform, developing non-agricultural industries, and improving agricultural modernization also require particular focus. In addition, compared with the eastern cities, the central and western cities have a deep cultural background. These local and regional cultures can be integrated to promote new urbanization. For the eastern cities, the level of new urbanization is relatively high, but there remain some problems such as the urban heat island effect, urban traffic congestion and environmental degradation. Therefore, in the development process, there should be a focus on protecting the urban environment and resources, promoting the construction of urban ecological civilizations, increasing the use of environmentally sustainable energy, and enriching urban public transport. Furthermore, appropriate urban land use policies should be formulated to save land and more intensively and efficiently use public resources.
Urban sustainable transportation plays an important role in constructing new urbanization. The degree of responsivity in the traffic network infrastructure determines the travel mode selected by urban residents. The more responsive urban public transportation is, the more likely public transportation will become the main travel mode, and the easier it is to establish an urban sustainable transportation system. The analysis presented here shows that the urban sustainable transportation level remains low in the central and western cities. These areas should take necessary measures to establish a framework for urban sustainable transportation, further enlarge the scale of public transportation, and establish a diversified urban public transportation system. Eco-driving, which can effectively reduce the emission of traffic pollutants without reducing the speed of vehicles should be promoted vigorously. In addition, developing an urban intelligent communication system, and combining advanced science and technology in urban transportation planning could more effectively reduce traffic accidents and improve transportation safety.
The coordinated development of new urbanization and urban sustainable transportation requires considering sustainable transportation while engaging in urban layout design and management. The shape, density, and development planning for a city significantly impacts travel behavior and the way people use cars. Compact and corridor-oriented urban development is more likely to achieve sustainable urban transportation. The spatial distribution of urban transportation infrastructure affects how urban residents select their main travel modes. If the work area is not far from the residential area and public transportation is sufficiently convenient, people will prefer to use public transportation or bicycles. This can effectively alleviate urban traffic congestion. At the same time, reducing private cars and developing new energy public transportation will effectively alleviate urban environmental pollution and other problems. These actions can also help achieve new urbanization and sustainable urban development. Therefore, combining a rational urban spatial layout with a more perfect urban public transportation system, and applying information technology in transportation to establish a reasonably intelligent urban transportation system achieves many positive outcomes. The integration can effectively reduce traffic congestion, improve environmental quality, and achieve the goal of sustainable transportation and social sustainability.
This study focused on exploring the coupling coordination relationship between new urbanization and sustainable transportation for nine national metropolises, and predicted the CCD in eastern, central and western cities. We aimed to quantify the relationship between new urbanization and sustainable transportation and provide some policy recommendations for the coordinated development of the two systems. However, with the repaid development of urban economies and social progress, the meaning of new urbanization will evolve to keep pace with the times. This may change the corresponding evaluation indicators. Future research should further study the mechanism between new urbanization and sustainable transportation, identify the factors that hinder their coordinated development, and provide additional theoretical context to support the coordinated development of the two systems.


