Compression Shear Properties of Adhesively Bonded Single-Lap Joints of C/C Composite Materials at High Temperatures

Abstract
:1. Introduction
2. Materials and Methods
2.1. Specimen Materials
2.1.1. Adherend
2.1.2. Adhesive
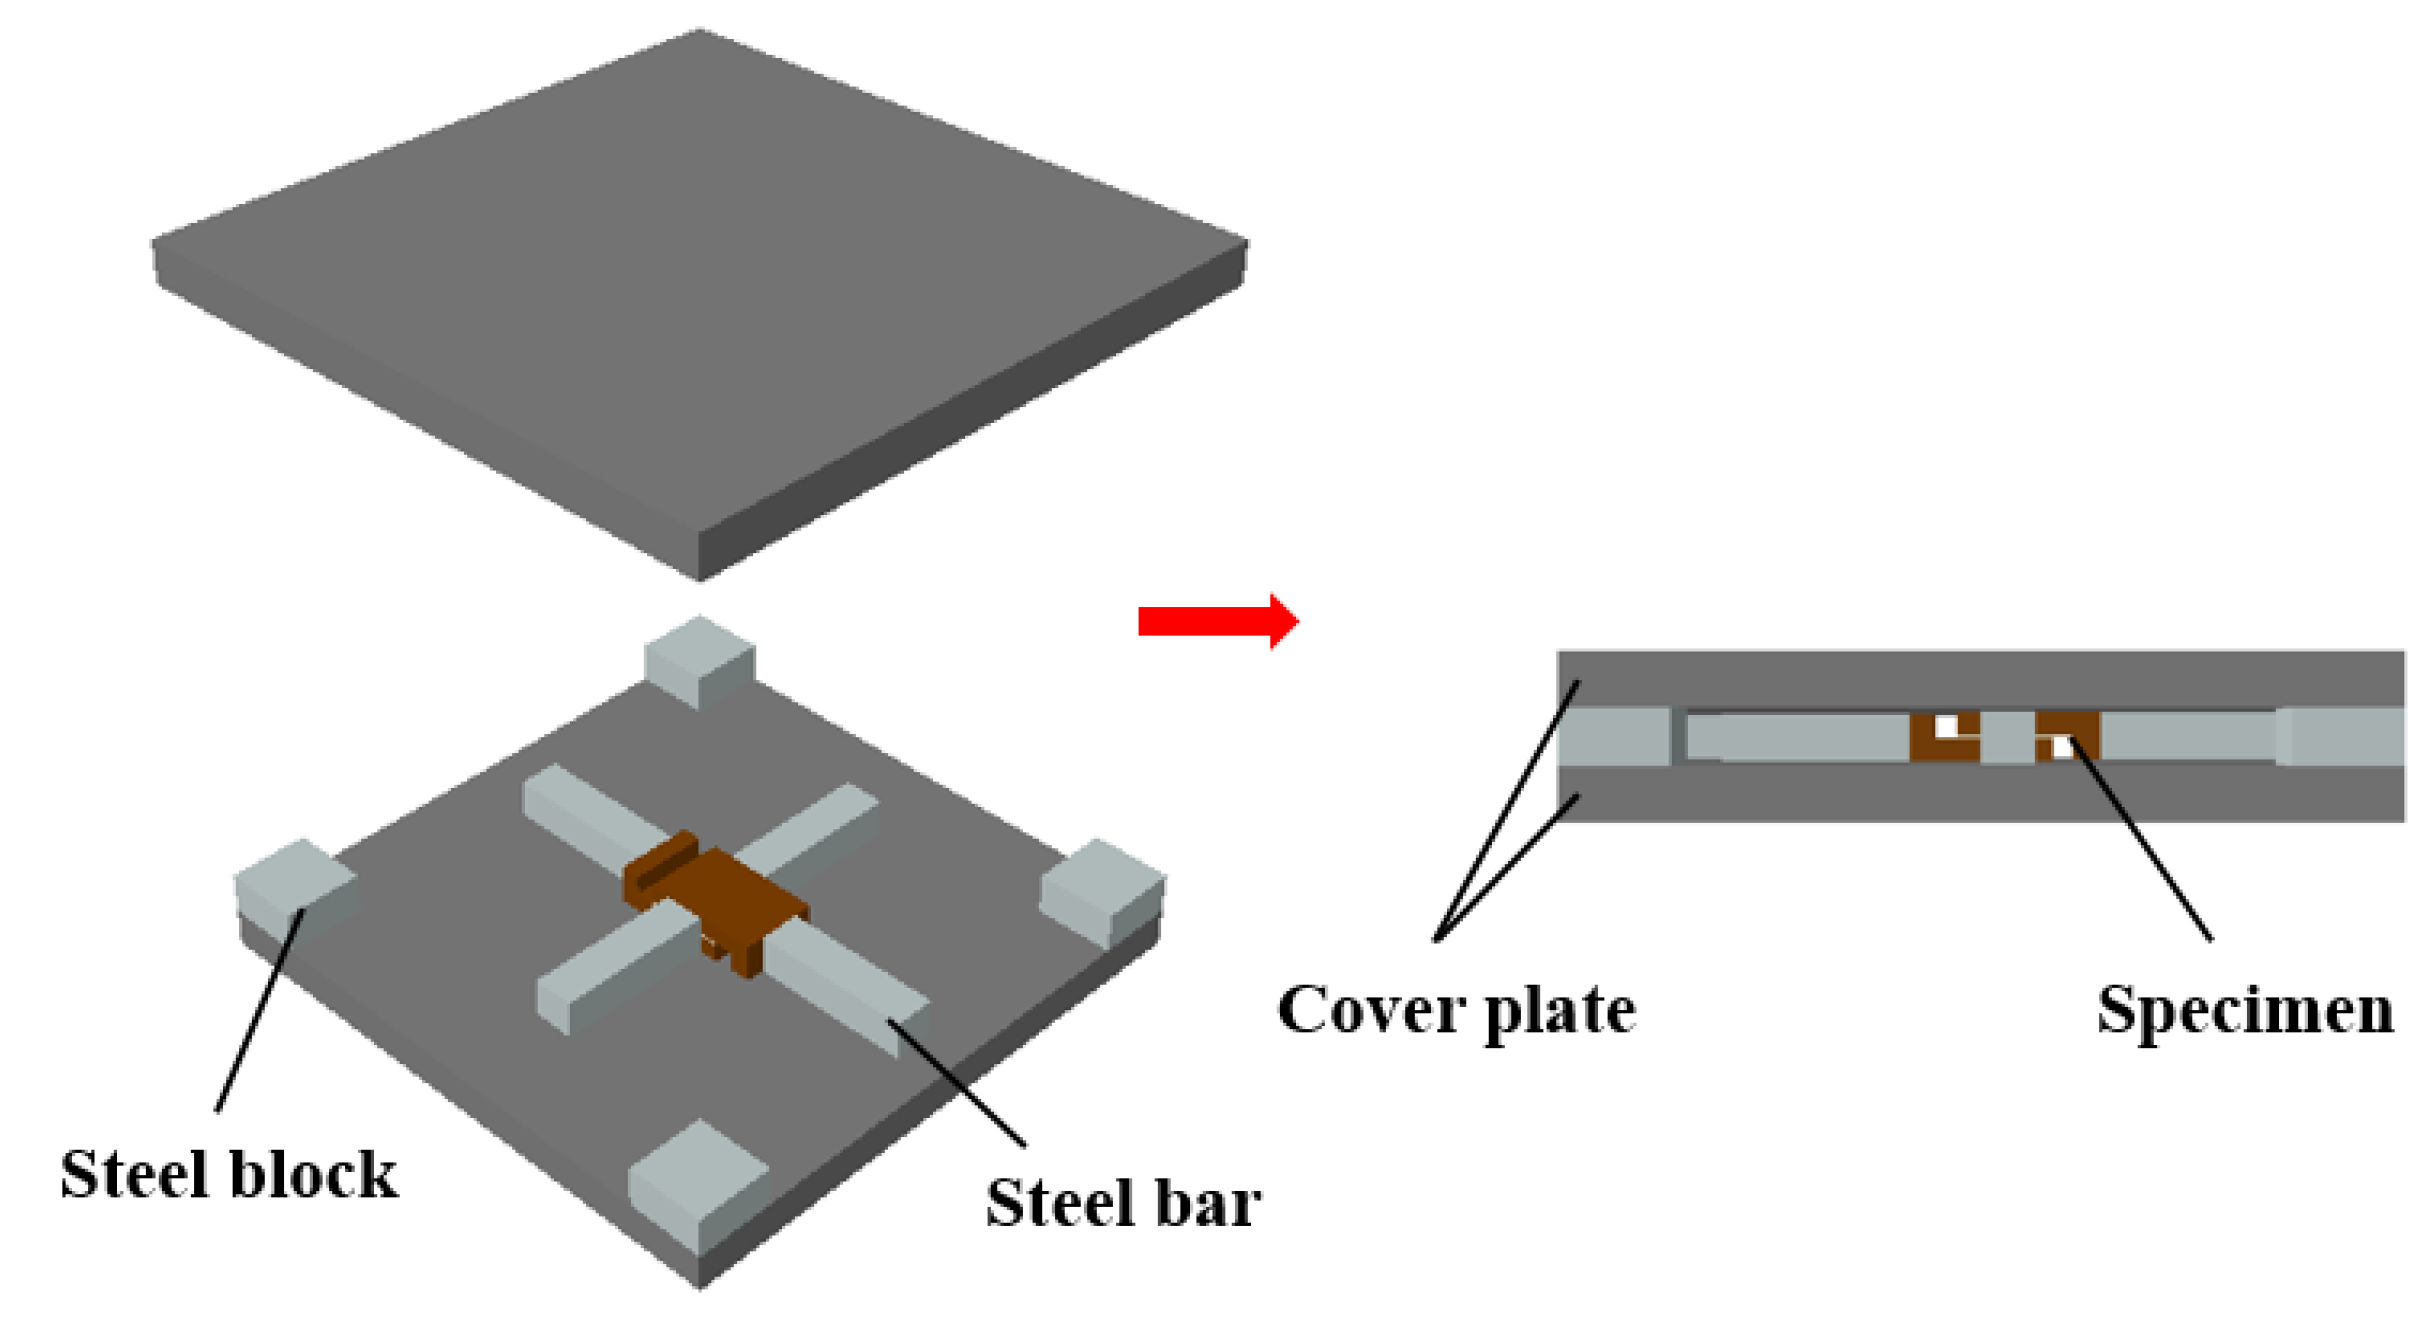
2.1.3. Assembly
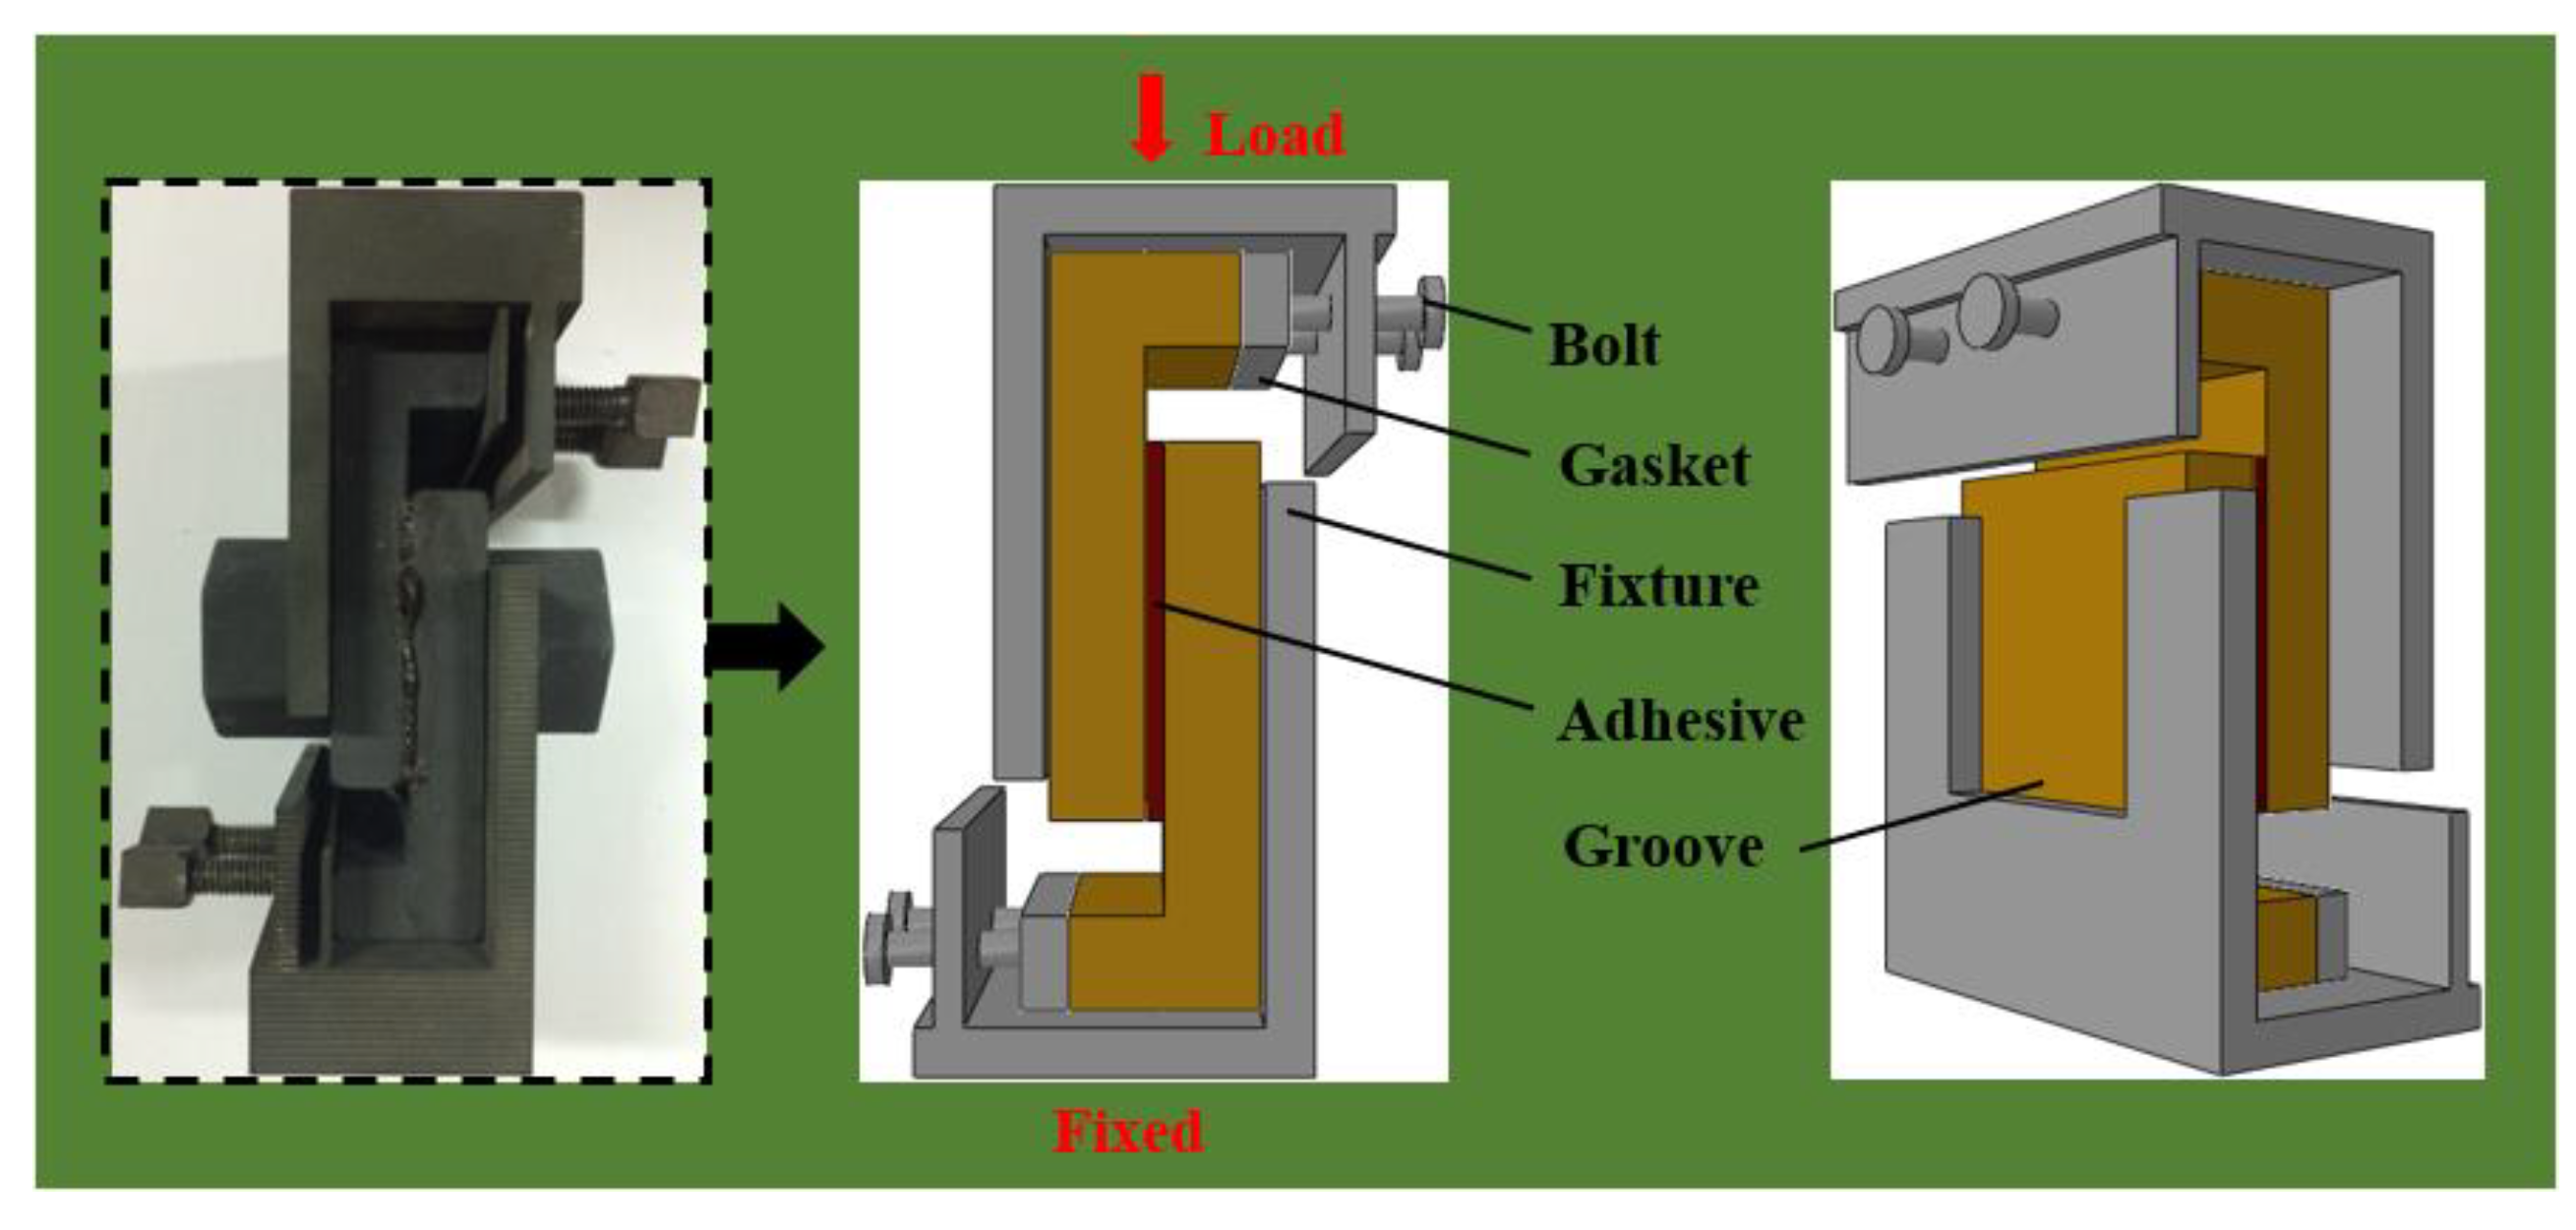
2.1.4. Fixture
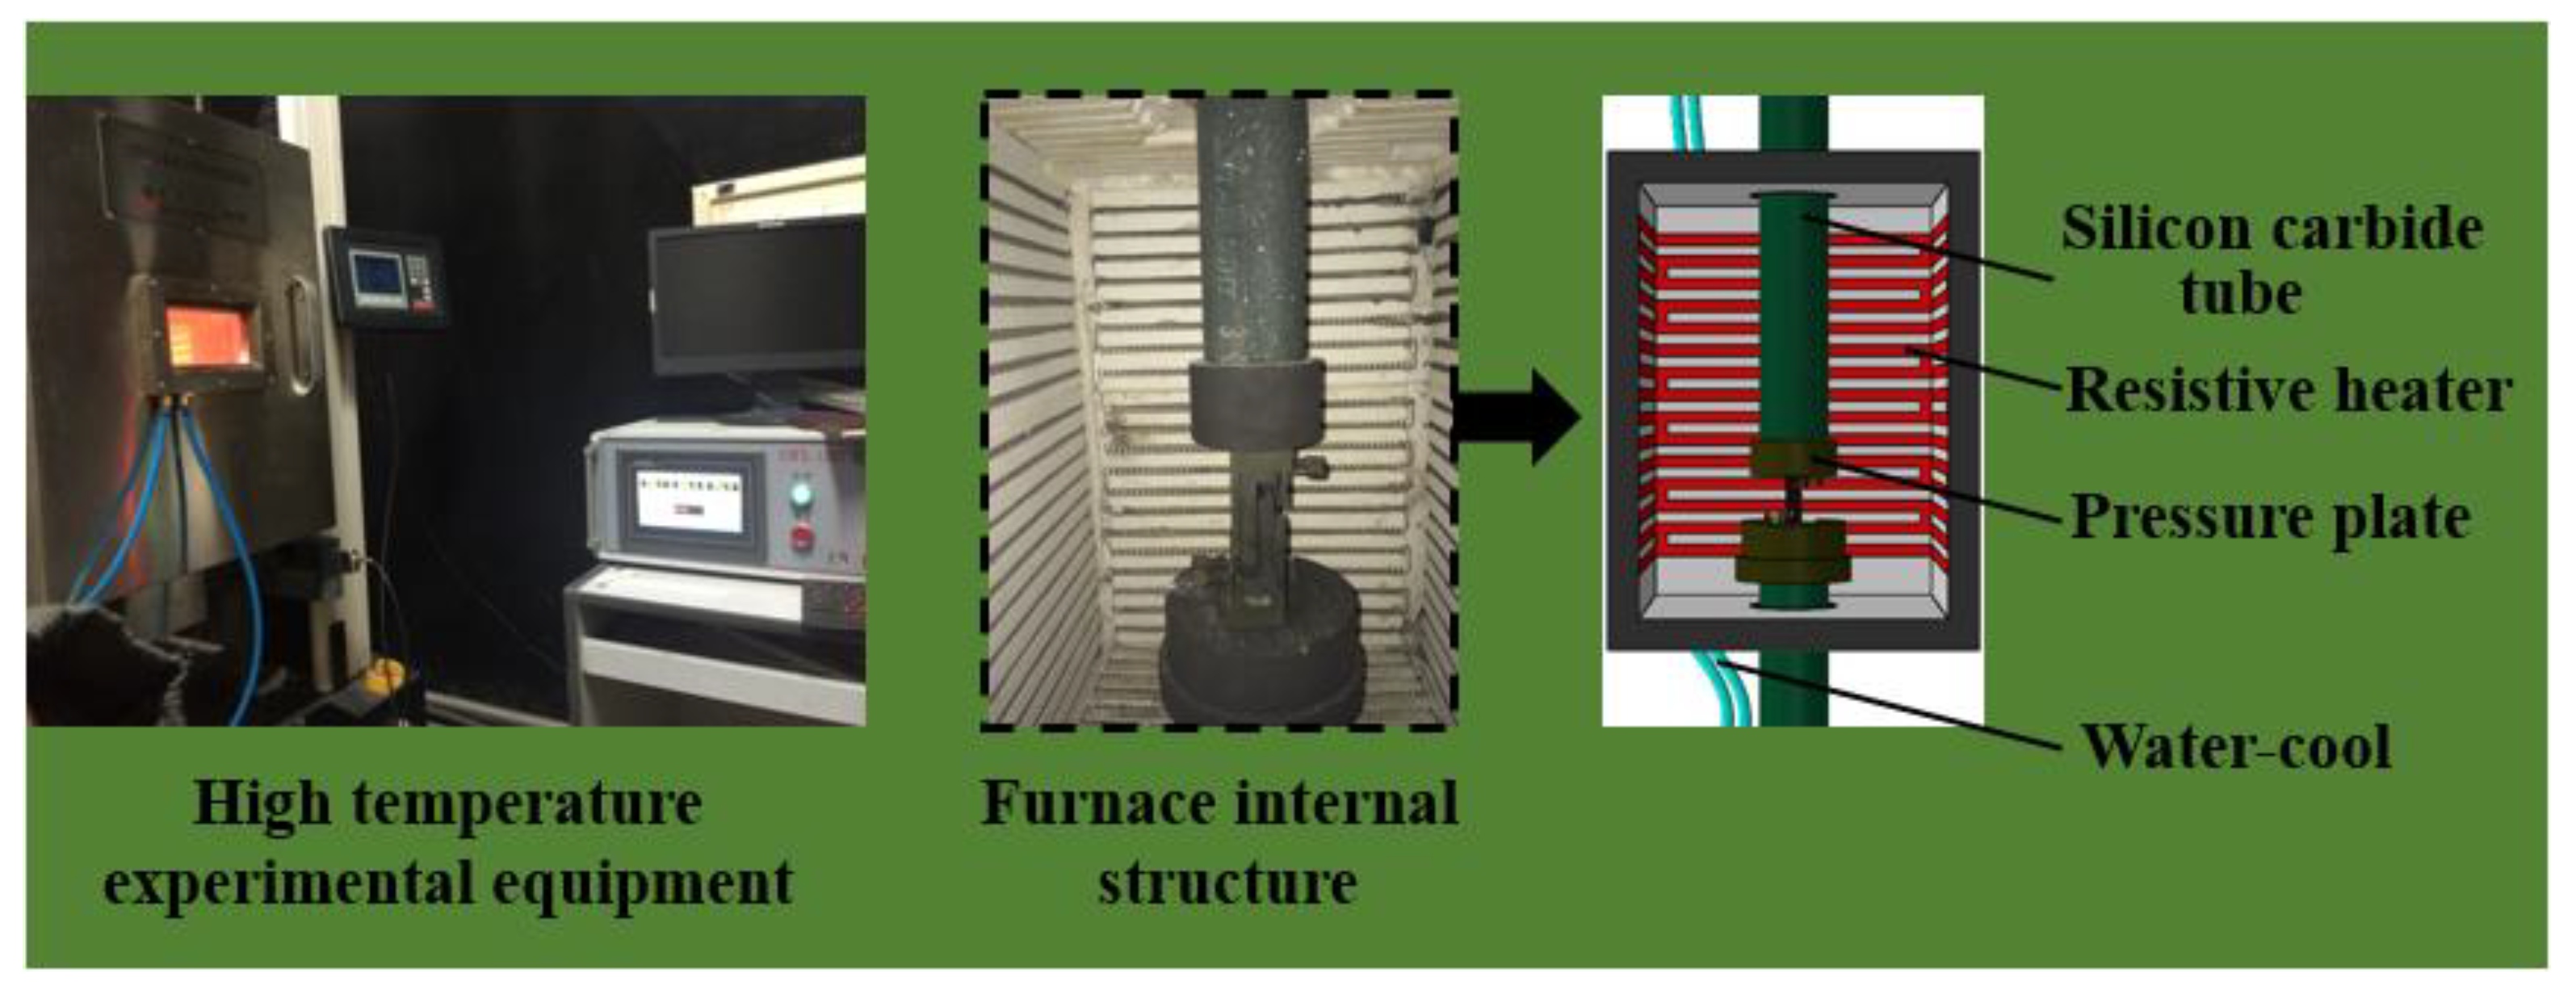
2.2. Test Process
2.3. Finite Element Analysis
2.3.1. Model Establishment
2.3.2. Failure Criteria
3. Results and Discussion
3.1. Failure Analysis
3.1.1. Damage Mode
3.1.2. Comparison of Test Results and Finite Element Results
3.1.3. Progressive Damage and Stress Distribution
3.2. Influencing Factors
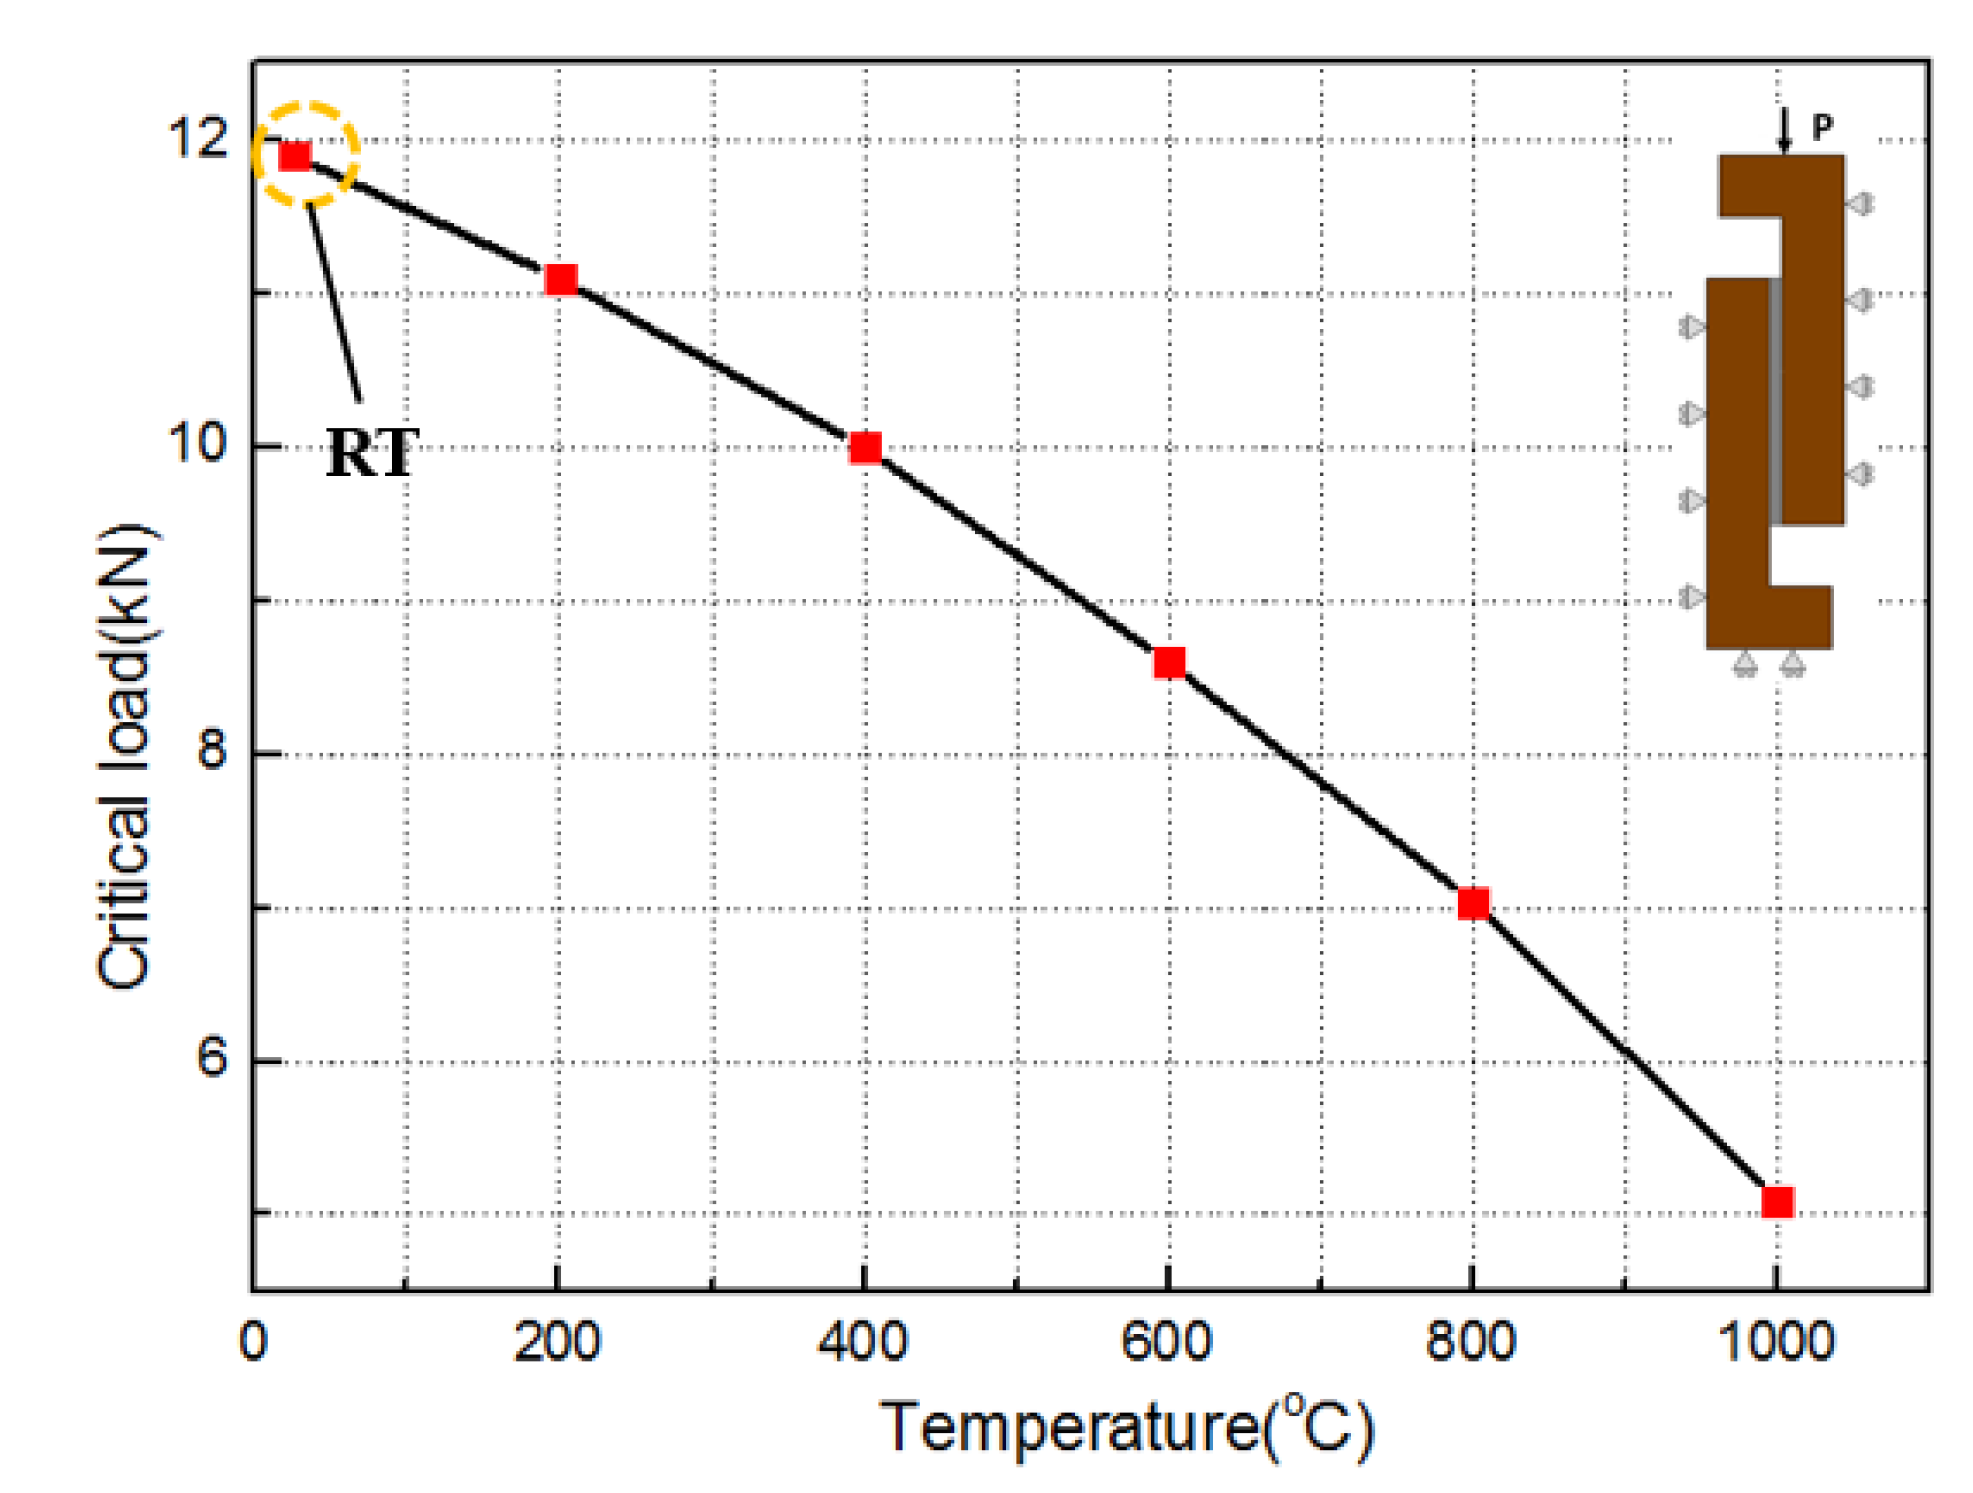
3.2.1. Temperature
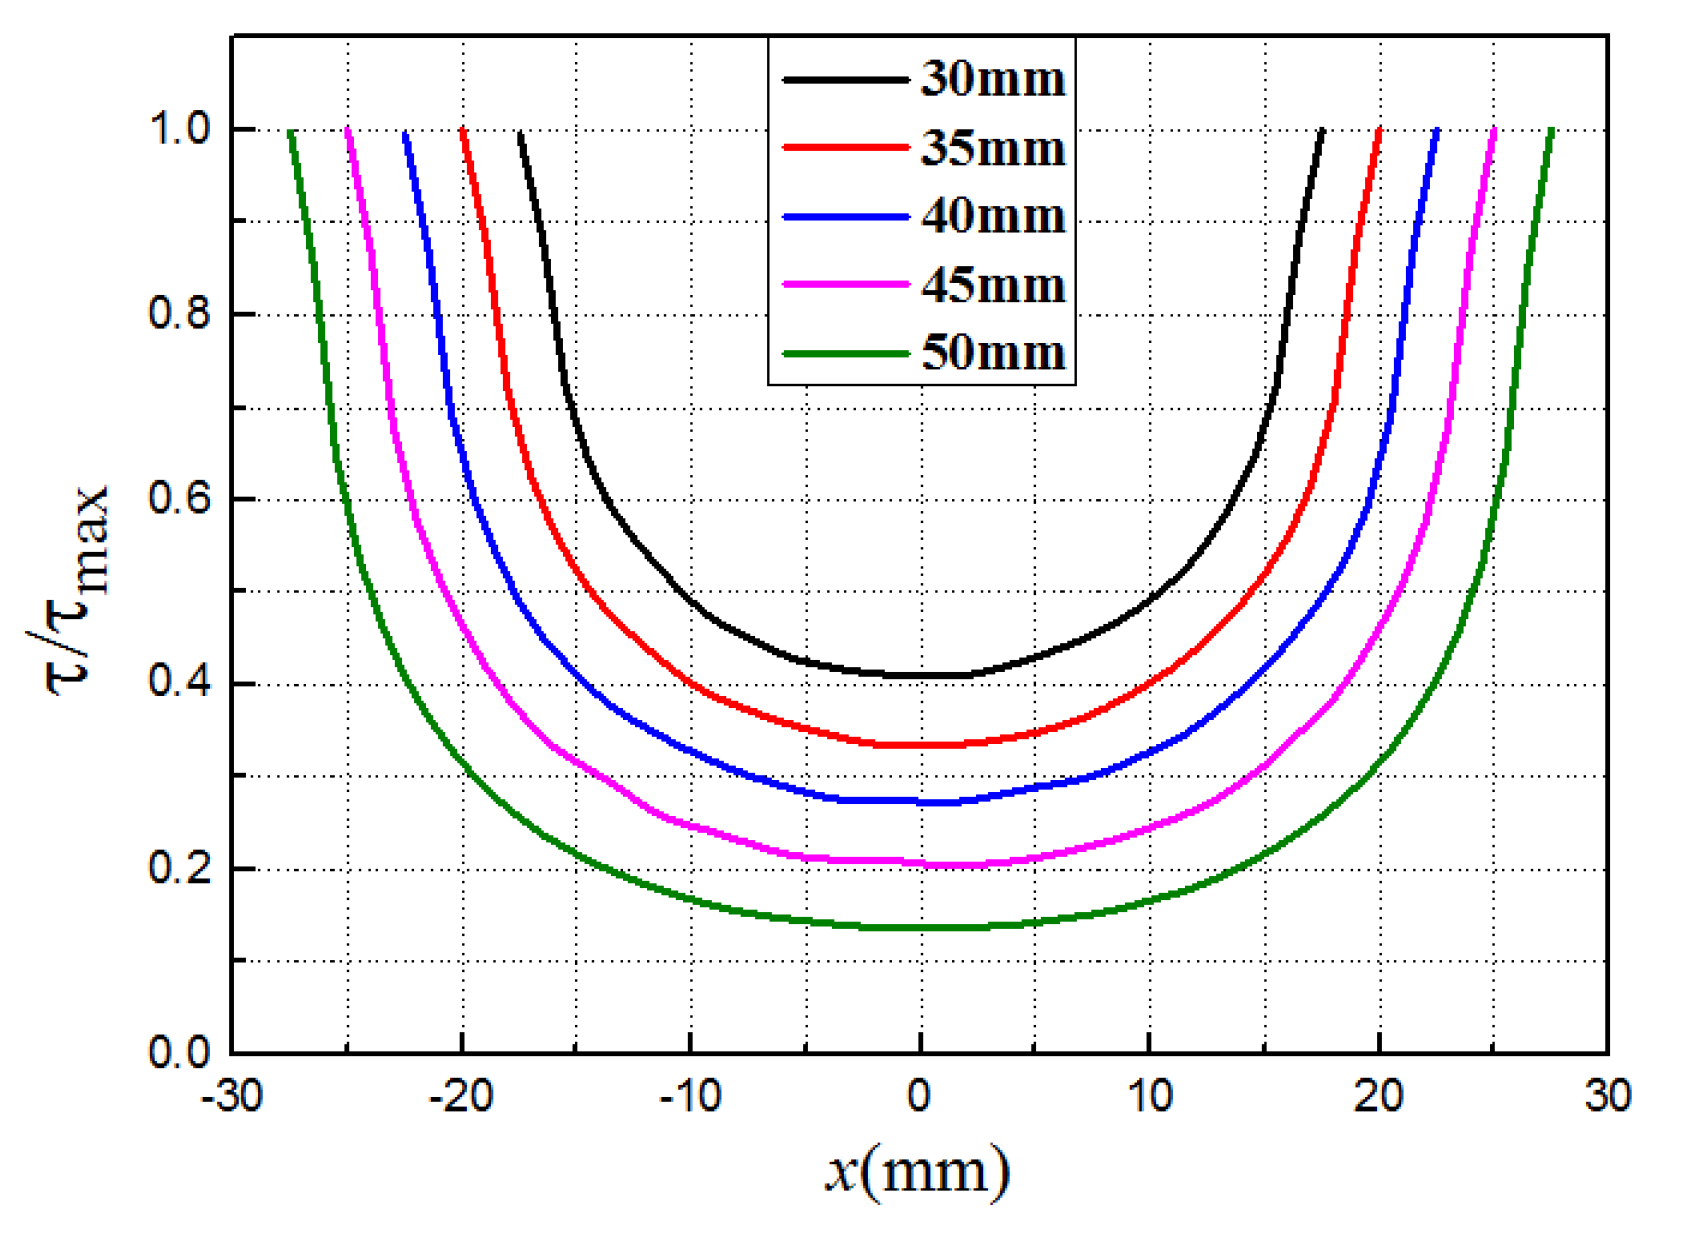
3.2.2. Overlapped Length
4. Conclusions
- (1)
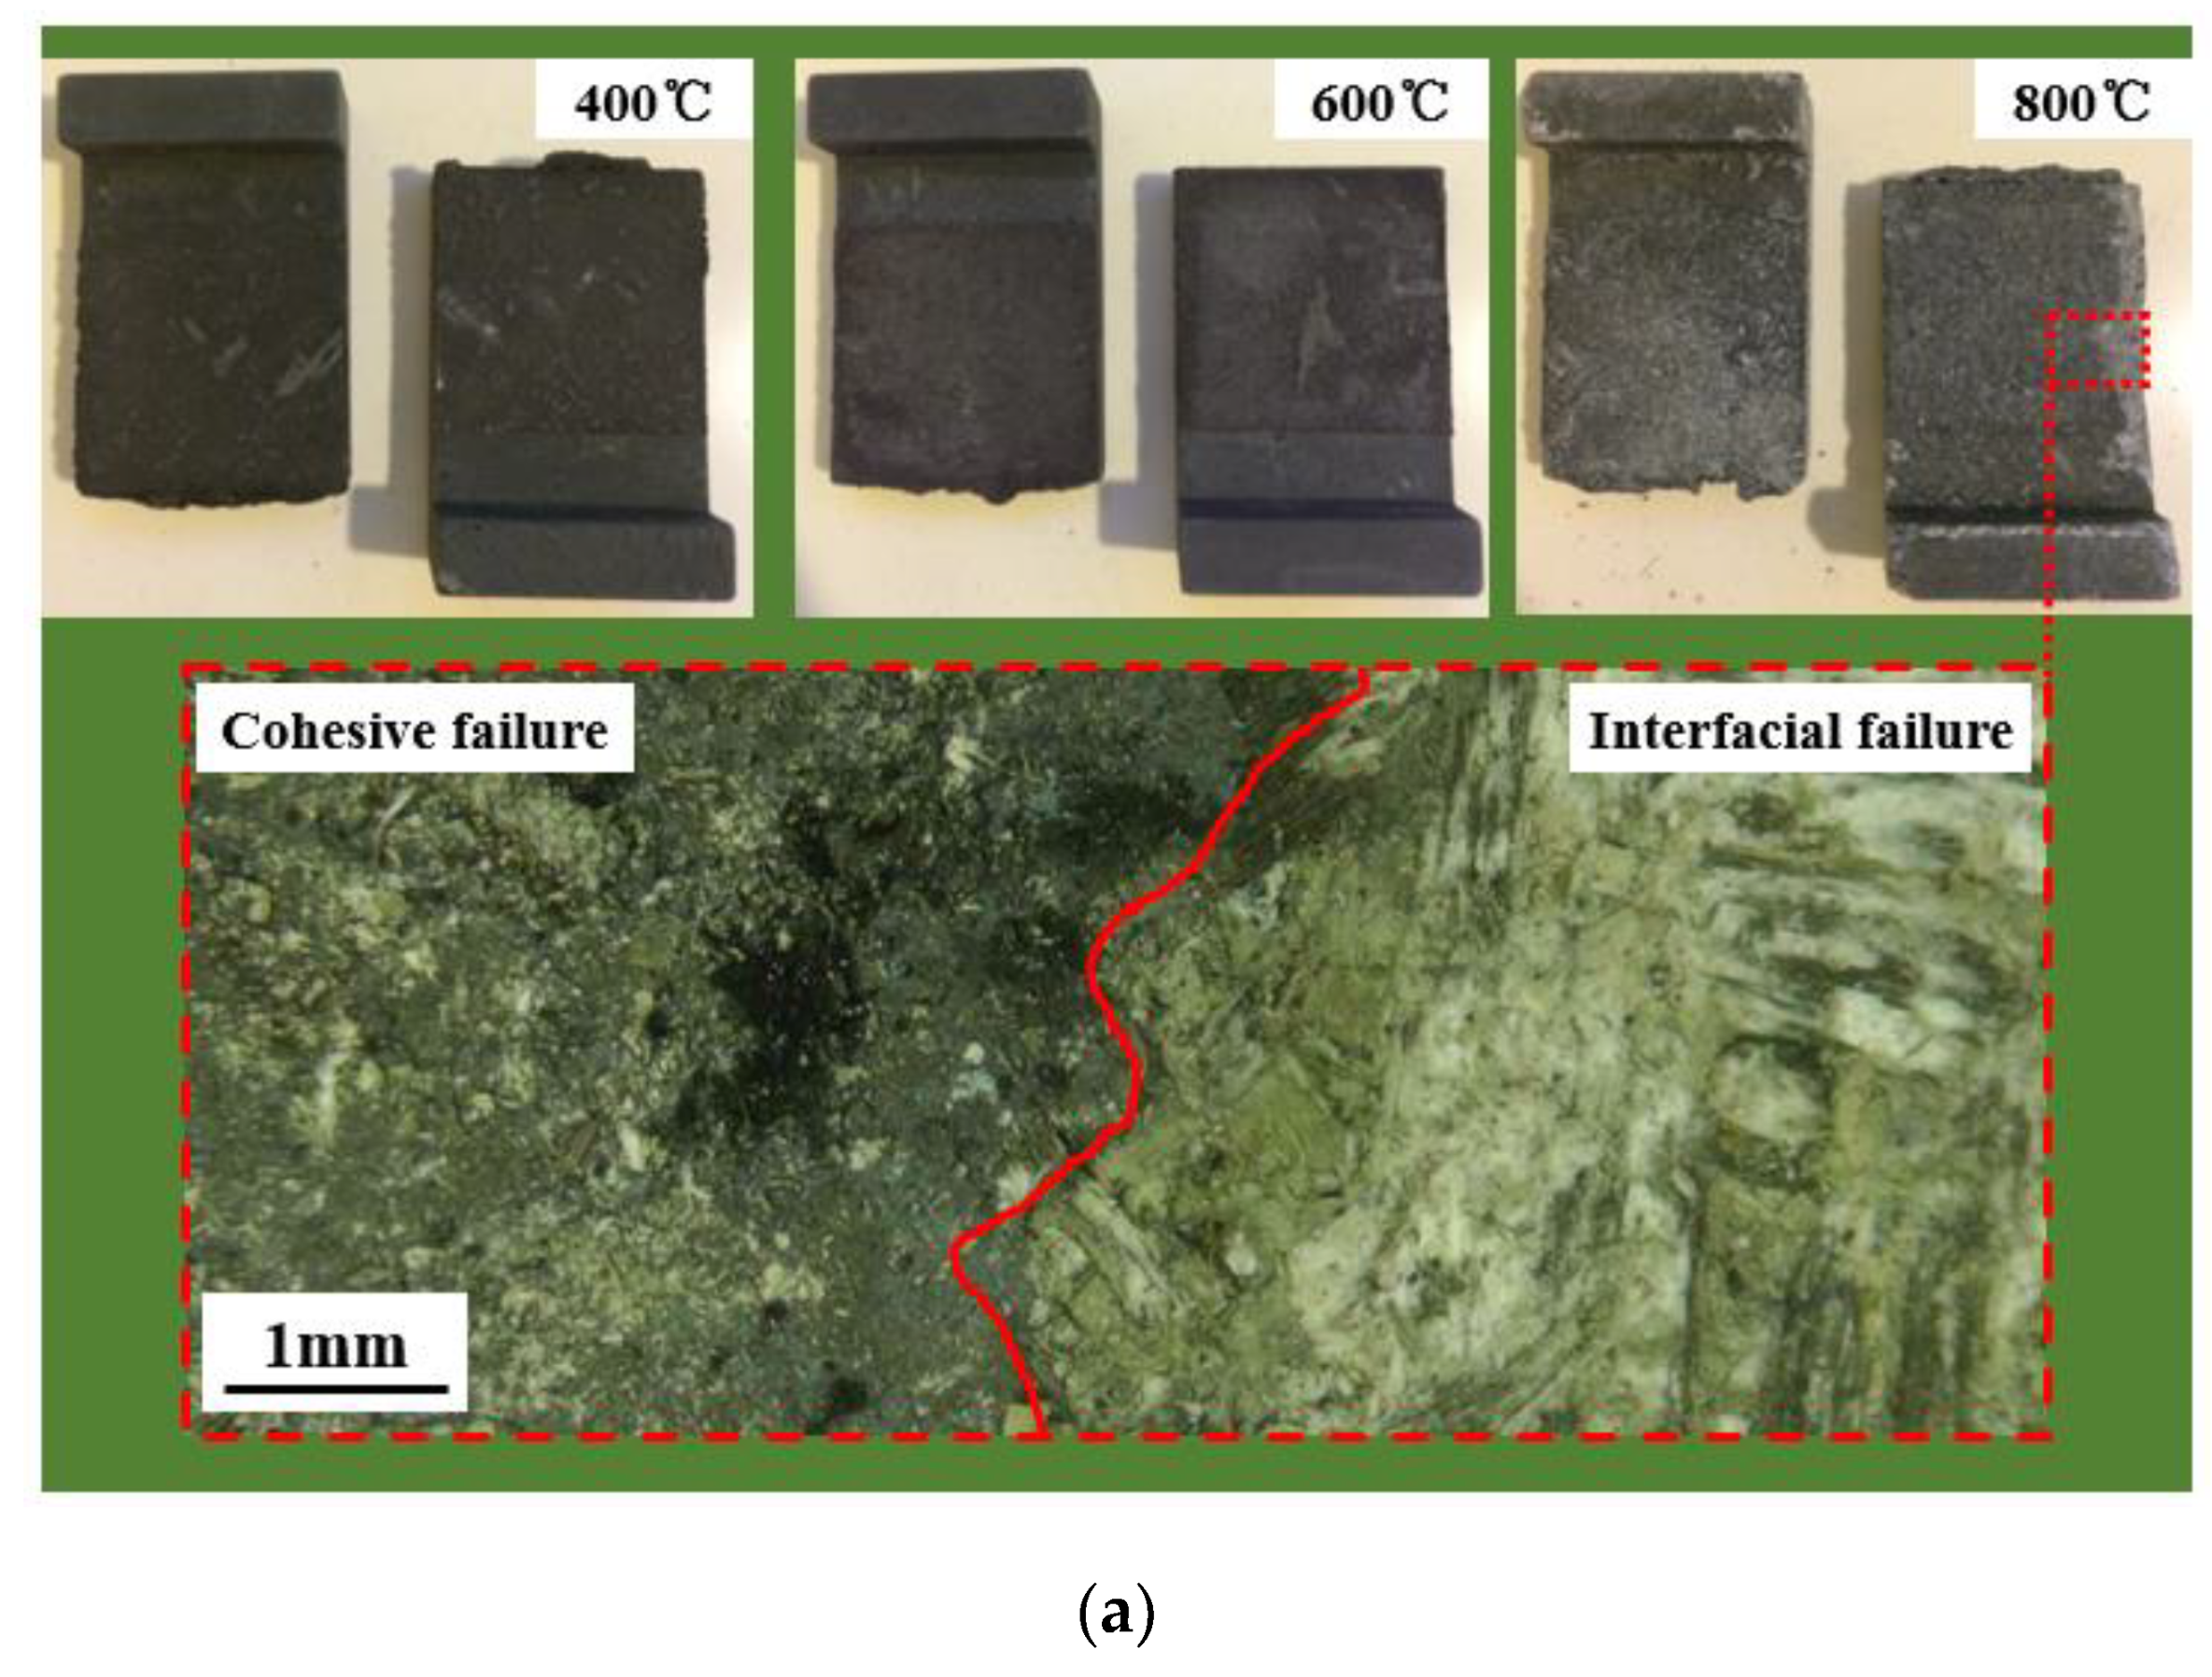
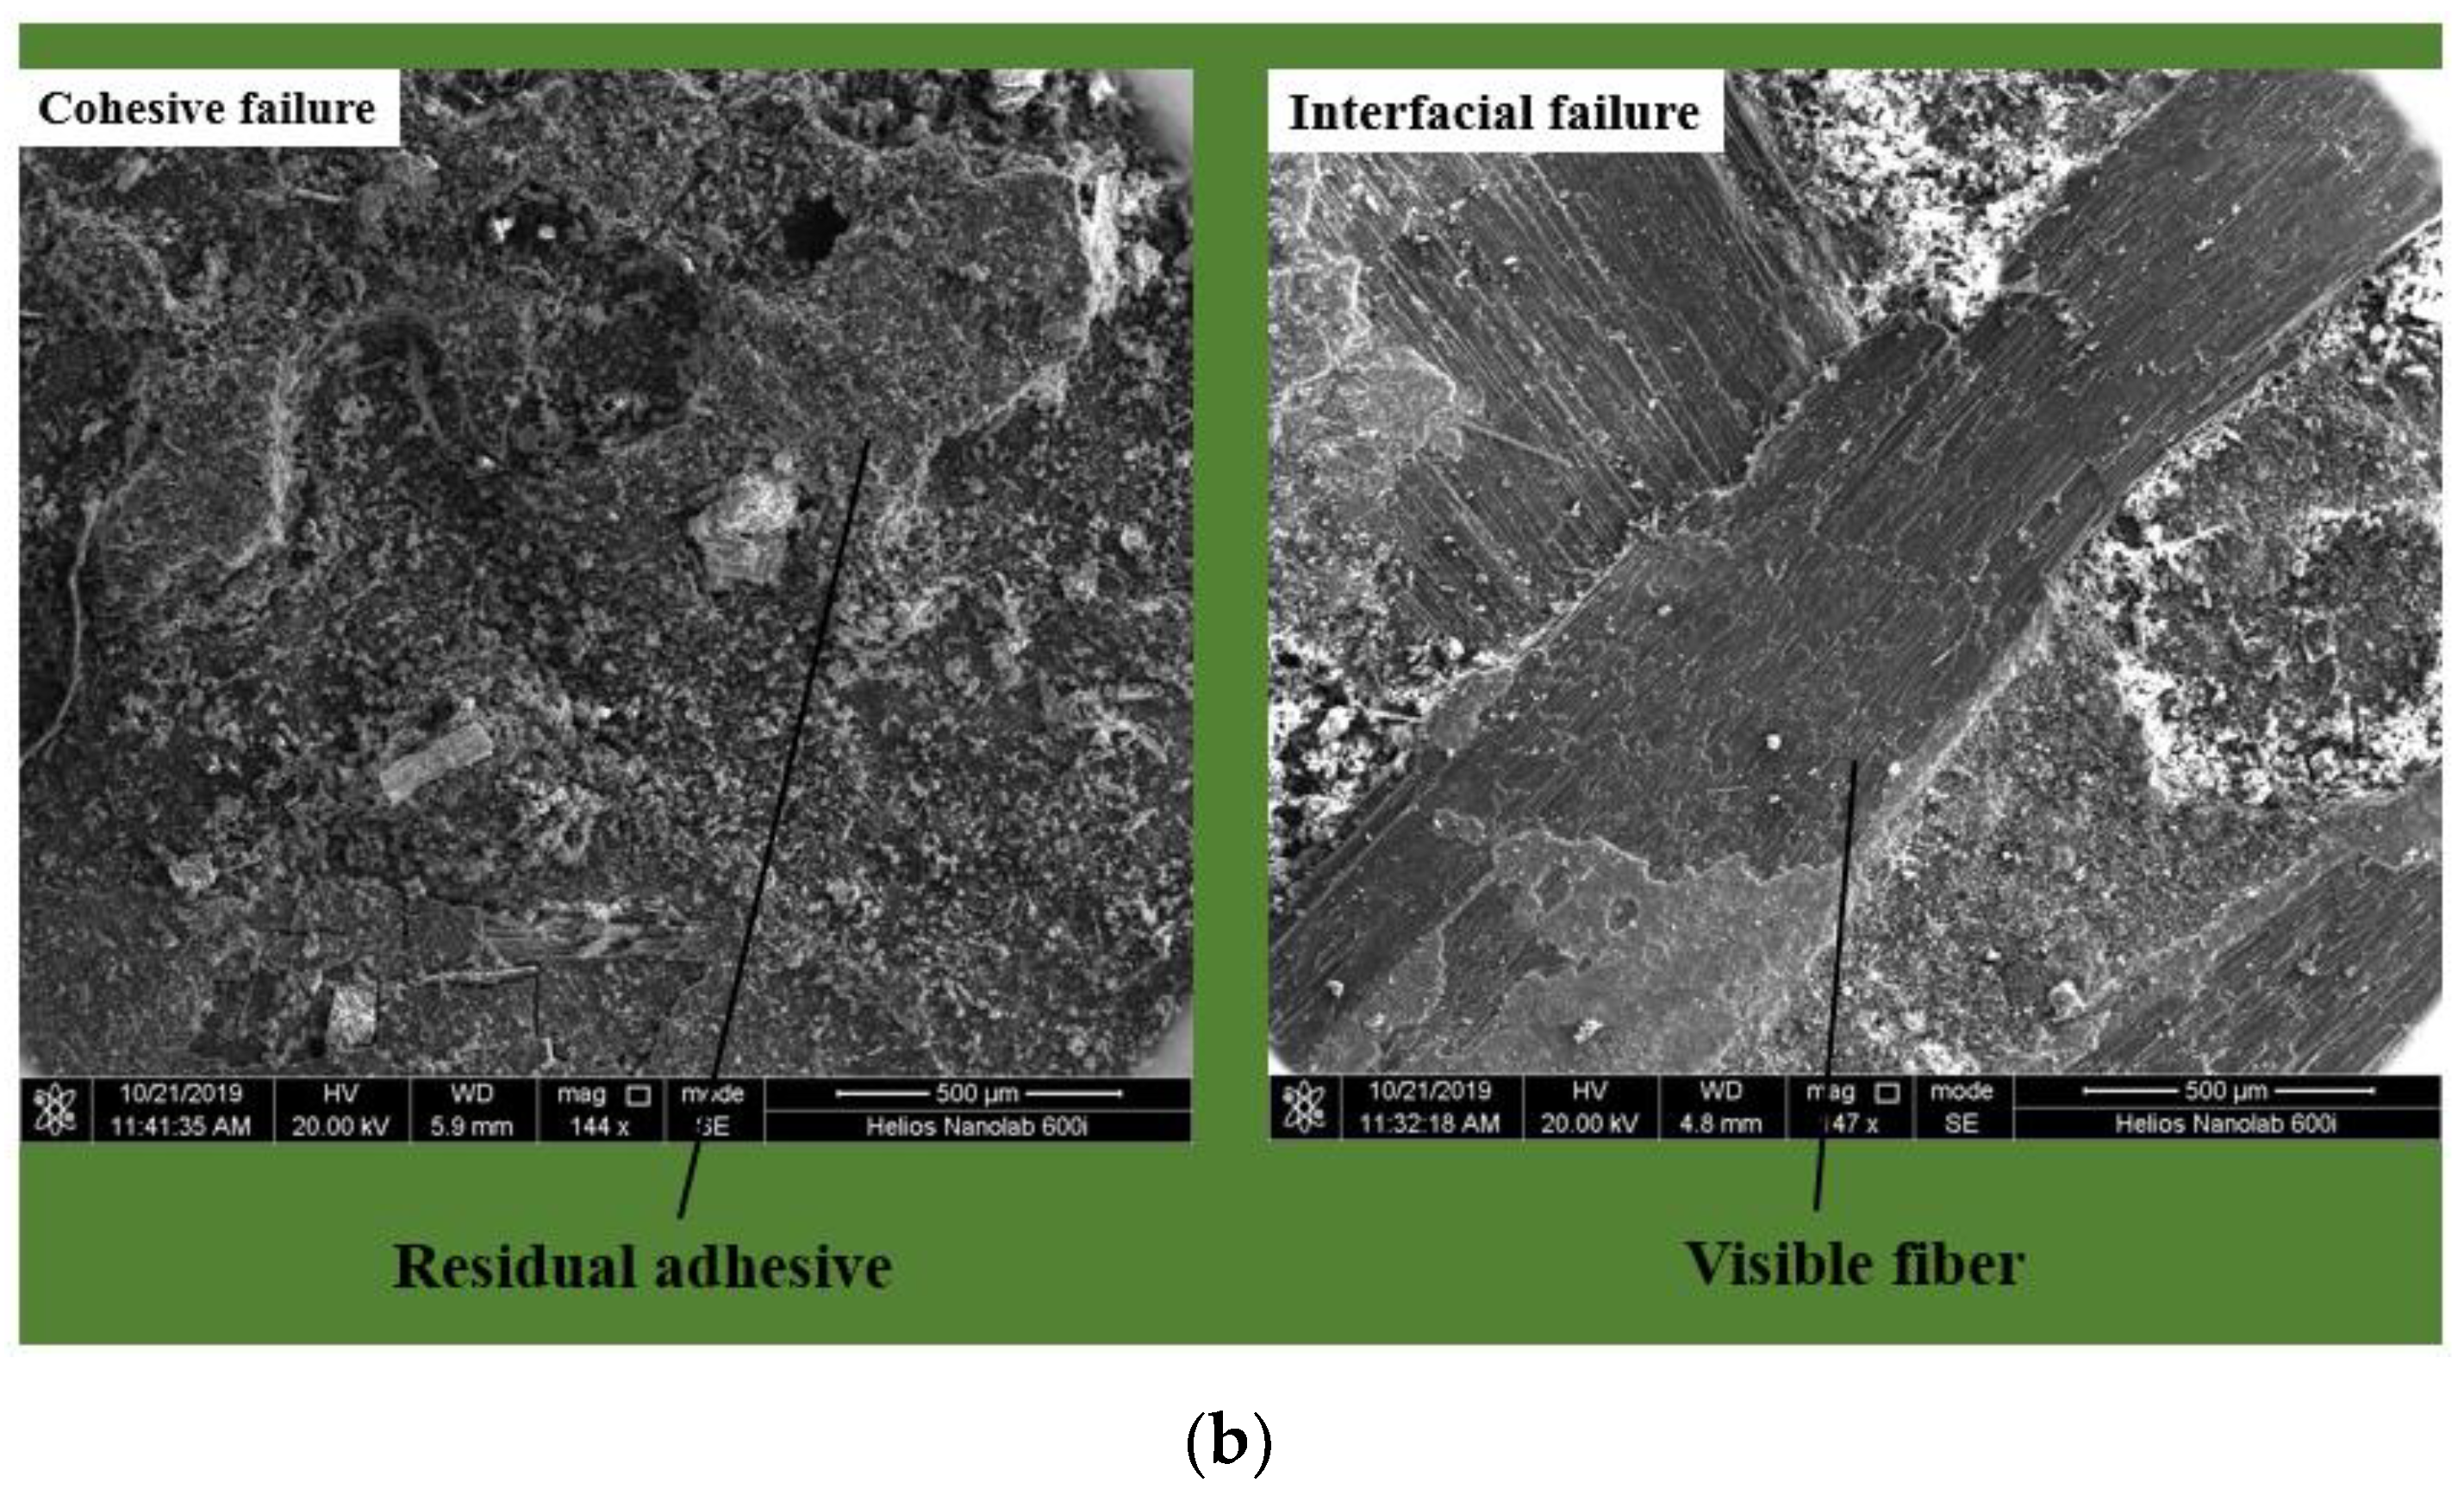
- At high temperatures (400, 600, and 800 °C), the adhesively bonded single-lap joints of C/C composite materials under the compression load exhibited shear failures on the bonding surface. By observing the failure modes with a digital microscopic system and scanning electron microscope, we found most of the adhesive layer displayed cohesive failures and that the interface failures occurred in a small part of the adhesive layer.
- (2)
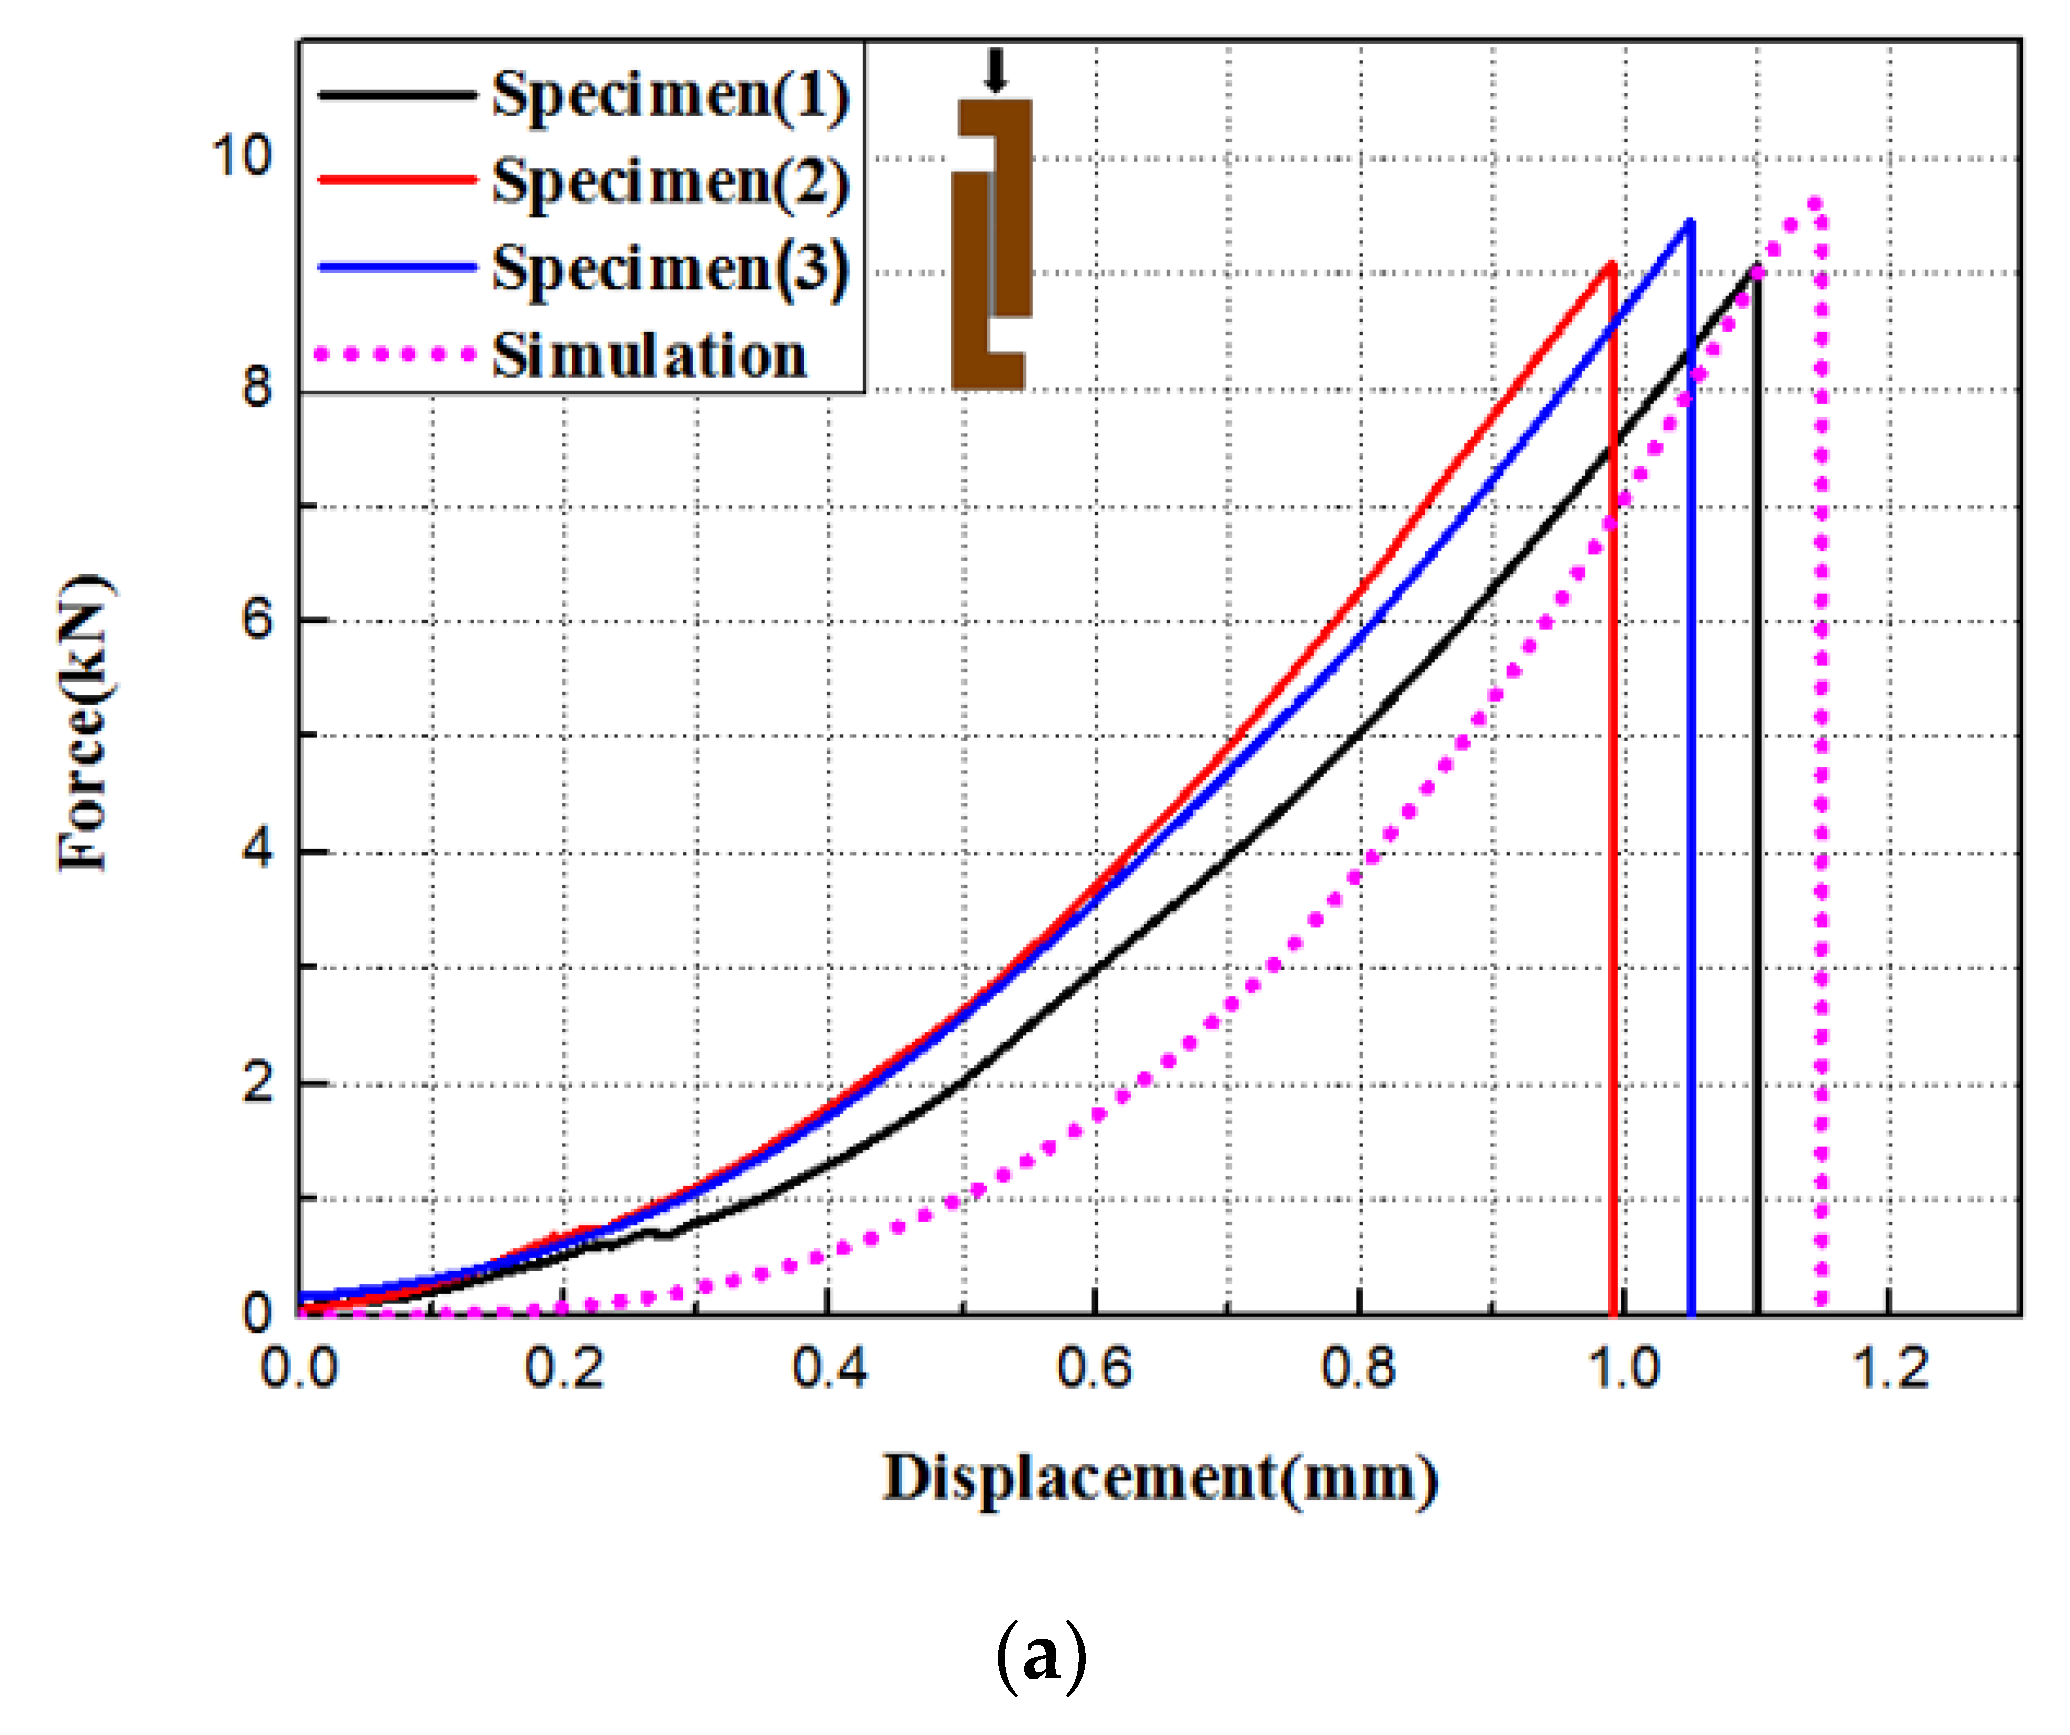
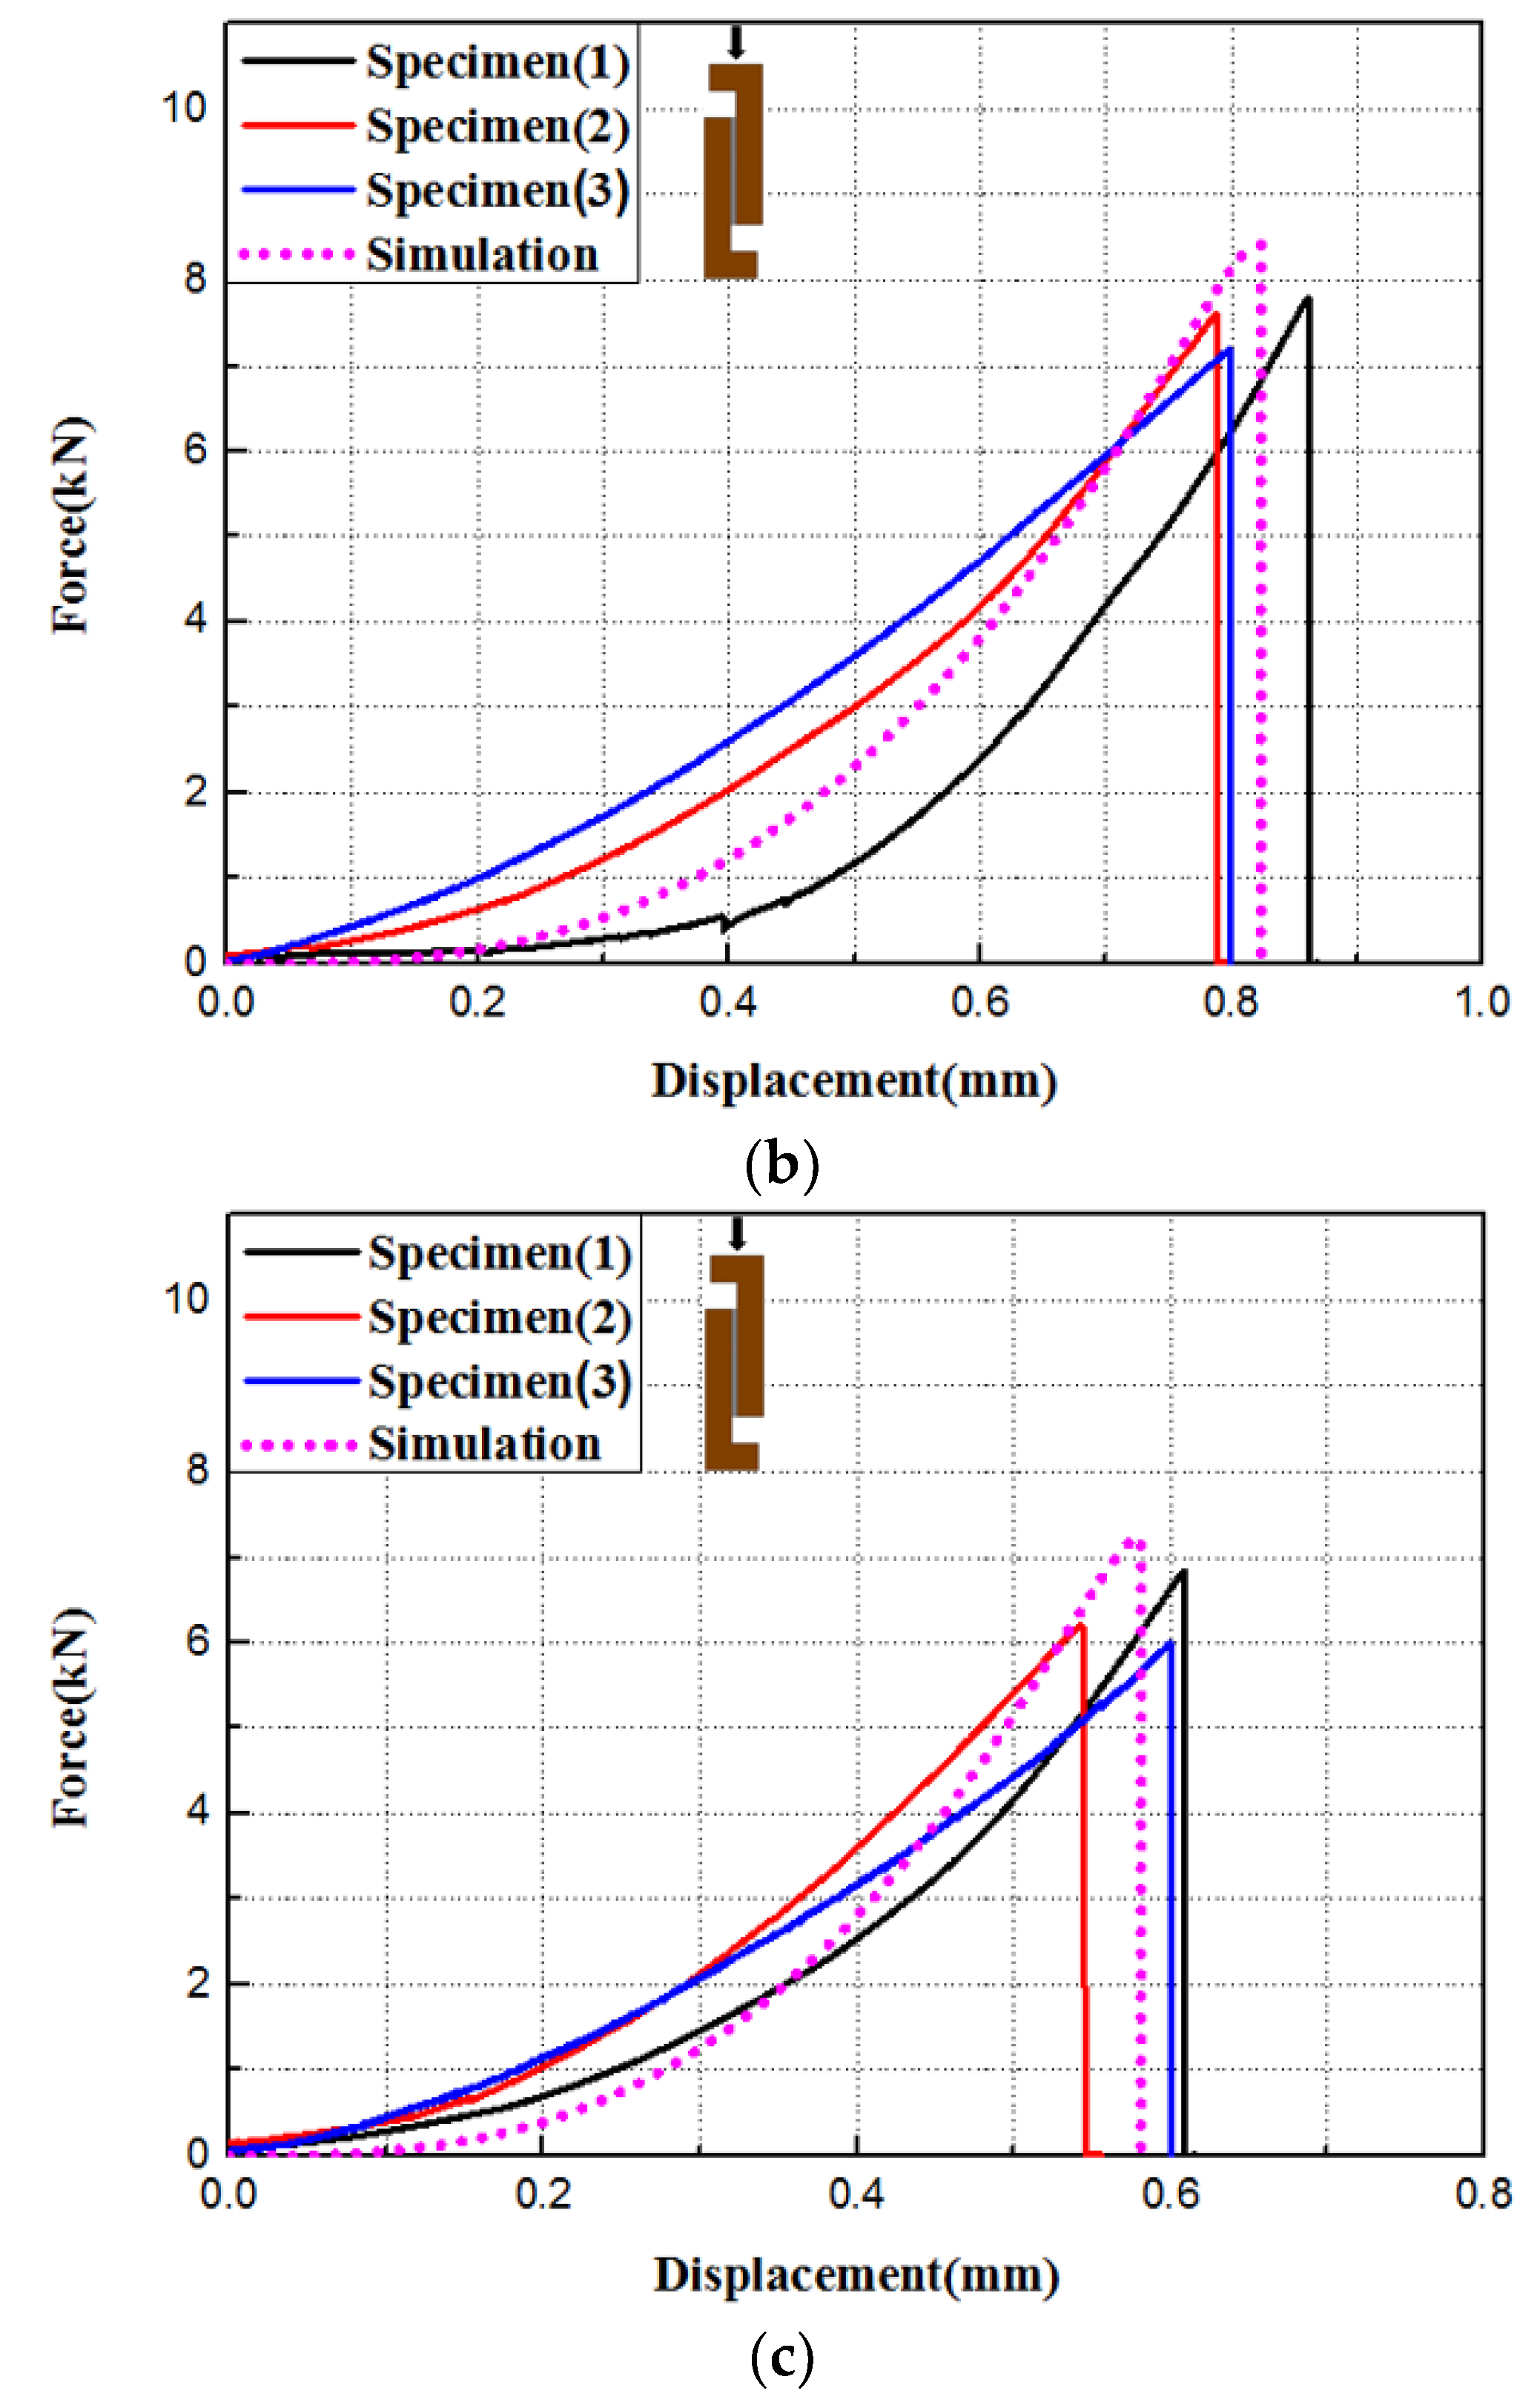
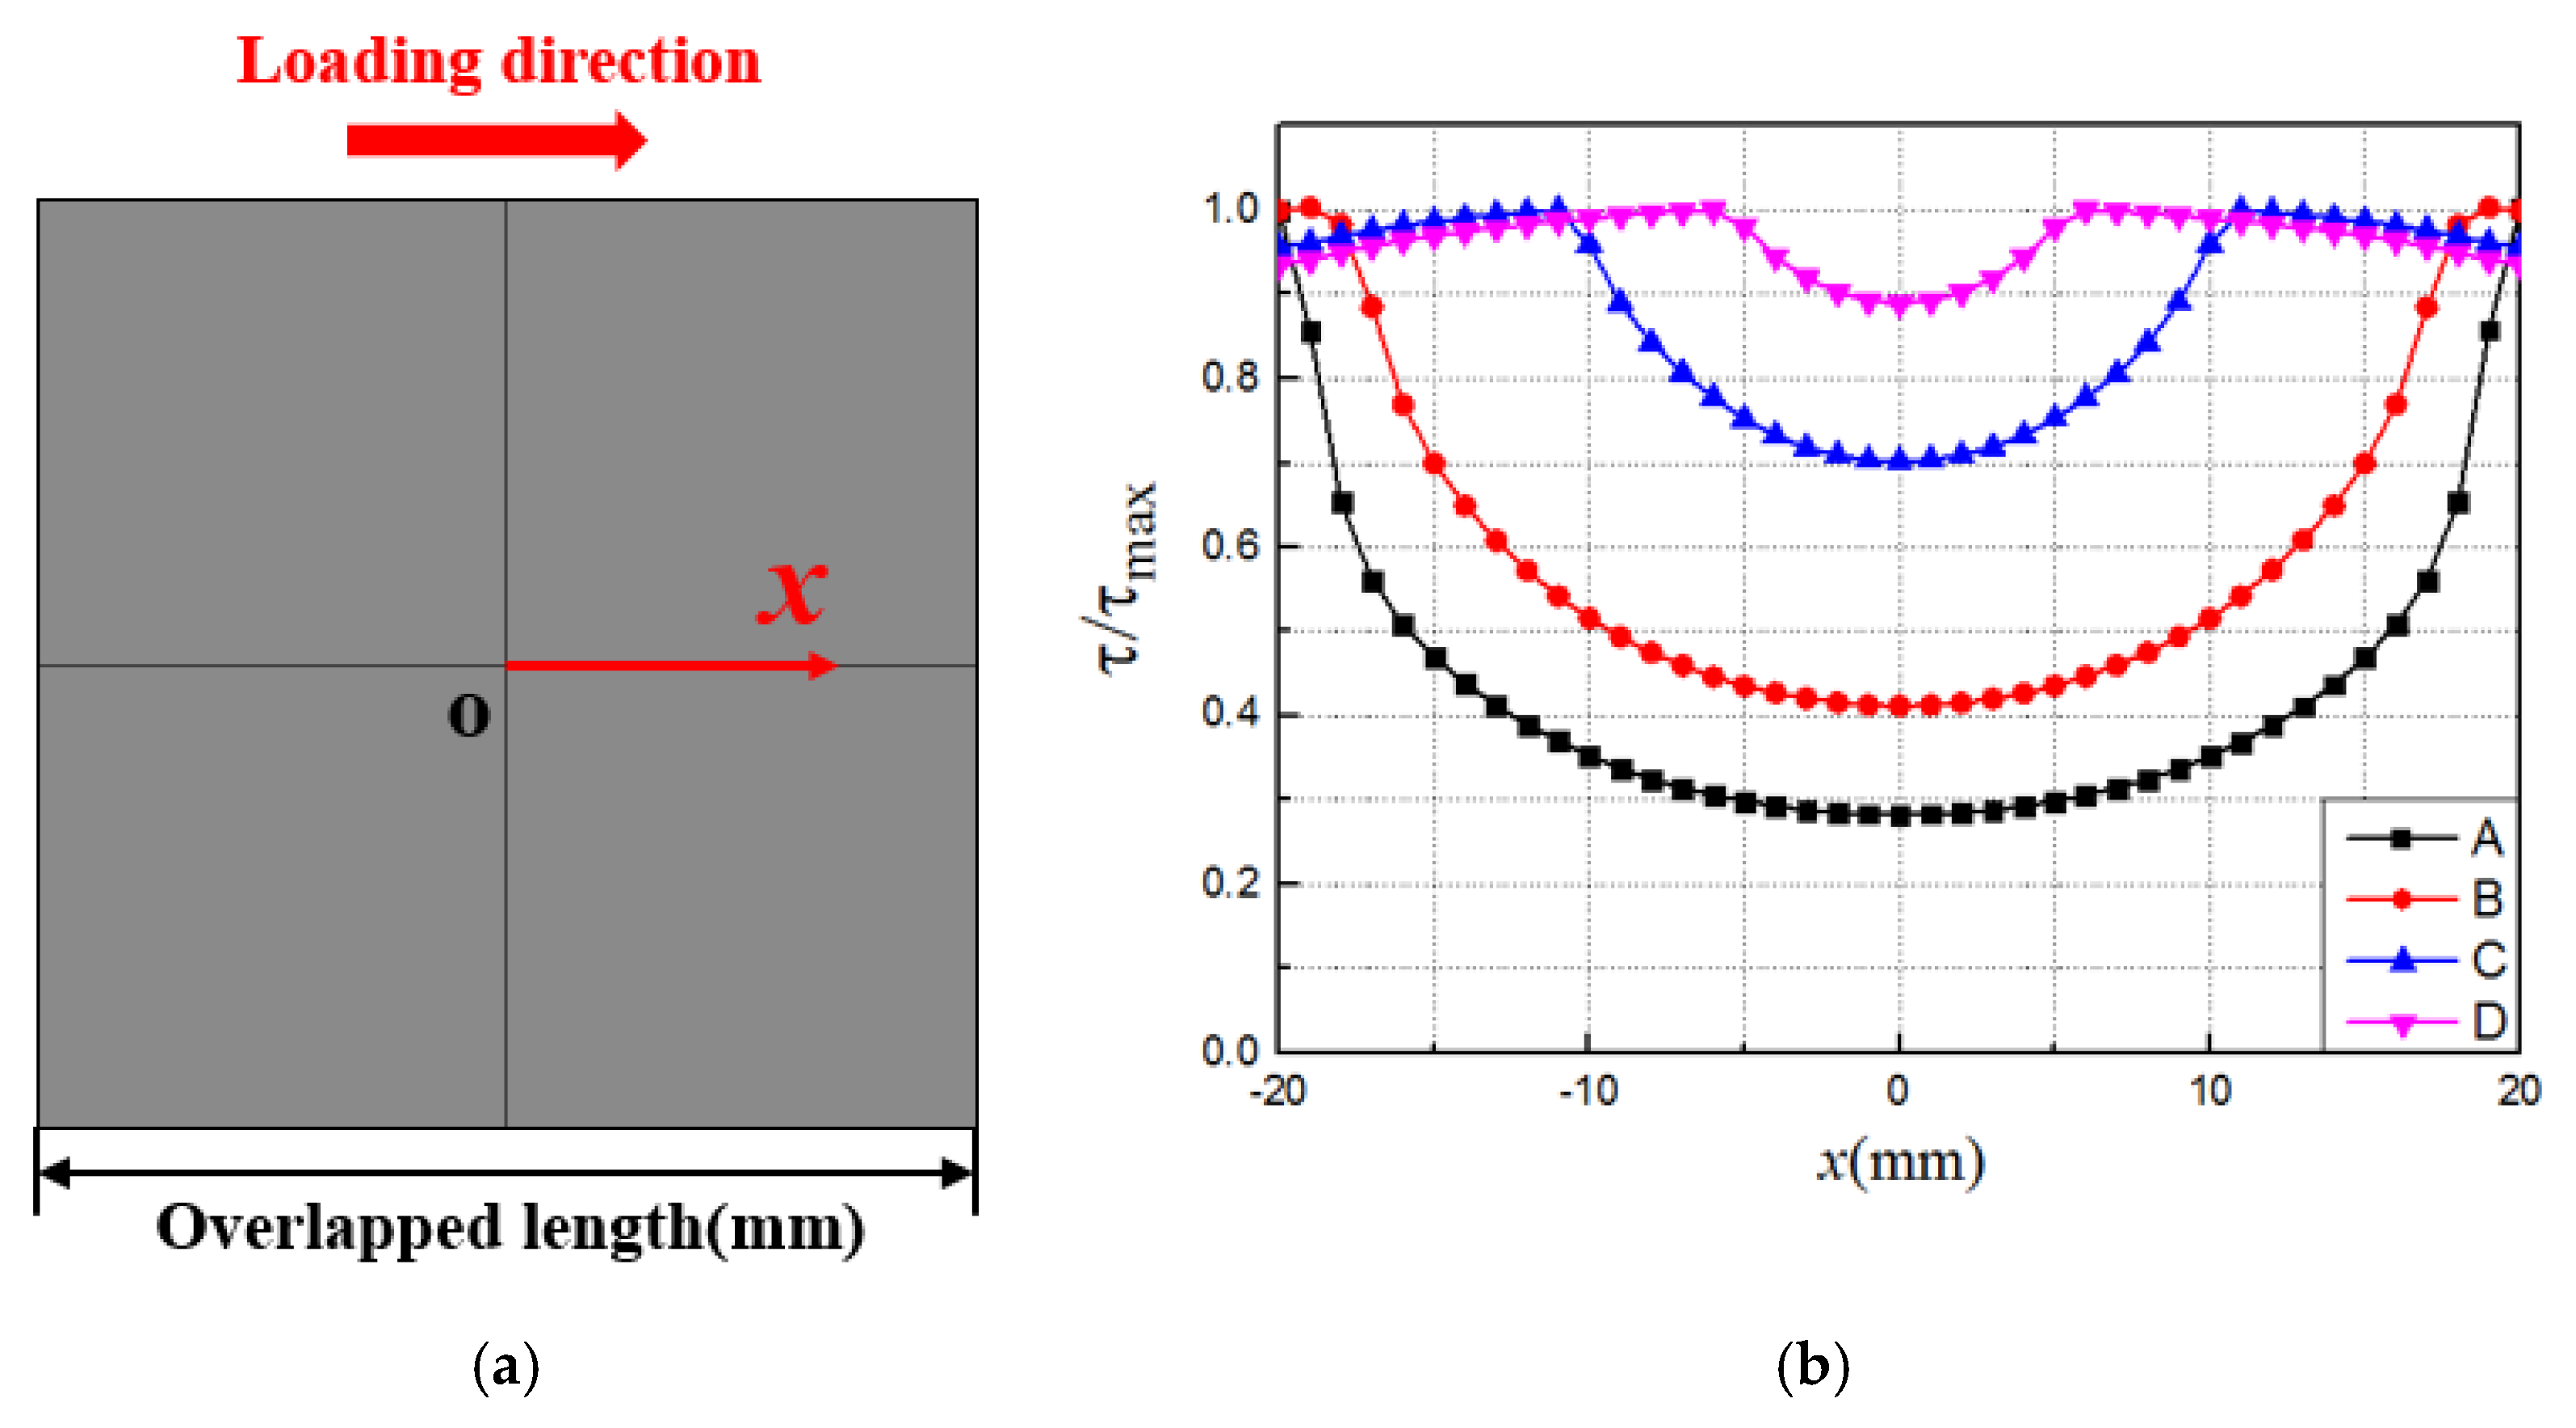
- Based on the bilinear constitutive relation of the cohesive force element, the failure process of the joint was simulated and the numerical simulation results agreed well with the experimental results. The stress distribution and progressive damage of the adhesive layer were provided. The failure load of the joint decreased with the increase in temperature. The change in shear stress of the adhesive layer with the lap length of the joint was obtained.
Author Contributions
Funding
Acknowledgments
Conflicts of Interest
References
- Banea, M.D.; Da Silva, L.F.M. Adhesively bonded joints in composite materials: An overview. Proc. Inst. Mech. Eng. Part L 2009, 223, 1–18. [Google Scholar] [CrossRef]
- Budhe, S.; Banea, M.D.; De Barros, S.; Da Silva, L.F.M. An updated review of adhesively bonded joints in composite materials. Int. J. Adhes. Adhes. 2017, 72, 30–42. [Google Scholar] [CrossRef]
- Ozel, A.; Yazici, B.; Akpinar, S.; Aydin, M.D.; Temiz, S. A study on the strength of adhesively bonded joints with different adherends. Compos. Part B Eng. 2014, 62, 167–174. [Google Scholar] [CrossRef]
- Tang, J.H.; Sridhar, I.; Srikanth, N. Static and fatigue failure analysis of adhesively bonded thick composite single lap joints. Compos. Sci. Technol. 2013, 86, 18–25. [Google Scholar]
- Smith, L.M.; Rogers, C.W. Bonded Bomber—B-58. SAE Trans. 1962, 70, 477–486. [Google Scholar]
- Gray, P.J.; O’Higgins, R.M.; McCarthy, C.T. Effect of thickness and laminate taper on the stiffness, strength and secondary bending of single-lap, single-bolt countersunk composite joints. Compos. Struct. 2014, 107, 315–324. [Google Scholar] [CrossRef]
- Li, J.F.; Yan, Y.; Liang, Z.D.; Zhang, T.T. Experimental and numerical study of.adhesively bonded CFRP scarf-lap joints subjected to tensile loads. J. Adhes. 2016, 92, 1–17. [Google Scholar] [CrossRef]
- Akhavan-Safar, A.; Ayatollahi, M.R.; Da Silva, L.F.M. Strength prediction of adhesively bonded single lap joints with different bondline thicknesses: A critical longitudinal strain approach. Int. J. Solids Struct. 2017, 109, 189–198. [Google Scholar] [CrossRef]
- Lang, T.P.; Mallick, P.K. The effect of recessing on the stresses in adhesively bonded single-lap joints. Int. J. Adhes. Adhes. 1999, 19, 257–271. [Google Scholar] [CrossRef]
- Hu, P.; Han, X.; Li, W.D.; Li, L.; Shao, Q. Research on the static strength performance of adhesive single lap joints subjected to extreme temperature environment for automotive industry. Int. J. Adhes. Adhes. 2013, 41, 119–126. [Google Scholar] [CrossRef]
- Grant, L.D.R.; Adams, R.D.; Da Silva, L.F.M. Effect of the temperature on the strength of adhesively bonded single lap and T joints for the automotive industry. Int. J. Adhes. Adhes. 2009, 29, 535–542. [Google Scholar] [CrossRef]
- Arikan, V.; Dogan, A.; Dogan, T.; Sabanci, E.; Kadum, A.; Al-Shamary, J. Effects of temperature and hole drilling on adhesively bonded single-lap joints. J. Adhes. 2015, 91, 177–185. [Google Scholar] [CrossRef]
- Liao, L.J.; Kobayashi, T.; Sawa, T.; Goda, Y. 3-D FEM stress analysis and strength evaluation of single-lap adhesive joints subjected to impact tensile loads. Int. J. Adhes. Adhes. 2011, 31, 612–619. [Google Scholar] [CrossRef]
- Khalili, S.M.R.; Mokhtari, M. Numerical study of adhesive single-lap joints with composite adherends subjected to combined tension–torsion Loads. J. Adhes. 2015, 91, 214–234. [Google Scholar] [CrossRef]
- Carsi, M.; Sanchis, M.J.; Gómez, C.M.; Rodriguez, S.; Torres, F.G. Effect of Chitin Whiskers on the Molecular Dynamics of Carrageenan-Based Nanocomposites. Polymers 2019, 11, 1083. [Google Scholar] [CrossRef]
- Yin, S.; Cizek, J.; Chen, C.; Jenkins, R.; O’Donnell, G.; Lupoi, R. Metallurgical bonding between metal matrix and core-shelled reinforcements in cold sprayed composite coating. Scr. Mater. 2020, 177, 49–53. [Google Scholar] [CrossRef]
- Yamagata, Y.; Lu, X.; Sekiguchi, Y.; Sato, C. Experimental investigation of mode I fracture energy of adhesively bonded joints under impact loading conditions. Appl. Adhes. Sci. 2017, 5, 1–10. [Google Scholar] [CrossRef]
- Li, G.; Lee-Sullivan, P. Finite element and experimental studies on single-lap balanced joints in tension. Int. J. Adhes. Adhes. 2001, 21, 211–220. [Google Scholar] [CrossRef]
- Owens, J.F.P.; Lee-Sullivan, P. Stiffness behaviour due to fracture in adhesively bonded composite-to-aluminum joints II. Experimental. Int. J. Adhes. Adhes. 2000, 20, 47–58. [Google Scholar] [CrossRef]
- Anyfantis, K.N.; Tsouvalis, N.G. Loading and fracture response of CFRP-to-steel adhesively bonded joints with thick adherents—Part II: Numerical simulation. Compos. Struct. 2013, 96, 858–868. [Google Scholar] [CrossRef]
- Ribeiro, F.L.; Borges, L.; D’Almeida, J.R.M. Numerical stress analysis of carbon-fibre-reinforced epoxy composite single-lap joints. Int. J. Adhes. Adhes. 2011, 31, 331–337. [Google Scholar] [CrossRef]
- Her, S.C. Stress analysis of adhesively-bonded lap joints. Compos. Struct. 1999, 47, 673–678. [Google Scholar] [CrossRef]
- Bruneton, E.; Narcy, B.; Oberlin, A. Carbon-carbon composites prepared by a rapid densification process I: Synthesis and physico-chemical data. Carbon 1997, 35, 1593–1598. [Google Scholar] [CrossRef]
- Westwood, M.E.; Webster, J.D.; Day, R.J.; Hayes, F.H.; Taylor, R. Oxidation protection for carbon fibre composites. J. Mater. Sci. 1996, 31, 1389–1397. [Google Scholar] [CrossRef]
- Fang, H.T.; Zhu, J.C.; Yin, Z.D. A Si-Mo fused slurry coating for oxidation protection of carbon-carbon composites. J. Mater. Sci. 2001, 20, 175–177. [Google Scholar]
- Golecki, I.; Morris, R.C.; Narasimhan, D.; Clements, N. Rapid densification of porous carbon–carbon composites by thermal-gradient chemical vapor infiltration. Appl. Phys. Lett. 1995, 66, 2334–2336. [Google Scholar] [CrossRef]
- Delhaes, P.; Trinquecoste, M.; Lines, J.F.; Cosculluela, A.; Goyheneche, J.M.; Couzi, M. Chemical vapor infiltration of C/C composites: Fast densification processes and matrix characterizations. Carbon 2005, 43, 681–691. [Google Scholar] [CrossRef]
- Delhaes, P. Chemical vapor deposition and infiltration processes of carbon materials. Carbon 2002, 40, 641–657. [Google Scholar] [CrossRef]
- ASTM C 1292. Standard Test Method for Shear Strength of Continuous Fiber-Reinforced Advanced Ceramics at Ambient Temperatures; ASTM International: West Conshohocken, PA, USA, 2010. [Google Scholar]
- Serrano, E. A numerical study of the shear-strength-predicting capabilities of test specimens for wood–adhesive bonds. Int. J. Adhes. Adhes. 2004, 24, 23–35. [Google Scholar] [CrossRef]
- Ferraris, M.; Ventrella, A.; Salvo, M.; Avalle, M.; Pavia, F.; Martin, E. Comparison of shear strength tests on AV119 epoxy-joined carbon/carbon composites. Compos. Part B Eng. 2010, 41, 182–191. [Google Scholar] [CrossRef]
- Feraren, P.; Jensen, H.M. Cohesive zone modelling of interface fracture near flaws in adhesive joints. Eng. Fract. Mech. 2004, 71, 2125–2142. [Google Scholar] [CrossRef]
- Ridha, M.; Tan, V.B.C.; Tay, T.E. Traction–separation laws for progressive failure of bonded scarf repair of composite panel. Compos. Struct. 2011, 93, 1239–1245. [Google Scholar] [CrossRef]
- Da Silva, L.F.M.; Adams, R.D. Adhesive joints at high and low temperatures using similar and dissimilar adherends and dual adhesives. Int. J. Adhes. Adhes. 2007, 27, 216–226. [Google Scholar] [CrossRef]
- Li, S.; Chen, X.; Chen, F. The effect of high temperature heat-treatment on the strength of C/C to C/C–SiC joints. Carbon 2010, 48, 3042–3049. [Google Scholar] [CrossRef]


| Variable | Temperature (°C) | Variable | Temperature (°C) | ||||
|---|---|---|---|---|---|---|---|
| 400 | 600 | 800 | 400 | 600 | 800 | ||
| Density (g/cm3) | 1.65 | Tensile strength (MPa) | 255 | 263 | 271.3 | ||
| Coefficient of thermal expansion (10−6 °C) | 0.19 | Compression strength (MPa) | 200 | 212 | 224 | ||
| Elastic modulus (GPa) | 90 | 92.5 | 95 | Tensile strength (MPa) | 255 | 263 | 271.3 |
| Elastic modulus (GPa) | 90 | 92.5 | 95 | Compression strength (MPa) | 200 | 212 | 224 |
| Elastic modulus (GPa) | 15.5 | 13 | 10.3 | Tensile strength (MPa) | 75.7 | 80.2 | 84.9 |
| Shear modulus (GPa) | 23.8 | 25.7 | 27.6 | Compression strength (MPa) | 342 | 350 | 358 |
| Shear modulus (GPa) | 5.4 | 6.1 | 6.8 | Shear strength (MPa) | 47.5 | 51 | 54.5 |
| Poisson ratio | 0.035 | Shear strength (MPa) | 14.6 | 16.4 | 18.2 | ||
| Poisson ratio = | 0.032 | ||||||
| Method | Equipment | Temperature (°C) | Source Gas | Diluting Gas |
|---|---|---|---|---|
| CVI | ZRHC-1500 CVD system | 1000~1300 | C2H2 | Ar |
| CVD | 673~1173 | CH3SiCl3 | Ar |
| Temperature (°C) | Shear Modulus | Thermal Expansivity (×10–6/°C) | Working Temperature (°C) | |
|---|---|---|---|---|
| 400 | 5.5 | 4.2 | 4.2 | −60 to 970 |
| 600 | 4.8 | 3.7 | ||
| 800 | 4.0 | 3.7 |
| Temperature (°C) | (MPa) | (MPa) | (N/mm) | and (N/mm) |
|---|---|---|---|---|
| 400 | 5 | 6.5 | 0.4 | 0.8 |
| 600 | 4.4 | 5.8 | 0.3 | 0.6 |
| 800 | 3.5 | 4.9 | 0.1 | 0.3 |
© 2019 by the authors. Licensee MDPI, Basel, Switzerland. This article is an open access article distributed under the terms and conditions of the Creative Commons Attribution (CC BY) license (http://creativecommons.org/licenses/by/4.0/).
Share and Cite
Zhang, Y.; Zhou, Z.; Tan, Z. Compression Shear Properties of Adhesively Bonded Single-Lap Joints of C/C Composite Materials at High Temperatures. Symmetry 2019, 11, 1437. https://doi.org/10.3390/sym11121437
Zhang Y, Zhou Z, Tan Z. Compression Shear Properties of Adhesively Bonded Single-Lap Joints of C/C Composite Materials at High Temperatures. Symmetry. 2019; 11(12):1437. https://doi.org/10.3390/sym11121437
Chicago/Turabian StyleZhang, Yanfeng, Zhengong Zhou, and Zhiyong Tan. 2019. "Compression Shear Properties of Adhesively Bonded Single-Lap Joints of C/C Composite Materials at High Temperatures" Symmetry 11, no. 12: 1437. https://doi.org/10.3390/sym11121437
APA StyleZhang, Y., Zhou, Z., & Tan, Z. (2019). Compression Shear Properties of Adhesively Bonded Single-Lap Joints of C/C Composite Materials at High Temperatures. Symmetry, 11(12), 1437. https://doi.org/10.3390/sym11121437