EWMA Control Chart Using Repetitive Sampling for Monitoring Blood Glucose Levels in Type-II Diabetes Patients
Abstract
1. Introduction
2. Methodology
- The case of , that is when the process is in-control, ARL value obtained is very close to the target r0 values.
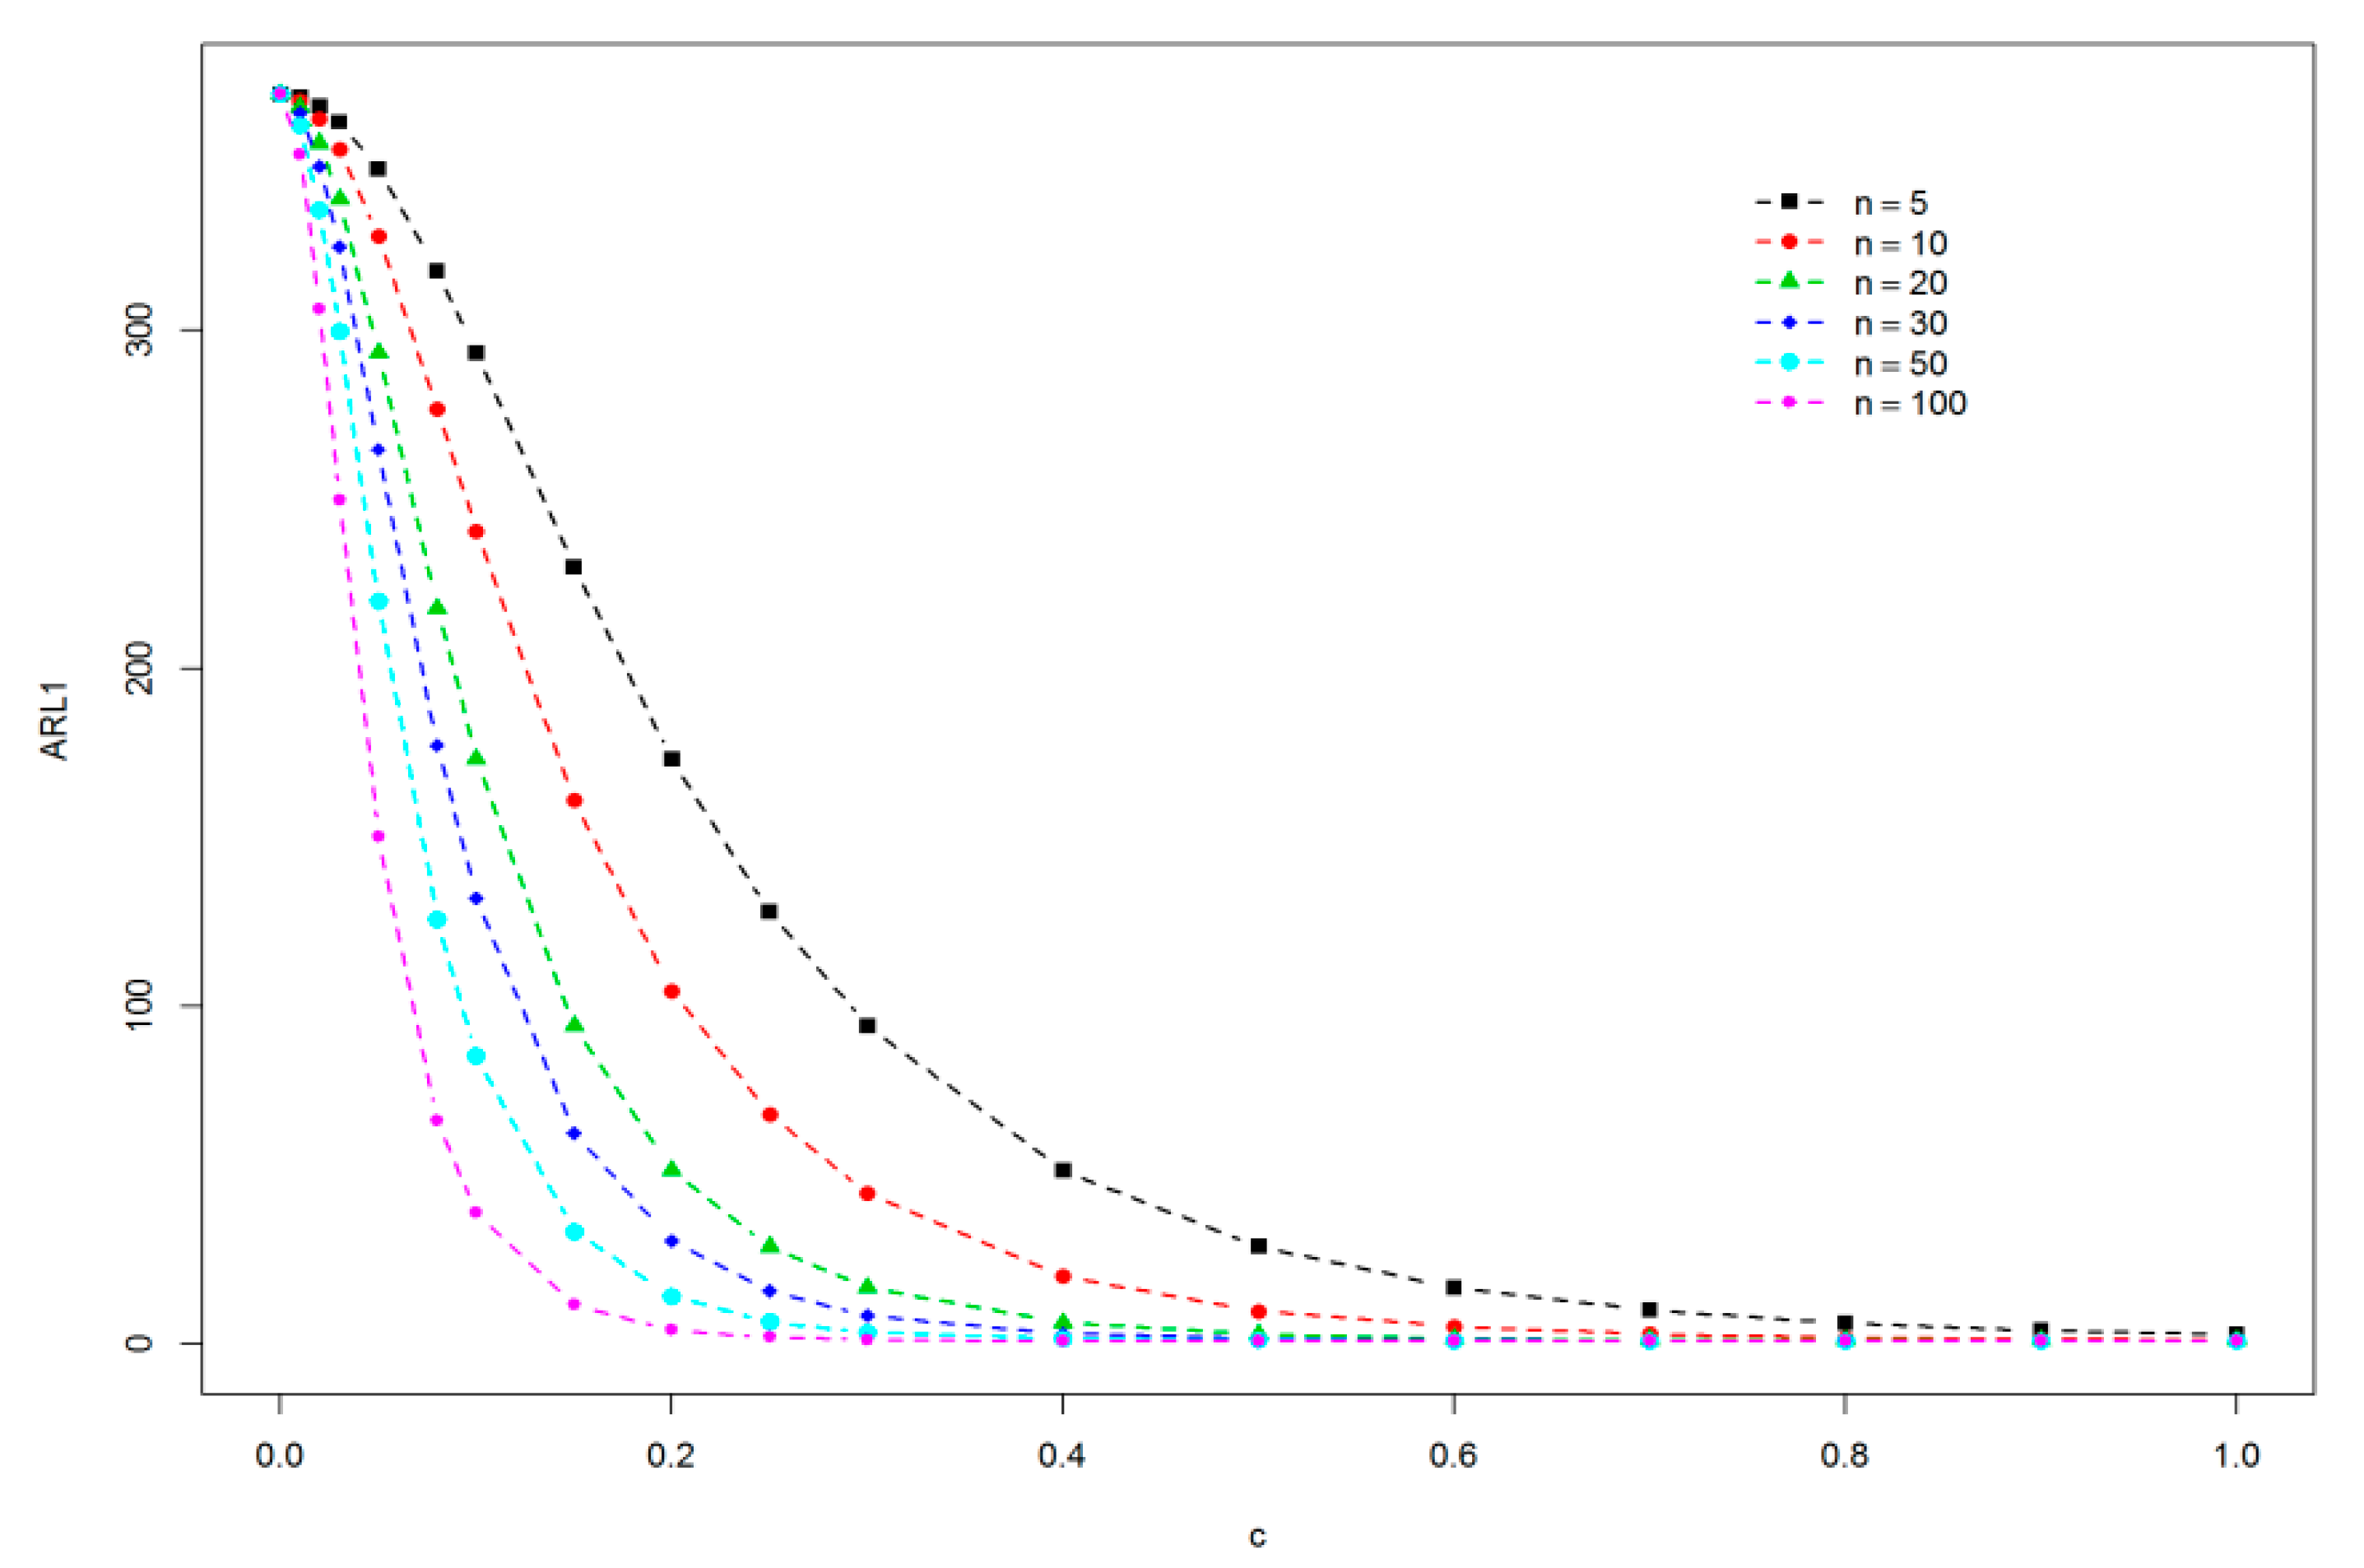
- As the shift increases (i.e., the process mean increases), the out-of-control ARLs decrease rapidly. A similar trend can be observed from Table 2 and Table 3 whereas decreasing speed seems to get faster after c = 0.1. When sample size increases, the values of ARL1 decrease. It means that at the large sample size, we have a quick indication about the shift in the sugar level (see Figure 1).
3. Case Study Results
4. Conclusions and Recommendations
Author Contributions
Funding
Acknowledgments
Conflicts of Interest
References
- Benneyan, J.C. Statistical quality control methods in infection control and hospital epidemiology, part II: Chart use, statistical properties, and research issues. Infect. Control Hosp. Epidemiol. 1998, 19, 265–282. [Google Scholar] [CrossRef] [PubMed]
- Shewhart, W.A. Economic Control of Quality of Manufactured Product; ASQ Quality Press: Milwaukee, WI, USA, 1931. [Google Scholar]
- Woodall, W.H.; Mohammed, M.A.; Lucas, J.M.; Watkins, R. The Use of Control Charts in Health-Care and Public-Health Surveillance/Discussion/Discussion/Discussion/Discussion/Discussion/Discussion/Rejoinder. J. Qual. Technol. 2006, 38, 89–104. [Google Scholar] [CrossRef]
- Aslam, M.; Azam, M.; Jun, C.-H. New attributes and variables control charts under repetitive sampling. Ind. Eng. Manag. Syst. 2014, 13, 101–106. [Google Scholar] [CrossRef]
- Benneyan, J.C. Statistical Quality Control Methods in Infection Control and Hospital Epidemiology, Part I Introduction and Basic Theory. Infect. Control Hosp. Epidemiol. 1998, 19, 194–214. [Google Scholar] [CrossRef] [PubMed]
- Thor, J.; Lundberg, J.; Ask, J.; Olsson, J.; Carli, C.; Härenstam, K.P.; Brommels, M. Application of statistical process control in healthcare improvement: Systematic review. Qual. Saf. Health Care 2007, 16, 387–399. [Google Scholar] [CrossRef]
- Noyez, L. Control charts, Cusum techniques and funnel plots. A review of methods for monitoring performance in healthcare. Interact. Cardiovasc. Thorac. Surg. 2009, 9, 494–499. [Google Scholar] [CrossRef] [PubMed]
- Smith, I.R.; Garlick, B.; Gardner, M.A.; Brighouse, R.D.; Foster, K.A.; Rivers, J.T. Use of graphical statistical process control tools to monitor and improve outcomes in cardiac surgery. Heart Lung Circ. 2013, 22, 92–99. [Google Scholar] [CrossRef]
- Spiegelhalter, D.; Sherlaw-Johnson, C.; Bardsley, M.; Blunt, I.; Wood, C.; Grigg, O. Statistical methods for healthcare regulation: Rating, screening and surveillance. J. R. Stat. Soc. Ser. A (Stat. Soc.) 2012, 175, 1–47. [Google Scholar] [CrossRef]
- Carey, R.G.; Stake, L.V. Improving Healthcare with Control Charts: Basic and Advanced SPC Methods and Case Studies; ASQ Quality Press: Milwaukee, WI, USA, 2003. [Google Scholar]
- Woodall, W.H.; Spitzner, D.J.; Montgomery, D.C.; Gupta, S. Using control charts to monitor process and product quality profiles. J. Qua. Technol. 2004, 36, 309–320. [Google Scholar] [CrossRef]
- Winkel, P.; Zhang, N.F. Statistical Development of Quality in Medicine; John Wiley & Sons: Hoboken, NJ, USA, 2007; Volume 62. [Google Scholar]
- Faltin, F.; Kenett, R.S.; Ruggeri, F. Statistical Methods in Healthcare; John Wiley & Sons: Hoboken, NJ, USA, 2012. [Google Scholar]
- Morton, A.; Whitby, M.; Tierney, N.; Sibanda, N.; Mengersen, K. Statistical Methods for Hospital Monitoring; Wiley Online Library: Hoboken, NJ, USA, 2013. [Google Scholar]
- Beck, M.; Melo, S. Quality Management and Managerialism in Healthcare: A Critical Historical Survey; Springer: Berlin, Germany, 2014. [Google Scholar]
- Mohammed, M.A.; Worthington, P. Why traditional statistical process control charts for attribute data should be viewed alongside an xmr-chart. BMJ Qual. Saf. 2013, 22, 263–269. [Google Scholar] [CrossRef]
- Mohammed, M.A.; Panesar, J.S.; Laney, D.B.; Wilson, R. Statistical process control charts for attribute data involving very large sample sizes: A review of problems and solutions. BMJ Qual. Saf. 2013. [Google Scholar] [CrossRef] [PubMed]
- Neuburger, J.; Walker, K.; Sherlaw-Johnson, C.; van der Meulen, J.; Cromwell, D.A. Comparison of control charts for monitoring clinical performance using binary data. BMJ Qual. Saf. 2017. [Google Scholar] [CrossRef] [PubMed]
- Cappon, G.; Acciaroli, G.; Vettoretti, M.; Facchinetti, A.; Sparacino, G. Wearable continuous glucose monitoring sensors: A revolution in diabetes treatment. Electronics 2017, 6, 65. [Google Scholar] [CrossRef]
- Dong, Y.; Hedayat, A.; Sinha, B. Surveillance strategies for detecting changepoint in incidence rate based on exponentially weighted moving average methods. J. Am. Stat. Assoc. 2008, 103, 843–853. [Google Scholar] [CrossRef]
- Sherman, R.E. Design and evaluation of a repetitive group sampling plan. Technometrics 1965, 7, 11–21. [Google Scholar] [CrossRef]
- Abbas, N.; Riaz, M.; Does, R.J. Enhancing the performance of EWMA charts. Qual. Reliab. Eng. Int. 2011, 27, 821–833. [Google Scholar] [CrossRef]
- Ahmad, L.; Aslam, M.; Jun, C.-H. Designing of X-bar control charts based on process capability index using repetitive sampling. Trans. Inst. Meas. Control 2014, 36, 367–374. [Google Scholar] [CrossRef]
- Aslam, M.; Khan, N.; Azam, M.; Jun, C.-H. Designing of a new monitoring t-chart using repetitive sampling. Inf. Sci. 2014, 269, 210–216. [Google Scholar] [CrossRef]
- Aslam, M.; Azam, M.; Jun, C.-H. A new exponentially weighted moving average sign chart using repetitive sampling. J. Process Control 2014, 24, 1149–1153. [Google Scholar] [CrossRef]
- Al-Nuaim, A.A.; Al-Nakeeb, Y.; Lyons, M.; Al-Hazzaa, H.M.; Nevill, A.; Collins, P.; Duncan, M.J. The prevalence of physical activity and sedentary behaviours relative to obesity among adolescents from Al-Ahsa, Saudi Arabia: Rural versus urban variations. J. Nutr. Metab. 2012, 2012, 417589. [Google Scholar] [CrossRef]
- Rathmann, W.; Giani, G. Global prevalence of diabetes: Estimates for the year 2000 and projections for 2030. Diabetes Care 2004, 27, 2568–2569. [Google Scholar] [CrossRef] [PubMed]
- Rasheed, P. Perception of body weight and self-reported eating and exercise behaviour among obese and non-obese women in Saudi Arabia. Public Health 1998, 112, 409–414. [Google Scholar] [CrossRef]
- Al-Baghli, N.A.; Al-Ghamdi, A.J.; Al-Turki, K.A.; El-Zubaier, A.G.; Al-Ameer, M.M.; Al-Baghli, F.A. Overweight and obesity in the eastern province of Saudi Arabia. Saudi Med. J. 2008, 29, 1319–1325. [Google Scholar] [PubMed]
- American Diabetes Association. Standards of medical care in diabetes—2010. Diabetes Care 2010, 33, S11–S61. [Google Scholar] [CrossRef] [PubMed]
- Alqurashi, K.A.; Aljabri, K.S.; Bokhari, S.A. Prevalence of diabetes mellitus in a Saudi community. Ann. Saudi Med. 2011, 31, 19–23. [Google Scholar] [CrossRef] [PubMed]
- Standard Deviation Buzz. Available online: http://www.healthline.com/diabetesmine/standard_deviat#1 (accessed on 25 November 2018).


| c | k1 = 3.0066; k2 = 2.2356 | |||||
|---|---|---|---|---|---|---|
| n | ||||||
| 5 | 10 | 20 | 30 | 50 | 100 | |
| ARL1 | ||||||
| 0 | 370.00 | 370.00 | 370.00 | 370.00 | 370.00 | 370.00 |
| 0.01 | 353.12 | 337.55 | 309.80 | 285.82 | 246.48 | 180.10 |
| 0.02 | 309.80 | 264.89 | 202.54 | 161.53 | 111.35 | 56.53 |
| 0.03 | 255.40 | 190.77 | 121.26 | 85.18 | 49.32 | 19.43 |
| 0.05 | 157.38 | 91.57 | 43.43 | 25.36 | 11.59 | 3.56 |
| 0.08 | 71.94 | 31.58 | 11.15 | 5.60 | 2.39 | 1.15 |
| 0.1 | 43.43 | 16.54 | 5.22 | 2.64 | 1.37 | 1.02 |
| 0.15 | 13.75 | 4.26 | 1.53 | 1.12 | 1.01 | 1.00 |
| 0.2 | 5.22 | 1.75 | 1.06 | 1.01 | 1.00 | 1.00 |
| 0.25 | 2.48 | 1.17 | 1.00 | 1.00 | 1.00 | 1.00 |
| 0.3 | 1.53 | 1.03 | 1.00 | 1.00 | 1.00 | 1.00 |
| 0.4 | 1.06 | 1.00 | 1.00 | 1.00 | 1.00 | 1.00 |
| 0.5 | 1.00 | 1.00 | 1.00 | 1.00 | 1.00 | 1.00 |
| c | k1 = 3.0134; k2 = 1.9885 | |||||
|---|---|---|---|---|---|---|
| n | ||||||
| 5 | 10 | 20 | 30 | 50 | 100 | |
| ARL1 | ||||||
| 0 | 370.00 | 370.00 | 370.00 | 370.00 | 370.00 | 370.00 |
| 0.01 | 369.06 | 368.13 | 366.28 | 364.45 | 360.83 | 352.05 |
| 0.02 | 366.28 | 362.63 | 355.52 | 348.65 | 335.58 | 306.40 |
| 0.03 | 361.73 | 353.78 | 338.77 | 324.84 | 299.79 | 249.85 |
| 0.05 | 347.81 | 327.85 | 293.42 | 264.81 | 220.03 | 150.24 |
| 0.08 | 317.53 | 276.78 | 217.76 | 177.24 | 125.62 | 66.17 |
| 0.1 | 293.42 | 240.66 | 173.06 | 131.95 | 85.20 | 38.94 |
| 0.15 | 229.96 | 160.99 | 94.11 | 62.43 | 33.31 | 11.56 |
| 0.2 | 173.06 | 104.58 | 51.38 | 30.48 | 14.06 | 4.19 |
| 0.25 | 127.94 | 67.88 | 28.79 | 15.61 | 6.52 | 2.00 |
| 0.3 | 94.11 | 44.52 | 16.66 | 8.44 | 3.40 | 1.32 |
| 0.4 | 51.38 | 20.02 | 6.25 | 3.04 | 1.47 | 1.03 |
| 0.5 | 28.79 | 9.65 | 2.84 | 1.58 | 1.09 | 1.00 |
| 0.6 | 16.66 | 5.06 | 1.66 | 1.16 | 1.01 | 1.00 |
| 0.7 | 10.00 | 2.94 | 1.23 | 1.04 | 1.00 | 1.00 |
| 0.8 | 6.25 | 1.94 | 1.08 | 1.01 | 1.00 | 1.00 |
| 0.9 | 4.10 | 1.45 | 1.02 | 1.00 | 1.00 | 1.00 |
| 1 | 2.84 | 1.22 | 1.01 | 1.00 | 1.00 | 1.00 |
| c | k1 = 3.0105; k2 = 2.0796 | |||||
|---|---|---|---|---|---|---|
| n | ||||||
| 5 | 10 | 20 | 30 | 50 | 100 | |
| ARL1 | ||||||
| 0 | 370.00 | 370.00 | 370.00 | 370.00 | 370.00 | 370.00 |
| 0.01 | 361.77 | 353.86 | 338.92 | 325.05 | 300.11 | 250.36 |
| 0.02 | 338.92 | 312.15 | 268.43 | 234.28 | 184.55 | 115.17 |
| 0.03 | 306.03 | 259.12 | 195.20 | 153.91 | 104.29 | 51.39 |
| 0.05 | 230.54 | 161.76 | 94.95 | 63.23 | 33.98 | 11.98 |
| 0.08 | 136.81 | 74.79 | 32.92 | 18.30 | 7.87 | 2.38 |
| 0.1 | 94.95 | 45.26 | 17.17 | 8.80 | 3.59 | 1.36 |
| 0.15 | 39.02 | 14.24 | 4.31 | 2.20 | 1.24 | 1.01 |
| 0.2 | 17.17 | 5.31 | 1.73 | 1.19 | 1.02 | 1.00 |
| 0.25 | 8.20 | 2.47 | 1.16 | 1.02 | 1.00 | 1.00 |
| 0.3 | 4.31 | 1.51 | 1.03 | 1.00 | 1.00 | 1.00 |
| 0.4 | 1.73 | 1.06 | 1.00 | 1.00 | 1.00 | 1.00 |
| 0.5 | 1.16 | 1.00 | 1.00 | 1.00 | 1.00 | 1.00 |
| 0.6 | 1.03 | 1.00 | 1.00 | 1.00 | 1.00 | 1.00 |
| Week | Blood Sugar Level (mg/dL) | Week | Blood Sugar Level (mg/dL) | ||||||||||||
|---|---|---|---|---|---|---|---|---|---|---|---|---|---|---|---|
| 1 | 370 | 175 | 193 | 192 | 197 | 225.4 | 197.6 | 21 | 149 | 157 | 126 | 160 | 137 | 145.8 | 174.0 |
| 2 | 313 | 255 | 170 | 294 | 203 | 247.0 | 207.5 | 22 | 132 | 203 | 229 | 184 | 123 | 174.2 | 174.0 |
| 3 | 270 | 205 | 190 | 203 | 194 | 212.4 | 208.5 | 23 | 126 | 190 | 237 | 187 | 139 | 175.8 | 174.4 |
| 4 | 190 | 221 | 177 | 173 | 171 | 186.4 | 204.1 | 24 | 143 | 204 | 200 | 245 | 187 | 195.8 | 178.6 |
| 5 | 185 | 242 | 278 | 202 | 189 | 219.2 | 207.1 | 25 | 117 | 219 | 170 | 197 | 158 | 172.2 | 177.4 |
| 6 | 190 | 228 | 184 | 165 | 268 | 207.0 | 207.1 | 26 | 114 | 201 | 264 | 169 | 178 | 185.2 | 178.9 |
| 7 | 177 | 166 | 173 | 224 | 234 | 194.8 | 204.6 | 27 | 122 | 179 | 235 | 167 | 226 | 185.8 | 180.3 |
| 8 | 175 | 239 | 268 | 198 | 176 | 211.2 | 205.9 | 28 | 134 | 213 | 182 | 137 | 269 | 187.0 | 181.6 |
| 9 | 165 | 176 | 196 | 201 | 246 | 196.8 | 204.1 | 29 | 132 | 284 | 180 | 207 | 235 | 207.6 | 186.8 |
| 10 | 183 | 150 | 243 | 188 | 172 | 187.2 | 200.7 | 30 | 110 | 246 | 110 | 272 | 117 | 171.0 | 183.7 |
| 11 | 185 | 165 | 164 | 188 | 231 | 186.6 | 197.9 | 31 | 107 | 234 | 212 | 201 | 141 | 179.0 | 182.7 |
| 12 | 177 | 189 | 178 | 186 | 186 | 183.2 | 195.0 | 32 | 125 | 220 | 225 | 113 | 214 | 179.4 | 182.1 |
| 13 | 165 | 274 | 248 | 183 | 179 | 209.8 | 197.9 | 33 | 105 | 190 | 196 | 187 | 252 | 186.0 | 182.9 |
| 14 | 169 | 177 | 159 | 269 | 207 | 196.2 | 197.6 | 34 | 107 | 232 | 209 | 257 | 225 | 206.0 | 187.5 |
| 15 | 170 | 218 | 197 | 140 | 186 | 182.2 | 194.5 | 35 | 116 | 234 | 241 | 214 | 182 | 197.4 | 189.5 |
| 16 | 155 | 170 | 206 | 155 | 176 | 172.4 | 190.1 | 36 | 118 | 189 | 194 | 183 | 164 | 169.6 | 185.5 |
| 17 | 160 | 231 | 228 | 220 | 241 | 216.0 | 195.3 | 37 | 116 | 207 | 271 | 213 | 219 | 205.2 | 189.4 |
| 18 | 152 | 161 | 179 | 162 | 168 | 164.4 | 189.1 | 38 | 105 | 173 | 179 | 226 | 165 | 169.6 | 185.5 |
| 19 | 162 | 173 | 111 | 153 | 200 | 159.8 | 183.2 | 39 | 108 | 215 | 246 | 259 | 236 | 212.8 | 190.9 |
| 20 | 165 | 196 | 173 | 168 | 158 | 172.0 | 181.0 | 40 | 109 | 281 | 134 | 200 | 232 | 191.2 | 191.0 |
© 2019 by the authors. Licensee MDPI, Basel, Switzerland. This article is an open access article distributed under the terms and conditions of the Creative Commons Attribution (CC BY) license (http://creativecommons.org/licenses/by/4.0/).
Share and Cite
Aslam, M.; Rao, G.S.; Khan, N.; Al-Abbasi, F.A. EWMA Control Chart Using Repetitive Sampling for Monitoring Blood Glucose Levels in Type-II Diabetes Patients. Symmetry 2019, 11, 57. https://doi.org/10.3390/sym11010057
Aslam M, Rao GS, Khan N, Al-Abbasi FA. EWMA Control Chart Using Repetitive Sampling for Monitoring Blood Glucose Levels in Type-II Diabetes Patients. Symmetry. 2019; 11(1):57. https://doi.org/10.3390/sym11010057
Chicago/Turabian StyleAslam, Muhammad, Gadde Srinivasa Rao, Nasrullah Khan, and Fahad A. Al-Abbasi. 2019. "EWMA Control Chart Using Repetitive Sampling for Monitoring Blood Glucose Levels in Type-II Diabetes Patients" Symmetry 11, no. 1: 57. https://doi.org/10.3390/sym11010057
APA StyleAslam, M., Rao, G. S., Khan, N., & Al-Abbasi, F. A. (2019). EWMA Control Chart Using Repetitive Sampling for Monitoring Blood Glucose Levels in Type-II Diabetes Patients. Symmetry, 11(1), 57. https://doi.org/10.3390/sym11010057


