An Intelligent Improvement of Internet-Wide Scan Engine for Fast Discovery of Vulnerable IoT Devices


Abstract
:1. Introduction
2. Related Works
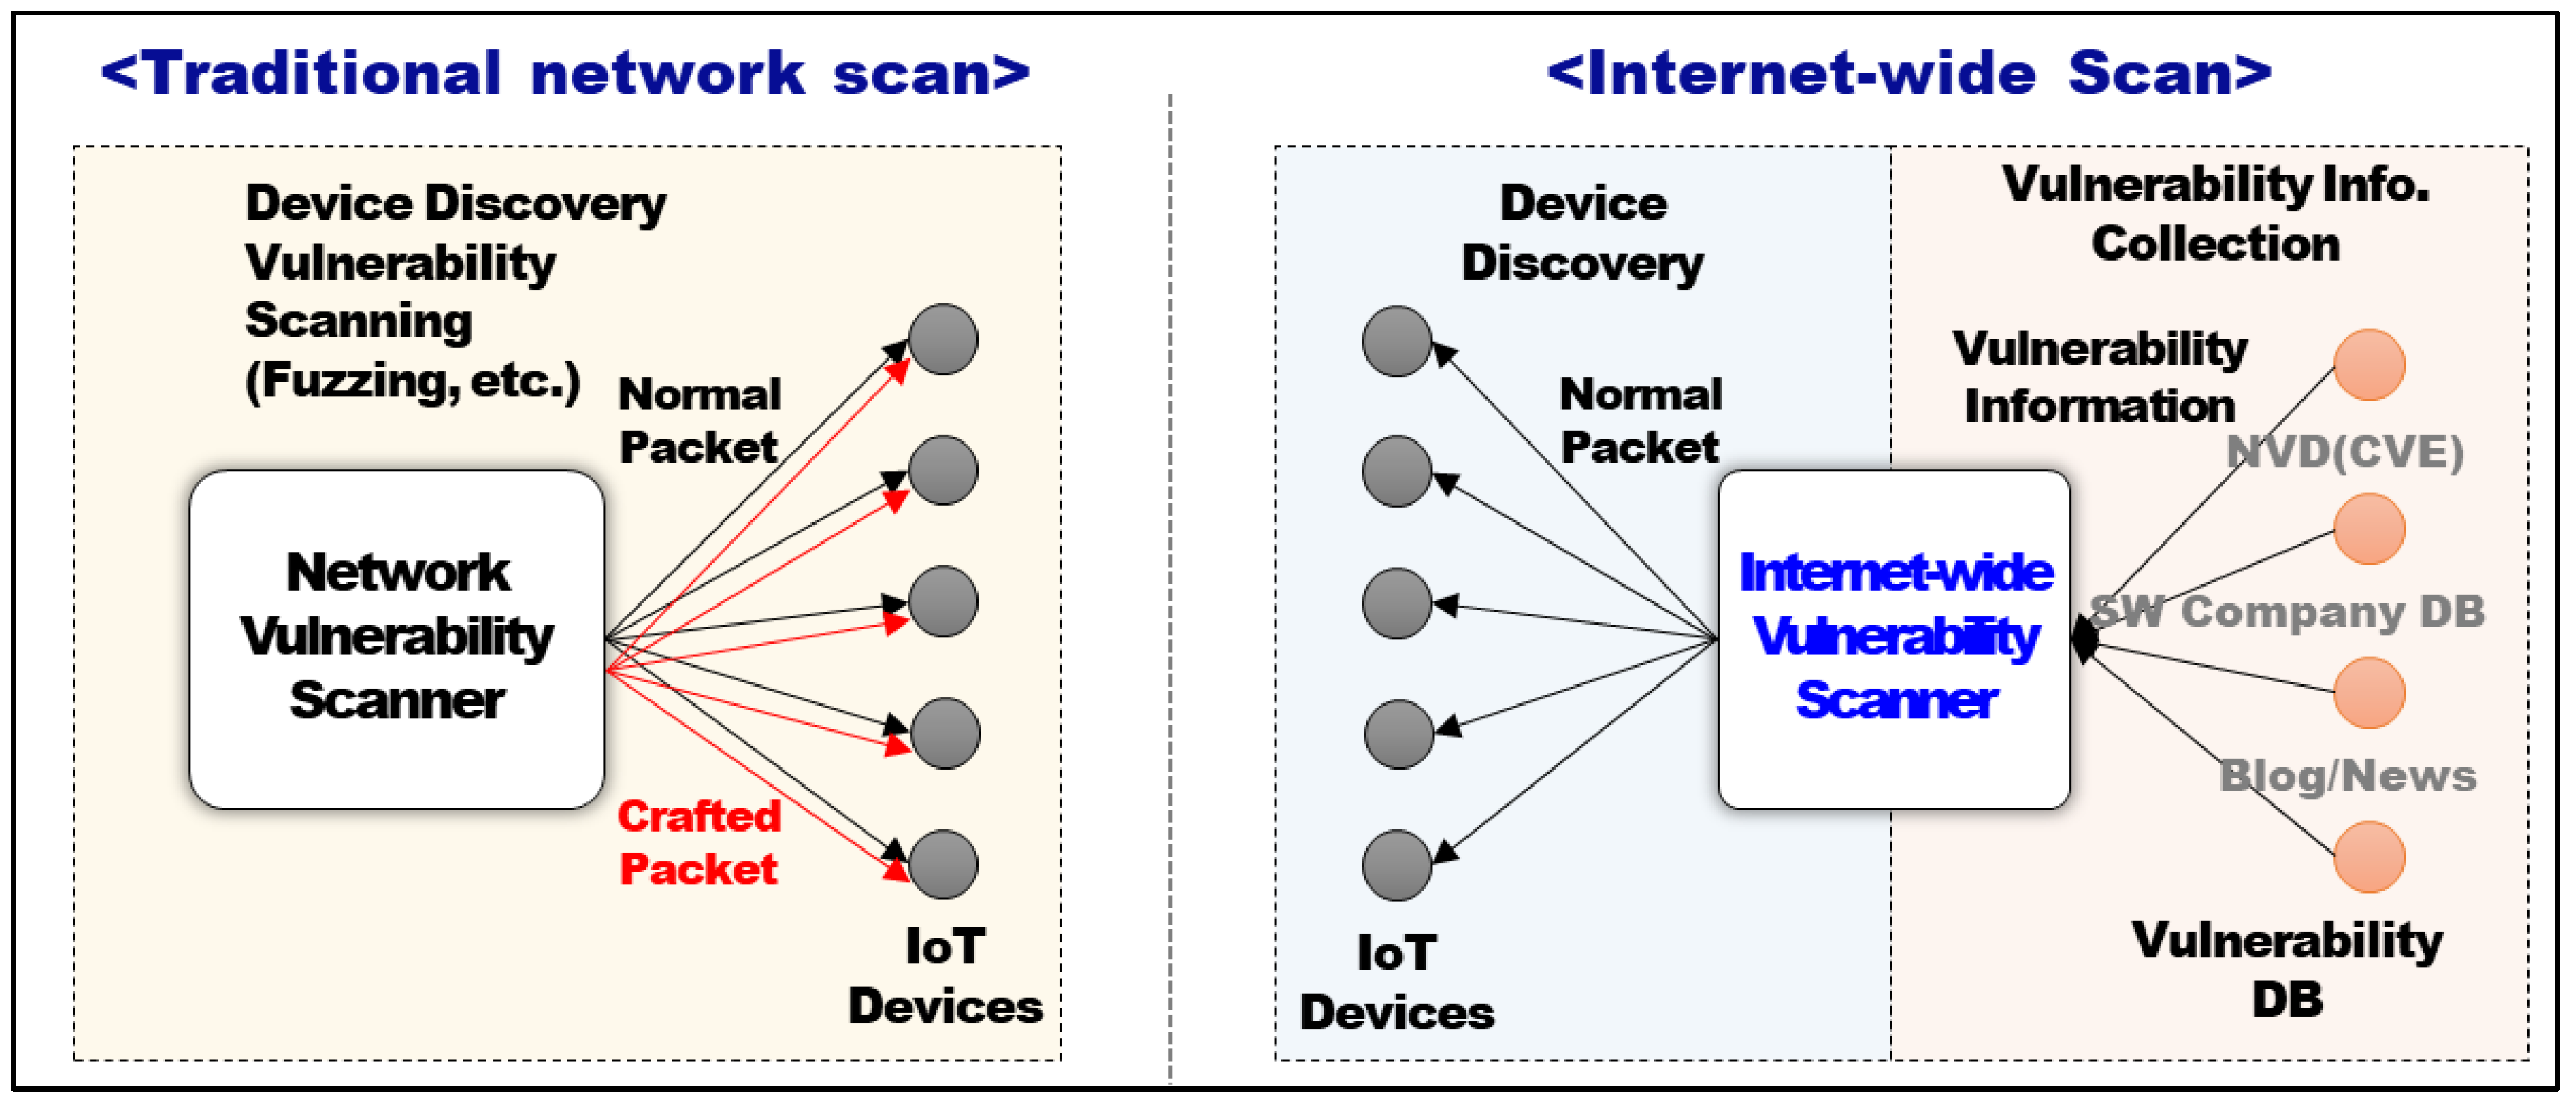
2.1. The Concept of Internet-Wide Vulnerability Scanning
2.2. Preliminary Research Related to Internet-Wide Scanning
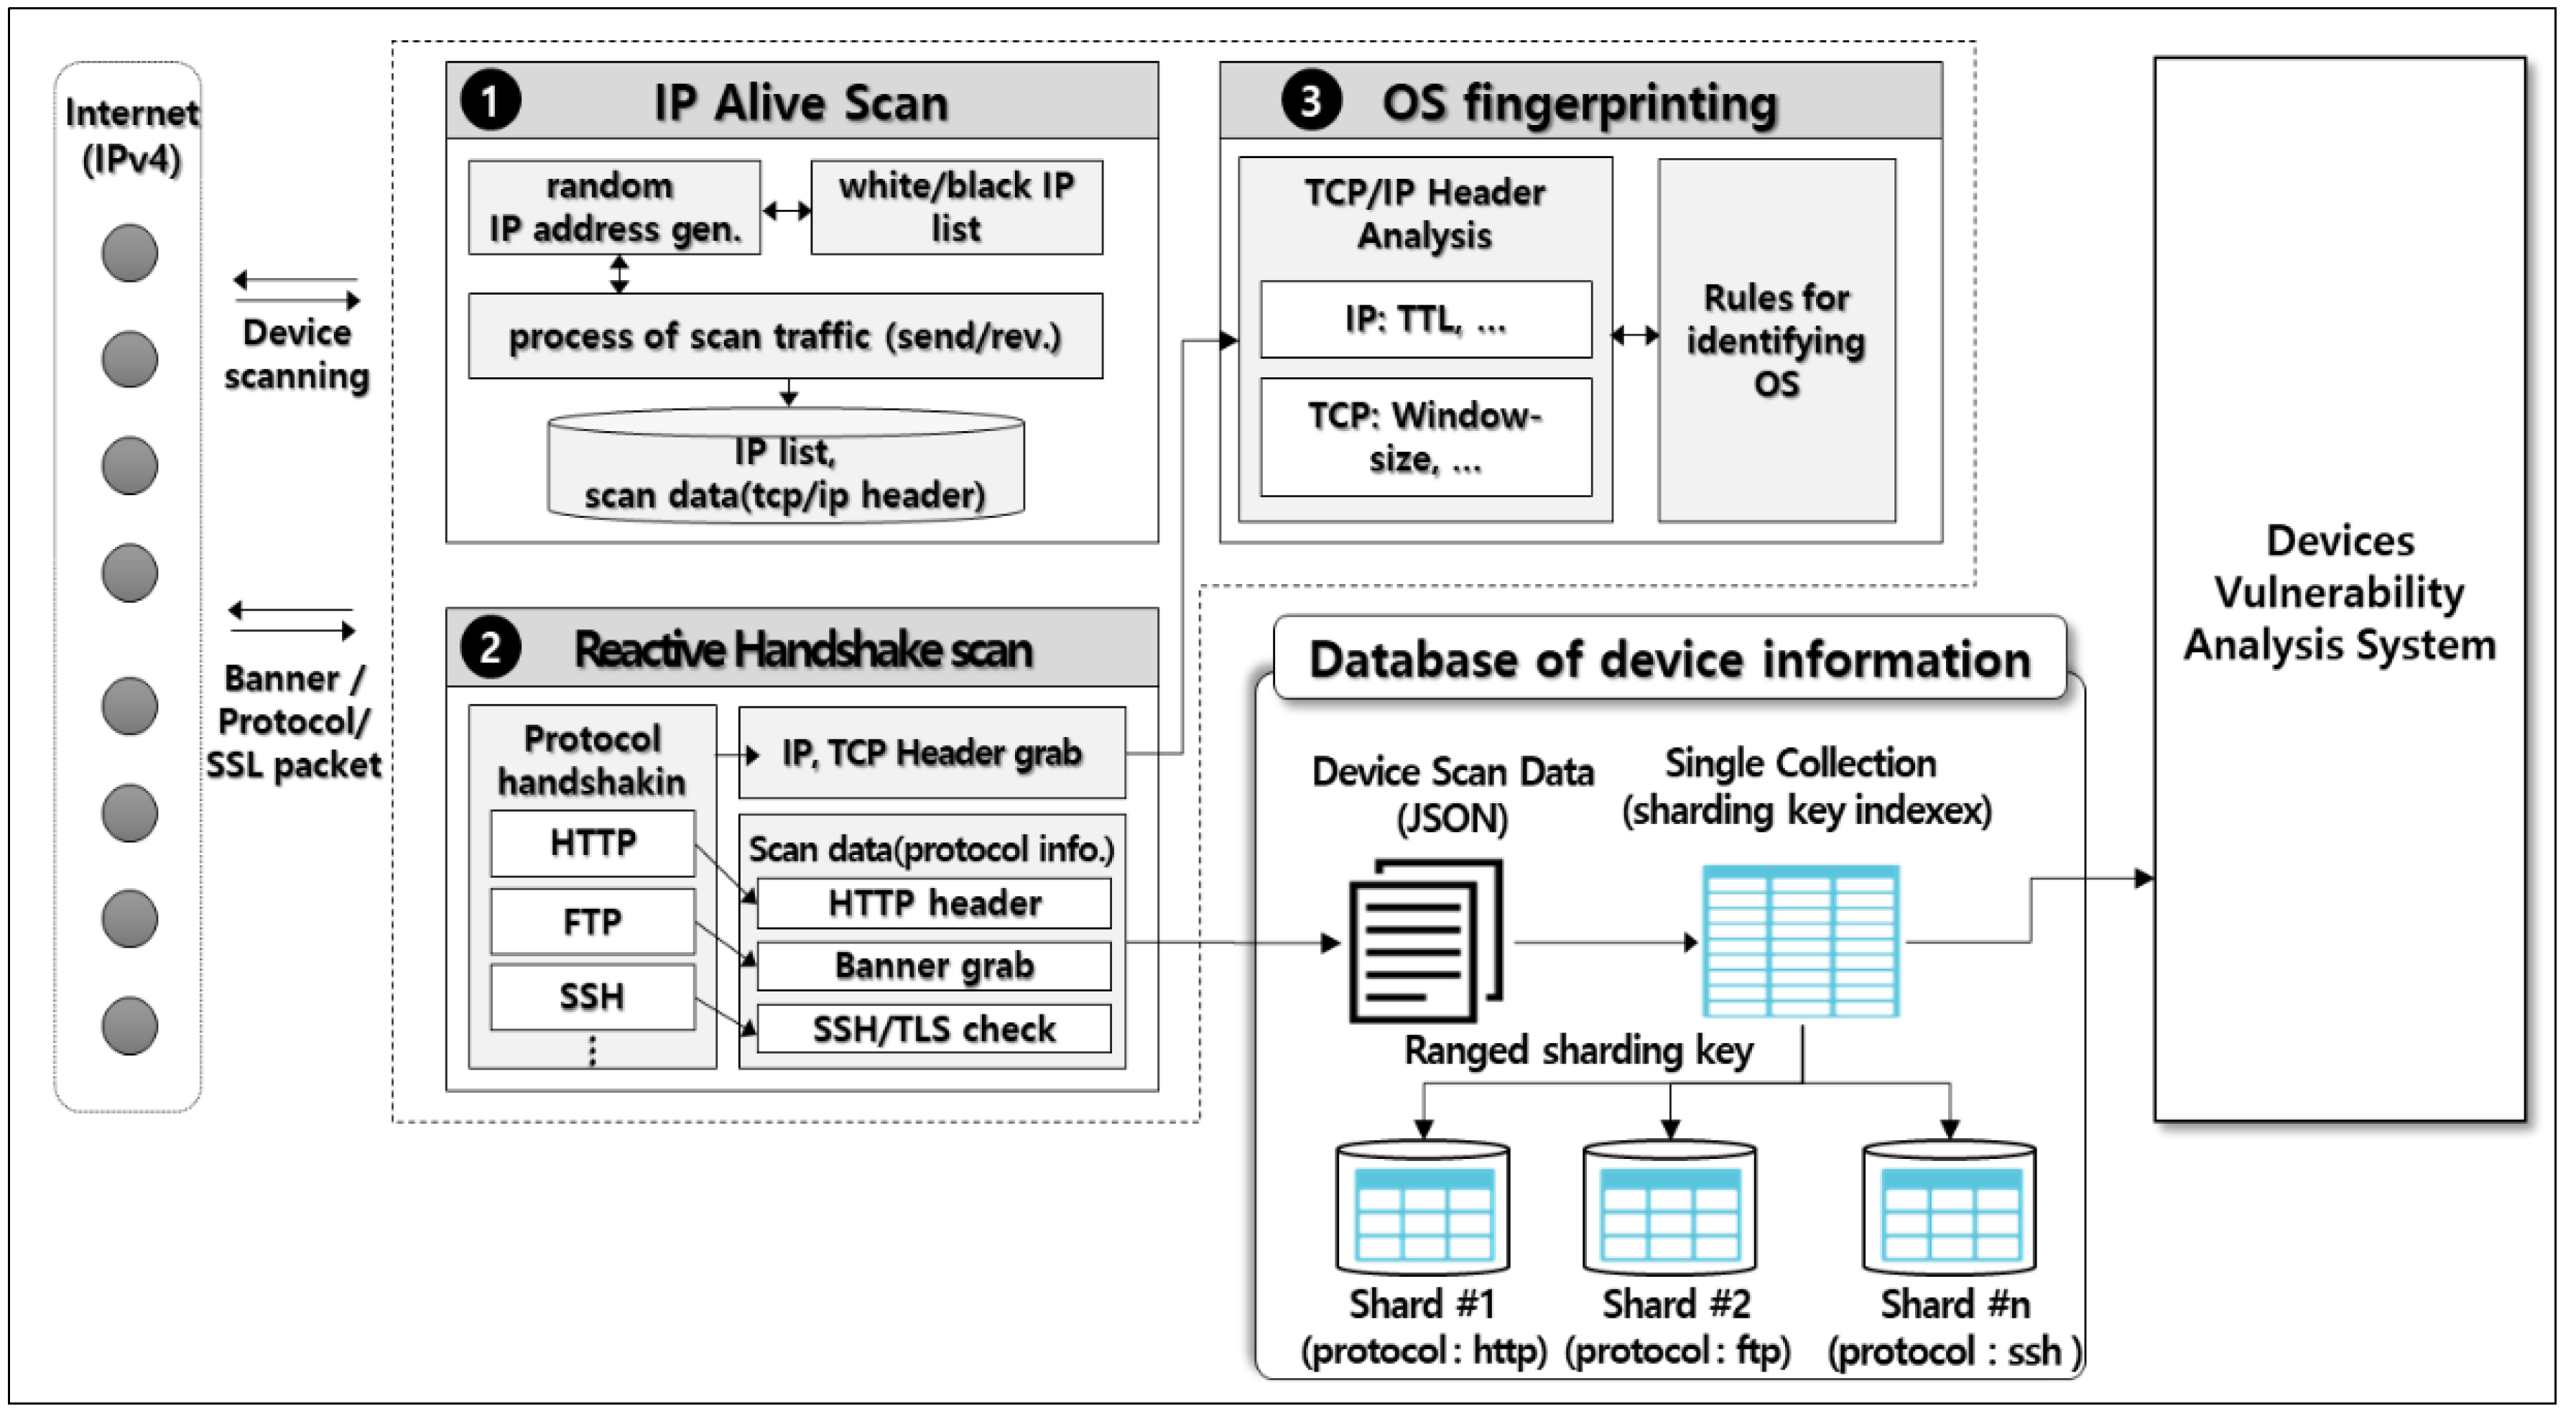
3. Proposed Model
3.1. IP Alive Scan Module
| Algorithm 1: The Randomization of IP Address Generation |
| function Random IP Generation(); |
| begin |
| a ← random.randrange(1, 4294967295); |
| count ← 0; |
| ipinit ← a; |
| socket.inet_ntoa(struct.pack(‘!L’, ipinit)); |
| while (count < 65535) do |
| if a < 16583719 do |
| a ← 4294967295 + a |
| end if |
| a ← a − 16583719; |
| ipinit ← a; |
| b ← str(socket.inet_ntoa(struct.pack(‘!L’, ipinit))); |
| count = count + 1; |
| end while |
| end |
3.2. Reactive Handshake Protocol Scan Module
3.3. OS Fingerpriting Scan Module
4. Experimental Results
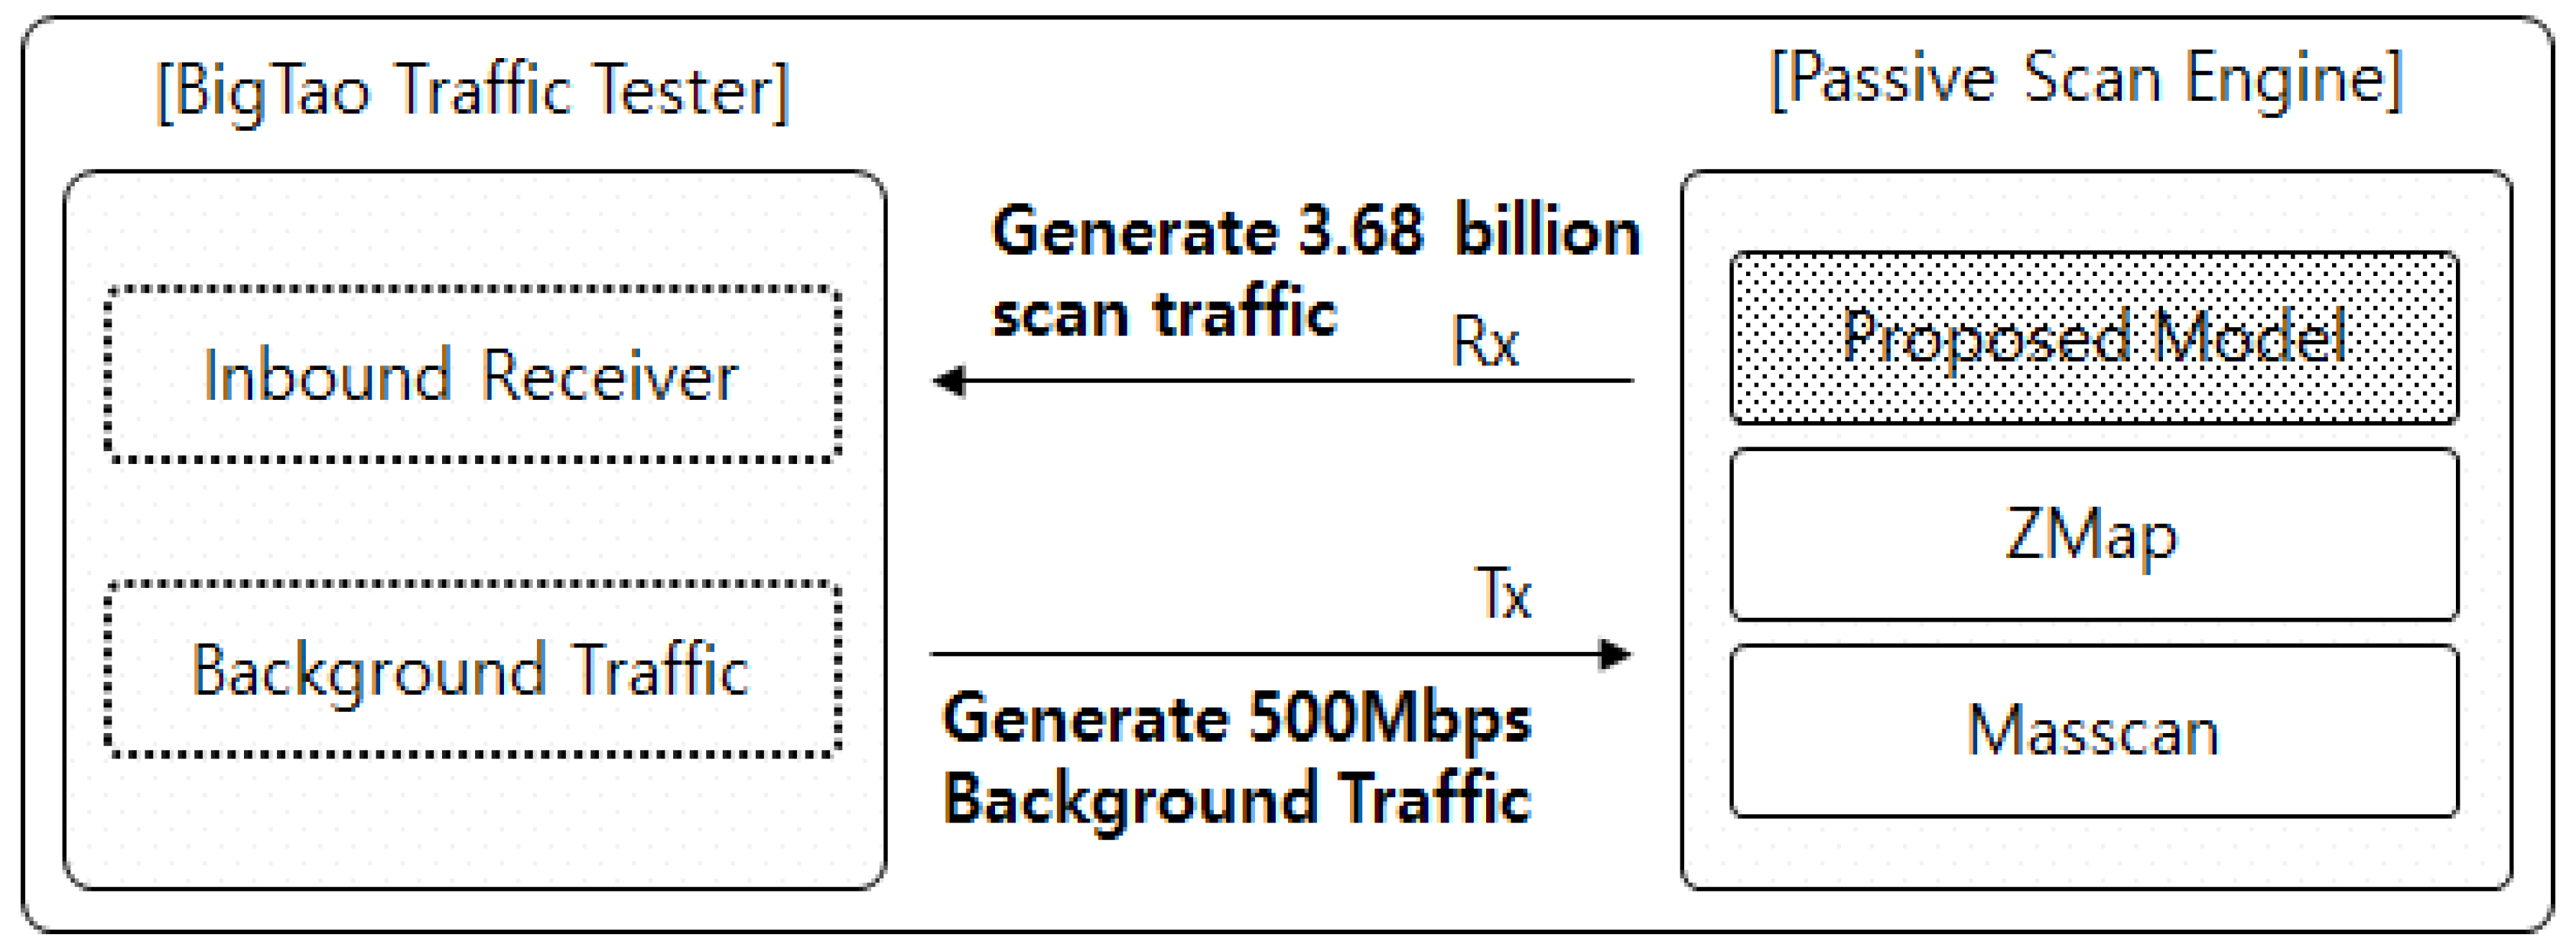
4.1. Summary of Experiment Methods
4.2. IP Alive Scan Performance in the Test Environment
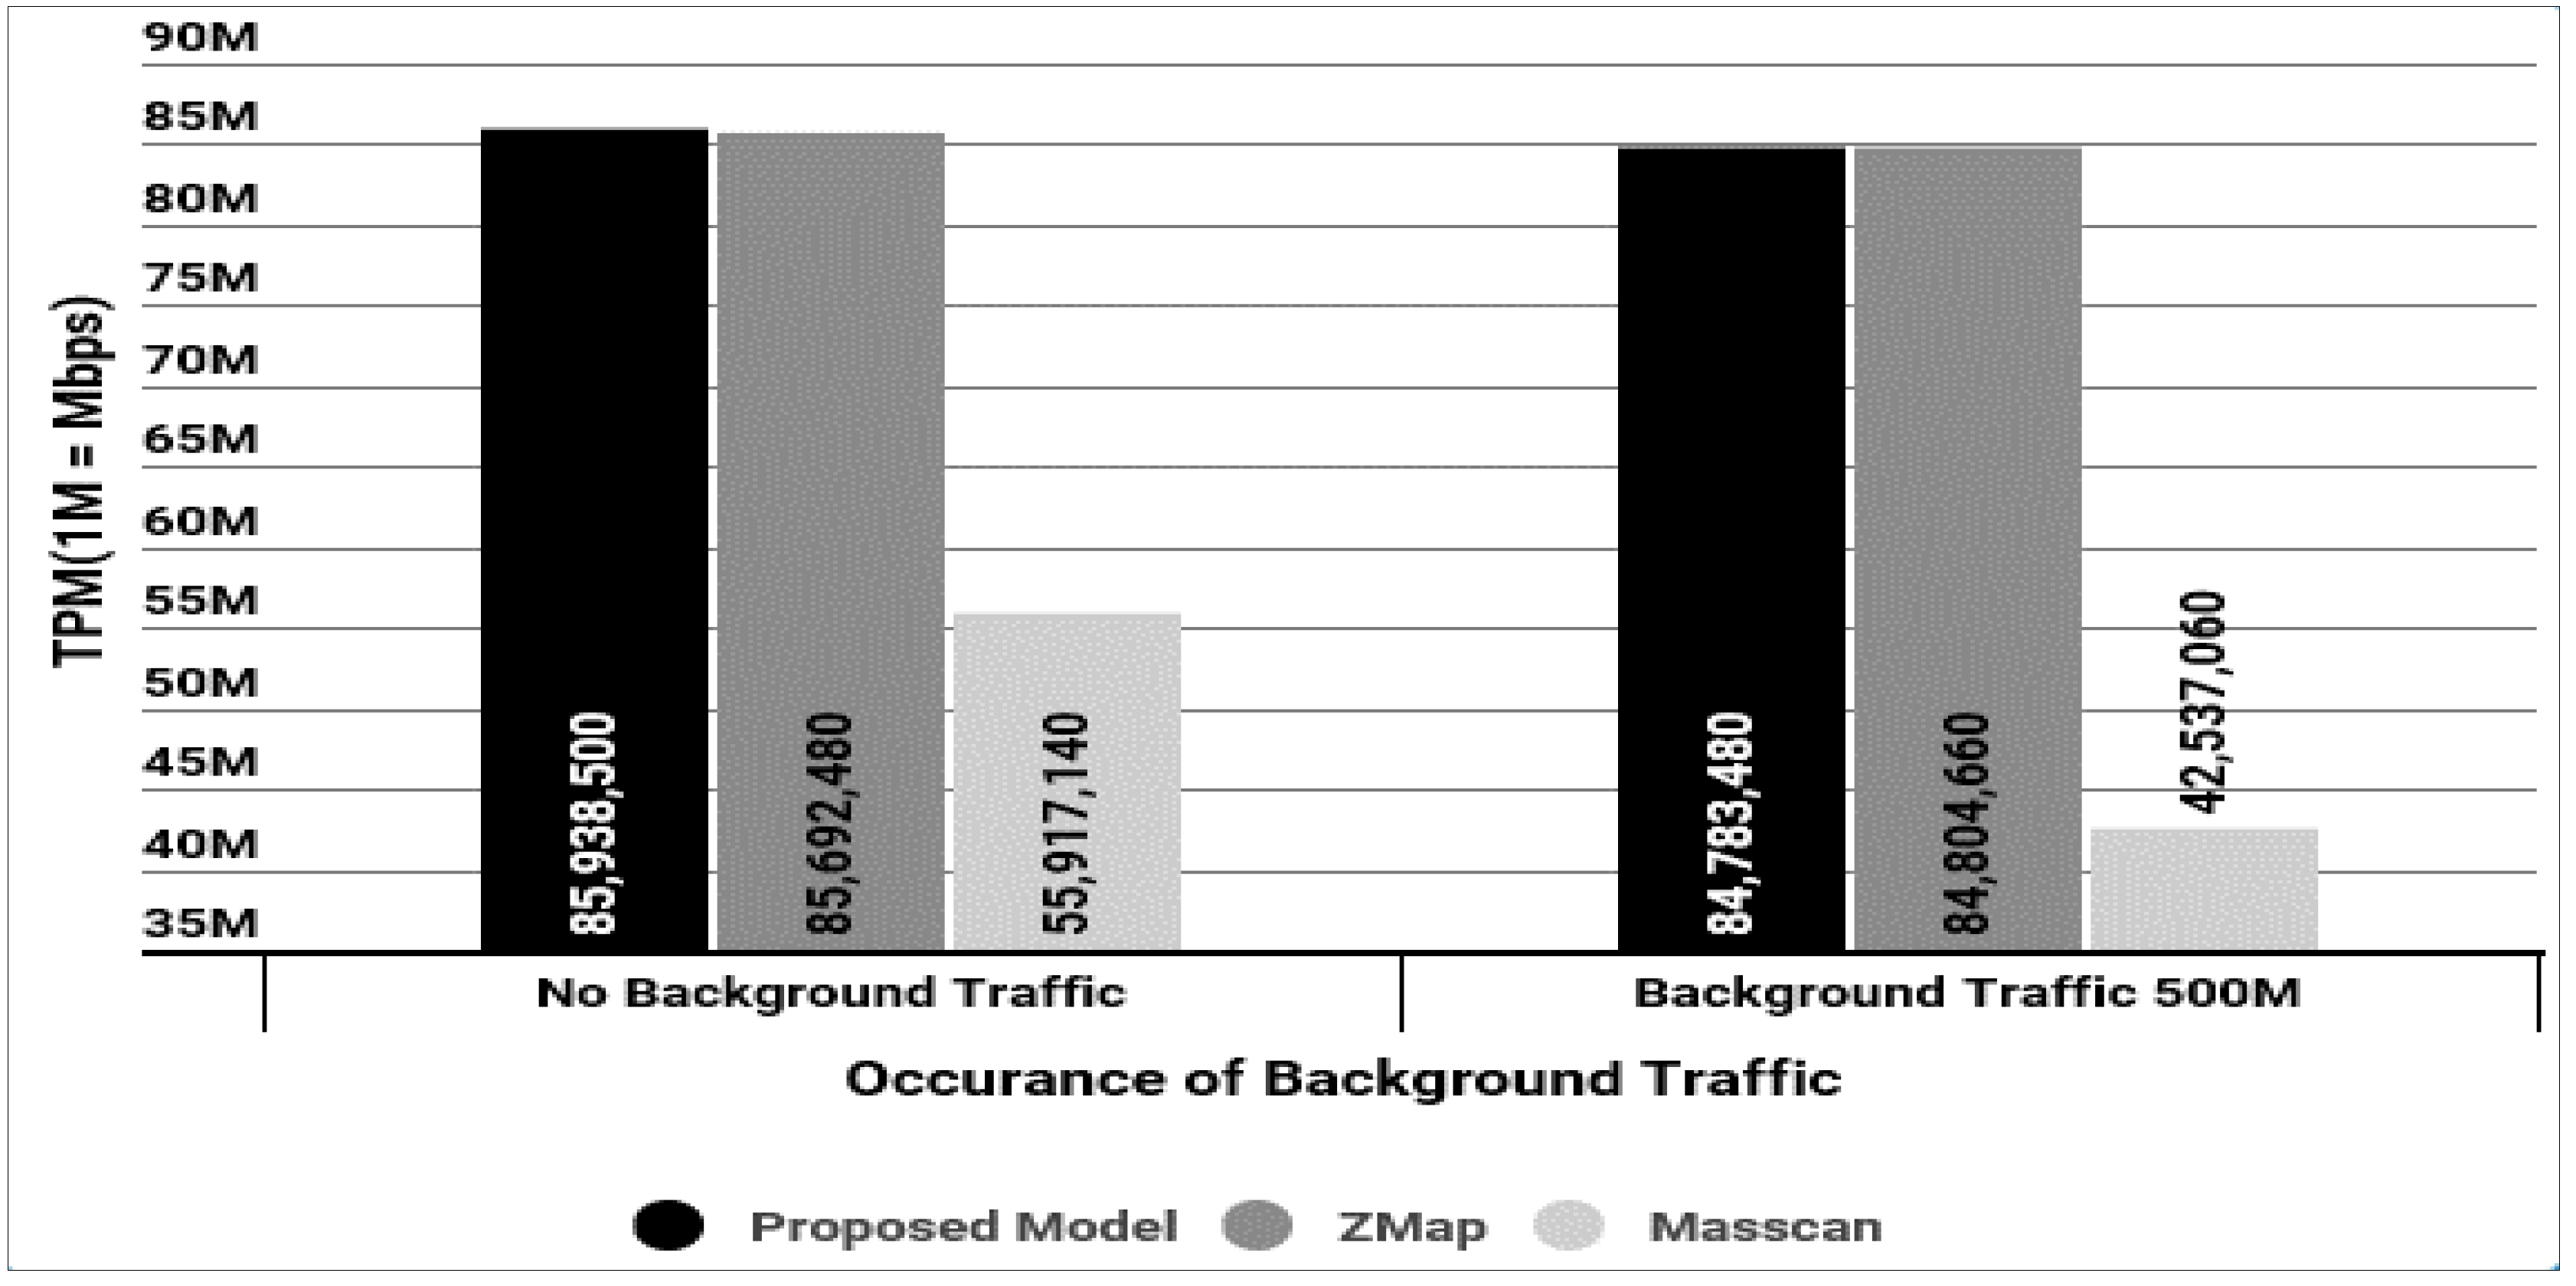
4.2.1. Throughput per Minute of IP Alive Scan
- (1)
- BigTao tester generates 500 Mbps traffic to the DUT.
- (2)
- DUT generates 3.67 billion scan packets (TCP SYN/ICMP) for each of the three technologies.
- (3)
- BigTao tester checks the total number of frames collected during a period of 10 min.
- (4)
- TPM is calculated based on the total number of frames.
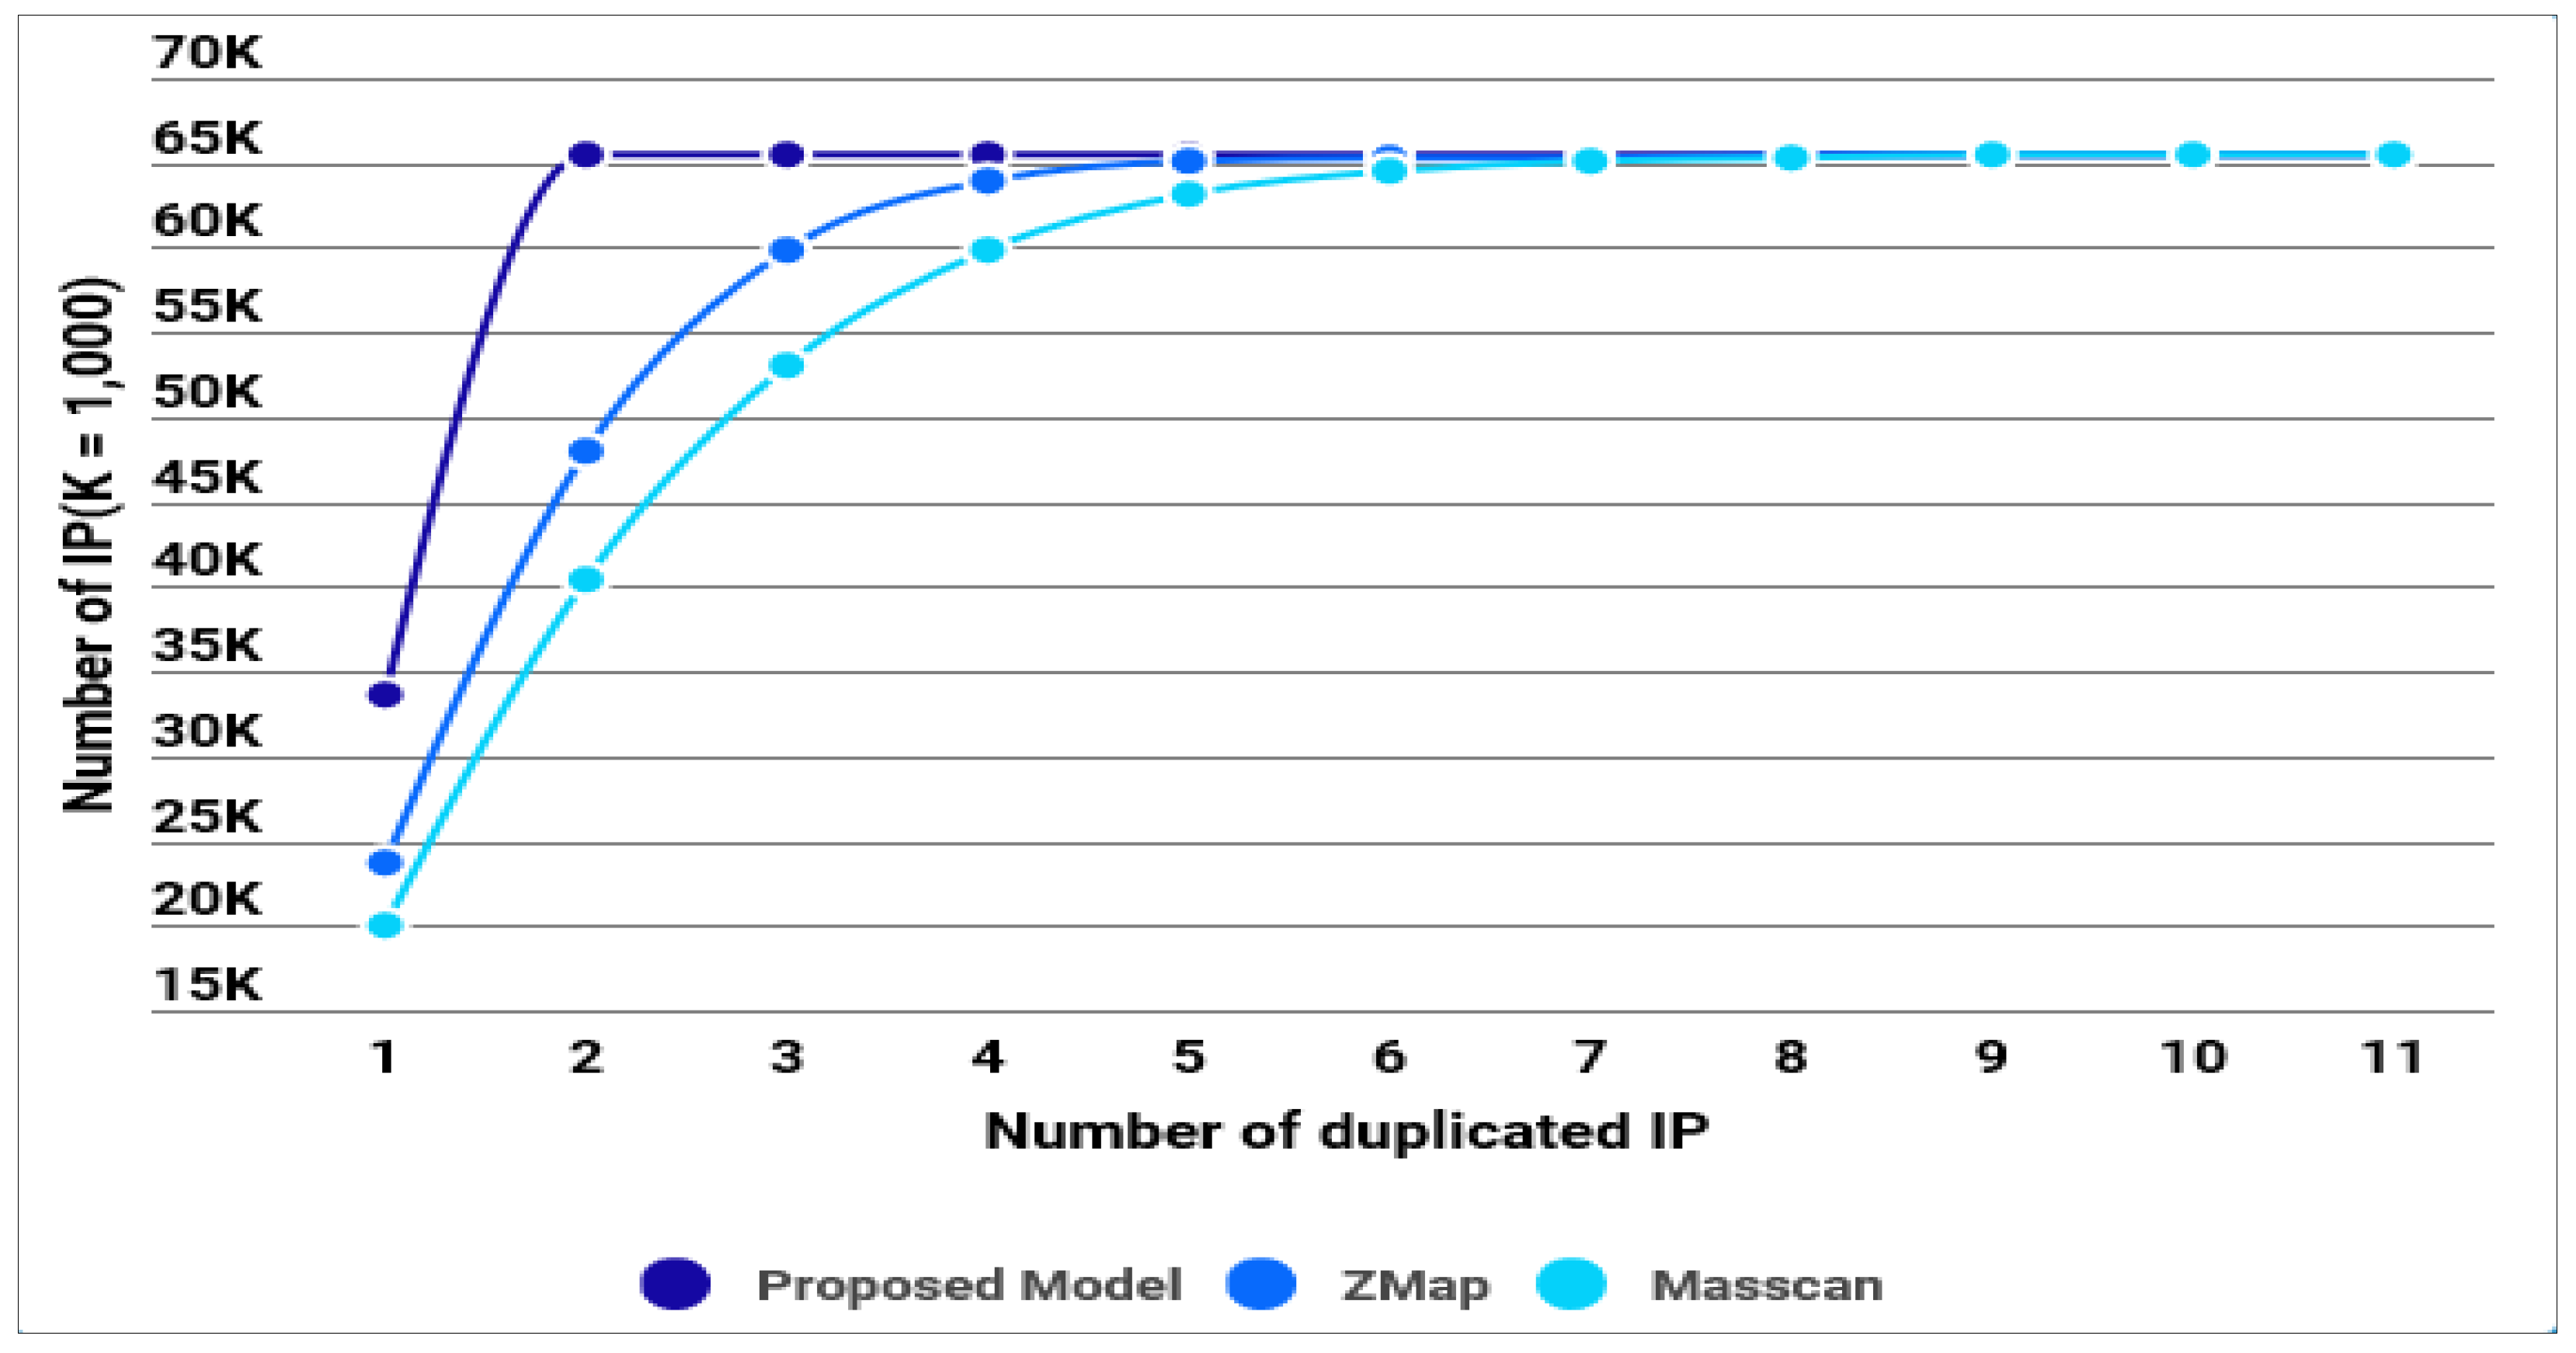
4.2.2. Randomization of IP Address Generation
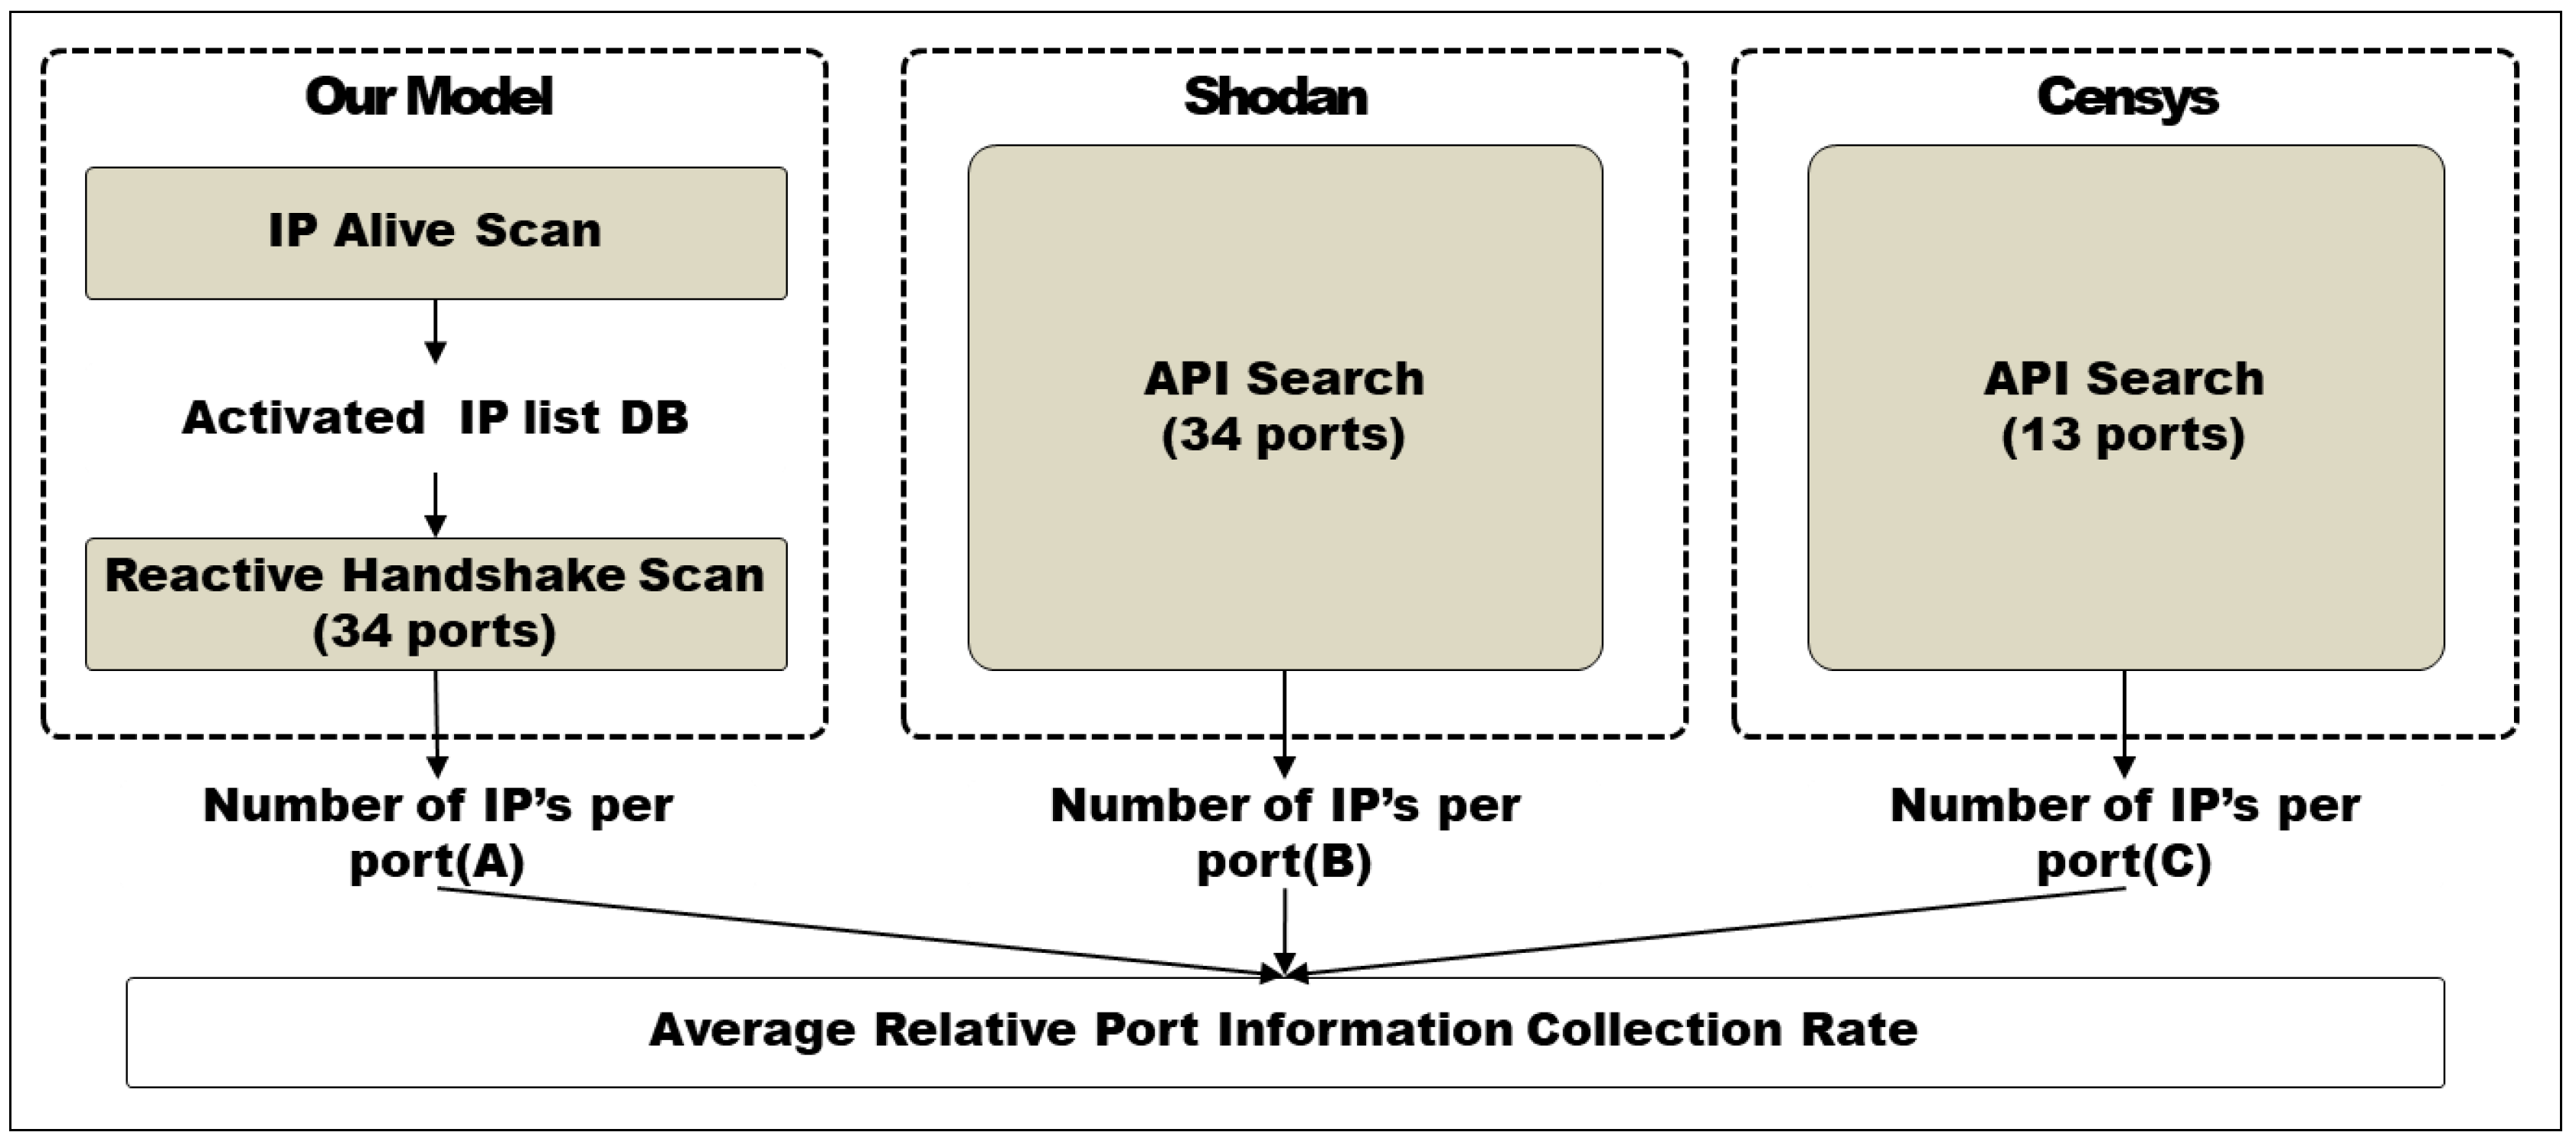
4.3. Average Protocol (Port) Information Collection Rate (%)
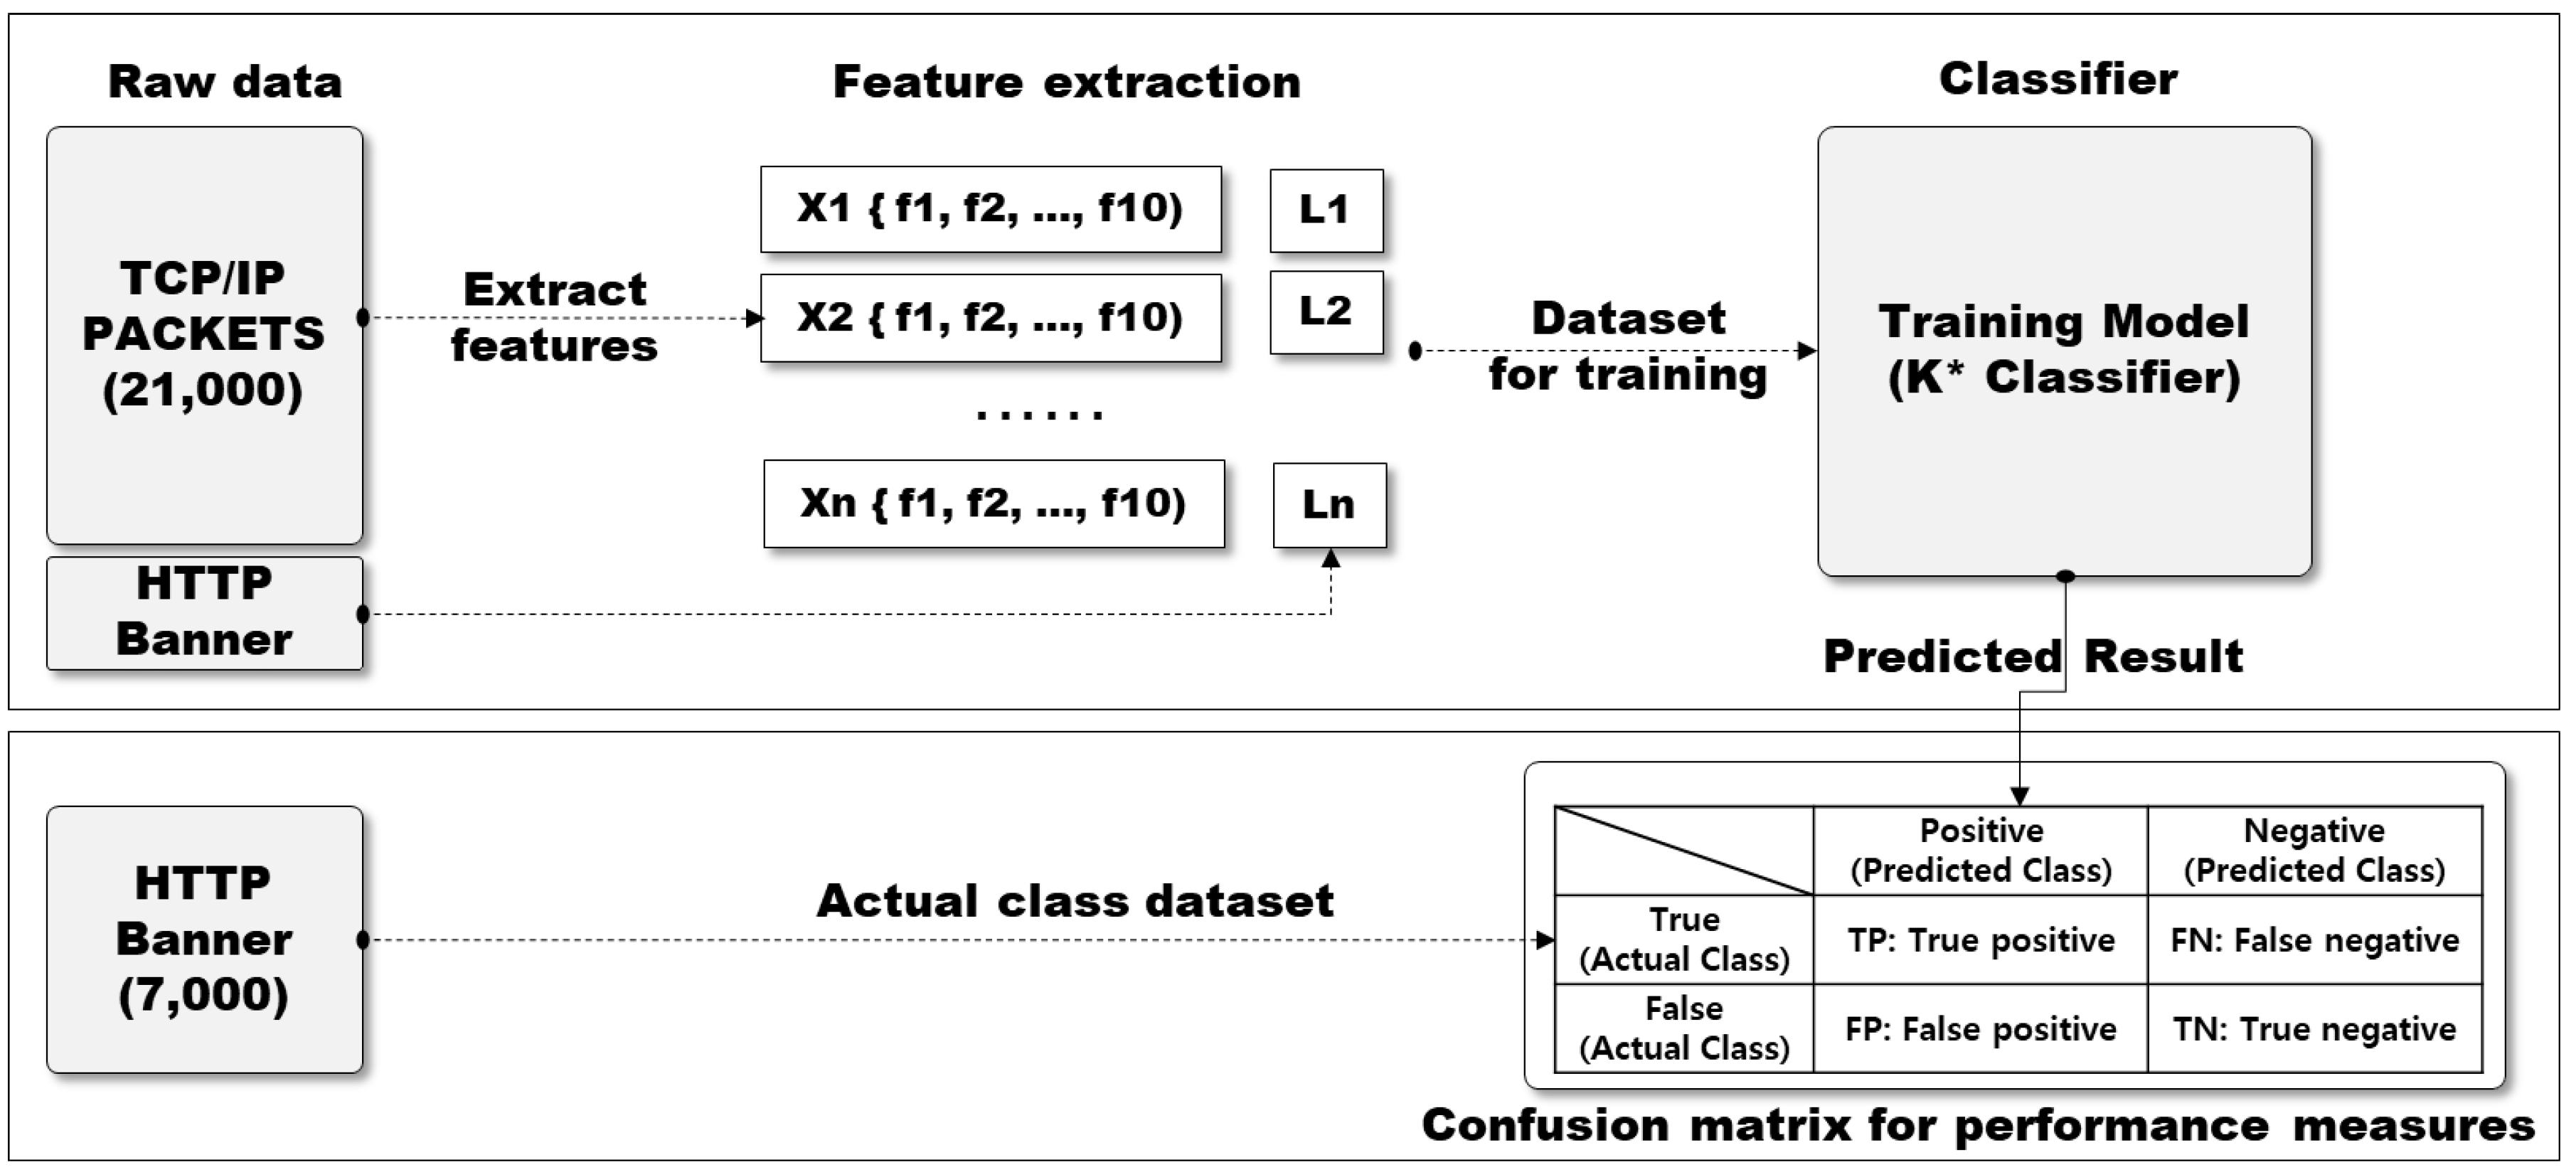
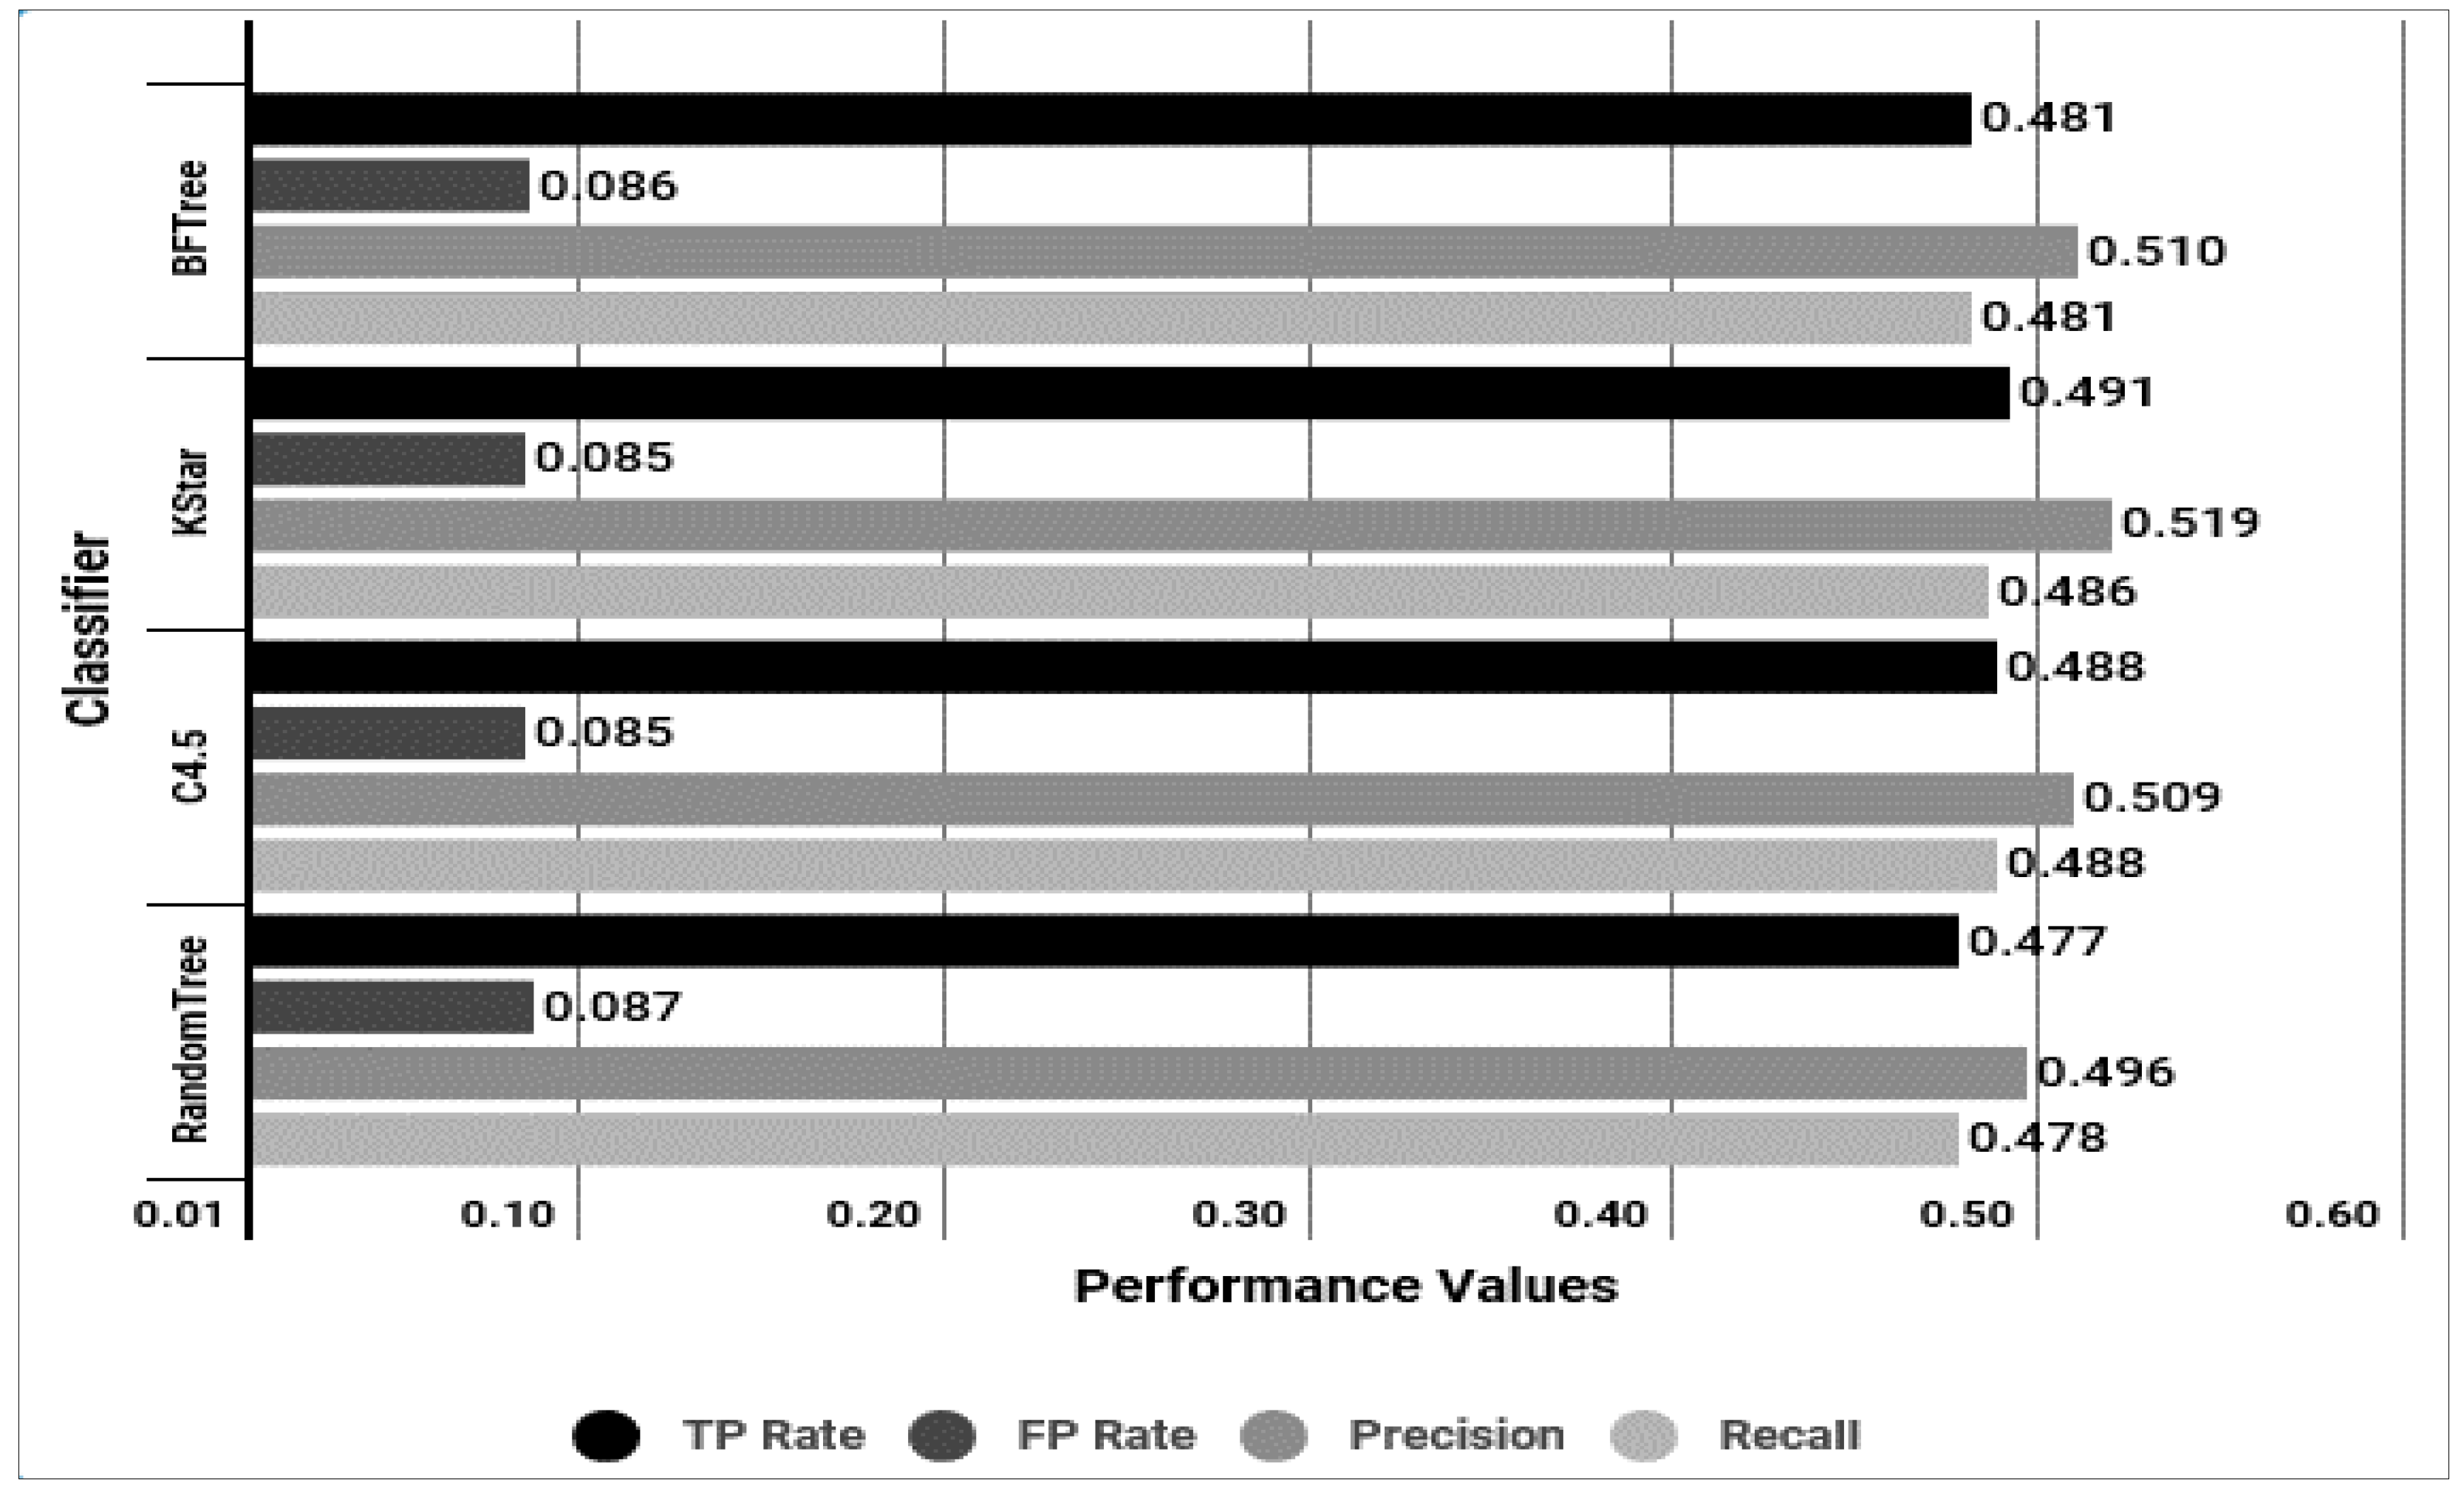
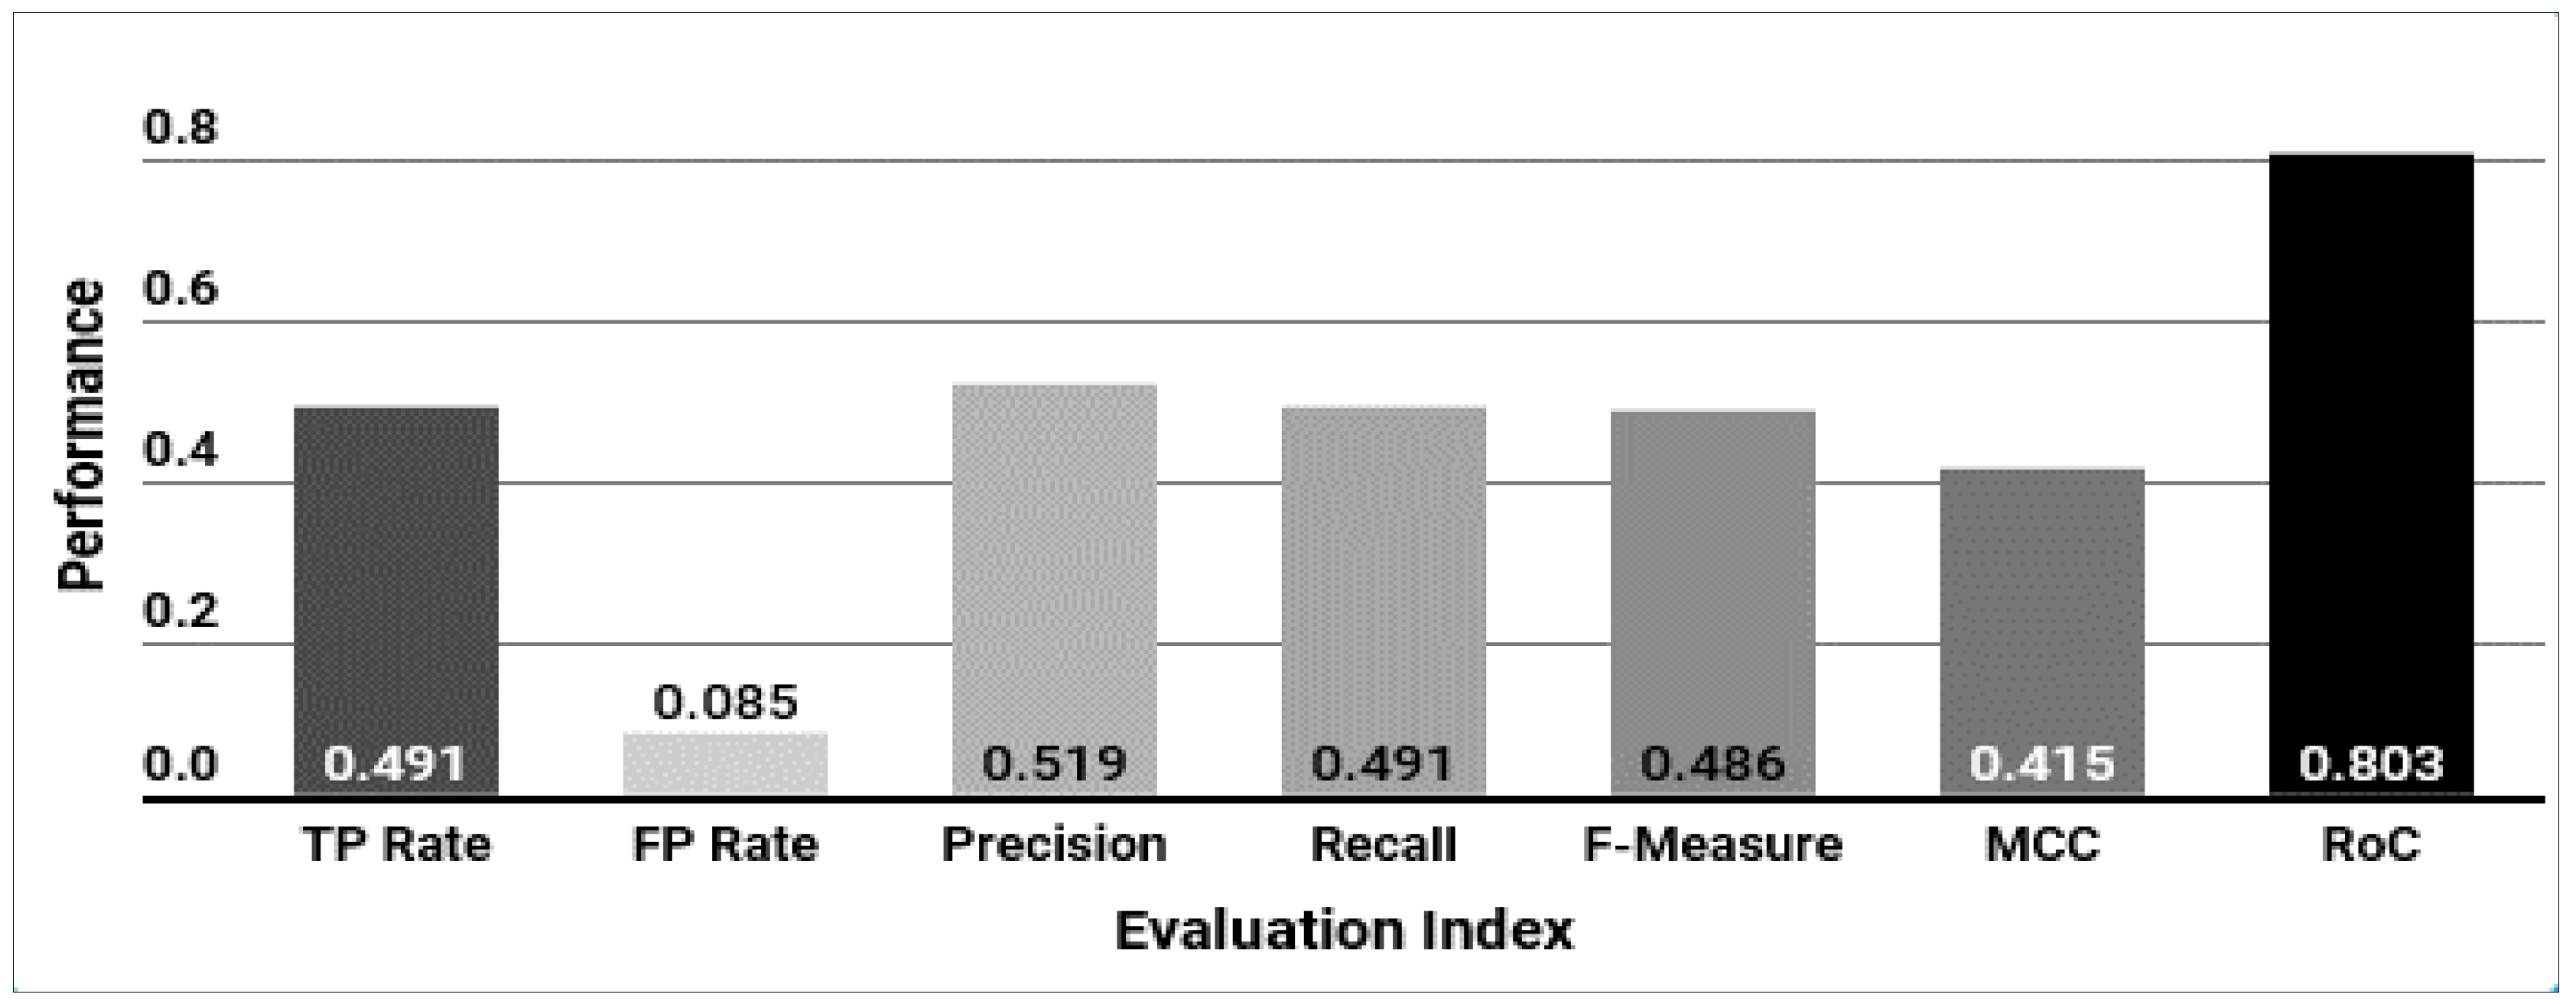
4.4. Accuracy of OS Fingerprinting Identificatiion
- (1)
- Each Xi is a d dimensional feature vector extracted from TCP/IP headers, such as Window Size, MSS, Timestamps, NOP, sackOK, IPID, Total Length, TTL, etc.
- (2)
- Each Yi is the corresponding label information which uses OS information extracted from HTTP banner grabbing on the same IP.
- (3)
- N is the total number of training input data, m is the number of OS types.
5. Conclusions
Author Contributions
Acknowledgments
Conflicts of Interest
References
- Gartner Newsroom. Available online: https://www.gartner.com/newsroom/id/3598917 (accessed on 7 February 2017).
- KISA. 2016 Trend of Mirai Malware. Available online: https://www.krcert.or.kr/data/reportList.do (accessed on 7 February 2016).
- Kolias, C.; Kambourakis, G.; Stavrou, A.; Voas, J. DDoS in the IoT: Mirai and Other Botnets. Computer 2017, 50, 40–41. [Google Scholar] [CrossRef]
- Cisco Systems. Midyear Security Report. Percentage of Devices Running Known Vulnerabilities by Age; Cisco Systems: San Jose, CA, USA, 2016; p. 30. [Google Scholar]
- HP Inc. HP Study Reveals Smartwatches Vulnerable to Attack. Available online: http://www8.hp.com/us/en/hp-news/press-release.html?id=2037386#.WmLdU6hl8dU (accessed on 22 July 2015).
- IBM. Anatomy of an IoT Malware Attack. Available online: https://www.ibm.com/developerworks/library/iot-anatomy-iot-malware-attack/ (accessed on 31 October 2017).
- Chang, S.H.; William, T. Design of an authentication and key management system for a smart meter gateway in AMI. In Proceedings of the 2017 IEEE 6th Global Conference on Consumer Electronics (GCCE), Nagoya, Japan, 24–27 October 2017. [Google Scholar]
- Zhang, Y.; Xiang, Y.; Huang, X.; Chen, X.; Alelaiwi, A. A matrix-based cross-layer key establishment protocol for smart homes. In Information Sciences; Elsevier: New York, NY, USA, 2018; Volume 429, pp. 390–405. [Google Scholar]
- Suryani, V.; Sulistyo, S.; Widyawan, W. Internet of Things (IoT) Framework for Granting Trust among Objects. J. Inf. Process. Syst. 2017, 13, 1613–1627. [Google Scholar]
- Kim, M.; Lim, N.Y.; Park, J.H. A Security Generic Service Interface of Internet of Things (IoT) Platforms. Symmetry 2017, 9, 171. [Google Scholar] [CrossRef]
- Kang, W.M.; Moon, S.Y.; Park, J.H. An enhanced security framework for home. In Human-Centric Computing & Information Sciences; Springer: Berlin, Germany, 2017; Volume 7, pp. 1–12. [Google Scholar]
- Kim, M.S.; Lim, K.S.; Song, J.S.; Jun, M.S. An Efficient Secure Scheme Based on Hierarchical Topology in the Smart Home Environment. Symmetry 2017, 9, 143. [Google Scholar] [CrossRef]
- Maity, S.; Park, J.H. Powering IoT Devices: A Novel Design and Analysis Technique. J. Converg. 2016, 7, 1–18. [Google Scholar]
- Xiruo, L.; Meiyuan, Z.; Sugang, L.; Zhang, F.; Trappe, W. A Security Framework for the Internet of Things in the Future Internet Architecture. Future Internet 2017, 9, 27. [Google Scholar]
- Kim, H.K.; Kim, T.E.; Ko, E.H. Management platform of threats information in IoT environment. In Journal of Ambient Intelligence and Humanized Computing; Springer: Berlin, Germany, 2017; pp. 1–10. [Google Scholar]
- Durumeric, Z.; Bailey, M.; Halderman, J.H. An Internet-Wide View of Internet-Wide Scanning. In Proceedings of the 23rd USENIX Security Symposium, San Diego, CA, USA, 20–22 August 2014; pp. 65–78. [Google Scholar]
- Shodan Project. Available online: https://www.Shodan.io/ (accessed on 10 December 2017).
- Trapickin, R. Who is scanning the internet? In Proceedings of the Seminars Future Internet and Innovative Internet Technologies and Mobile Communications, Muchnich, Germany, September 2015; pp. 81–88. [Google Scholar]
- Myers, D.; Foo, E.; Radke, K. Internet-wide scanning taxonomy and framework. In Proceedings of the Australasian Information Security Conference, Sydney, Australia, 21–30 January 2015; Australian Computer Society, Inc.: Sydney, Australia, 2015; pp. 61–65. [Google Scholar]
- Matherly, J. Complete Guide to Shodan Collect, Analyze, Visualize, and Make Internet Intelligence Work for You. Available online: https://leanpub.com/shodan (accessed on 10 December 2017).
- Genge, B.; Enachscu, C. ShoVAT: Shodan-based vulnerability assessment tool for Internet-facing services. Secur. Commun. Netw. 2015, 9, 2696–2714. [Google Scholar] [CrossRef]
- National Vulnerability Database. NIST. Available online: https://nvd.nist.gov/ (accessed on 10 December 2017).
- Durumeric, Z.; Adrian, D.; Mirian, A.; Bailey, M.; Halderman, J.A. A Search Engine Backed by Internet-Wide Scanning. In Proceedings of the 22nd ACM Conference on Computer and Communications Security, Denver, CO, USA, 12–16 October 2015; ACM: New York, NY, USA, 2015; pp. 542–553, ISBN 978-1-4503-3832-5. [Google Scholar]
- Hart, P. The condensed nearest neighbor rule. IEEE Trans. Inf. Theory 1968, 14, 515–516. [Google Scholar] [CrossRef]
- Douglas, P.K.; Harris, S.; Yuille, A.; Cohen, M.S. Performance comparison of machine learning algorithms and number of independent components used in fMRI decoding of belief vs. disbelief. Neuroimage 2011, 565, 544–553. [Google Scholar] [CrossRef] [PubMed]
- Aljazzar, H.; Leue, S. K*: A Heuristic Search Algorithm for Finding the k Shortest Paths. Artif. Intell. 2011, 175, 2129–2154. [Google Scholar] [CrossRef]
- Clary, J.G.; Leonard, E.T. K*: An Instance-based Learner Using an Entropic Distance Measure. In Proceedings of the 12th International Conference on Machine Learning, New York, NY, USA, 16–21 July; Elsevier: New York, NY, USA, 1995; Volume 175, pp. 2129–2154. [Google Scholar]
- Masscan Project. Available online: https://github.com/robertdavidgraham/masscan (accessed on 10 December 2017).
- Hickman, B.; Newman, D.; Tadjudin, S.; Martin, T. IETF RFC 3511: Benchmarking Methodology for Firewall Performance. IETF, 2003. Available online: https://tools.ietf.org/html/rfc3511 (accessed on 5 January 2018).
- Lee, H.S.; Kim, M.S. Research on OS fingerprinting method for real-time traffic analysis system. J. Korea Inst. Commun. Inf. Sci. 2011, 36, 443–450. [Google Scholar] [CrossRef]
- Anderson, B.; Mcgrew, D. OS fingerprinting: New techniques and a study of information gain and obfuscation. arXiv, 2017; arXiv:1706.08003. [Google Scholar]


| Techniques | Traditional Network Scan | Internet-Wide Scan |
|---|---|---|
| Scan Range | Devices connected to local private network | Internet-wide devices |
| Characteristic | Very intrusive scan | Less intrusive (Non-intrusive) scan |
| Scan Method | Authorized User → Credential Scan (PW crack, fuzzing, and crafted packets) | Unauthorized User → Non Credential Scan (banners and normal messages) |
| Vulnerability Analysis | Known/Unknown class vulnerability analysis (network/service level) | Device information DB → Known class vulnerability detection |
| Analysis Method | Dynamic/static fuzzing analysis | Vulnerability DB |
| Related Technology | Nmap, Masscan, Nessus, etc. | Shodan (ShoVAT), ZMap (Censys) |
| Classification | Lab Environment (Back Traffic) | Real Internet Traffic | |
|---|---|---|---|
| 0 M | 500 M | ||
| Our Model | 85,938,500 | 84,783,480 | 72,750,000 |
| ZMap | 85,692,480 | 84,804,660 | Unable to measure |
| Masscan | 55,917,140 | 42,537,660 | Unable to measure |
| Classification | Single IP | 2-Duplicate IP | 3-Duplicate IP | 4-Duplicate IP | 5 or More-Duplicate IP |
|---|---|---|---|---|---|
| Our Model | 67.8% | 32.2% | 0.0% | 0.0% | 0.0% |
| ZMap | 57.7% | 29.5% | 9.7% | 2.5% | 0.6% |
| Masscan | 53.7% | 27.5% | 11.3% | 4.7% | 2.9% |
| Service Protocol | Number of Collected IP | Average PICR | |||
|---|---|---|---|---|---|
| Our Model (Ai) | Shodan (Si) | Censys (Ci) | Ai/Si | Ai/Ci | |
| Echo | 68,565 | 243,449 | Not Supported | 28.16% | - |
| Systat | 3906 | 3322 | Not Supported | 117.58% | - |
| Daytime | 84,151 | 45,628 | Not Supported | 184.43% | - |
| Netstat | 3283 | 2677 | Not Supported | 122.64% | - |
| Quote of the day | 33,683 | 28,729 | Not Supported | 117.24% | - |
| FTP | 16,071,122 | 6,011,068 | 10,478,740 | 267.36% | 153.37% |
| SSH | 20,017,760 | 13,845,201 | 9,783,239 | 144.58% | 204.61% |
| Telnet | 8,789,068 | 5,759,225 | 3,910,163 | 152.61% | 224.77% |
| SMTP | 13,473,119 | 6,034,975 | 7,363,710 | 223.25% | 182.97% |
| Finger | 19,654 | 18,464 | Not Supported | 106.44% | - |
| HTTP | 62,062,880 | 72,580,341 | 56,194,847 | 85.51% | 110.44% |
| HTTP (81) | 1,528,978 | 2,863,257 | Not Supported | 53.40% | - |
| HTTP (82) | 509,387 | 967,095 | Not Supported | 52.67% | - |
| HTTP (83) | 270,148 | 388,326 | Not Supported | 69.57% | - |
| HTTP (84) | 131,533 | 179,313 | Not Supported | 73.35% | - |
| Siemens S7 | 2,846,517 | 2655 | 4986 | 107,213.45% | 57,090.19% |
| POP3 | 8,578,700 | 4,639,066 | 5,224,945 | 184.92% | 164.19% |
| IMAP | 8,763,105 | 4,143,730 | 4,643,772 | 211.48% | 188.71% |
| HTTPS | 47,471,574 | 54,942,697 | 49,711,654 | 86.40% | 95.49% |
| Modbus | 2,817,111 | 13,903 | 26,128 | 20,262.61% | 10,781.96% |
| IMAP + SSL | 7,781,633 | 3,674,578 | 4,399,639 | 211.77% | 211.77% |
| POP3 + SSL | 7,338,645 | 3,585,813 | 4,402,802 | 204.66% | 204.66% |
| SIP | 112 | 16,749,194 | Not Supported | 0.00% | - |
| Oracle HTTP | 6018 | 28,527 | Not Supported | 21.10% | - |
| Zimbra HTTP | 10,554 | 48,255 | Not Supported | 21.87% | - |
| HTTP (7657) | 6259 | 22,284 | Not Supported | 28.09% | - |
| HTTP (8080) | 6,738,602 | 11,328,440 | 17,334,893 | 59.48% | 38.87% |
| Riak Web | 101,923 | 161,546 | Not Supported | 63.09% | - |
| HTTP (8181) | 605,813 | 849,940 | Not Supported | 71.28% | - |
| HTTPS (8443) | 1,204,599 | 2,641,811 | Not Supported | 45.60% | - |
| MS-HTTPAPI | 130,974 | 244,955 | Not Supported | 53.47% | - |
| DNP3 | 3,274,665 | 335,747 | 357 | 975.34% | 917,273.11% |
| MongoDB | 8693 | 31,077 | Not Supported | 27.97% | - |
| BACnet | 2,806,455 | 13,067 | 16,520 | 21,477.42% | 16,988.23% |
| Summary | 223,559,189 | 212,428,355 | 173,496,395 | 105.24% | 128.86% |
| Classifier | BFTree | k* | C4.5 | RandomTree | ||||
|---|---|---|---|---|---|---|---|---|
| TPR | FPR | TPR | FPR | TPR | FPR | TPR | FPR | |
| Debian | 0.216 | 0.1 | 0.245 | 0.091 | 0.248 | 0.11 | 0.226 | 0.118 |
| Fedora | 0.165 | 0.072 | 0.213 | 0.06 | 0.174 | 0.063 | 0.248 | 0.08 |
| FreeBSD | 0.965 | 0.006 | 0.961 | 0.009 | 0.965 | 0.006 | 0.961 | 0.006 |
| Windows | 0.49 | 0.015 | 0.452 | 0.017 | 0.516 | 0.02 | 0.513 | 0.027 |
| Ubuntu | 0.516 | 0.136 | 0.532 | 0.136 | 0.487 | 0.126 | 0.419 | 0.133 |
| Gentoo | 0.661 | 0.217 | 0.652 | 0.198 | 0.574 | 0.186 | 0.552 | 0.167 |
| Redhat | 0.356 | 0.06 | 0.385 | 0.082 | 0.45 | 0.087 | 0.417 | 0.079 |
| Avg. | 0.481 | 0.086 | 0.491 | 0.085 | 0.488 | 0.085 | 0.477 | 0.087 |
| Features | Our Model | ZMap/Censys | Masscan | Shodan (NMap Based) | |
|---|---|---|---|---|---|
| IP Alive Scan | Alive Scan Technique | TCP SYN ICMP | TCP SYN ICMP | TCP SYN ICMP | TCP SYN ICMP |
| Throughput of Scanning | 85,940,000 TPM | 85,690,000 TPM | 55,920,000 TPM | Unable to measure | |
| Single IP Address Generation Algorithm (Randomization) | Prime number-based Algorithm B class: 67.8% C class: 99.9% | Permutation Algorithm B class: 57.7% C class: 99.6% | Permutation Algorithm B class: 53.7% C class: 83.1% | Unable to measure | |
| IPv4 Address Generation Speed | 14 min 44 s | 18 min 3 s | 19 min 9 s | Unable to measure | |
| Protocol (port) Scan | Scan Technique | 3 types (Banner GrabProtocol ErrorSeed File) | 1 type (Banner Grab) | 1 type (Banner Grab) | 1 type (Banner Grab) |
| Range of port collection | 65,535 (168 protocols) | 65,535 (23 protocols) | 65,535 (17 protocols) | 65,535 (168 protocols) | |
| Average PICR | 223.57 million (34 ports) (105% > Shodan, 129% > Censys) | 173.5 million (15 ports) | Unable to measure | 212.42 million (34 ports) | |
| Scanning Time (Based on 130 million data sets each time) | Avg. 90 min (45 min for a single HTTP port) | Avg. 100 min | Avg. 102 min | Unable to measure | |
| OS Fingerprinting Scan | Fingerprinting Technique | TCP·IP Stack Fingerprinting/Banner Grab | Banner Grab | Unable to measure | Banner Grab |
| The number of Identifiable OS/Firmware | 138 types (77 OSes, 61 Firmware) | PC OS | Unable to measure | Unable to measure | |
| Accuracy | 51% (k* algorithm) | Pattern Matching | Unable to measure | Pattern Matching | |
© 2018 by the authors. Licensee MDPI, Basel, Switzerland. This article is an open access article distributed under the terms and conditions of the Creative Commons Attribution (CC BY) license (http://creativecommons.org/licenses/by/4.0/).
Share and Cite
Kim, H.; Kim, T.; Jang, D. An Intelligent Improvement of Internet-Wide Scan Engine for Fast Discovery of Vulnerable IoT Devices. Symmetry 2018, 10, 151. https://doi.org/10.3390/sym10050151
Kim H, Kim T, Jang D. An Intelligent Improvement of Internet-Wide Scan Engine for Fast Discovery of Vulnerable IoT Devices. Symmetry. 2018; 10(5):151. https://doi.org/10.3390/sym10050151
Chicago/Turabian StyleKim, Hwankuk, Taeun Kim, and Daeil Jang. 2018. "An Intelligent Improvement of Internet-Wide Scan Engine for Fast Discovery of Vulnerable IoT Devices" Symmetry 10, no. 5: 151. https://doi.org/10.3390/sym10050151
APA StyleKim, H., Kim, T., & Jang, D. (2018). An Intelligent Improvement of Internet-Wide Scan Engine for Fast Discovery of Vulnerable IoT Devices. Symmetry, 10(5), 151. https://doi.org/10.3390/sym10050151