Article

CFD Simulation of Airflow Dynamics During Cough Based on CT-Scanned Respiratory Airway Geometries

1
School of Transportation Science and Engineering, Beihang University, Beijing 100083, China
2
School of Mechanical and Electrical Engineering, Nanchang Institute of Technology, Nanchang 330099, China
*
Author to whom correspondence should be addressed.
Symmetry 2018, 10(11), 595; https://doi.org/10.3390/sym10110595
Submission received: 20 September 2018 / Revised: 30 October 2018 / Accepted: 31 October 2018 / Published: 5 November 2018

Abstract

:
The airflow dynamics observed during a cough process in a CT-scanned respiratory airway model were numerically analyzed using the computational fluid dynamics (CFD) method. The model and methodology were validated by a comparison with published experimental results. The influence of the cough peak flow rate on airflow dynamics and flow distribution was studied. The maximum velocity, wall pressure, and wall shear stress increased linearly as the cough peak flow increased. However, the cough peak flow rate had little influence on the flow distribution of the left and right main bronchi during the cough process. This article focuses on the mathematical and numerical modelling for human cough process in bioengineering.

1. Introduction

Coughing is an important human defense reflex that protects the respiratory system from infections and improves the clearance of secretions [1,2,3,4]. It is usually caused by inflammation and respiratory infections of the respiratory airways or larynx. A normal cough process has four steps. It begins with an inspiration to expand the lung volume. Then, the glottis closes and the pectoral and abdominal muscles contract to generate pressure in the chest. Finally, the glottis opens which releases a sudden burst of gas [5]. The cough peak flow rate (CPFR) is used to assess the effectiveness of a cough [6,7].
The airflow dynamics of a cough can provide useful information about the size distributions of the virus droplets, the quantity of virus in the droplets, predictions of virus and drug particle transmission and delivery patterns [8,9,10,11,12,13]. Several studies on coughs have been carried out. Zhu used high speed photography technology to visualize the cough process [14]. Singh and Mahajan determined the relationships between the cough peak flow rate, the cough expired volume and the peak velocity time which are considered characteristics of coughing and age, height, weight and gender of human subjects [15,16]. However, none of these studies involved the airflow dynamics of coughing. Gupta analyzed the flow dynamics and characterization of a cough and proposed a flow rate fitting model based on the gamma-probability-distribution functions [17]. However, he did not study the airflow dynamics within the respiratory airways.
Considering the difficulties in simulating the airflow dynamics within the highly asymmetric branching structure of the respiratory airways, computational fluid dynamics (CFD) offers a method of analyzing the airflow based on a physically realistic model. The accuracy of CFD simulations in the respiratory system has been proven through experiments [18,19,20]. Along with the development of computerized tomography (CT) and image reconstruction processing software, it has become easy to generate a real respiratory airways model for CFD simulations. Numerous studies based on the CT-scanned lung model and image reconstruction processing software have been carried out to investigate the airflow in respiratory airways. Zhang, Ertbruggen, and other researchers have concentrated on droplet dispersion and particle deposition [21,22,23,24]. Rochefort studied the air velocity in the respiratory airways through an experimental study and CFD simulation [20]. Paz used the Eulerian wall film model in CFD and a gas–liquid two-phase interaction simulation to simulate the coughing clearance process for the upper airways [25,26]. Qi conducted an airflow transient dynamics simulation of the human airway tree [27]. Luo and Liu modelled the bifurcating flow in a human lung airway [28,29].
In this paper, we analyzed the airflow dynamics during a cough process based on a CT-scanned respiratory airway model. Additionally, the influence of the cough peak flow rate on airflow dynamics and flow distribution were also analyzed.

2. Materials and Methods

2.1. Governing Equation

Considering the temperature change was very small in this study, the energy transmission was neglected. Only the continuity equation (Equation (1)) and momentum equation (Equation (2)) were considered and solved.
v = 0  
ρ ( v ) v = ρ g p + μ 2 v  
where ρ and μ are the density and viscosity of air, respectively. v is the air velocity vector, p is the air pressure and g is the gravity vector.

2.2. Turbulent Model

Due to the high air velocity in narrow airways, there is a turbulent flow phenomenon (Re = ρvd/μ) during a cough process in the airways. The applicability of the k–ω model and the shear stress transport (SST) sub-model to a respiratory airflow simulation has been confirmed by numerous studies [18,30]. Therefore, the k–ω model and SST sub-model were selected to simulate the turbulent flow in this study.

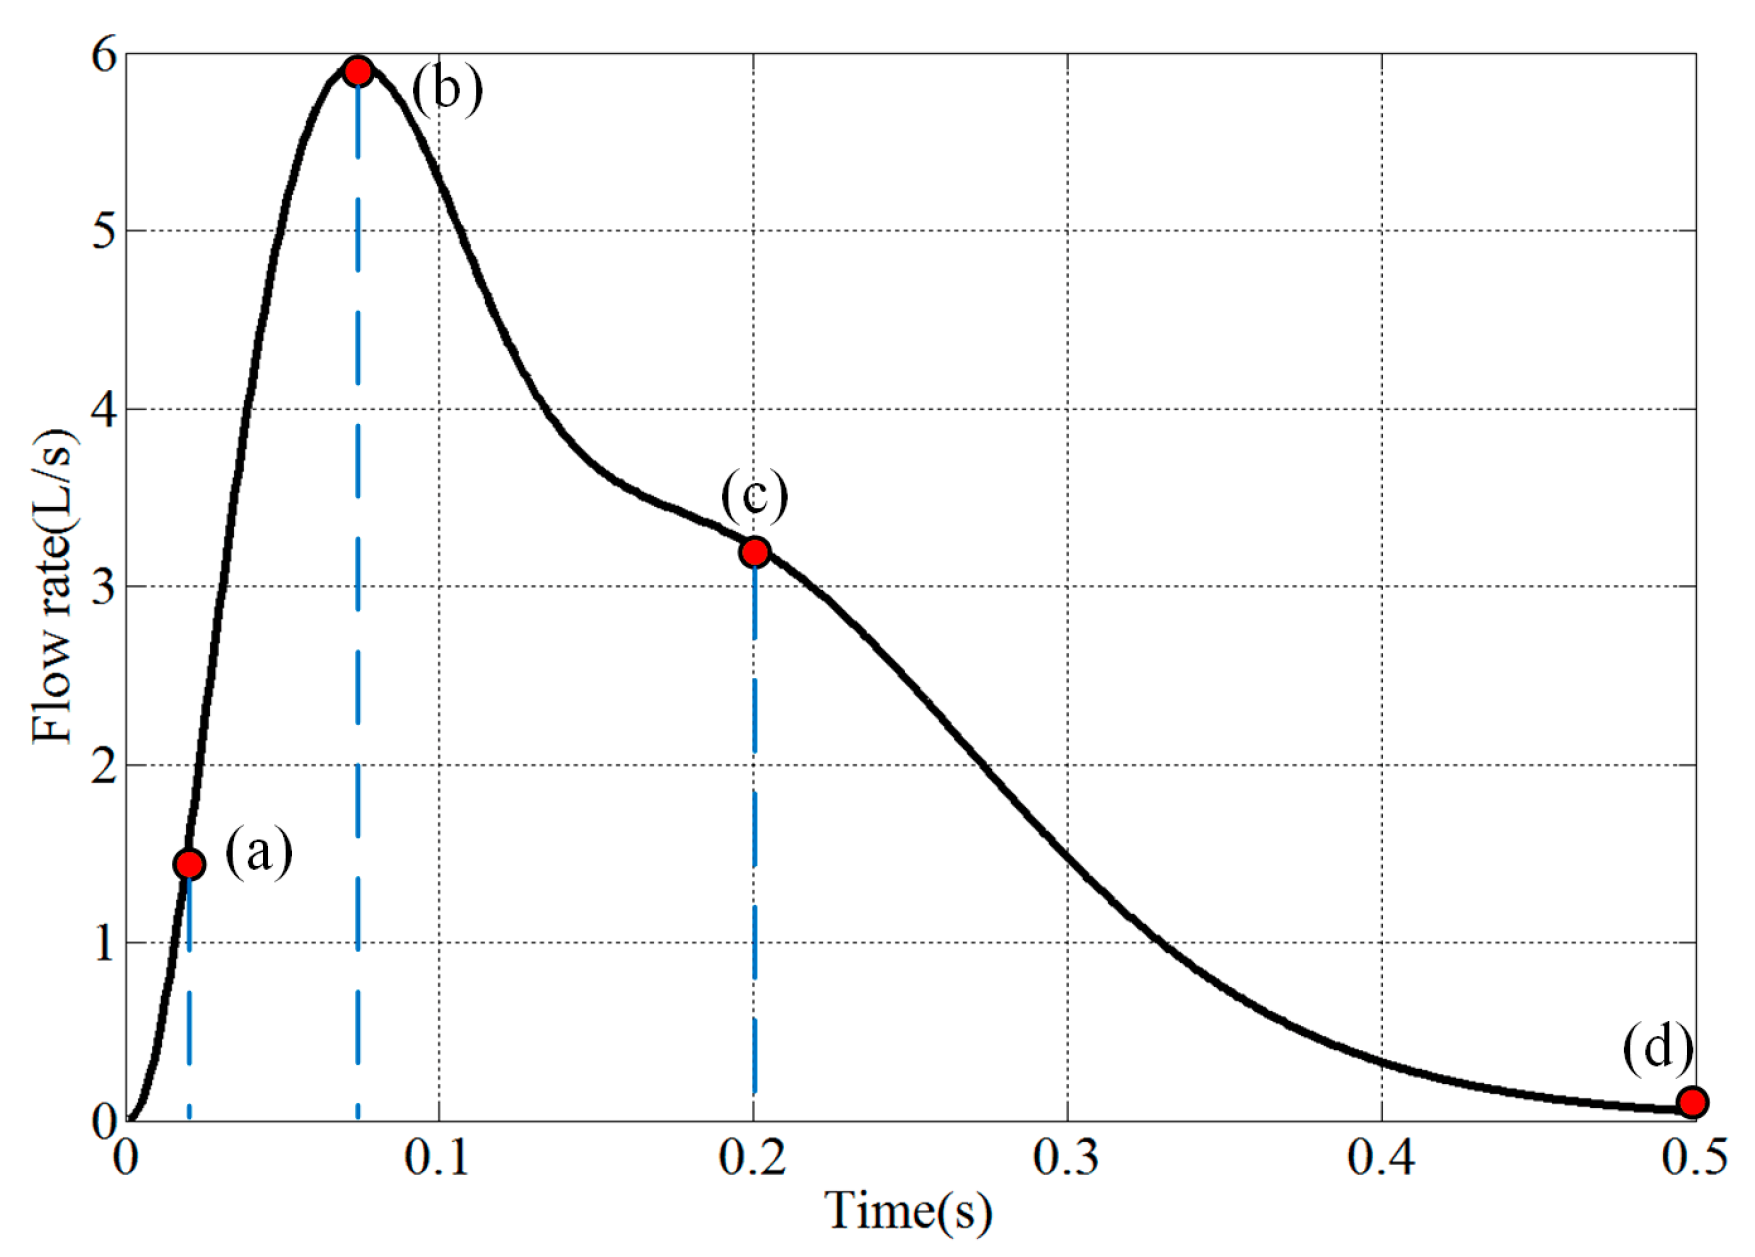
2.3. Boundary Condition

The air was assumed to be a Newtonian fluid with a density of 1.185 kg/m3 and a viscosity of 1.81 × 10⁵ Pa·s in 20 °C and a standard atmosphere. The mass flow inlet was chosen and the mass flow rate was coded through the Fluent user defined function using the model proposed by Gupta which is presented in Equations (3) and (4) [17].
M ¯ = a 1 τ b 1 1 e ( τ c 1 ) Γ ( b 1 ) c 1 b 1   for   τ < 1.2 ; M ¯ = a 1 τ b 1 1 e ( τ c 1 ) Γ ( b 1 ) c 1 b 1 + a 2 ( τ 1.2 ) b 2 1 e ( ( τ 1.2 ) c 2 ) Γ ( b 2 ) c 2 b 2   for   τ 1.2 M ¯ = F l o w r a t e C P F R ; τ = T i m e P V T ; a 1 = 1.680 ; b 1 = 3.338 ; c 1 = 0.428 ; a 2 = C E V P V T × C P F R a 1 ; b 2 = 2.158 × C E V P V T × C P F R + 10.457 ; c 2 = 1.8 b 2 1 .
where M ¯ is the non-dimensional flow rate, τ is the non-dimensional time, CEV is the cough expired volume and PVT is the peak velocity time, which is the time when the flow rate reaches its peak value in a single cough process. The CEV and PVT can be determined by CPFR through regression analyses, as shown in Equation (4).
C E V ( l ) = 0.138 C P F R ( l / s ) + 0.2983 ,   for   male ; C E V ( l ) = 0.0204 C P F R ( l / s ) 0.043 ,   for   female ; P V T ( m s ) = 1.360 C P F R ( l / s ) + 65.860 ,   for   male ; P V T ( m s ) = 3.152 C P F R ( l / s ) + 64.631 ,   for   female .
A cough peak flow rate of 6 L/s was selected to generate the cough flow rate. The airflow variation with time is presented in Figure 1. Four points, (a) 0.02 s, (b) 0.08 s, (c) 0.2 s and (d) 0.5 s were selected to analyze the airflow dynamics.
The pressure outlet was set at the mouth exit and the pressure was set to be 100 kPa (absolute pressure). The stationary wall with no slip was set to all wall domains. Gravity was also considered in the simulation.

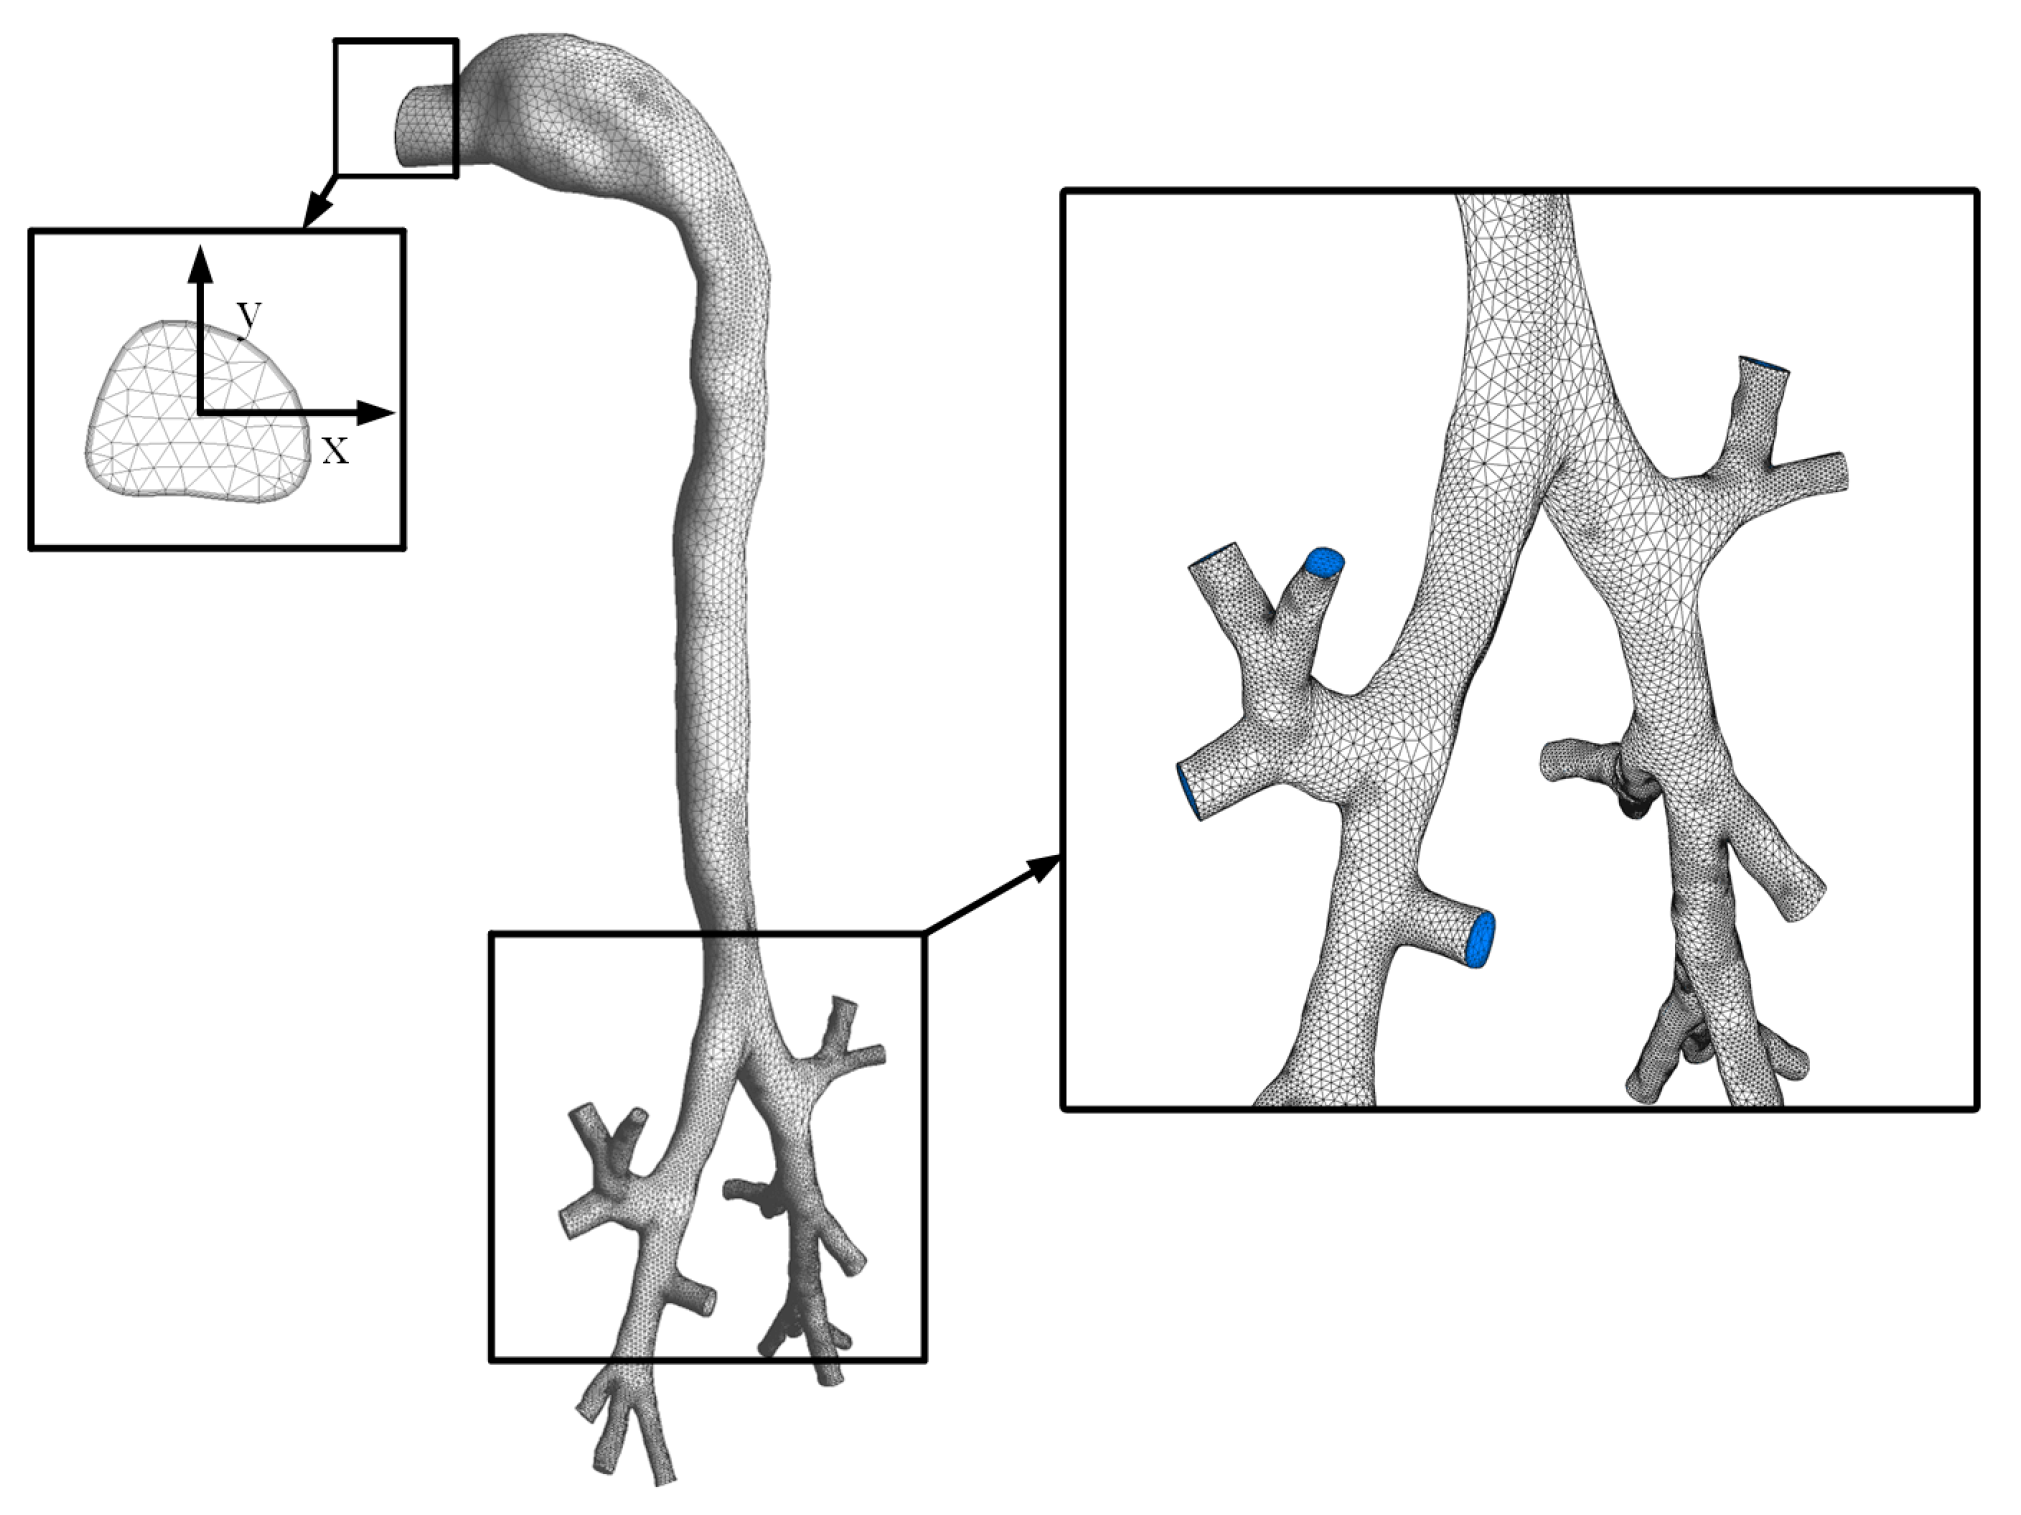
2.4. Numerical Modelling
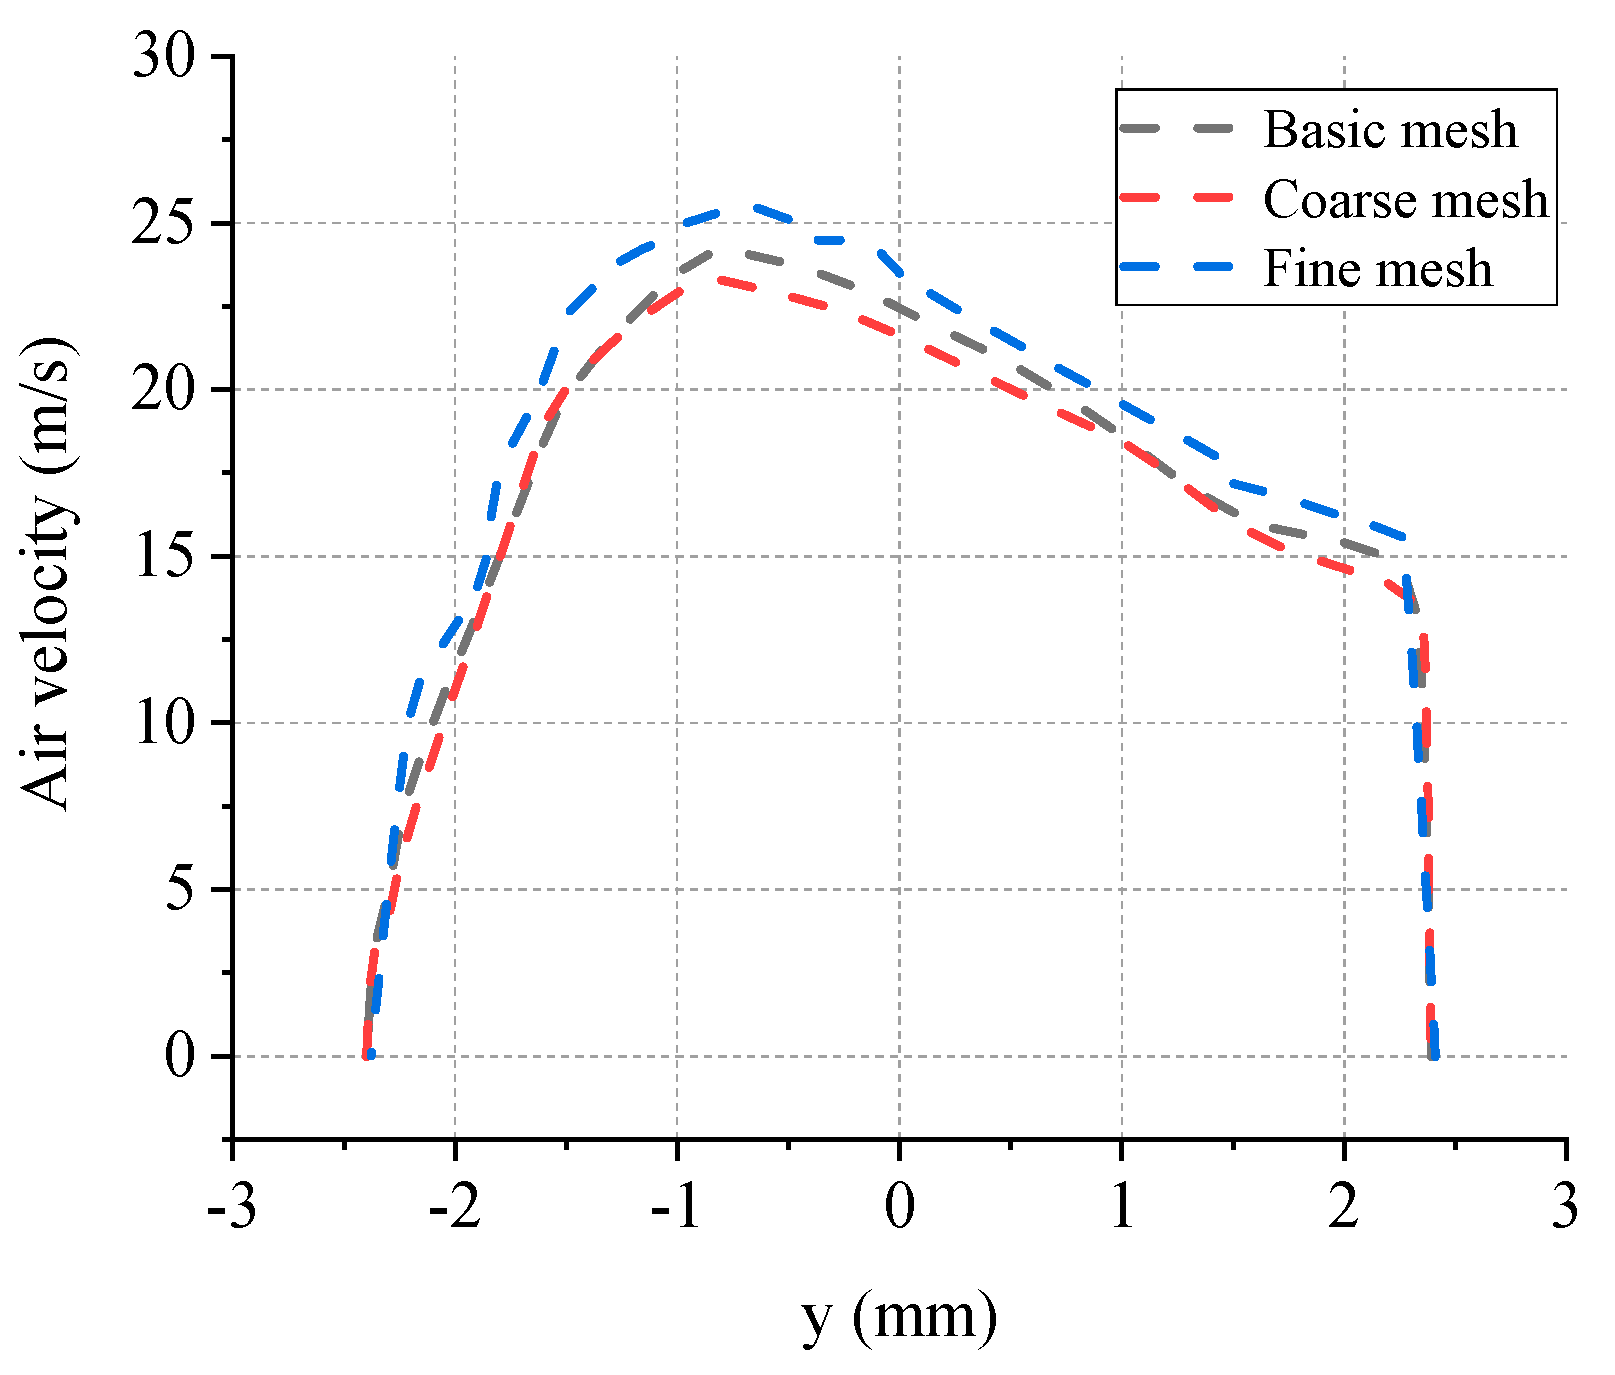
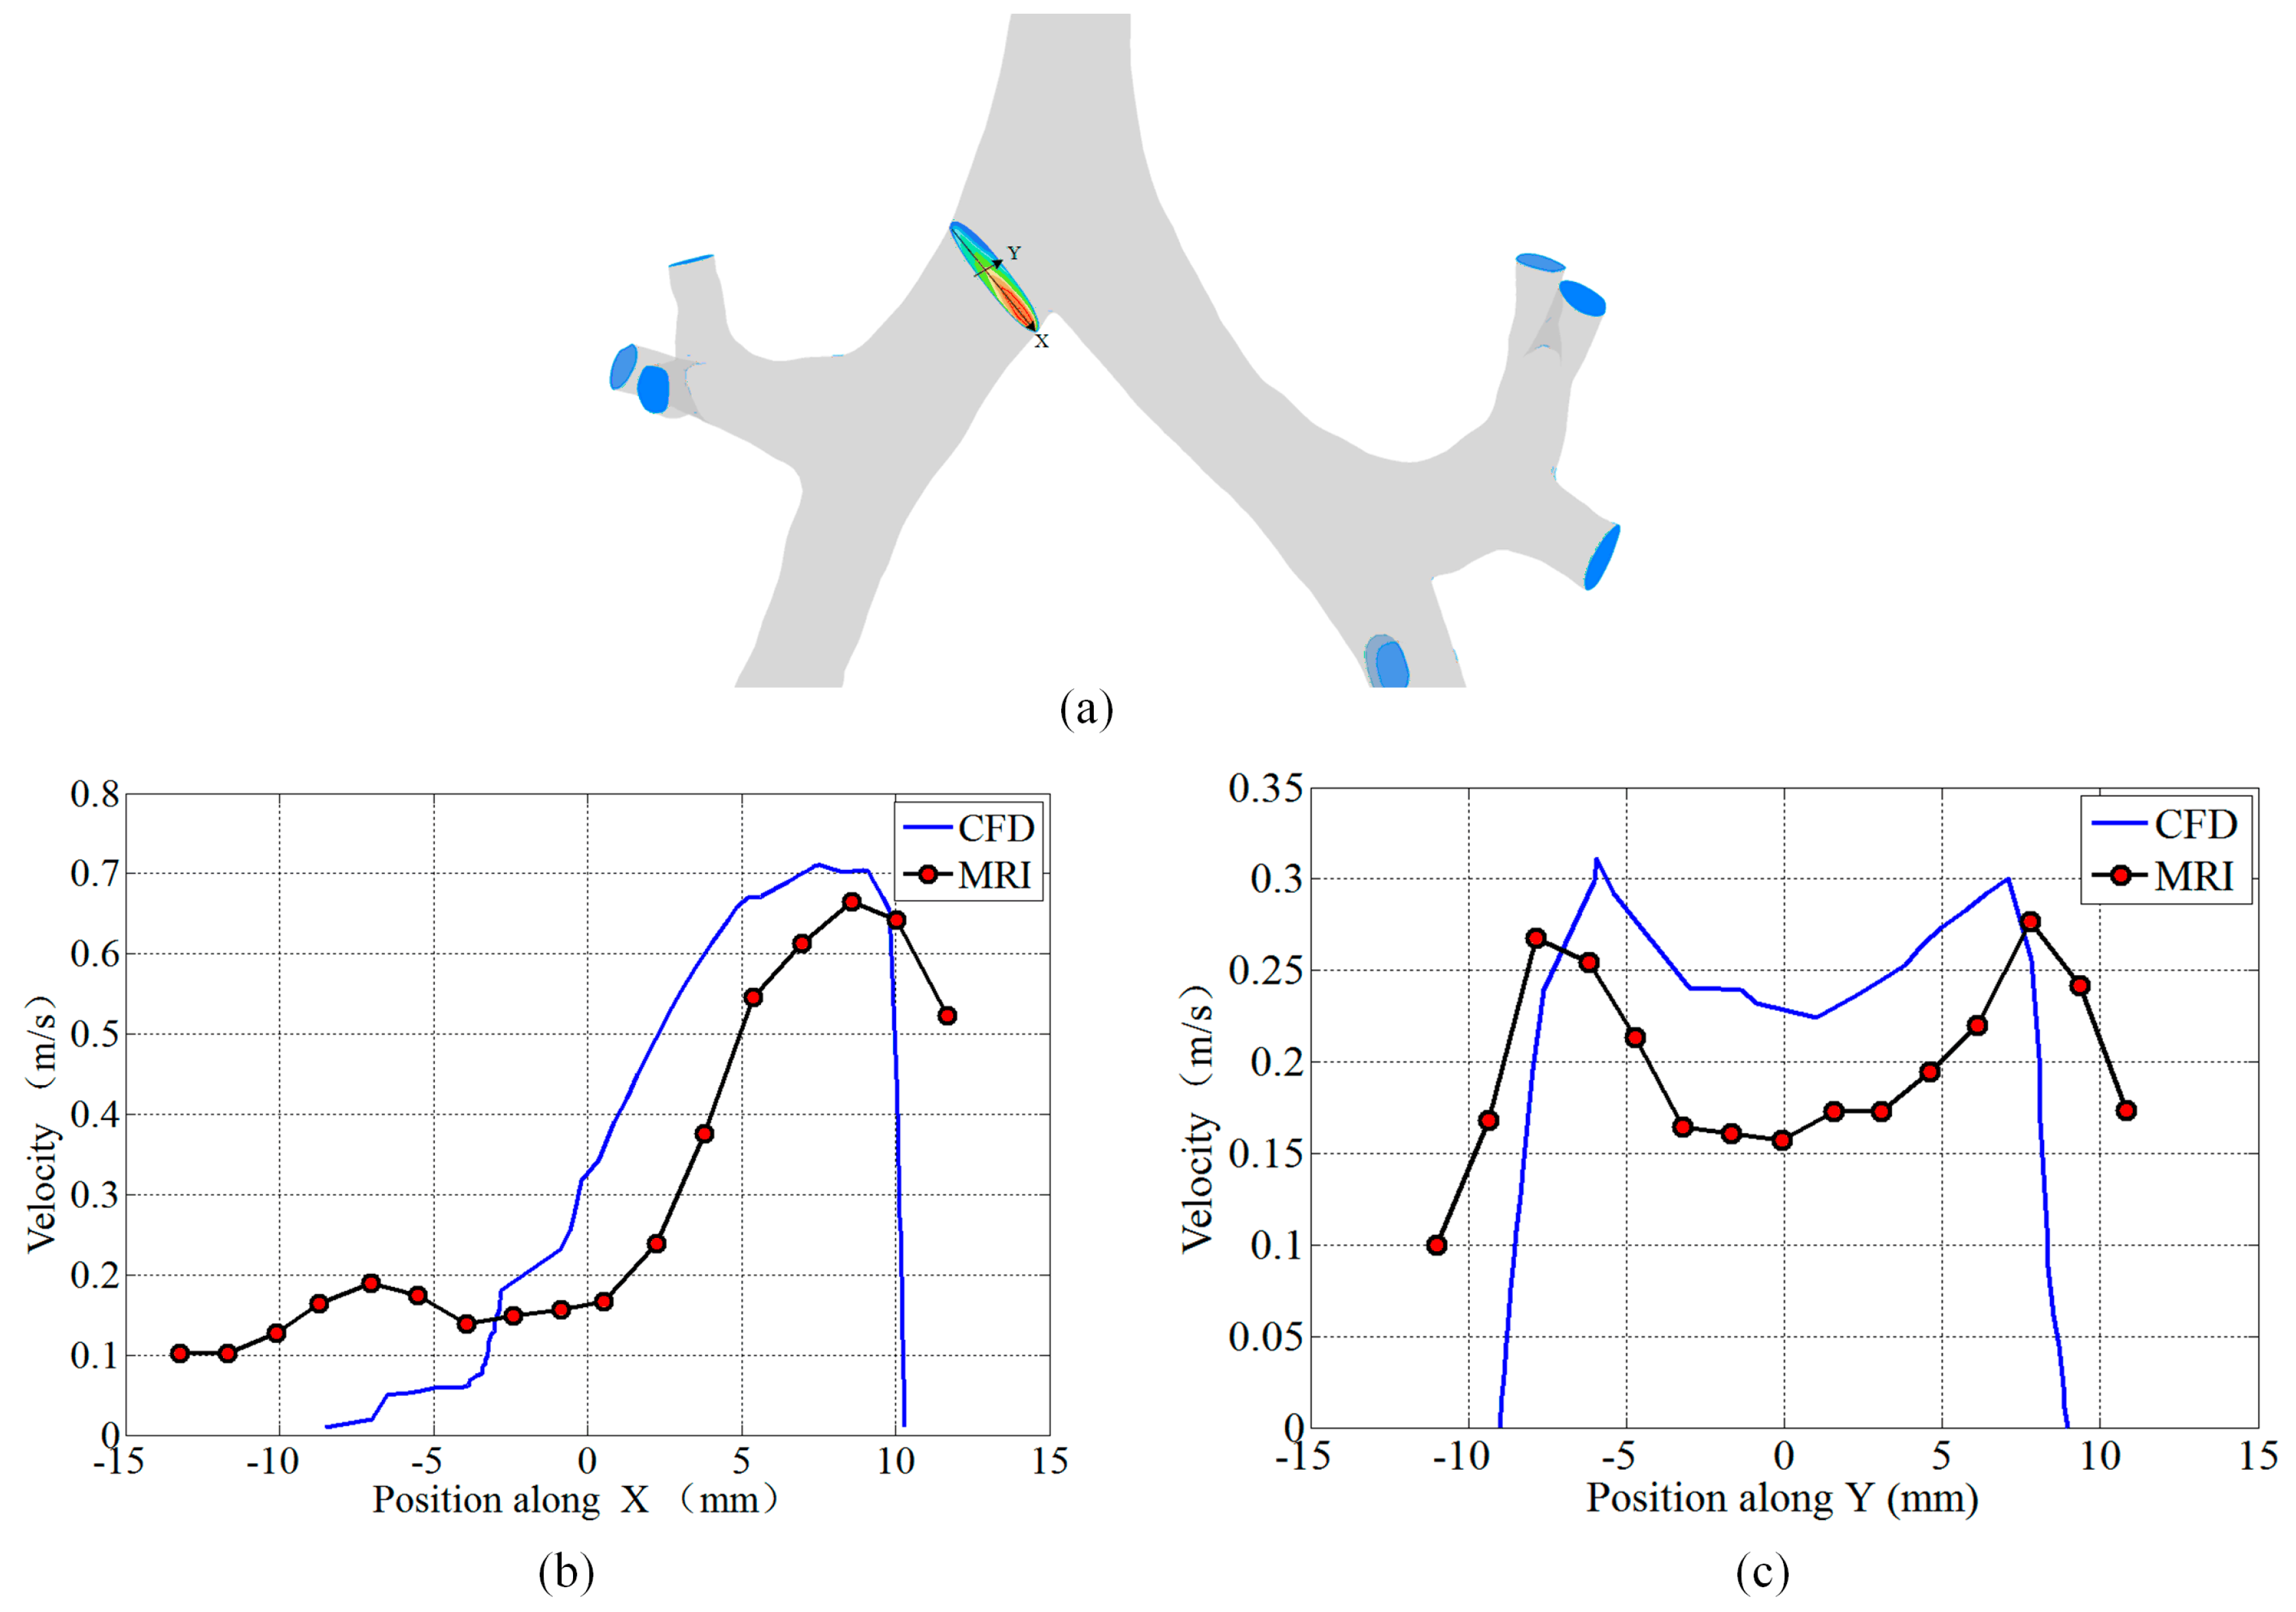
The CT images used in this study were taken from a 34-year-old Chinese male without any history of respiratory disease. The 3D geometry of the lung airways was reconstructed using image-processing software (Mimics) and the generated real lung model is shown in Figure 2. Considering the medical statistical regularity in five-generation airways, we extracted the upper-fifth-order airways from the mouth exit to the bronchi, to conduct the study.
Three models with an increasing number of mesh which are coarse mesh (190941), basic mesh (444204) and fine mesh (2563271 cells) were generated and analyzed. The air velocities along the y direction on the outlet surface were compared and presented in Figure 3. The results showed a limited difference among three models and suggested that the basic mesh could be used in further analysis.
The transient pressure-based solver and the Semi-Implicit Method (SIMPLE) were adopted for the simulation. The Quadratic Upwind Interpolation (QUICK) scheme was adopted for spatial discretization. The flow rate time step size rather than the numerical time step was set to be 0.0001 s. The hybrid-mesh technique was used and the number of cells, faces and nodes were 444,204, 1031,575 and 167,000, respectively. The minimum, maximum and mean quality values, which represented the mesh quality were 0.21, 0.99 and 0.79, respectively. The maximum skewness was 0.73. The CFD solver Fluent Inc. ANSYS 17.0 was adopted for the simulation.

3. Validation

In order to validate the model and computational methodology, our simulation results were compared with the results measured by Rochefort using magnetic resonance (MR) gas velocimetry under the same boundary conditions [20]. The comparisons of the cross-sectional area and volume flow rate are shown in Table 1. The location of the extracted face, X direction and Y direction are presented in Figure 4a. The velocity comparison between our CFD simulation and Rochefort’s results at the right main bronchus is presented in Figure 4b,c. In addition, the CFD simulation results were consistent with the MRI results which validates the model and computational methodology used in this study.

4. Results and discussion

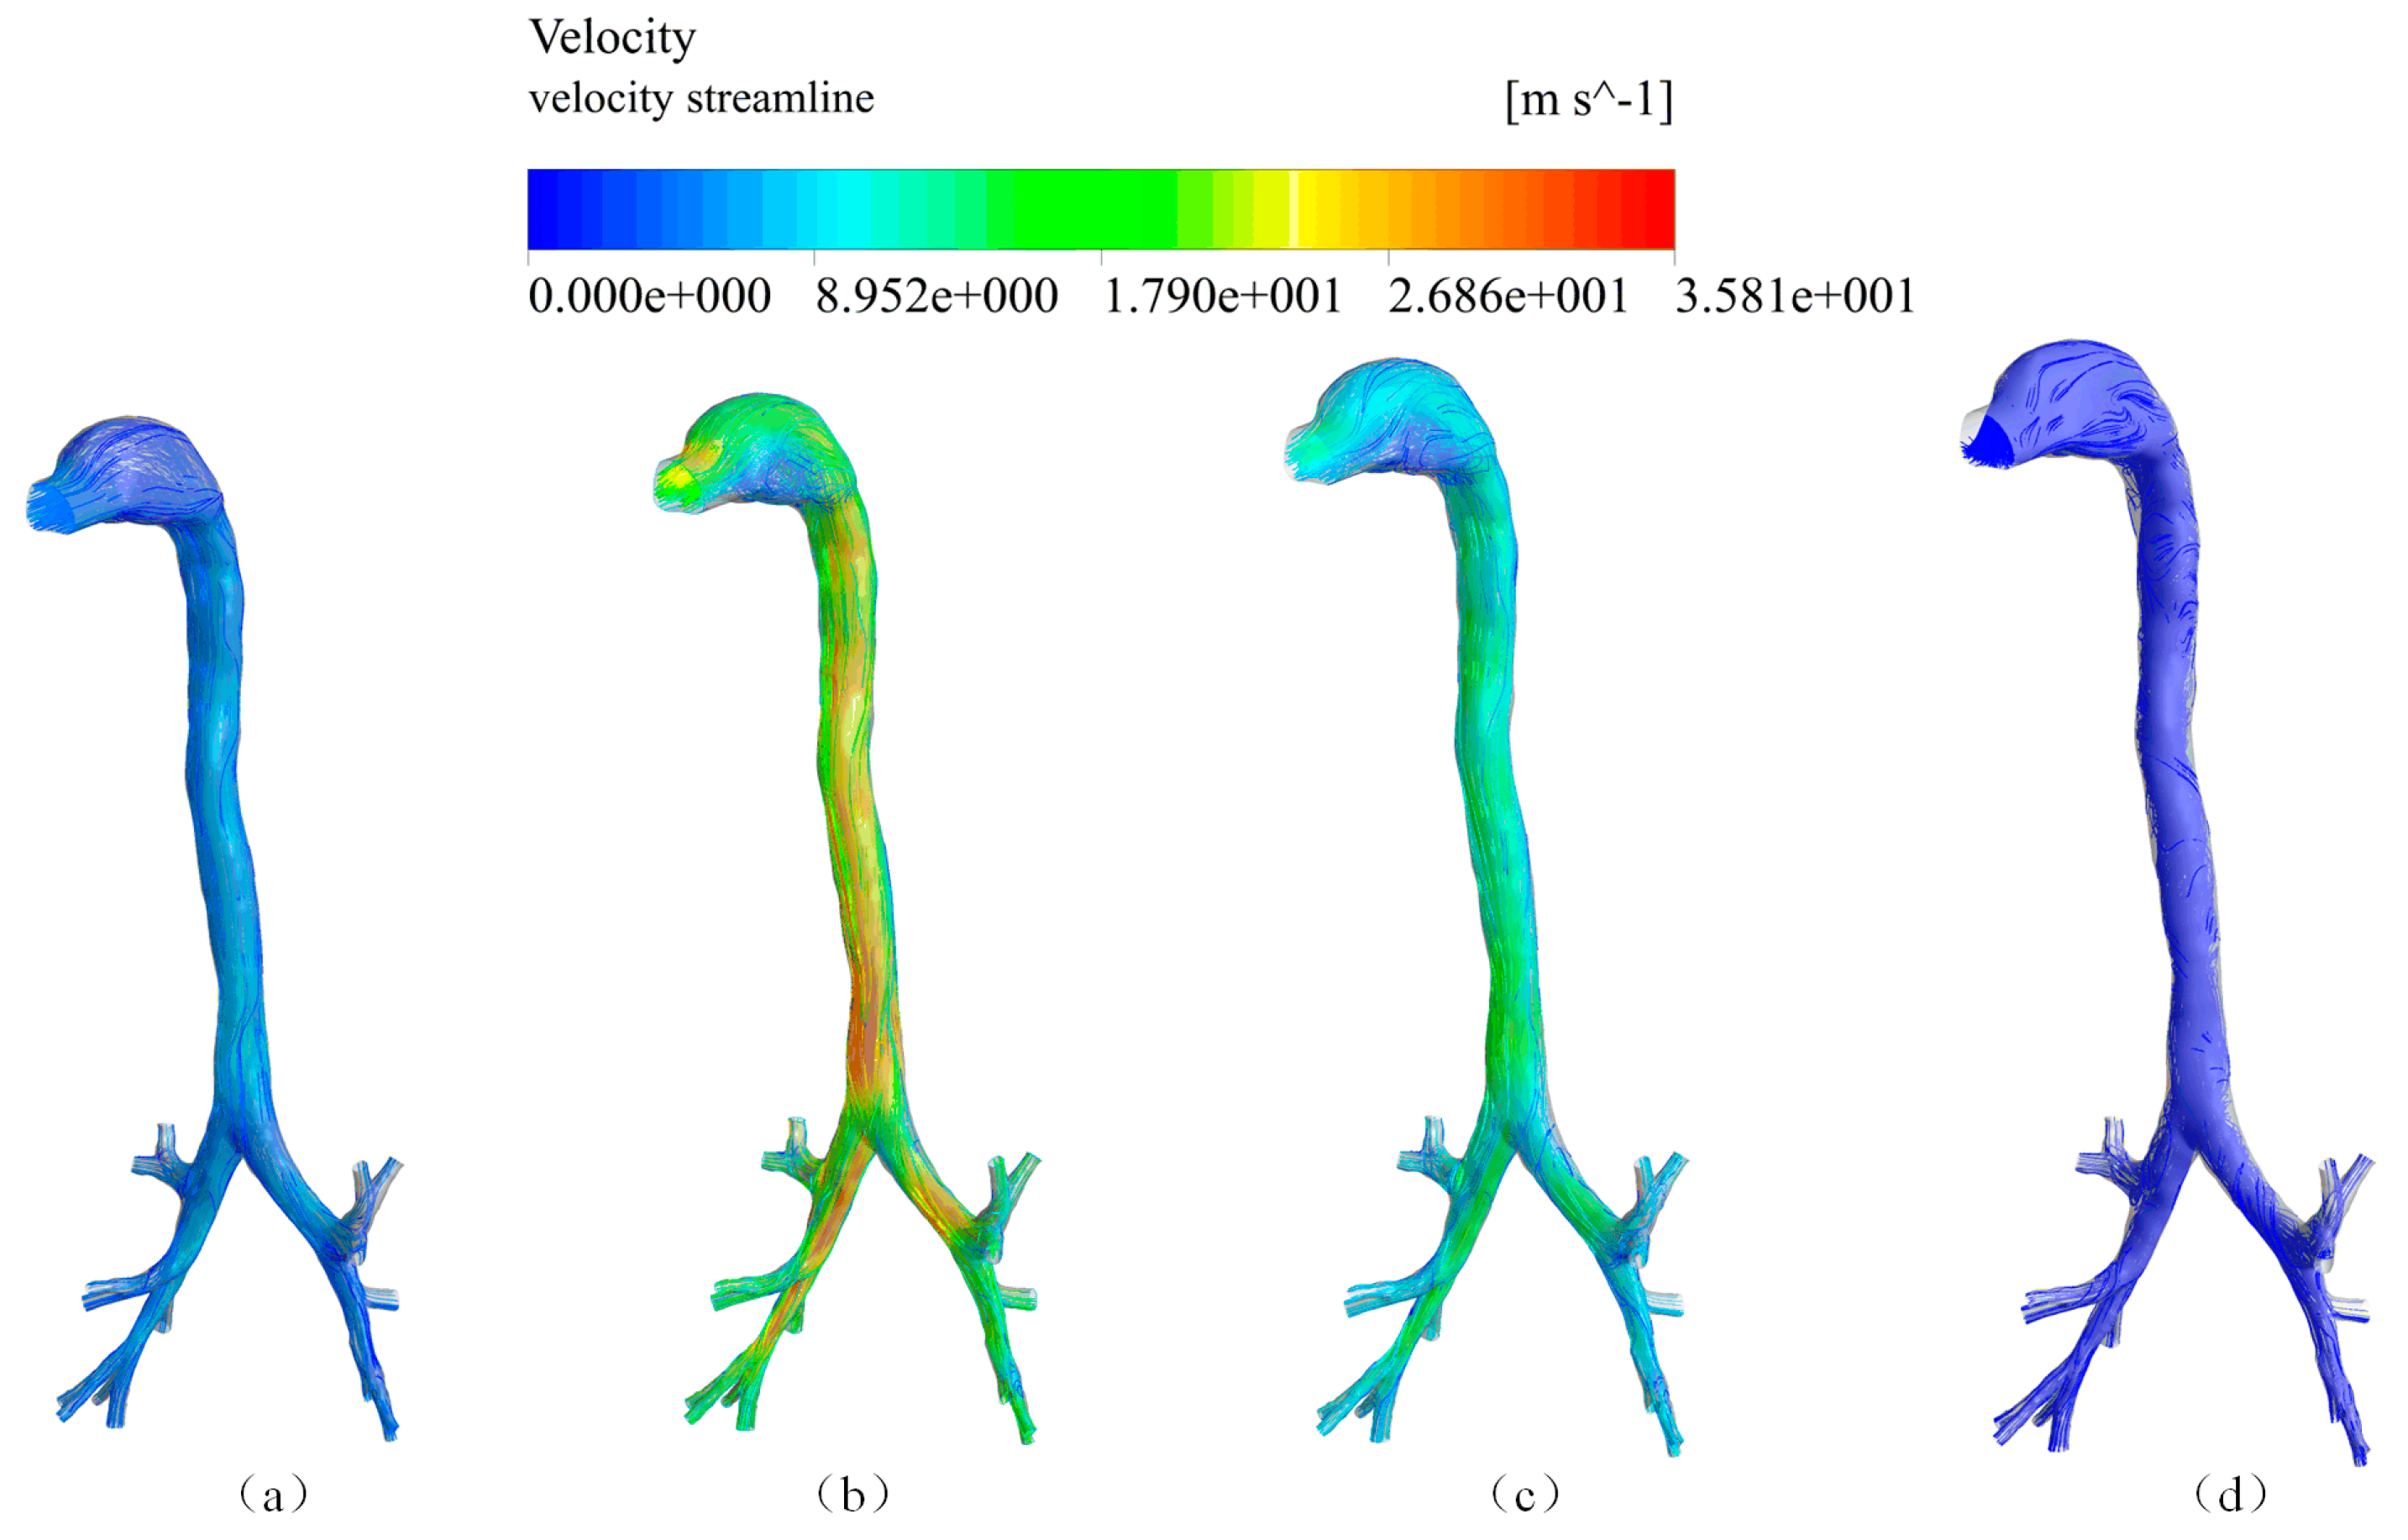
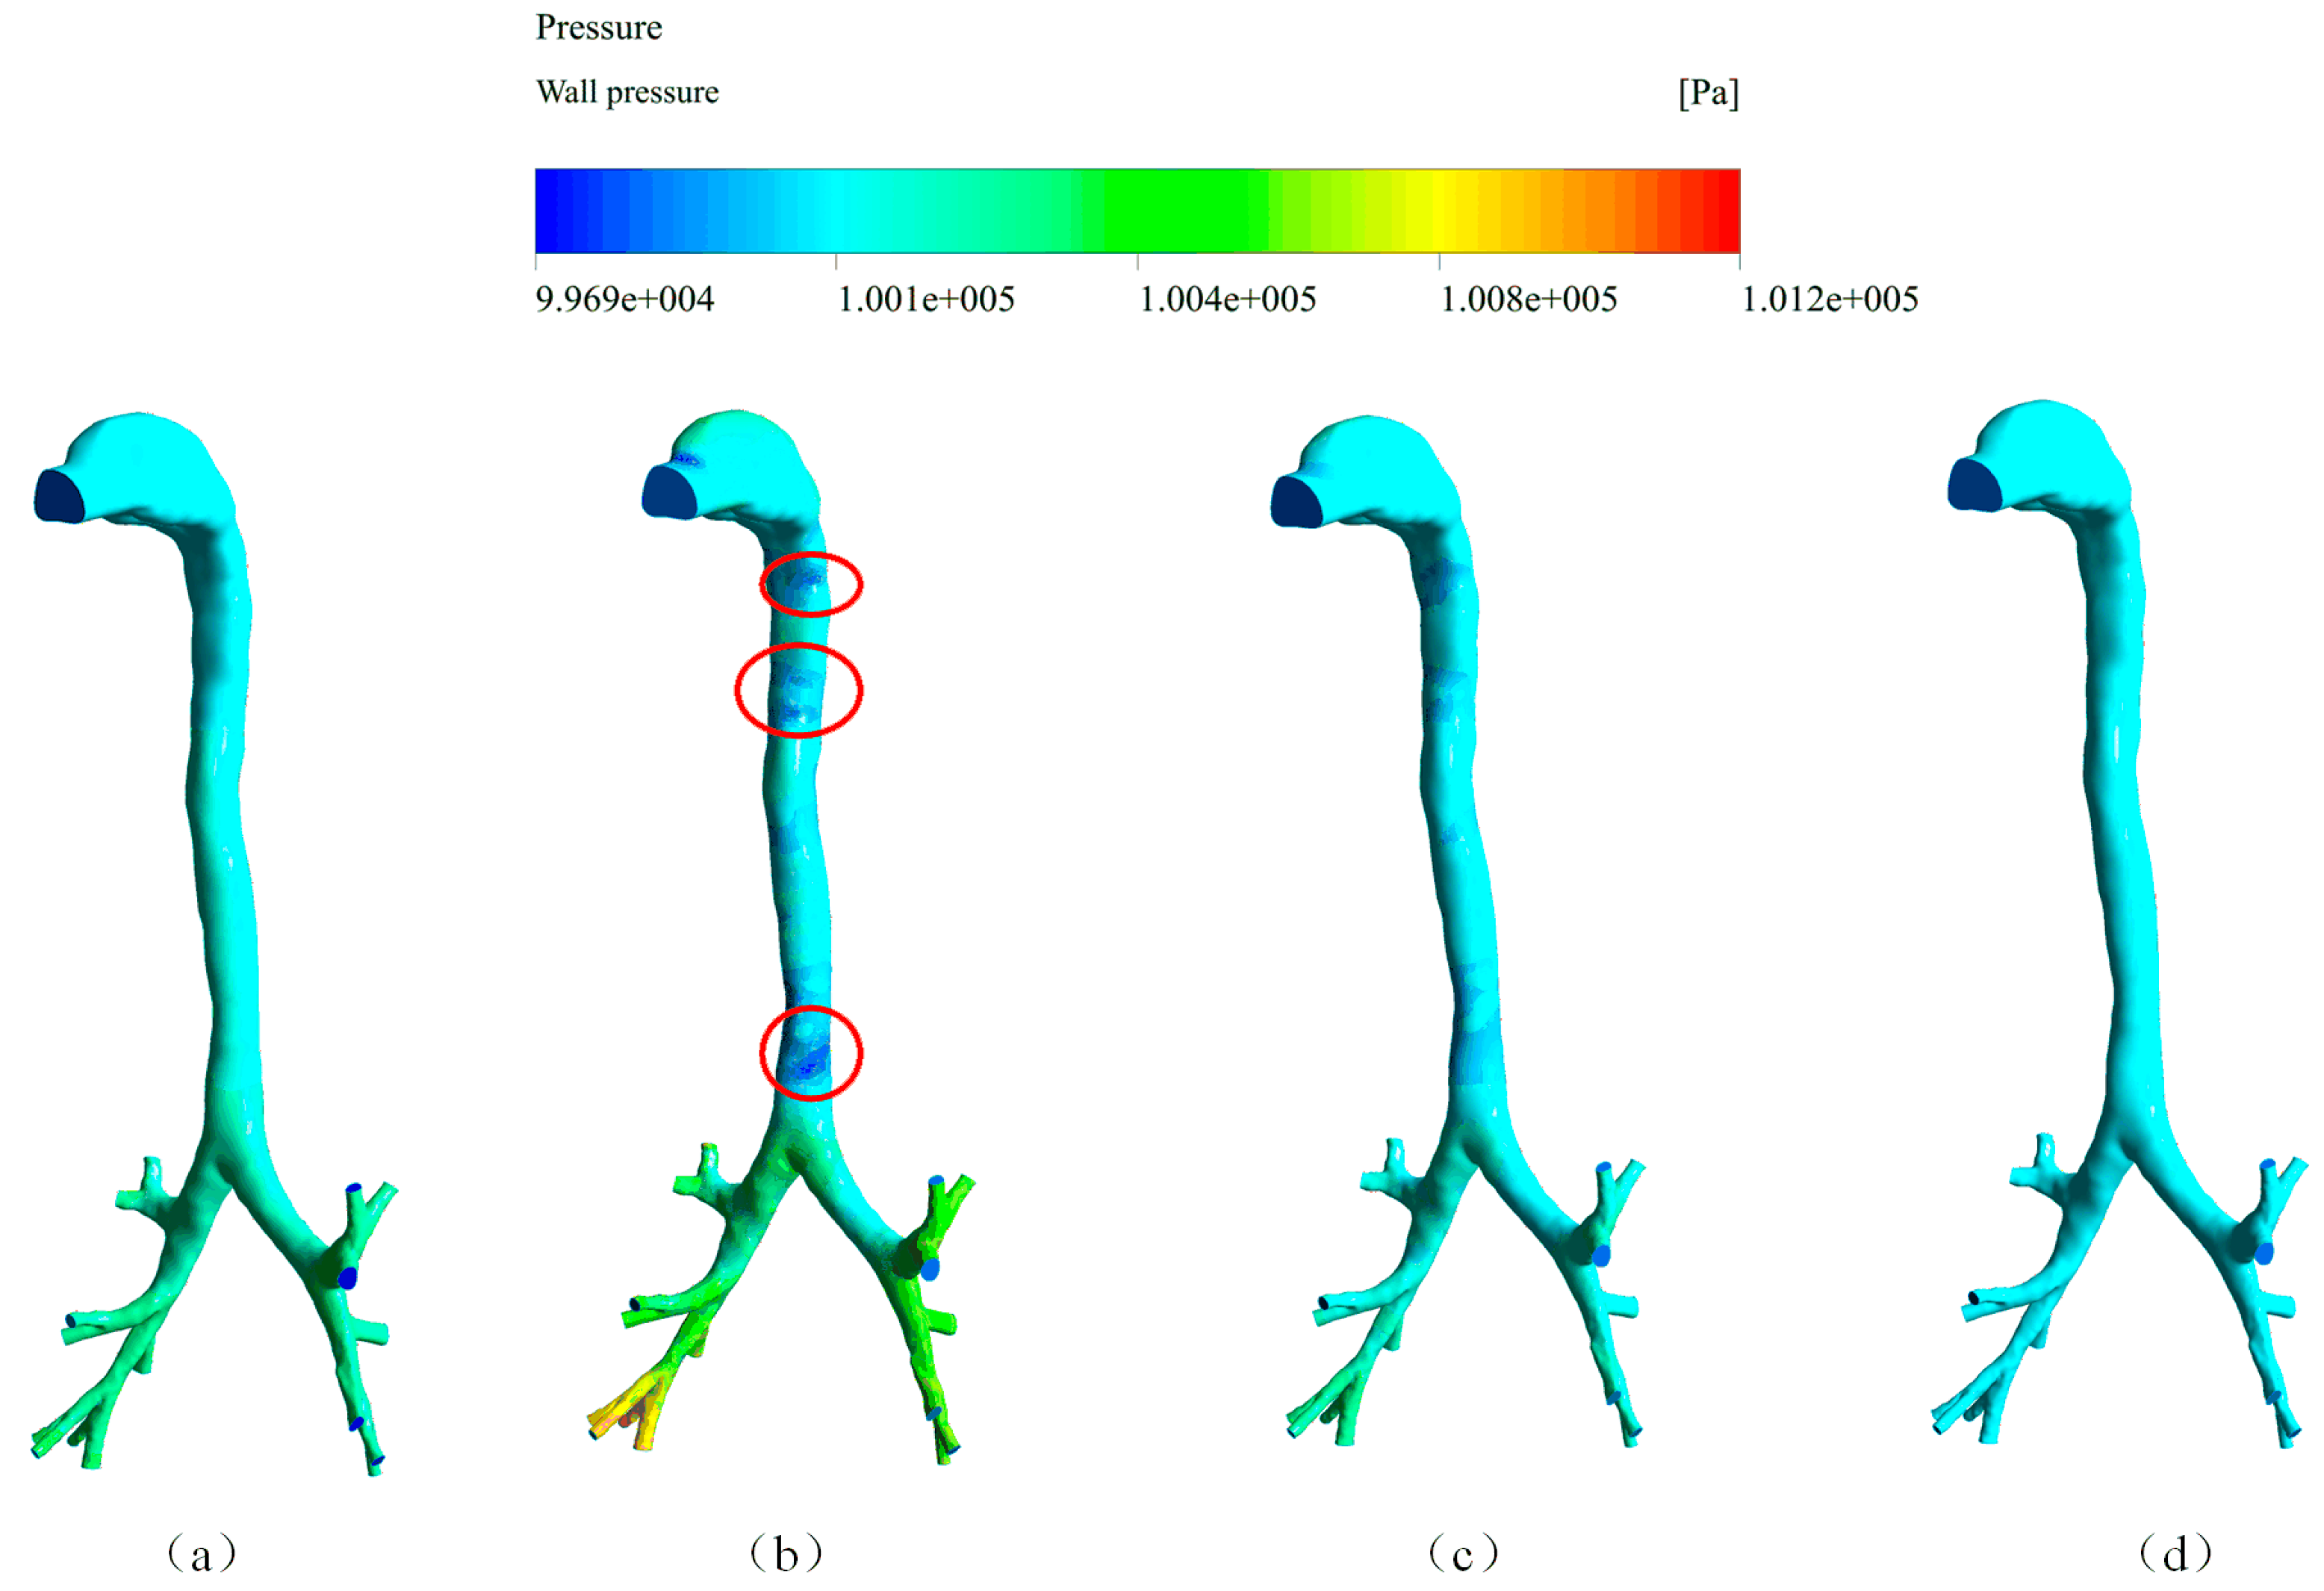
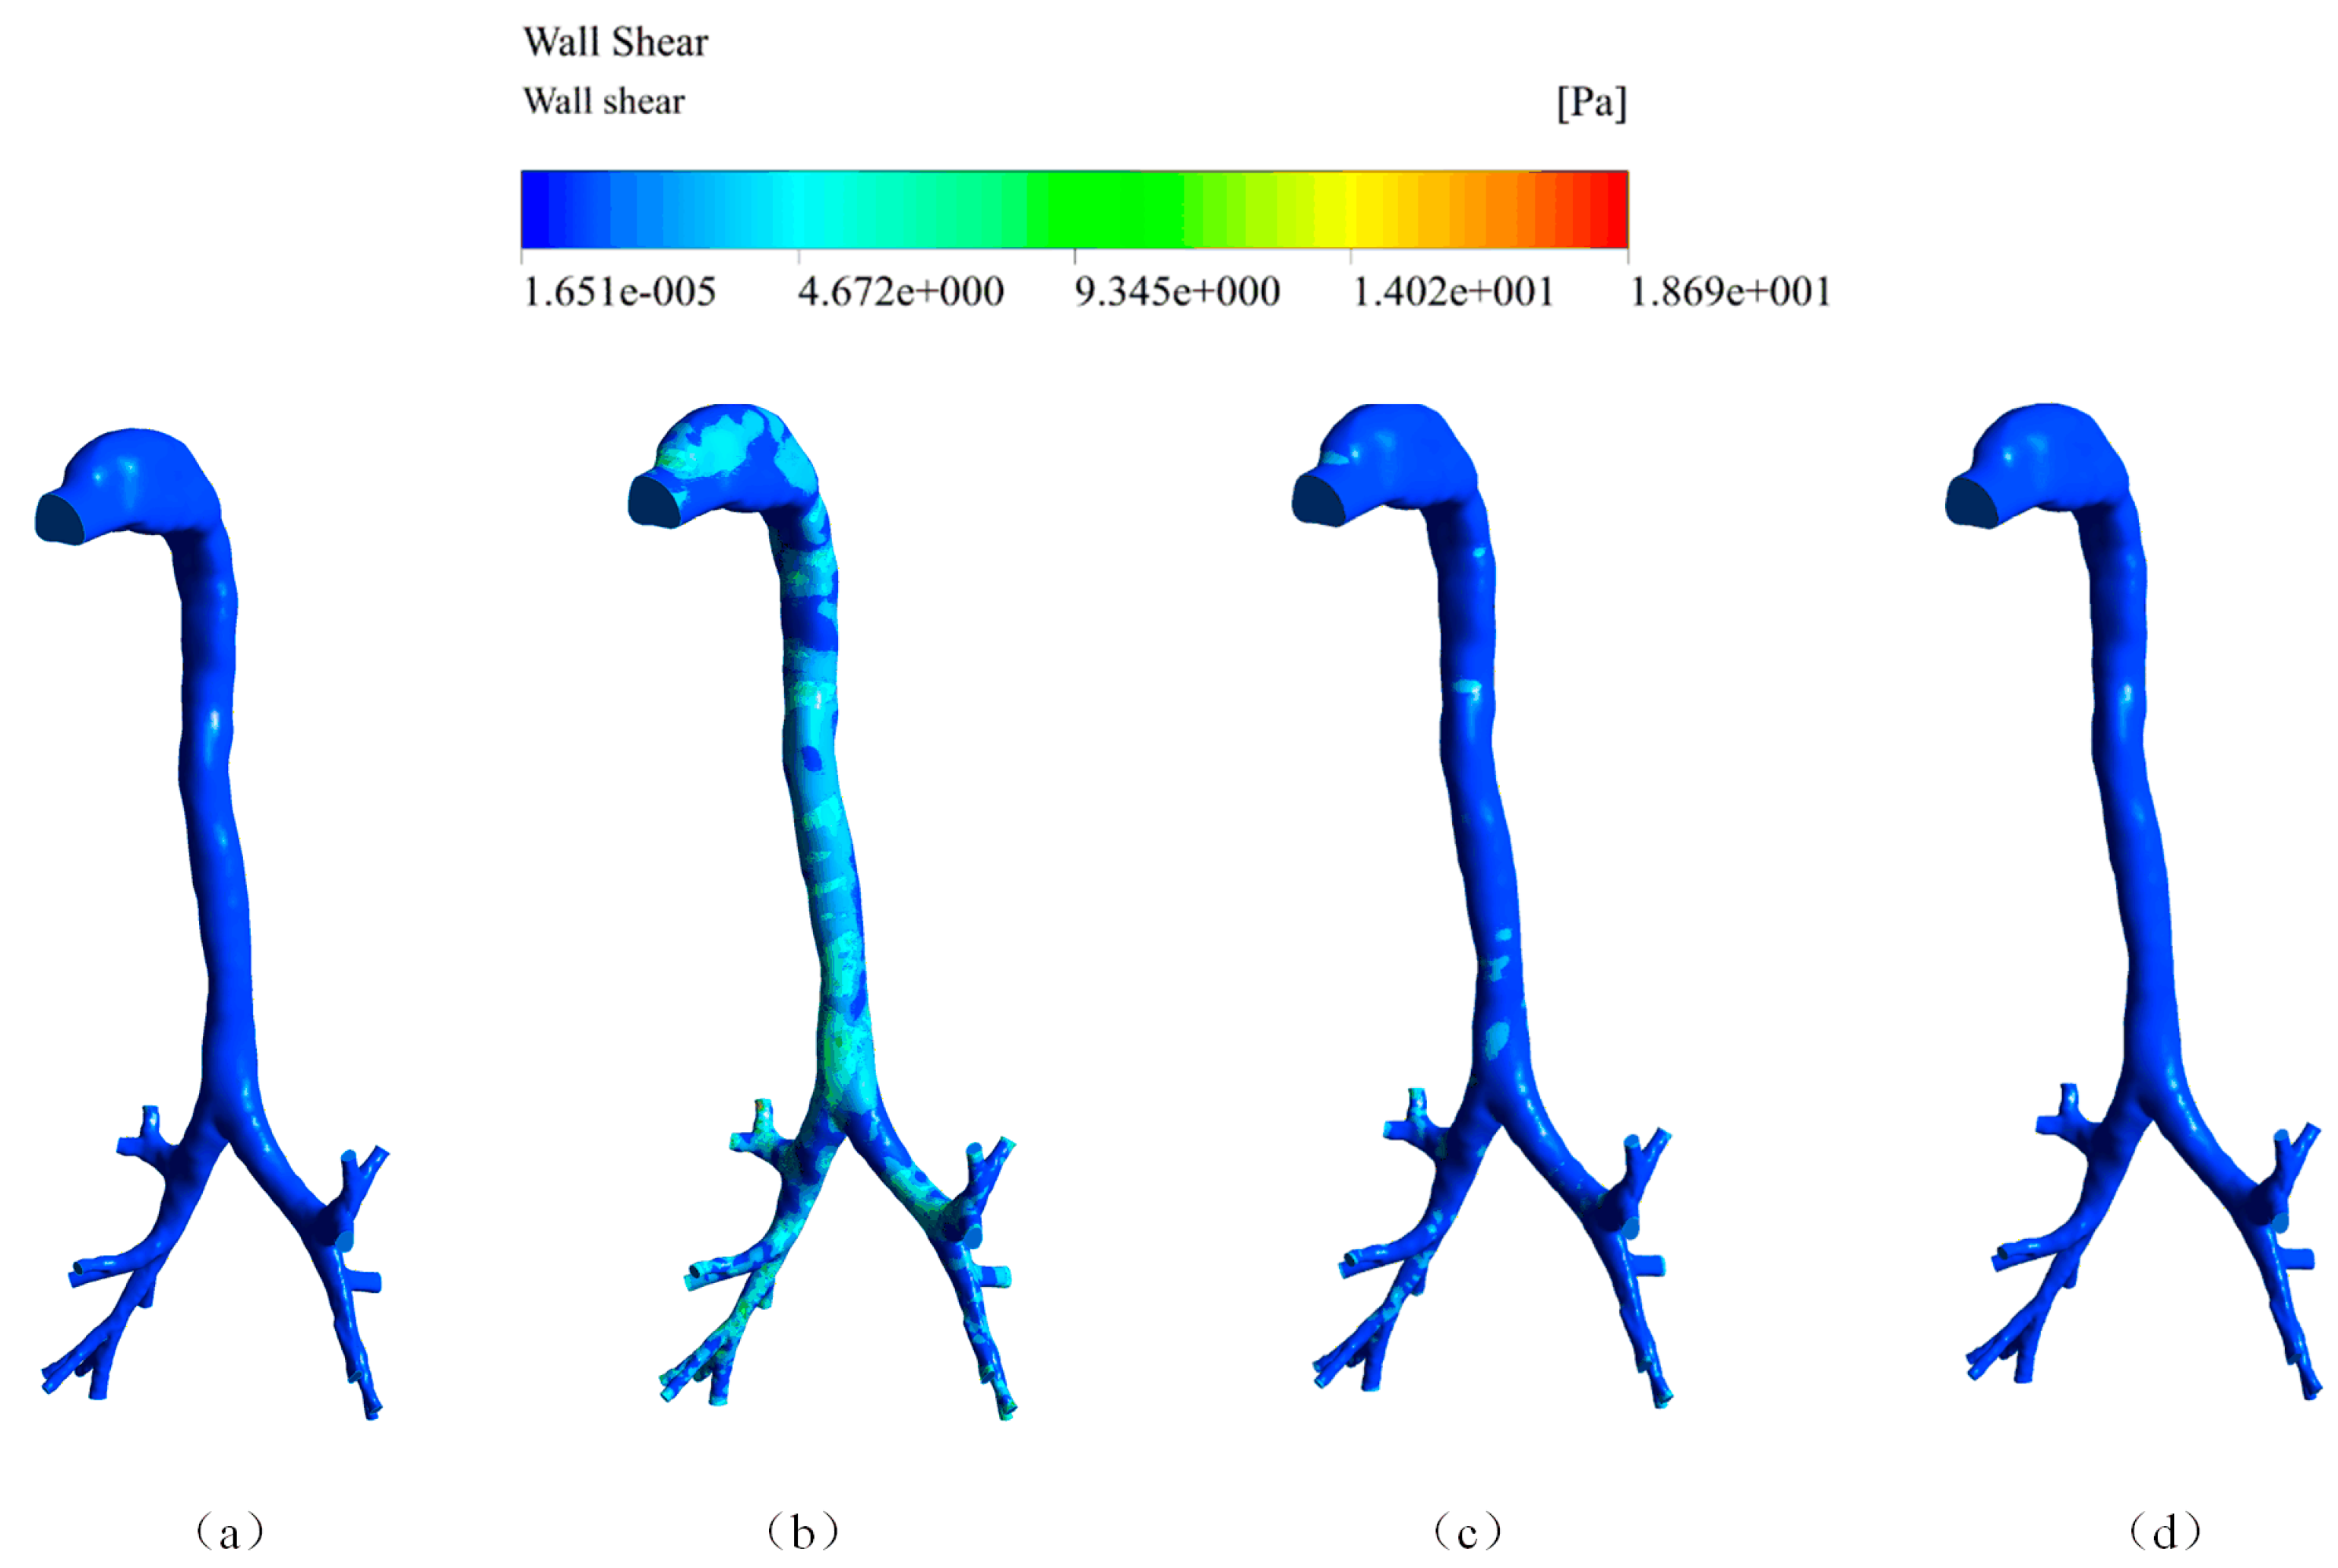
4.1. Air Velocity, Wall Pressure, and Wall Shear Stress of the Cough Process

The airflow velocity, wall pressure, and wall shear stress of the four selected points are presented in Figure 5, Figure 6 and Figure 7.
Figure 5 shows that the airflow velocity streamlines at four time points during the cough process. The highest velocity reached was 35.8 m/s at 0.08 s. By comparing Figure 5a–d, it can be observed that the streamlined patterns at the bronchi were similar. However, there was an obvious difference at the mouth exit where the airflow was more chaotic due to an increase in the airflow velocity, which may have resulted from the airway’s turning structure.
The spatial distribution of wall pressure is shown in Figure 6. The wall pressure decreased gradually from the end of the bronchi to the mouth exit at atmospheric pressure. The highest wall pressure reached was 1.012 × 10⁵ Pa (absolute pressure) which appeared at the end of the bronchi. Due to the high airflow velocity, the wall pressure at some places, which have been labeled by a red circle, was below the atmospheric pressure.
The spatial distribution of the wall shear stress is presented in Figure 7. We can see that the wall shear stress corresponded to the airflow velocity during the coughing process. The wall shear stress at the bronchi part was generally higher than that at the main airways because of the narrow structure. Additionally, the maximum was 18.69 Pa at the terminal bronchi.

4.2. Local Flow Properties

Four cross sections, captured from the trachea, joint, left main bronchus and right main bronchus, were selected to analyze the local flow properties. They were named f0, f1, f2 and f3, respectively. The velocity magnitudes and vectors at these four sections during a cough process are presented in Figure 8. From Figure 8 we can observe that the velocity magnitude at f0 was higher than that at f2 and f3 because of the airflow confluence. Since the area of f1 is larger than f0, the velocity magnitude at f0 was also higher than that at f1. A second flow was observed at four cross sections, as shown in Figure 8b,c, when the airflow was higher than others. The secondary flow direction was from the inner to the outer of the wall.

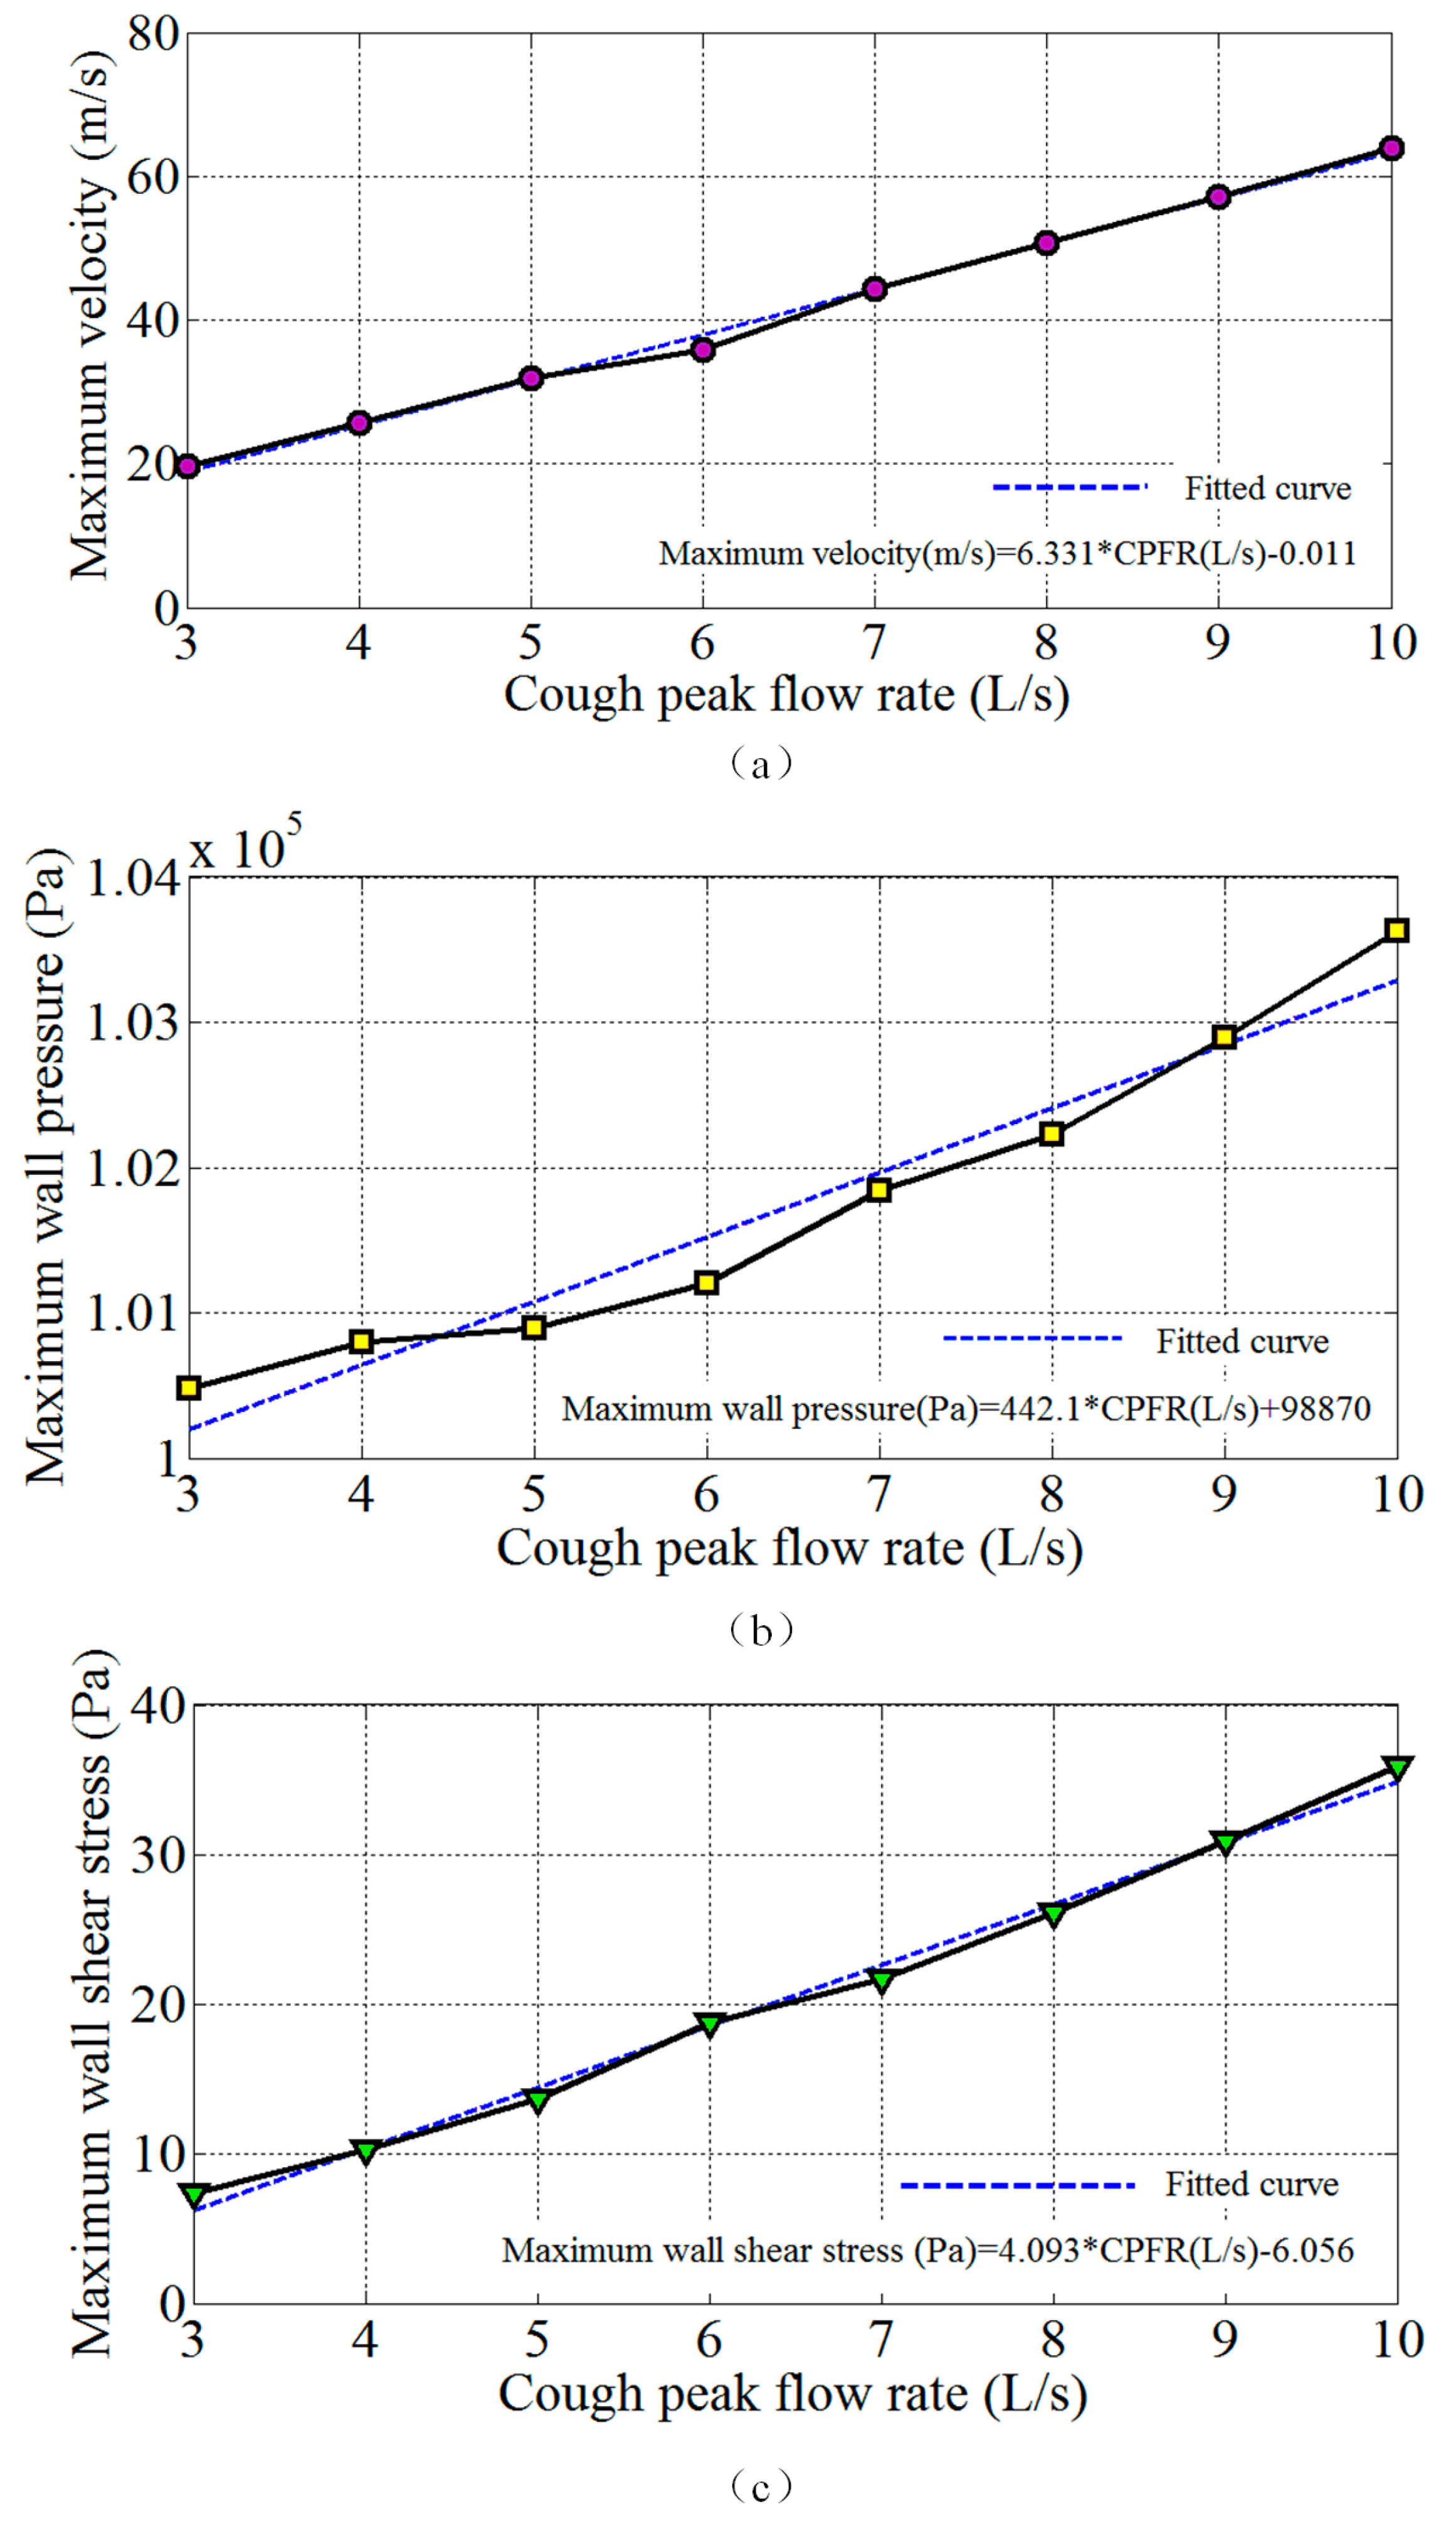
4.3. Influence of the Cough Peak Flow Rate on Airflow Dynamics

Eight different cough peak flow rates from 3 to 10 L/s were involved in the simulation study. The relationship between airflow dynamics and the cough peak flow rate is given in Figure 9. We found a positive correlation between the maximum velocity, wall pressure, wall shear stress and cough peak flow rate. As the cough peak flow rate increased, the maximum velocity, wall pressure and wall shear stress increased linearly. The first-order linear fitted curves for the maximum velocity, wall pressure and wall shear stress are presented in Figure 9. When the cough peak flow rate reached 10 L/s, the maximum velocity, wall pressure and wall shear stress reached 63.93 m/s, 1.0326 × 10⁵ Pa, and 35.91 Pa, respectively.
The flow distributions of the left and right main bronchi under the different cough peak flow rate conditions are shown in Table 2. From the results, we found that the cough peak flow rate had little influence on the flow distribution of the left and right main bronchi. This indicates that the airflow distribution to the left and right main bronchi is almost the same during a cough process.

5. Conclusions

In this paper, the airflow dynamics during a cough process were analyzed in detail based on a CT-scanned lung airway model. Through a comparison with previous experimental studies, the feasibility of the CFD simulation method to simulate the airflow during a cough process was proven. The spatial and temporal variations of airflow dynamics such as the flow velocity, wall pressure, wall shear stress and local flow properties were calculated and analyzed. The airflow became more chaotic at the mouth exit due to the high airflow velocity and structure. Additionally, the wall shear stress corresponded to the airflow velocity. The highest wall pressure appeared at the end of the bronchi which was consistent with the cough mechanism.
Meanwhile, the influence of the cough peak flow rate on the airflow dynamics and flow distribution was also analyzed. The maximum velocity, wall pressure and wall shear stress increased linearly as the cough peak flow increased and the first-order linear fitting relations were developed. When the cough peak flow rate reached 10 L/s, the maximum velocity, wall pressure and wall shear stress reached 63.93 m/s, 1.0326 × 10⁵ Pa and 35.91 Pa, respectively. Additionally, the cough peak flow rate had little influence on the flow distribution of the left and right main bronchi during the cough process.
In summary, this paper demonstrated one feasible approach for the transient CFD simulation of air in a model with lots of bronchial outlets, which can be extended to investigate the airflow in patients with various airway pathologies. The revealed flow pattern might bring insight into the heterogeneity of lesions and drug depositions.
The proposed model and methodology could be used to study various airway pathologies and drug deposition during a cough process.

Author Contributions

Conceptualization, G.K., X.L. and Y.W.; Methodology, G.K., Software, M.L. and Y.Z.; Validation, G.K., X.Y. and Y.Y.; Formal analysis, Z.G.; Data curation, Y.Y.; Writing—original draft preparation, G.K.; Writing—review and editing, G.K., X.L. and Y.W.

Funding

This research is funded by Grants (51567018) of the National Natural Science Foundation of China and the Science and technology research project (GJJ151131) of Jiangxi Provincial Department of Education.

Conflicts of Interest

The authors declare no conflicts of interest.

Nomenclature

CTComputerized tomography
CFDComputational fluid dynamics
CPFRCough peak flow rate
MRIMagnetic resonance imaging
QUICKQuadratic upwind interpolation
SSTShear stress transport
SIMPLESemi-implicit method

References

  1. Dubuis, E.; Wortley, M.A.; Grace, M.S.; Maher, S.A.; Adcock, J.J.; Birrell, M.A.; Belvisi, M.G. Theophylline inhibits the cough reflex through a novel mechanism of action. J. Allergy Clin. Immunol. 2014, 133, 1588–1598. [Google Scholar] [CrossRef] [PubMed] [Green Version]
  2. Fontana, G.A.; Federico, L. Cough motor mechanisms. Respir. Physiol. Neurobiol. 2006, 152, 266–281. [Google Scholar] [CrossRef] [PubMed]
  3. Ruddy, B.H.; Kuruppumullage, D.N.; Carnaby, G.; Crary, M.; Lehman, J.; Ilegbusi, O.J. Computational modelling of cough function and airway penetrant behavior in patients with disorders of laryngeal function. Laryngoscope Investig. Otolaryngol. 2017, 2, 23–29. [Google Scholar] [CrossRef] [PubMed]
  4. Vertigan, A.E.; Kapela, S.M.; Franke, I.; Gibson, P.G. The effect of a vocal loading test on cough and phonation in patients with chronic cough. J. Voice 2017, 31, 763–772. [Google Scholar] [CrossRef] [PubMed]
  5. Fink, J.B. Forced expiratory technique, directed cough, and autogenic drainage. Respir. Care 2007, 52, 1210–1223. [Google Scholar] [PubMed]
  6. Gobert, F.; Yonis, H.; Tapponnier, R.; Fernandez, R.; Labaune, M.A.; Burle, J.F.; Vincent, B.; Cleyet, M.; Richard, J.C.; Guérin, C. Predicting extubation outcome by cough peak flow measured using a built-in ventilator flow meter. Respir. Care 2017, 62, 1505–1519. [Google Scholar] [CrossRef] [PubMed]
  7. Tzani, P.; Chiesa, S.; Aiello, M.; Scarascia, A.; Catellani, C.; Elia, D.; Marangio, E.; Chetta, A. The value of cough peak flow in the assessment of cough efficacy in neuromuscular patients. A cross sectional study. Eur. J. Phys. Rehabil. Med. 2014, 50, 427–432. [Google Scholar] [PubMed]
  8. Yang, S.; Lee, G.W.; Chen, C.M.; Wu, C.C.; Yu, K.P. The size and concentration of droplets generated by coughing in human subjects. J. Aerosol. Med. 2007, 20, 484–494. [Google Scholar] [CrossRef] [PubMed]
  9. Xie, X.; Li, Y.; Chwang, A.T.; Ho, P.L.; Seto, W.H. How far droplets can move in indoor environments-revisiting the Wells evaporation-falling curve. Indoor Air 2007, 17, 211–225. [Google Scholar] [CrossRef] [PubMed]
  10. Fennelly, K.P.; Martyny, J.W.; Fulton, K.E.; Orme, I.M.; Cave, D.M.; Heifets, L.B. Cough-generated aerosols of mycobacterium tuberculosis: a new method to study infectiousness. Am. J. Respir. Crit. Care Med. 2004, 169, 604–609. [Google Scholar] [CrossRef] [PubMed]
  11. Chao, C.Y.H.; Wan, M.P.; Morawska, L.; Johnson, G.R.; Ristovski, Z.D.; Hargreaves, M.; Mengersen, K.L.; Steve, C.; Li, Y.; Xie, X.; et al. Characterization of expiration air jets and droplet size distributions immediately at the mouth opening. J. Aerosol. Sci. 2009, 40, 122–133. [Google Scholar] [CrossRef] [Green Version]
  12. Hersen, G.; Moularat, S.; Robine, E.; Géhin, E.; Corbet, S.; Vabret, A.; Freymuth, F. Impact of health on particle size of exhaled respiratory aerosols: case-control study. Clean (Weinh) 2010, 36, 572–577. [Google Scholar] [CrossRef]
  13. Morawska, L. Droplet fate in indoor environments, or can we prevent the spread of infection? Indoor Air 2010, 16, 335–347. [Google Scholar] [CrossRef] [PubMed] [Green Version]
  14. Zhu, S.; Kato, S.; Yang, J.H. Study on transport characteristics of saliva droplets produced by coughing in a calm indoor environment. Build. Environ. 2006, 41, 1691–1702. [Google Scholar] [CrossRef]
  15. Singh, P.; Mahajan, R.P.; Murty, G.E.; Aitkenhead, A.R. Relationship of peak flow rate and peak velocity time during voluntarv coughing. Br. J. Anaesth. 1995, 74, 714–716. [Google Scholar] [CrossRef] [PubMed]
  16. Mahajan, R.P.; Singh, P.; Murty, G.E.; Aitkenhead, A.R. Relationship between expired lung volume, peak flow rate and peak velocity time during a voluntary cough manoeuvre. Br. J. Anaesth. 1994, 72, 298–301. [Google Scholar] [CrossRef] [PubMed] [Green Version]
  17. Gupta, J.K.; Lin, C.H.; Chen, Q. Flow dynamics and characterization of a cough. Indoor Air 2009, 19, 517–525. [Google Scholar] [CrossRef] [PubMed] [Green Version]
  18. Mylavarapu, G.; Murugappan, S.; Mihaescu, M.; Kalra, M.; Khosla, S.; Gutmark, E. Validation of computational fluid dynamics methodology used for human upper airway flow simulations. J. Biomech. 2009, 42, 1553–1559. [Google Scholar] [CrossRef] [PubMed]
  19. Holbrook, L.T.; Longest, P.W. Validating CFD predictions of highly localized aerosol deposition in airway models: In vitro data and effects of surface properties. J. Aerosol. Sci. 2013, 59, 6–21. [Google Scholar] [CrossRef]
  20. de Rochefort, L.; Vial, L.; Fodil, R.; Maître, X.; Louis, B.; Isabey, D.; Caillibotte, G.; Thiriet, M.; Bittoun, J.; Durand, E.; et al. In vitro validation of computational fluid dynamic simulation in human proximal airways with hyperpolarized 3he magnetic resonance phase-contrast velocimetry. J. Appl. Physiol. 2007, 102, 2012–2023. [Google Scholar] [CrossRef] [PubMed]
  21. Zhang, Z.; Kleinstreuer, C. Airflow structures and nano-particle deposition in a human upper airway model. J. Comput. Phys. 2004, 198, 178–210. [Google Scholar] [CrossRef]
  22. Zhang, Z.; Kim, C.S.; Kleinstreuer, C. Flow structure and particle transport in a triple bifurcation airway model. J. Fluids Eng. 2001, 123, 320–330. [Google Scholar] [CrossRef]
  23. van Erbruggen, E.; Hirsch, C.; Paiva, M. Anatomically based three-dimensional model of airways to simulate flow and particle transport using computational fluid dynamics. J. Appl. Physiol. 2005, 98, 970–980. [Google Scholar] [CrossRef] [PubMed] [Green Version]
  24. Paz, C.; Suárez, E.; Concheiro, M.; Porteiro, J. Airflow simulation and particulate deposition of a breathing cycle in an extrathoracic model. J. Biomech. 2012, 45, S3. [Google Scholar] [CrossRef]
  25. Paz, C.; Suárez, E.; Vence, J. CFD transient simulation of the cough clearance process using an Eulerian wall film model. Comput. Methods Biomech. Biomed. Eng. 2017, 20, 142–152. [Google Scholar] [CrossRef] [PubMed]
  26. Paz, C.; Suárez, E.; Parga, O.; Vence, J. Glottis effects on the cough clearance process simulated with a cfd dynamic mesh and eulerian wall film model. Comput. Methods Biomech. Biomed. Eng. 2017, 20, 1326–1338. [Google Scholar] [CrossRef] [PubMed]
  27. Qi, S.; Zhang, B.; Teng, Y.; Li, J.; Yue, Y.; Kang, Y.; Qian, W. Transient dynamics simulation of airflow in a ct-scanned human airway tree: more or fewer terminal bronchi? Comput. Math. Methods Med. 2017, 3, 1–14. [Google Scholar] [CrossRef] [PubMed]
  28. Luo, H.Y.; Liu, Y. Modeling the bifurcating flow in a ct-scanned human lung airway. J. Biomech. 2008, 41, 2681–2688. [Google Scholar] [CrossRef] [PubMed]
  29. Liu, Y.; So, R.M.; Zhang, C.H. Modeling the bifurcating flow in a human lung airway. J. Biomech. 2002, 35, 465–473. [Google Scholar] [CrossRef]
  30. Kleinstreuer, C.; Zhang, Z. Laminar-to-turbulent fluid-particle flows in a human airway model. Int. J. Multiph. Flow 2003, 29, 271–289. [Google Scholar] [CrossRef]
Figure 1. Cough flow rate variations with time (a: 0.02 s, b: 0.08 s, c: 0.2 s, d: 0.5 s).
Symmetry 10 00595 g001
Figure 2. The 3D geometry of the lung airways used in this study.
Symmetry 10 00595 g002
Figure 3. The comparison of air velocity on the outlet surface of three mesh models.
Symmetry 10 00595 g003
Figure 4. Comparison of the velocity profile for the right main bronchus. (a) The locations of the extracted face, X axis, and Y axis. (b) The velocity along the X direction. (c) The velocity along the Y direction.
Symmetry 10 00595 g004
Figure 5. Airflow velocity streamlines at four time points (a) 0.02 s; (b) 0.08 s; (c) 0.2 s; (d) 0.5 s.
Symmetry 10 00595 g005
Figure 6. Spatial distribution of the wall pressure at four time points (a) 0.02 s; (b) 0.08 s; (c) 0.2 s; (d) 0.5 s.
Symmetry 10 00595 g006
Figure 7. The wall shear stress at four time points (a) 0.02 s; (b) 0.08 s; (c) 0.2 s; (d) 0.5 s.
Symmetry 10 00595 g007
Figure 8. Local flow properties of the four cross sections at four time points (a) 0.02 s; (b) 0.08 s; (c) 0.2 s; (d) 0.5 s.
Symmetry 10 00595 g008
Figure 9. The variation in airflow dynamics with the cough peak flow rate (a) maximum velocity; (b) maximum wall pressure; (c) maximum wall shear stress.
Symmetry 10 00595 g009
Table 1. Comparisons of cross-sectional area and volume flow rate.
Right Main BronchusCurrent CFD SimulationMeasurement (Rochefort (2007))
A (cm2)4.755.10
Q (L/s)0.1390.140 ± 0.011
Table 2. Flow distribution at different cough peak flow rates.
Location3 L/s4 L/s5 L/s6 L/s7 L/s8 L/s9 L/s10 L/s
Left main bronchus46.19%46.14%46.12%46.06%46.12%46.08%46.11%46.07%
Right main bronchus53.81%53.86%53.88%53.94%53.88%53.92%53.89%53.93%

