Article

Effect of Cobalt Catalyst Confinement in Carbon Nanotubes Support on Fischer-Tropsch Synthesis Performance

by
Omid Akbarzadeh
1,*,
Noor Asmawati Mohd Zabidi
2,
Yasmin Abdul Wahab
1,
Nor Aliya Hamizi
1,
Zaira Zaman Chowdhury
1,
Zulkifli Merican Aljunid Merican
2,
Marlinda Ab Rahman
1,
Shamima Akhter
3,
Elisa Rasouli
1 and
Mohd Rafie Johan
1
1
Nanotechnology & Catalysis Research Centre, University of Malaya, Kuala Lumpur 50603, Malaysia
2
Department of Fundamental and Applied Sciences, Universiti Teknologi PETRONAS, Bandar Seri Iskandar, Perak 32610, Malaysia
3
Department of Chemistry, Faculty of Science, University of Malaya, Kuala Lumpur 50603, Malaysia
*
Author to whom correspondence should be addressed.
Symmetry 2018, 10(11), 572; https://doi.org/10.3390/sym10110572
Submission received: 9 October 2018 / Revised: 28 October 2018 / Accepted: 30 October 2018 / Published: 1 November 2018
(This article belongs to the Special Issue Nanocatalysis and Symmetry in Chemistry)

Abstract

:
Pre-treating the multi-walled carbon nanotubes (CNTs) support by refluxing in 35 vol% nitric acid followed by heating at the temperature of 600 to 900 °C resulted in the formation of defects on the CNTs. Increasing the temperature of the pre-treatment of the CNTs from 600 °C to 900 °C, enhanced the fraction of cobalt-oxide nanoparticles encapsulated in the channels of CNTs from 31% to 70%. The performance of Co/CNTs in Fischer-Tropsch synthesis (FTS) was evaluated in a fixed-bed micro-reactor at a temperature of 240 °C and a pressure of 2.0 MPa. The highest CO conversion obtained over Co/CNTs.A.900 was 59% and it dropped by ~3% after 130 h of time-on-stream. However, maximum CO conversion using Co/CNTs.A.600 catalysts was 28% and it decreased rapidly by about 54% after 130 h of time-on-stream. These findings show that the combined acid and thermal pre-treatment of CNTs support at 900 °C has improved the stability and activity of the Co/CNTs catalyst in FTS.

1. Introduction

Recent developments on the applications of Co-based catalyst on carbon materials support in Fischer-Tropsch synthesis (FTS) have been reviewed by Mark E Dry [1] where a new option and challenges in catalysis for the Fischer-Tropsch Synthesis (FTS) have been highlighted. Carbon support exhibits weak interaction with the cobalt and the resultant microstructures greatly influenced the activity and stability of the Co-based catalyst in FTS. Santiago et al. [2] reported metastable carbides nanoparticles are active catalysts and the electronic structure of metal significantly affects catalytic activity. Metals such as Ni, Co or Fe with few d-vacancies can synthesize metastable carbides that are desired catalysts to nucleate and grow CNTs. The unique physical characteristics of carbon nanotubes, such as mechanical, electrical, porosity, and thermal conductivity as well as its unique chemical properties rendered them a suitable option as a catalyst support. Due to the inertness of the CNTs and its weak interaction with metals, surface modification of CNTs has to be performed. Nitric acid is typically used to functionalize the surface of CNTs and it has been established that the CNT surface become more reactive upon oxidation [3,4,5,6]. Storsæter et al. [7,8] reported that under optimum oxidation conditions, maximum surface area, pore size, defects and oxygen content can be achieved. CNT support with the highest degree of functionalization stabilized Co nanoparticles and resulted in high performance FTS catalyst. Davis and co-workers [9] reported that oxidation in air up to 400 °C produced defects, however upon annealing in vacuum at a much higher temperature (1800 °C), the CNTs became more ordered compared to ‘as received- CNTs’. Tavasoli et al. [10] discovered that thermal treatments of CNTs following the acid refluxing step effectively removed the oxygen-containing functional groups (such as –C=O, –COOH, –OH) on the external surface of CNTs, resulting in controllable encapsulation of Co particles inside the channels of CNTs. They applied a wetness impregnation method (without pH control) to deposit Co on the treated CNTs and found that CNTs pre-treated at 650 °C resulted in 80% of cobalt nanoparticles deposited inside the channel of the CNTs and that it exhibited the highest activity and selectivity to C5+ hydrocarbons in FTS.
In this study, we used the same approach of combined acid and thermal pre-treatments of CNTs as that of Tavasoli et al. [10] but we applied the strong electrostatic adsorption (SEA) method to prepare the Co/CNTs catalyst where the pH of the precursor solution was controlled during the metal deposition. Schwarz suggested that the electrostatic forces between a metallic ion and a charged support could be utilized for direct adsorption of the metallic ion over surfaces including two oxide fractions [11,12]. The idea behind this method has been efficiently applied to make highly dispersed, monometallic catalysts on a multitude of oxide and carbon supports [13,14,15]. In a natural way hydroxyl (–OH) groups on the surface of an oxide become protonated or deprotonated when the contacting solution pH is acidic or basic, respectively. These charged hydroxyl groups are then in a position to uptake metal complex ions in a solution of opposing charge. The density of the charged hydroxyl groups on the oxide surface depends on its Point of Zero Charge (PZC), i.e., the pH at which the surface is neutrally charged. Above the PZC, the hydroxyl groups become de-protonated and render the surface negatively charged and cationic complex can be adsorbed onto the surface via strong electrostatic adsorption method [15].
Previous studies conducted on the CNTs-supported cobalt catalysts utilized the impregnation method without pH control during the preparation of the catalyst [16,17]. In this work, the deposition of cobalt on the pre-treated CNTs support was performed at selected pH, based on the SEA principle. The pH of the precursor cobalt solution was controlled during the synthesis step. The effects of combined acid and thermal pre-treatments of CNTs support on the properties and performance of Co/CNTs catalysts are discussed. We have established that the combined acid and thermal pre-treatments of CNTs at 900 °C improved the activity and stability of the Co/CNTs catalyst in FTS.

2. Experimental

Carbon nanotubes were supplied by Nanostructures & Amorphous Materials Inc., Los Alamos, NM, USA (purity > 95%, chemical vapor deposition (CVD), length: 10–20 um, diameter: 30–50 nm) and functionalized via refluxing with 35 vol% nitric acid (Merck) for 15 h at 110 °C. The mixture was filtered and washed with deionized water until the pH reached 7. Acid-treated CNTs were then thermally treated at 600 and 900 °C in flowing argon at 20 mL min−1 for 3 h. This thermal pre-treatment was performed to reduce the oxygen containing groups on the external surface of the CNTs, as previously reported [10]. Samples with acid and thermal pre-treatments at different temperatures were designated as follows: CNTs. A, CNTs.A.600 and CNTs.A.900. The last 3 digits in the sample coding represent the temperature (°C) at which thermal pre-treatment was conducted on the acid-treated CNTs. The purity of the CNTs did not change significantly after the pre-treatment steps.
Strong electrostatic adsorption (SEA) method was used as the catalyst preparation method for the Co/CNTs samples [13,14,15,18]. Based on the principles of the SEA method [19,20], the surface of functionalized CNTs would become negatively charged when the pH of the contacting solution was higher than the point of zero charge (PZC) of the CNTs. The PZC of the CNTs used in this work was found to be 9.5. Based on previous studies [16], the maximum cobalt uptake on the CNTs occurred when the cobalt precursor solution was kept at pH of 14. Therefore, the adsorption of cobalt ions on the pre-treated CNTs was performed at pH 14 using an aqueous solution of Co(NO3)2. The samples were then filtered and air dried for 24 h. Dried samples were calcined in a tubular furnace at 400 °C for 4 h under Ar flow. The metal loading on CNTs was kept at 10 wt. % during the preparation stage. The actual amount of Co in the Co/CNTs sample was found to be 9.5 wt. % via AAS measurements.

2.1. Catalyst Characterization

For determination of textural properties, samples were degassed at 200 °C for 4 h under 50 mTorr vacuum and were analyzed by N2-adsorption (Micromeritics, ASAP 2020, (Norcross, GA, USA)). The reduction trend of the catalysts was analyzed by using a Thermo Finnigan TPD/R/O 1100 at Universiti Teknologi PETRONAS (UTP) prepared with a thermal conductivity detector and a mass spectrometer. Typically, 30 mg catalyst was located the U-shaped quartz pipe. Catalyst were degassed under a nitrogen gas at 200 °C to eliminate traces of moisture and gases from catalyst pores and then cooled to ambient temperatures. TPR was carried on using 5% H2/N2 with a rate of 20 mL min−1 and heating from 40 to 800 °C at 10 °C min−1. The TPD results was used to find out and analyze cobalt dispersion. For TPD tests, 30 mg of calcined samples was reduced under hydrogen gas at 370 °C for 6 h and then cooled to 40 °C.
TPD experiment was performed by heating the sample up to 400 °C under nitrogen flow at 10 °C min−1. After H2-TPD, the sample was re-oxidized by pulses of 10% oxygen in helium to determine the extent of reduction. It was assumed that Co0 was oxidized to Co3O4. Raman spectra were obtained using Horiba instrument with laser excitation wavelength of 514 nm. The particle size distribution was obtained using a HRTEM (Zeiss LIBRA 200 (Jena, Germany) at UTP) at 200 kV accelerating voltage. Samples for HRTEM analyses were sonicated in hexanol and then dropped on the carbon-coated copper grid. Equations (1)–(3) were used for calculating the reduction and dispersion %, respectively [21,22,23].
calibration   value   ( l   gas / area   units ) = loop   volume × %   analytical   gas mean   calibration   area × 100
H 2   uptake   ( moles gcat ) = analytical   area   from   TPD × calibration   value sample   weight × 24.5
%   Dispersion   ( total   Co ) = H 2   uptake × atomic   weight × stoichiometry %   metal = number   of   Co   atoms   on   surface total   number   of   Co   atoms   in   sample × 100
where:
H2-uptake = amount of H2 consumed in mmol/g·cat calculated from the peak area of H2-TPD spectra
Atomic weight = MW of the metal
% Metal = weight percentage of the metal in the catalyst.
Stoichiometry = 2
O 2   uptake   ( moles / gcat ) = sum   of   the   consumed   pulse   areas × calibration   value sample   weight × 24.5
assuming 1/3Co0 + (2/3)O2 = (1/3)Co3O4
%   reduction = O 2   uptake × 2 3 × atomic   weight %   metal
where:
  • O2-uptake = μmol/g·cat of O2 calculated from TPO spectra of the catalyst.
  • Atomic weight = MW of the metal
  • % Metal = weight percentage of the metal in the catalyst.
No .   of   active   sites = wt .   ofCo   in   the   sample × reduction × dispersion × N A MW
where:
  • NA = Avogadro’s number
  • MW = atomic weight of the metal.

2.2. Catalytic Activity Measurements

Fischer–Tropsch synthesis was performed in a continuous flow fixed-bed reactor (PID Eng. & Tech (Madrid, Spain)) equipped with mass flow controllers (Hi-Tec Bronkhorst (Gelderland, The Netherlands)). CO and H2 (purity of 99.999%) were used as feed gases. The catalyst (0.02 g) was placed in a stainless-steel tube reactor (9 mm i.d. × 305 mm length) and sandwiched between quartz wools without further dilution. Prior to the reaction, the catalyst was reduced in situ under H2 flow at 0.1 MPa and 420 °C for 10 h. The reaction was carried out in H2 flowing at 50 mL min−1 and 25 mL min−1 of CO at 240 °C, 2.0 MPa, and the reaction was carried out for 130 h time-on-stream. The reactor was connected to an online gas chromatograph (Agilent 7890A (Santa Clara, CA, USA) at UTP) equipped with two TCD detectors for analyzing hydrogen and permanent gases using Molsieve 13X and Hayesep Q columns, respectively. The hydrocarbons were detected using the FID detector and a DB-1 column. All gas lines after the reactor were kept at 150 °C. Products were sampled at the 30 min interval and hydrocarbon selectivity were calculated at the end of the reaction (typically 10 h). Data were obtained at steady-state conditions with carbon balance of 95–102%. The reproducibility was ensured by repeating the experiments at least twice under identical conditions and standard deviations of experimental results were found to be within ±5.0%. The %CO conversion and the hydrocarbon product selectivity (SCi) were calculated as follows (Equations (7) and (8)):
X CO = ( n CO in n CO out n CO in ) × 100
S Ci = ( mol   ofcomponent   C i C i ) × 100

3. Results and Discussion

3.1. Textural Properties of the Catalysts

The textural properties of the catalyst samples are represented in Table 1. Acid treatment plays an important role in increasing the BET specific surface area and the total pore volume of the samples. The BET surface area of pristine CNTs was 138.2 m2g−1 and its total pore volume was 1.58 cm3·g−1 while the corresponding BET surface area and total pore volume values of CNTs after acid treatment were 223.2 m2·g−1 and 0.88 cm3·g−1, respectively. The increase in BET surface area could be attributed to the removal of impurities and opening of the CNTs’ caps. By increasing the thermal treatment temperature, the BET surface area increased while the total pore volume decreased slightly which could be due to the presence of defects on the CNTs as indicated by TEM results [17]. After metal loading on the pre-treated CNTs at 600 °C, via SEA method, the BET surface area and total pore volume decreased to 207.8 m2·g−1 and 0.50 cm3·g−1, respectively. The decrease in BET surface area and total pore volume of the samples could be attributed to the incorporation of nanoparticles inside the CNTs channels [24]. This result is in good agreement with TEM results at 600 °C, 30% and at 900 °C, 70% of nanoparticles encapsulated inside the CNTs channels.

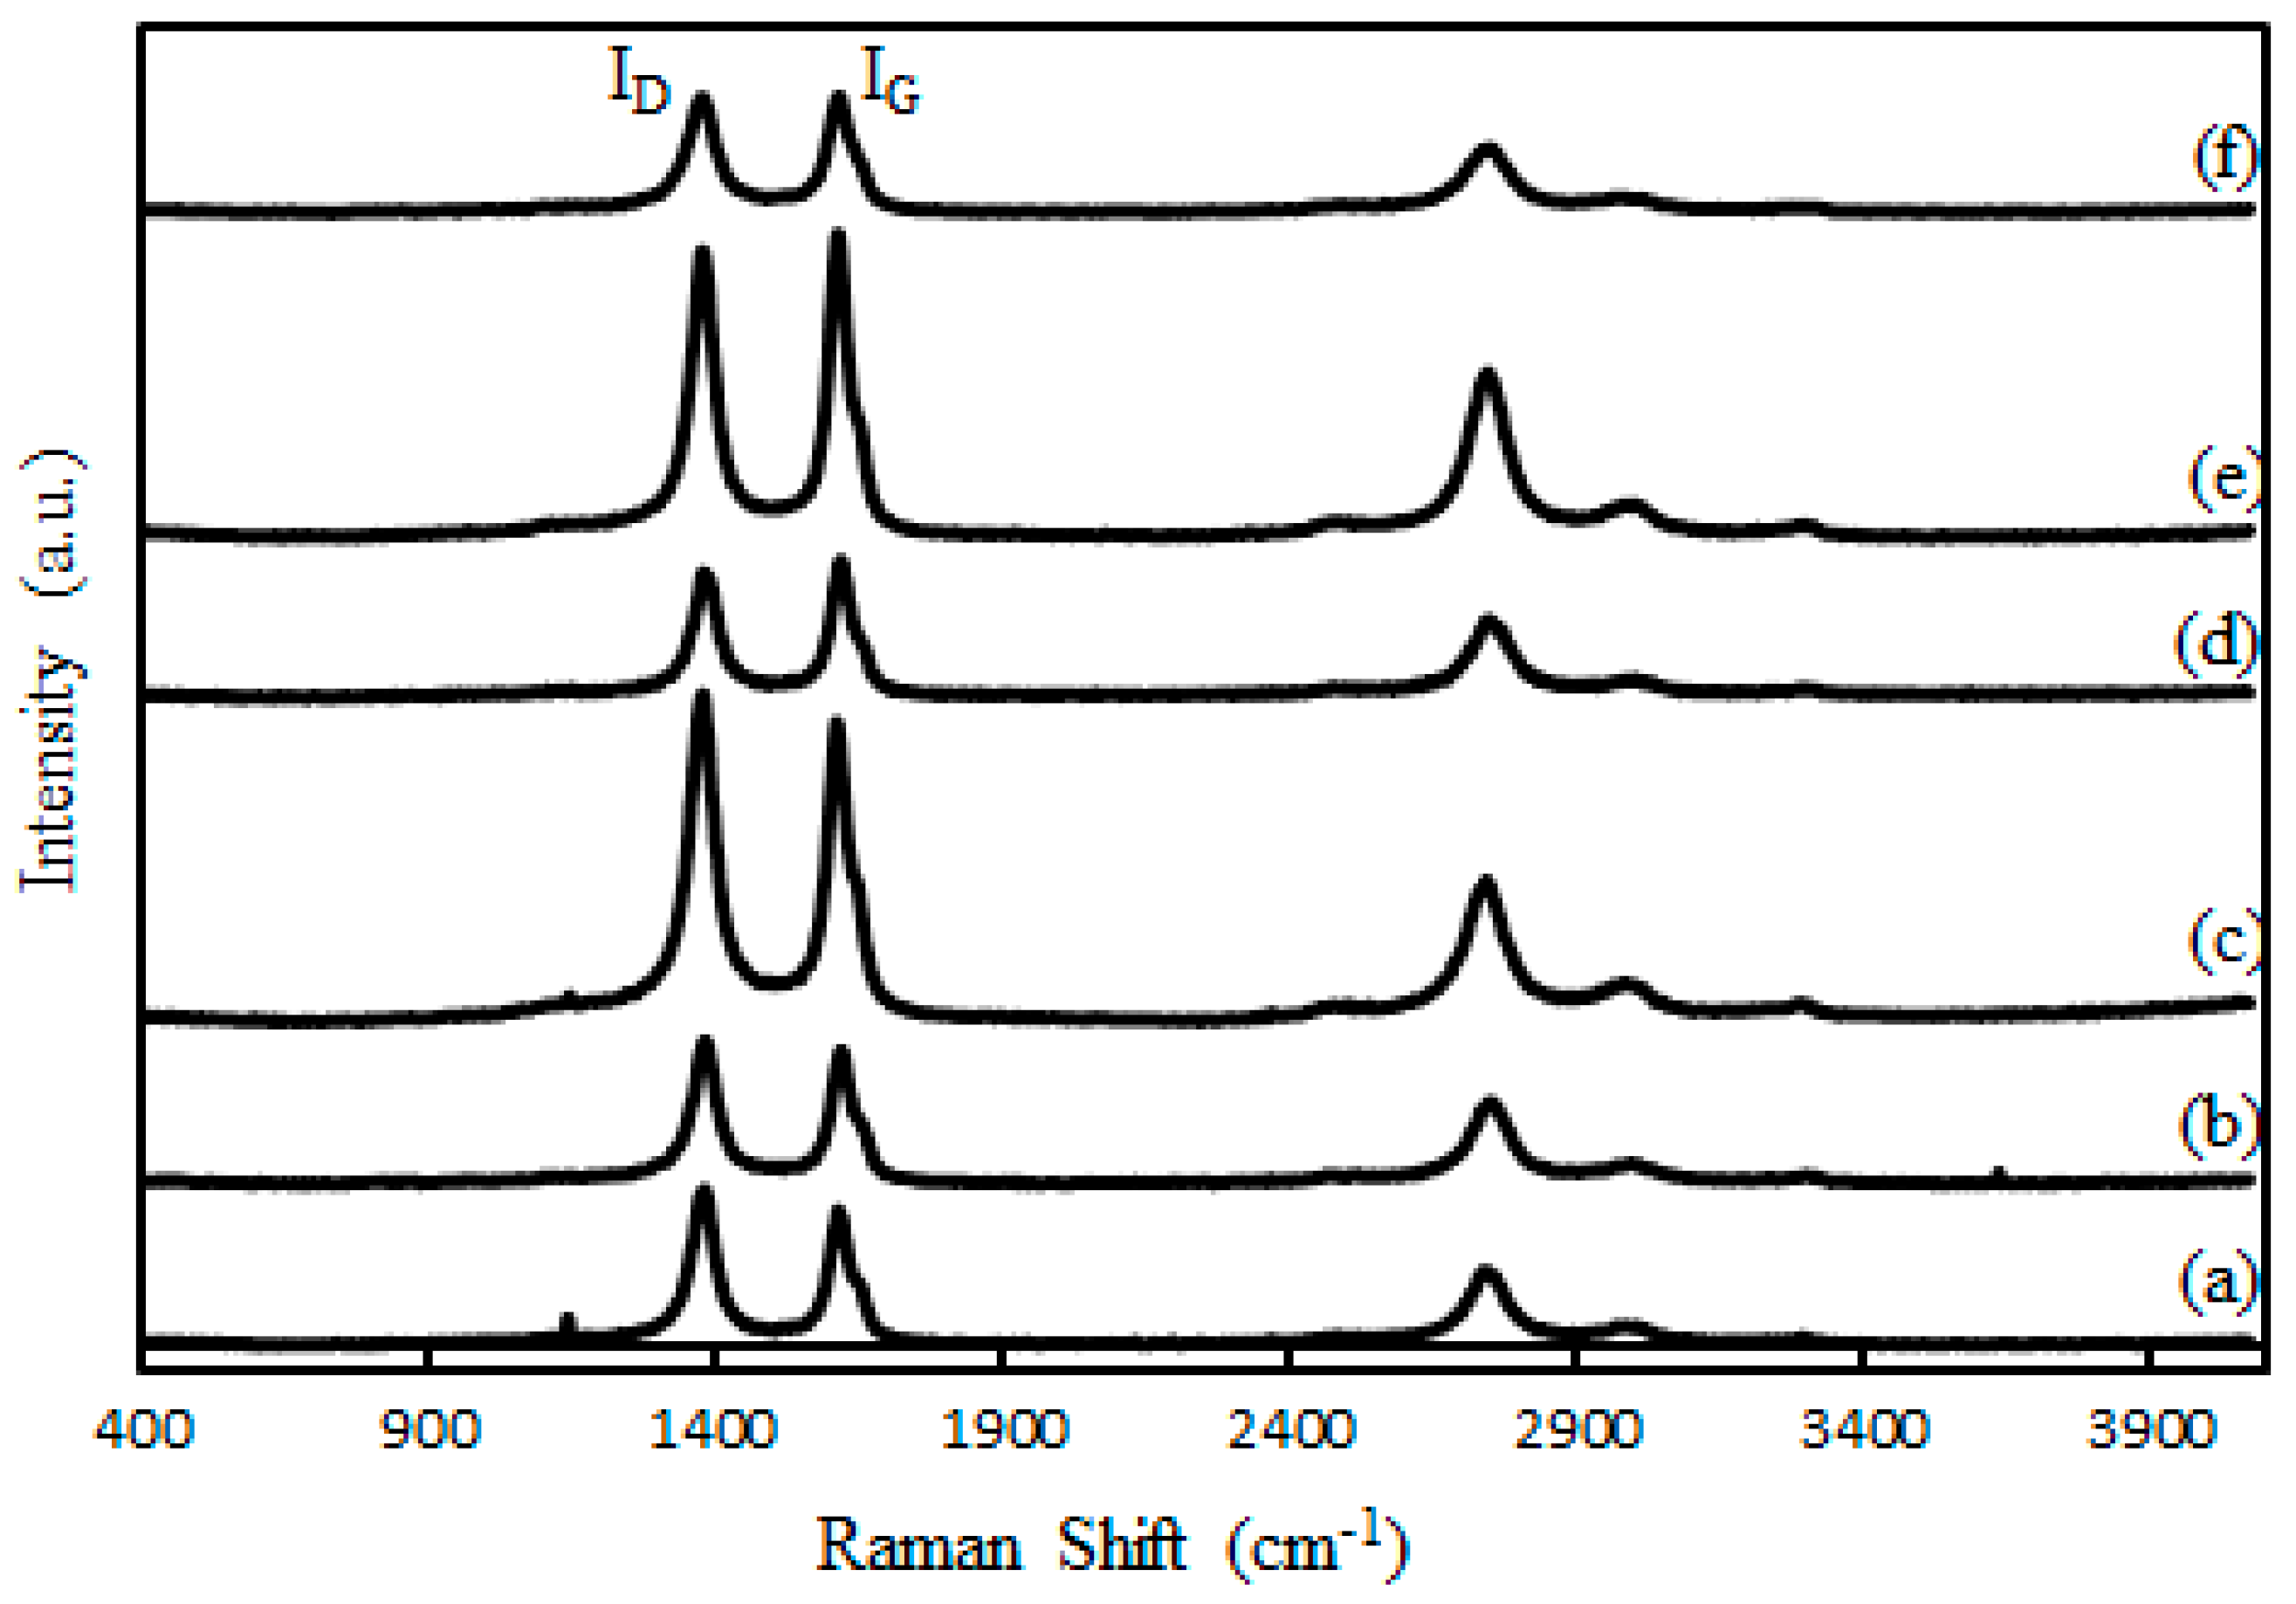
3.2. Raman Spectroscopy

Figure 1 shows the Raman spectra of the samples. The peak at ~1350 cm−1 (D-band) correspond to the disorder-induced band and another peak at ~1590 cm−1 (G-band) is attributed to a well-ordered graphite in the CNTs [6,25,26]. The second-order 2D feature (G′) at about 2700 cm−1 and the C–H stretching vibration at 2920 cm−1 were also observed for the samples. The lowest ID/IG ratio (0.85) was obtained from the un-treated (as received) CNTs. Table 2 shows the ID/IG ratio increased to 1.06 and 1.12 for samples which underwent acid and thermal treatments at 600 and 900 °C, respectively, indicating larger amounts of defects formed upon increasing temperature of the thermal treatment on the CNTs. Therefore, thermal treated CNTs could enhance the dispersion and avoid sintering and deactivation of active sites during Fischer–Tropsch reaction when it is used as a catalyst support. The values of ID/IG ratio in this work are similar to those reported by Furimsky et al. [7] where ID/IG ratio of ~0.95 was obtained on pristine CNTs which increased to ~1.25 when CNTs were oxidized for 15 h.

3.3. Fourier-Transform Infrared Spectroscopy (FTIR)

Figure 2 shows the FTIR spectra of the as-received CNTs and the treated CNTs. The peak at the 1600 cm−1 was due to the C=C bond in the CNTs and was detected on all samples. The presence of O–H functional group is shown by the presence of vibrational bands at 3300–3600 cm−1 and its intensity was found to decrease by increasing the temperature of the thermal pre-treatment the energy of bounds between O–H functional group and CNTs support increased and consequently the functional group remove from external surface of CNTs. A similar decrease in intensity was also observed for the peak at 597 cm−1 (C–H bending mode). This trend suggests better controlling of the functional groups inside the CNTs channels and removing from external surface of the CNTs with the increasing temperature of the thermal pre-treatment. In order to encapsulate all of the cobalt cluster active sites inside the CNTs channels, a thermal treatment applied for nitric acid treated CNTs to clear the needless functional groups on the CNTs surface. Peaks at 1771 cm−1 (C=O for carboxyl groups), 1262 cm−1 (C–O), 1094 cm−1 (C–O alcohols), 2850–2950 cm−1 (both C–H anti-symmetric and symmetric stretch for CH3 and CH2) were detected, indicating defects formation on the CNTs structure after the functionalization [27].

3.4. XRD Analysis

Figure 3 shows the X-ray diffraction patterns of the calcined and non-reduced Co/CNTs catalyst samples with acid treatment and thermal pre-treatment at 600 °C, 700 °C, 800 °C and 900 °C. The main peaks are attributed to the CNTs and Co3O4. The 2θ values of 25.2° and 42.5° are attributed to the CNTs support which is associated to the graphite layers of multi-walled carbon nanotubes. The acid and thermal pre-treatment on the CNTs did not change the peaks significantly.
The peaks at 2θ = 25.2° and 42.5° are attributed to the characteristic diffraction lines of CNTs (002) and (100), respectively. The (002) diffraction pattern of acid-treated CNTs was sharper than the one from the as-received CNTs. This feature could be due to the increasing graphitization degree of acid-treated CNTs [28]. In the XRD patterns of Co/CNTs, peaks corresponding to 2θ values of 28.5°, 34°, 36.8°, 42°, 53°, 62.5° and 66° were derived from different crystal planes of Co3O4. The XRD patterns were in good match with those that were previously reported [29]. Using Scherer’s equation, the Co oxide particle size was found to be 7.1 ± 0.2 nm on the CNTs which were thermally treated at 900 °C. X-ray diffraction (XRD, Bruker at University of Malaya) results are in good agreement with TEM results and JCPDS (Joint Committee on Powder Diffraction Standards) data (at University of Malaya), suggesting there was no lattice strain contribution.

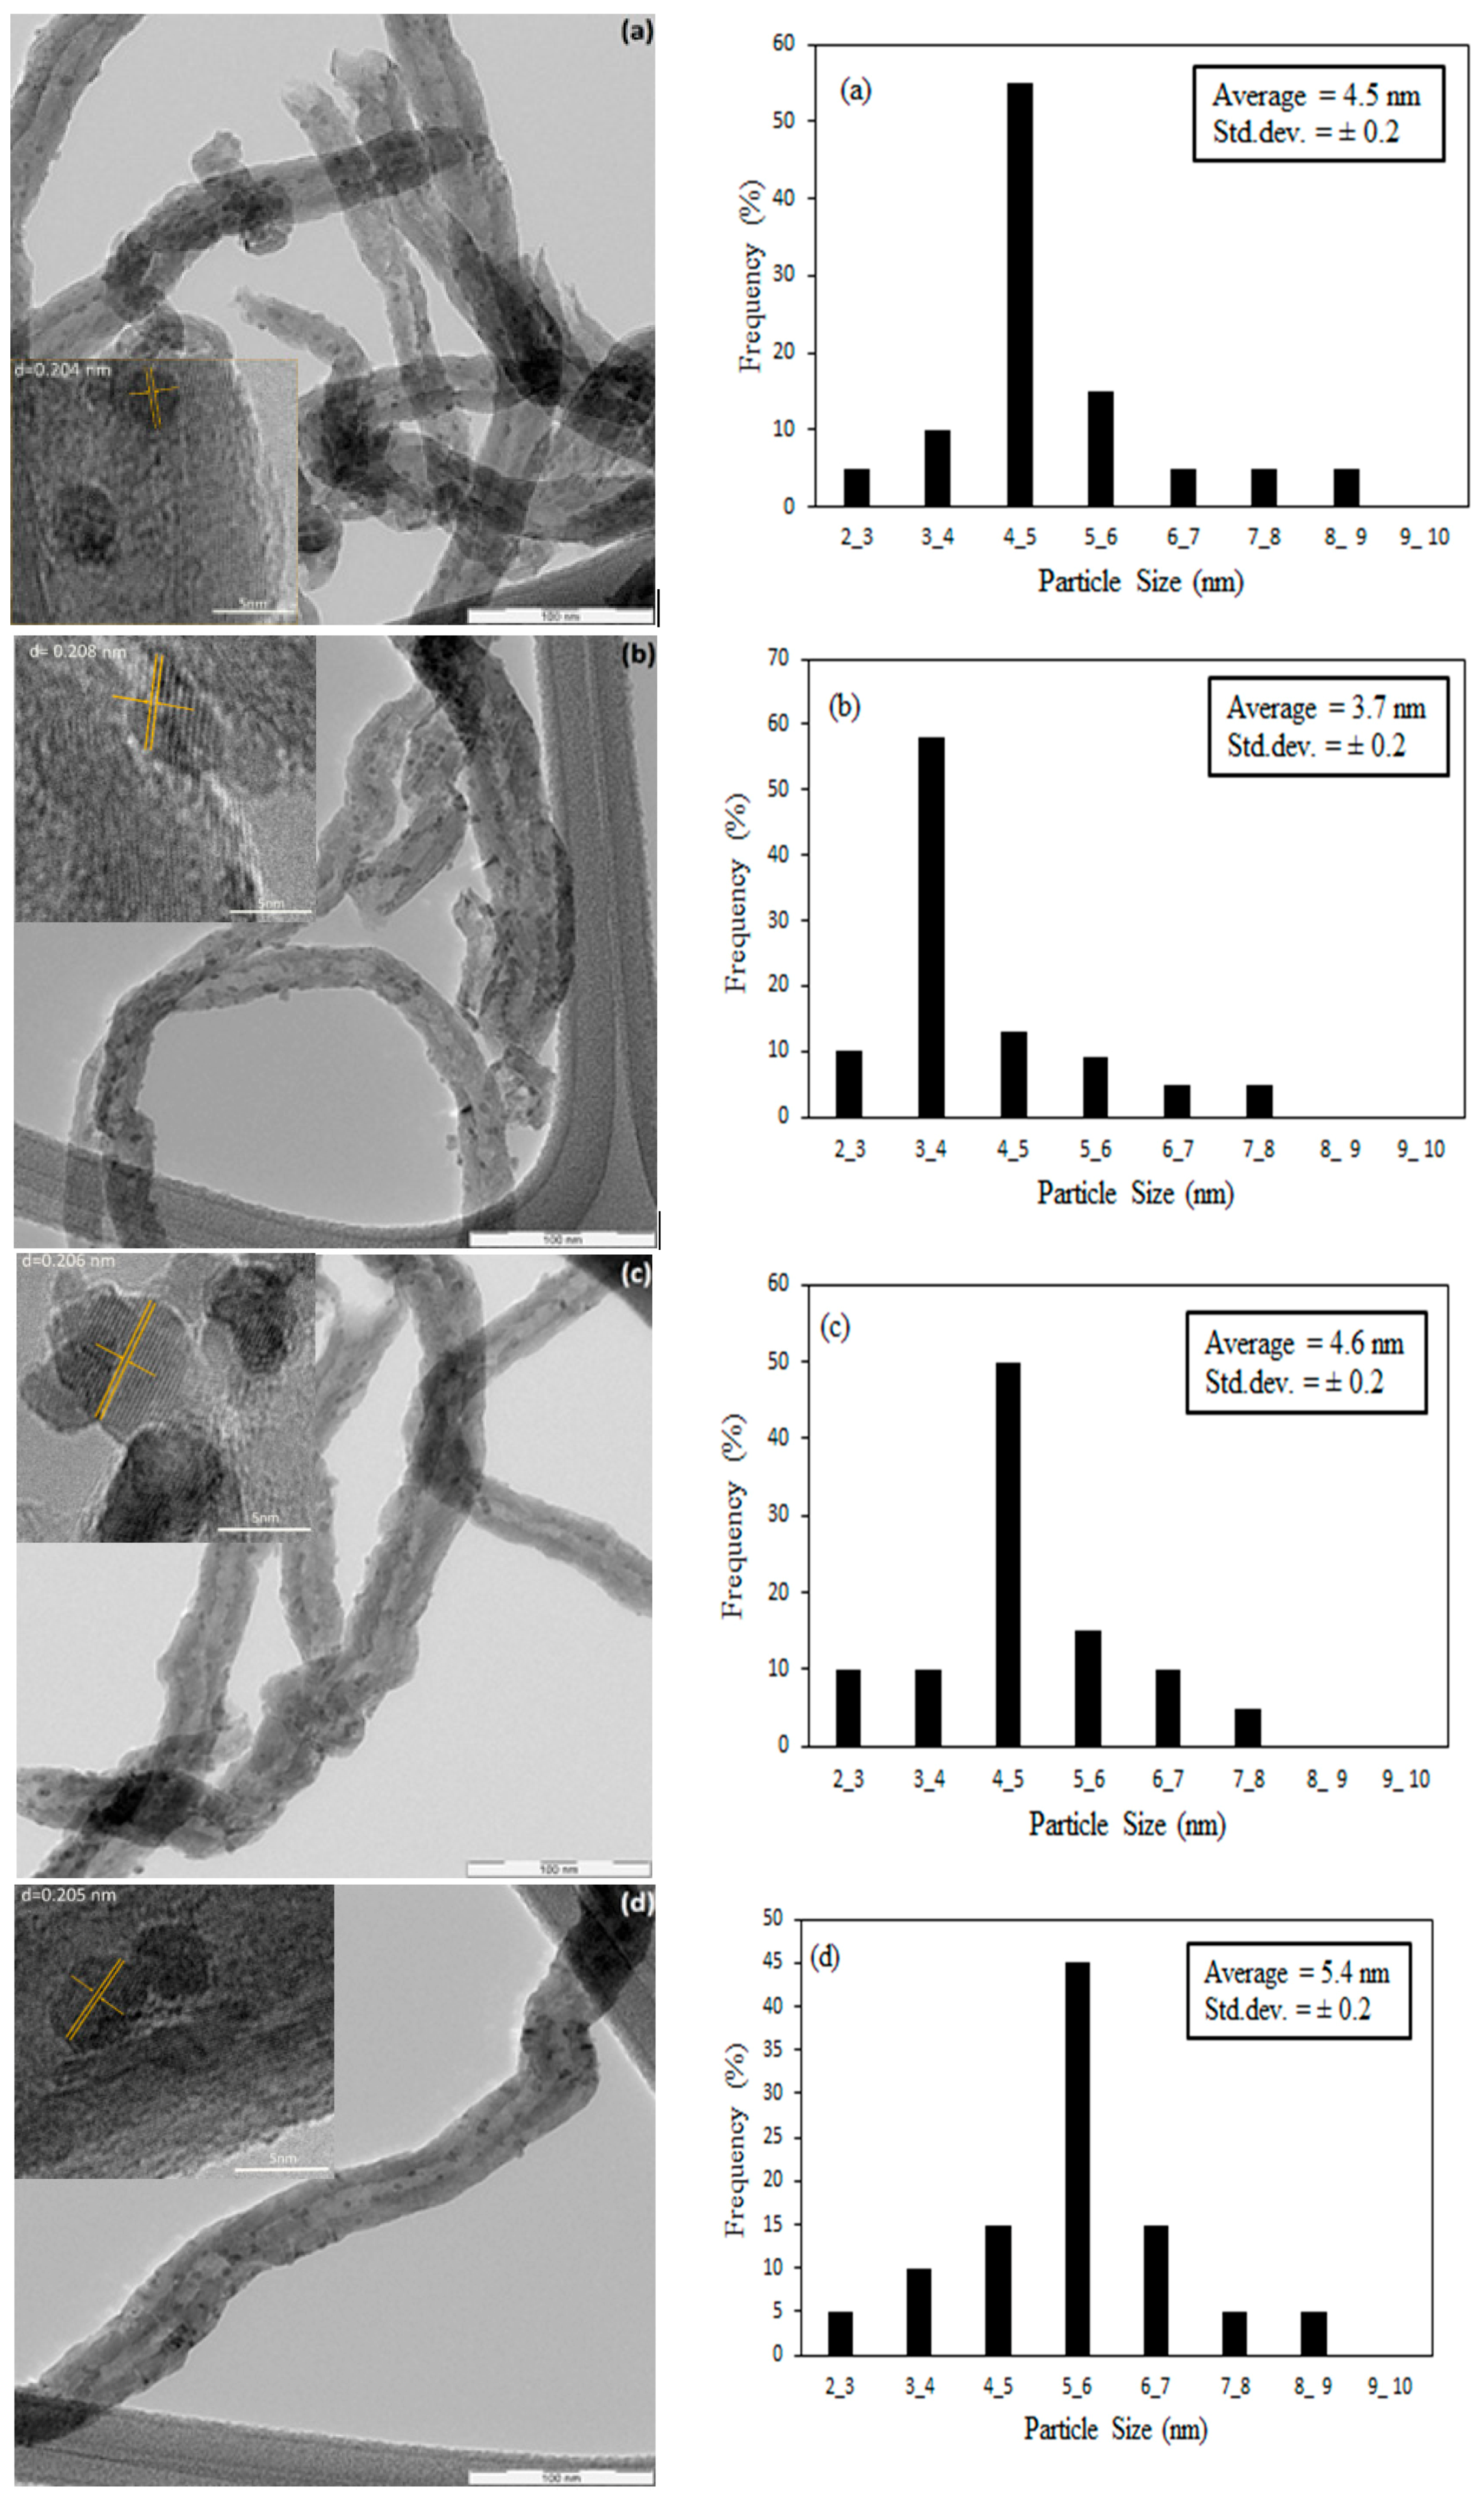
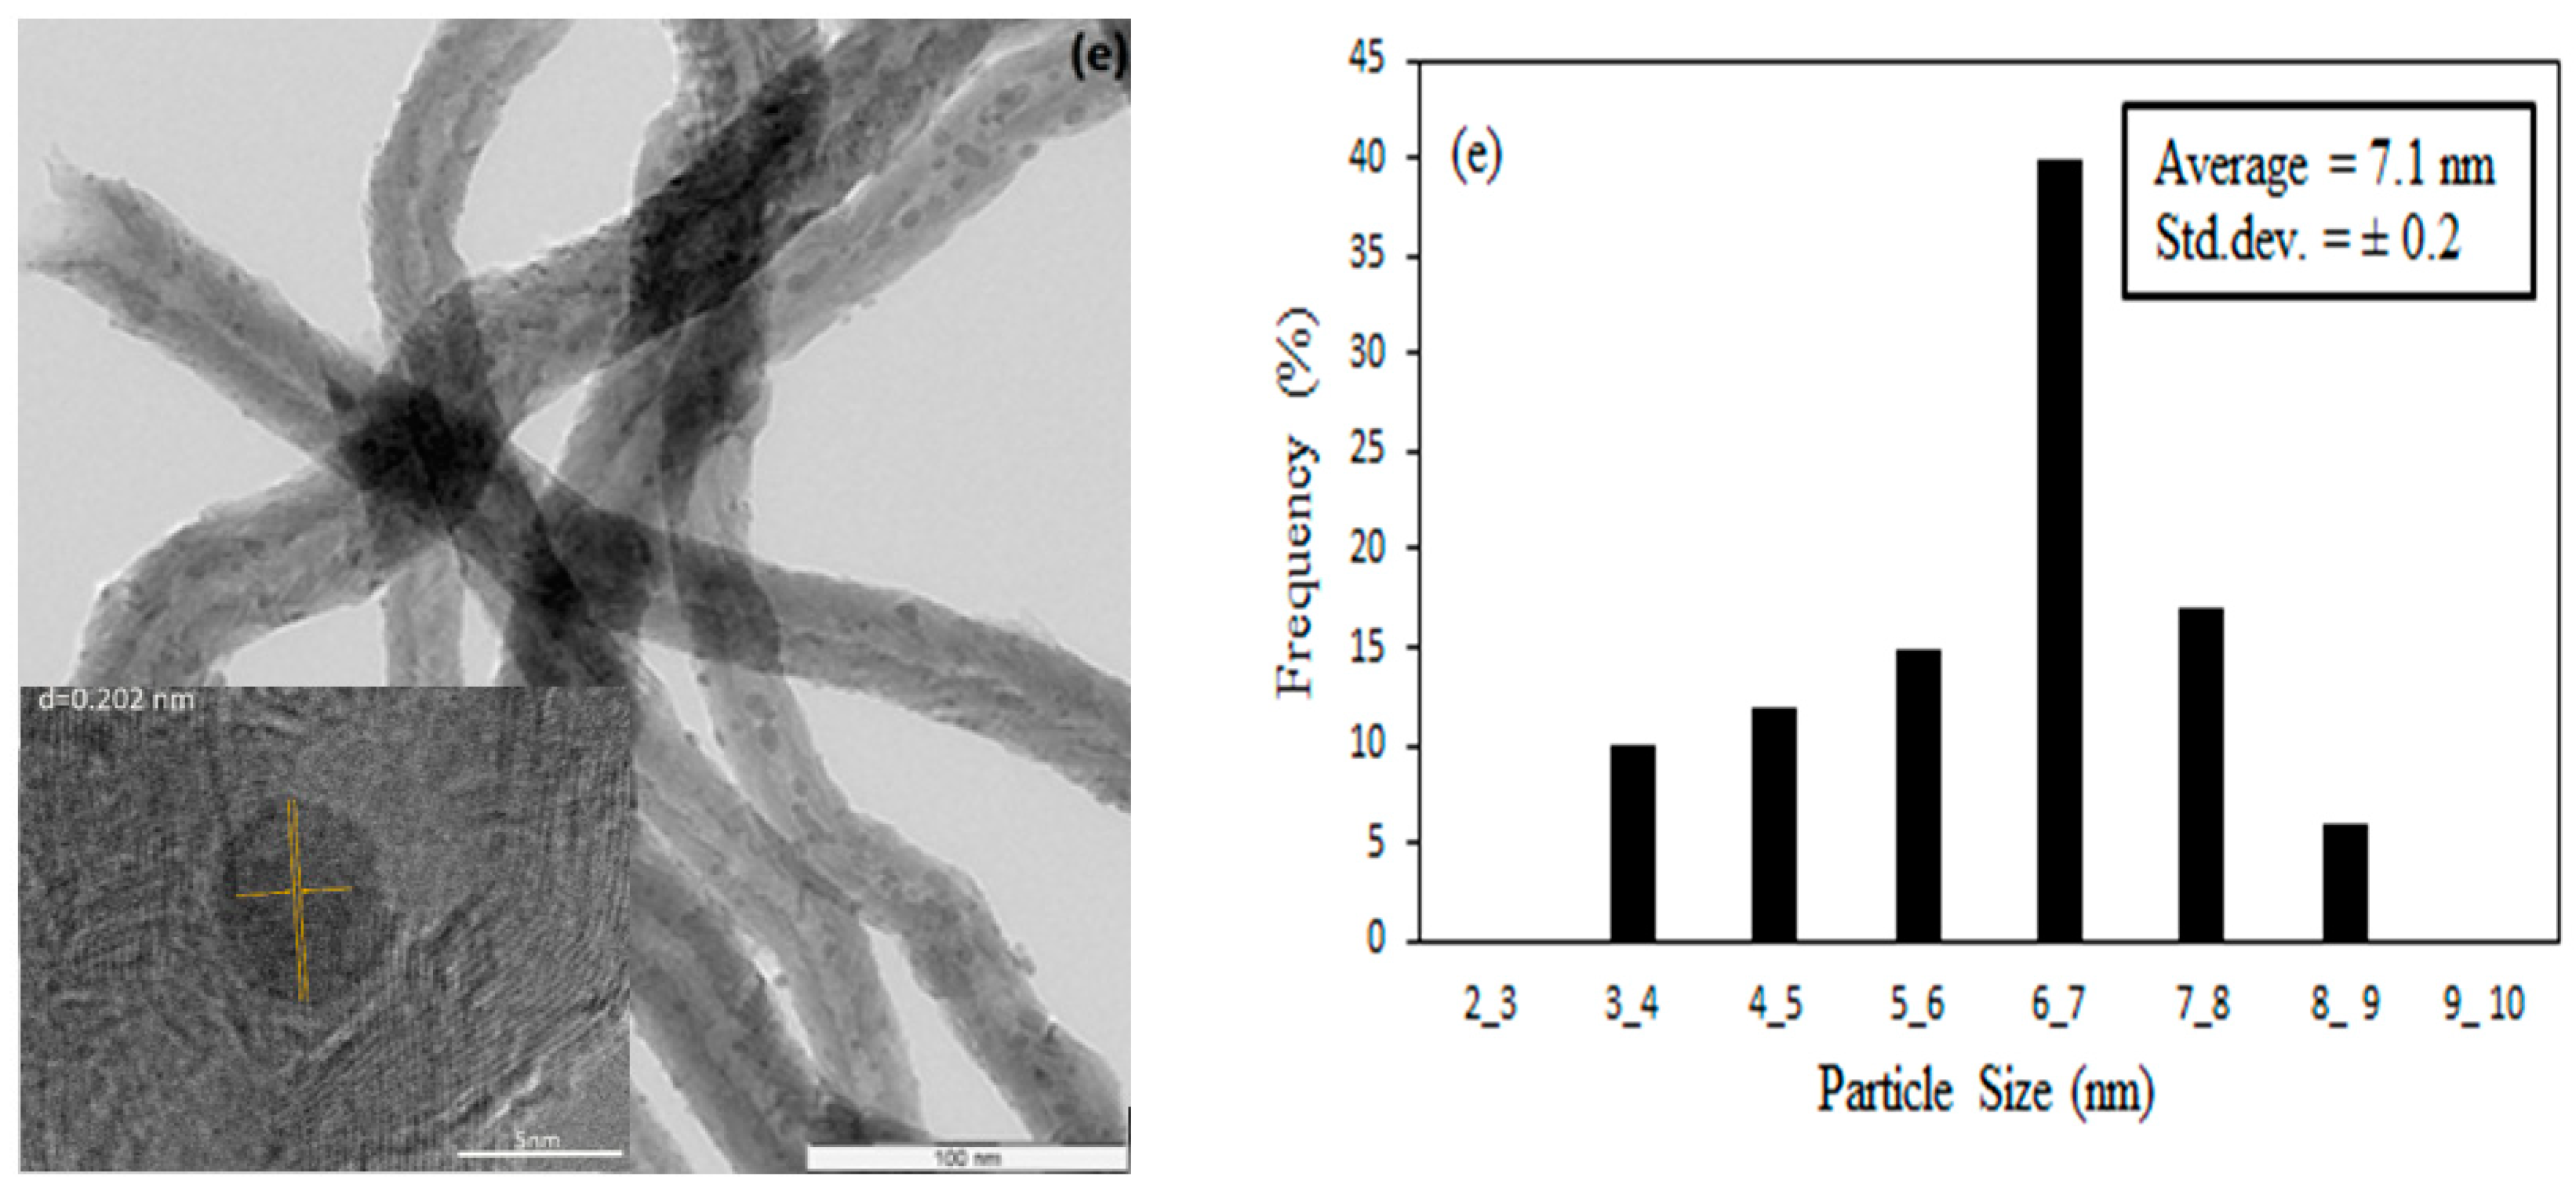
3.5. Morphology of the Catalysts

After the nitric acid pre-treatment step, the functional groups containing oxygen such as –OH were introduced on the surface of CNTs and these functional groups can adsorb the Co ions during the impregnation method through the SEA process [30]. The subsequent thermal treatment on the nitric acid-treated CNTs led to removal of –OH groups from the external surface of CNTs but maintaining the functional groups in the inner channels of the CNTs. This feature resulted in an increasing encapsulation of cobalt oxide nanoparticles in the CNTs channel by increasing the temperature of the thermal pre-treatment [31]. Applying 35 vol% concentrated nitric acid during the refluxing at 110 °C opened the caps of the CNTs. Figure 4a shows that for CNTs-A without thermal treatment, most of the metal-oxide nanoparticles were deposited on the external surface of CNTs. The CNTs exhibit d-spacing of 0.204 nm which was not affected by the thermal treatment. Figure 4b shows that the thermally treated CNTs at 600 °C resulted in deposition of most cobalt oxide nanoparticles on the external surface of CNTs. Figure 4e reveals that increasing temperature of the thermal treatment to 900 °C resulted in partially broken CNTs and formation of some defects on the CNTs walls, which enhanced the number of cobalt clusters encapsulated inside the CNTs channels rather than on the external surface of CNTs.
About 150 TEM images taken at different areas under different magnifications were used to compute the particle size distribution of the cobalt oxide nanoparticles on the CNTs support. The corresponding histogram are shown next to the respective HRTEM images of the samples. The average particle sizes determined from HRTEM and XRD analyses are presented in Table 3. By increasing the temperature of the thermal pre-treatment, a larger fraction of nanoparticles was encapsulated in the channels of the CNTs. At 900 °C treatment, about 70% of cobalt oxide nanoparticles were deposited on the inner walls compared to only 10% on the CNTs which did not undergo thermal pre-treatment [32]. The average particle diameters obtained from HRTEM analyses were in agreement with those of XRD results. As shown in Table 3, the average particle size of cobalt-oxide nanoparticles inside the CNTs channel were found to increase with increasing temperature of CNTs thermal pre-treatment. The experimental results indicated that the thermal pre-treatment of CNTs prior to metal loading via SEA method could control the size and distribution of the metal nanoparticles on the CNTs support [33]. At higher temperatures of thermal pre-treatment of CNTs, more nanoparticles resided in the channel of the CNTs. Metal-support interaction was lower for the Co particles inside the CNTs channels compared to that of the external surface of the CNTs channels, thus reducibility improved when larger fraction of nanoparticles encapsulated inside the CNTs channels, as indicated in Figure 4.

3.6. TPR-TPO-TPD Analysis

The reducibility of the catalyst is one of the key factors impacting the catalyst performance. The TPR profiles of pristine and thermally-treated CNTs are shown in Figure 5. Two reduction peaks were observed for the Co/CNTs samples. The first peak recorded around 300 °C was associated to the reduction of Co3O4 to CoO [34] and the second peak at around 550 °C was related to reduction of CoO to Co [34].
The amount of chemisorbed hydrogens was calculated from H2-TPR profiles and the results are shown in Table 4. The hydrogen consumption for Co/CNTs increased with increasing temperature of thermal pre-treatment which could be due to bigger particle size, better dispersion inside the CNTs channels and lower metal-support interaction due to the confinement of Co particles inside the CNTs channels. The reduction% and number of Co active sites [35] on the catalysts derived from H2-TPD [36] and pulse re-oxidation were determined using Equations (4)–(6), respectively and the results are demonstrated in Table 4. Increasing the temperature of pre-treatment from 600 °C to 900 °C resulted in a considerable improvement on the reducibility and dispersion of the nanoparticles. Increases in the Co/CNTs reducibility could be related to the unique textural properties of CNTs and low interaction of Co nanoparticles with the pre-treated CNTs support at high temperature (900 °C). The CNTs-supported catalysts contained a high number of active sites inside the CNTs channels which increased with increasing the temperature of the thermal pre-treatment. The observed trend could be due to the improvement in reducibility, narrow particle size distribution and a high dispersion of Co oxide nanoparticles inside the CNTs channels support.

3.7. Activity and Product Selectivity for FTS

Table 5 shows the catalytic performance for 10 wt. % Co/CNTs-A and Co/CNTs-A.600 °C, 700 °C, 800 °C and 900 °C. For Co/CNTs-A, the CO conversion is 16.4% and CH4 selectivity is 18.6%. The lower CO conversion trend compared to those of thermally-treated Co/CNTs could be the presence of more oxygen-containing groups on the surface of the acid-treated CNTs as shown in FTIR plot which consequently resulted in the agglomeration of cobalt-oxide nanoparticles. By applying thermal treatment and increasing the treatment’s temperature from 600 °C to 900 °C, the following were observed: The CO conversion increased up to 58.7%, selectivity of the CH4 decreased to 9.5% and selectivity of C5+ increased to 59.1%. These results are shown in Table 3 and TEM images in Figure 3. Results showing at higher treatment temperature, larger fraction of Co nanoparticles resided in the CNTs channel. This active sites confinement resulted in longer contact time for syngas, “confinement of reaction intermediates” and led to lower sintering rate thus enhancing growth of longer chain hydrocarbon products [28,34] and higher catalytic performance. These results of textural analyses and TPD-TPR-TPO showed that with acid and thermal treatment temperature, the textural property improved, the reduction percentage, dispersion and consequently number of active sites inside the CNTs channels increased thus led to higher CO conversion and C5+ selectivity.
Table 6 shows the results of FTS for Co/CNTs-A.900 catalyst tested at varying reaction temperature. By increasing the reaction temperature from 220 °C to 280 °C, there was an increase in both the CO conversion and CH4 products while C5+ products reduced slightly. These results indicated that a higher reaction temperature is desired for improving CO conversion but at the expense of C5+ selectivity. This phenomenon is in accordance with the previously reported results by other authors [28]. It has been reported earlier that by increasing the reaction temperature, the hydrocarbon chain shifts towards the shorter chain [36].

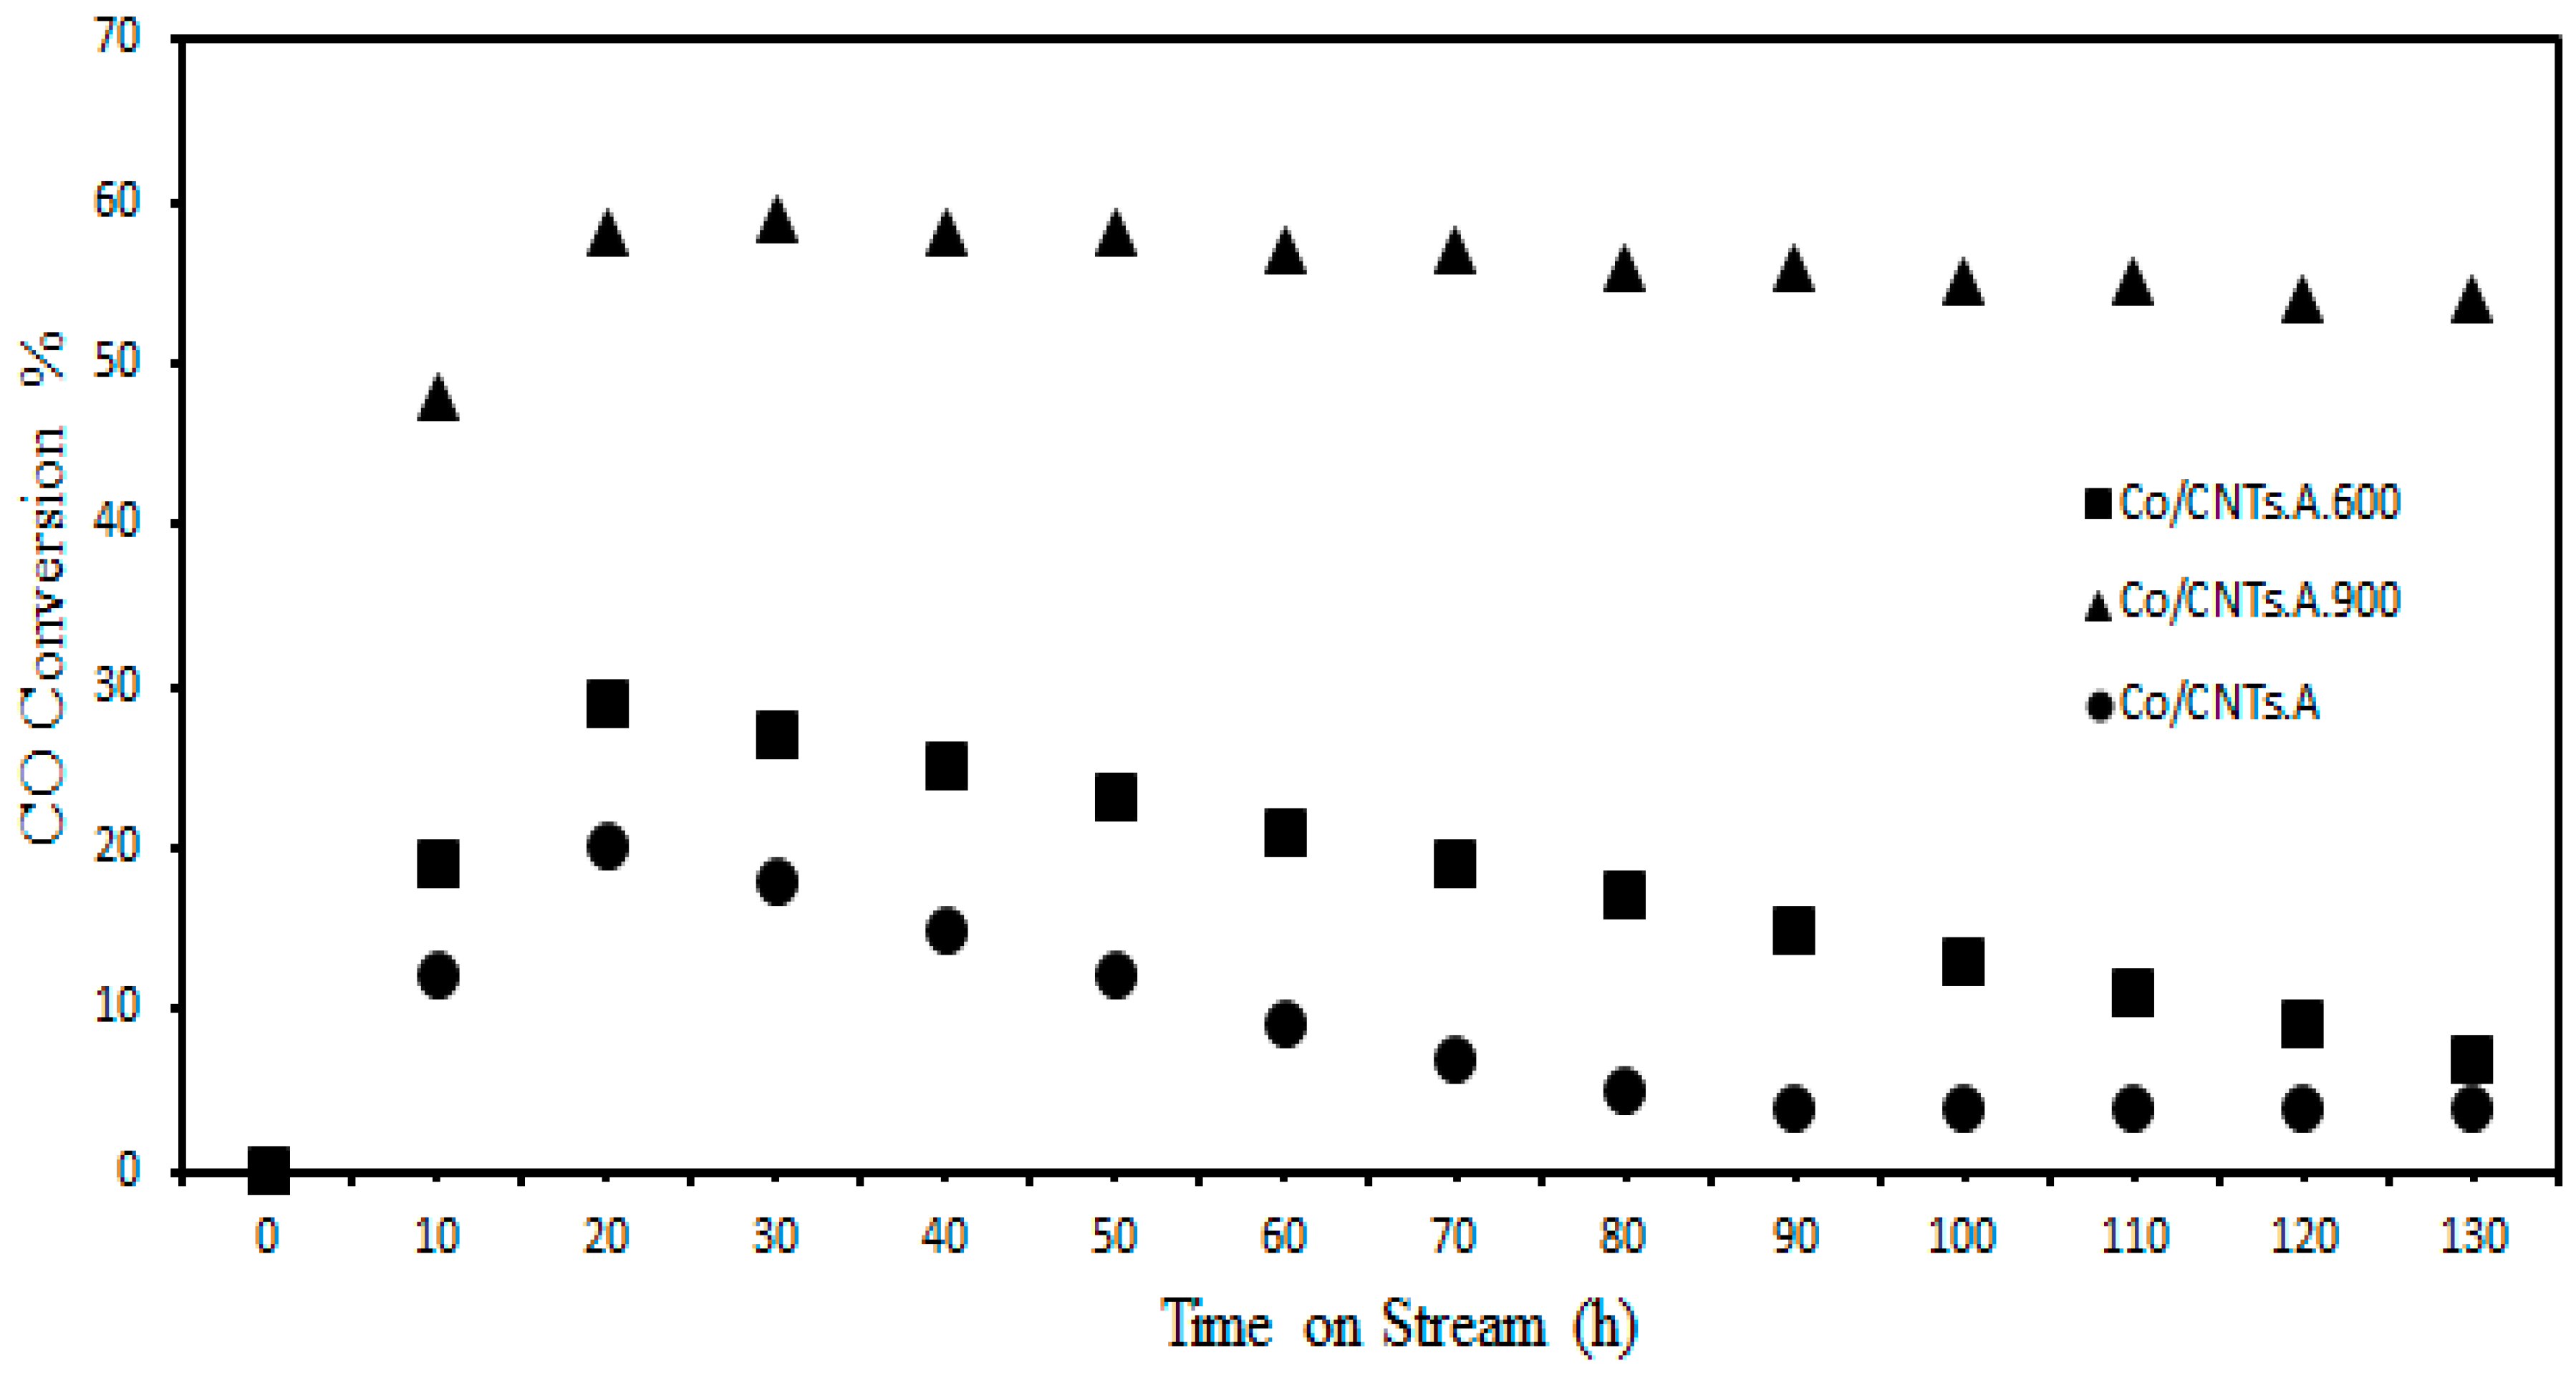
3.8. Stability of FTS Catalysts

Catalyst pre-treated at 900 °C, the conversion of CO and C5+ selectivity were found to be 58.7% and 59.1% respectively (Figure 6) and in contrast were higher than samples pre-treated at 600 °C, where the corresponding values for CO and C5+ selectivity were found to be 28.3% and 33.2%, respectively. After 40 h of time-on- stream, both catalysts showed a decrease in CO conversion. However, Co/CNTs.A.900 catalyst showed higher activity and stability compared to those of Co/CNTs.A.600, during the 130 h of time-on-stream. The superior performance of Co/CNTs.A.900 compared to those prepared on CNTs support which were pre-treated at lower temperatures could be due to better dispersion and reducibility of cobalt-oxide nanoparticles, which were encapsulated in the inner walls of the CNTs.
Figure 7 shows TEM images of the spent catalysts at (a) 600 and (b) 900 °C. The particle size increased from 4.2 to 20.5 nm for the sample treated at 600 °C and it was 7.2 to 14.1 for the treated catalyst samples at 900 °C indicating sintering have taken place [37].
Catalyst deactivation shows that the sintering during FTS was significantly high. The TEM test outcomes showed that the speed of sintering of the active sites on the outer surface of the CNTs is greater than that of the active sites inside the CNTs channels. The bigger sintering rate can be related to the sintering of the active sites positioned in the external surface of the tubes.
As discussed previously majority of the cobalt active sites encapsulated inside the CNTs. Confinement of the reaction medium inside the pores can boost their contact in exposer of cobalt active sites, favoring the expansion of longer hydrocarbon chain [38]. According to studies of other researcher [34], due to electron deficit of the internal surface of the CNTs channels, interaction between cobalt oxides and the support is more powerful, resulting in lower rates of sintering in comparison with the cobalt active sites on the external surface of CNTs [39]. Our results are in agreement with other researchers [34], where the internal surface of the CNTs has an electron shortage and can boost the separation of CO, leading to the synthesis of longer hydrocarbons chain. According to our TEM results (Table 3), the catalyst thermal treated at 900 °C led to more nanoparticles inside the channels thus having a lower deactivation rate [40]. Increasing the percentage of the active sites encapsulated inside the channels to the active sites placed outside of CNTs channels is considered as a key factor for enhancement of C5+ selectivity and lower rate of CH4 [41].
The deposition of cobalt active sites inside the CNTs channels enhance the catalytic performance of the Co/CNTs catalyst, which attributed to the difference in the electron dispersion of the internal and external surface of the CNTs and cobalt particle confinement phenomenon [34]. Due to the electron deficit on the inner surface of the CNTs, the interaction between cobalt oxides and the support is more powerful, resulting in lower potential of sintering in comparison with the catalyst active sites located at the external surface CNTs channels.

4. Conclusions

In this study, Co catalyst was prepared on treated CNTs support using SEA method. The acid and thermal pre-treatment on the CNTs influenced the textural, morphological and physico-chemical properties of the catalyst. Increasing the pre-treatment temperature of CNTs from 600 °C to 900 °C resulted in an increase in the BET surface area from 220 to 221 m2/g. The dispersion of Co on acid-treated CNTs was improved to 29% on the CNTs, which were thermally pre-treated at 900 °C. Increasing the temperature of CNTs pretreatment also resulted in greater fraction of Co nanoparticles deposited in the inner walls of the CNTs. The performance of the Co catalyst supported on CNTs which were thermally treated in different temperatures were tested in FTS reaction. The results illustrated that for Co catalyst deposited on CNTs which were thermally pre-treated at 900 °C, a greater fraction of nanoparticles were found in the inner walls of the CNTs, resulting in enhanced activity and C5+ selectivity compared to those deposited on CNTs which were pre-treated at lower temperatures.

Author Contributions

Conceptualization, O.A.; methodology, O.A.; software, S.A.; validation, Y.A.W.; formal analysis, N.A.H.; investigation, O.A.; resources, M.A.R.; data curation, O.A.; writing—original draft preparation, O.A.; writing—review and editing, Z.M.A.M.; visualization, Z.Z.C.; supervision, M.R.J. and N.A.M.Z.; project administration, E.R.; funding acquisition, M.R.J. and N.A.M.Z.

Funding

Universiti Teknologi PETRONAS, University of Malaya, Nanotechnology and Catalysis Research Centre (NANOCAT RU-2017 Grant) and Ministry of Education, Malaysia under the Fundamental Research Grant Scheme FRGS/1/2012/SG01/UTP/02/01 for financial support.

Acknowledgments

The authors acknowledge the Universiti Teknologi PETRONAS and University of Malaya for support.

Conflicts of Interest

The authors declare no conflict of interest.

References

  1. Dry, M.E. Fischer-Tropsch reactions and the environment. Appl. Catal. A Gen. 1999, 189, 185–190. [Google Scholar] [CrossRef]
  2. Esconjauregui, S.; Whelan, C.M.; Maex, K.J.C. The reasons why metals catalyze the nucleation and growth of carbon nanotubes and other carbon nanomorphologies. Carbon 2009, 47, 659–669. [Google Scholar] [CrossRef]
  3. Takeuchi, K.; Matsuzaki, T.; Hanaoka, T.-A.; Arakawa, H.; Sugi, Y.; Wei, K. Alcohol synthesis from syngas over cobalt catalysts prepared from CO2 (CO) 8. J. Mol. Catal. 1989, 55, 361–370. [Google Scholar] [CrossRef]
  4. Yang, G.; Tsubaki, N.; Shamoto, J.; Yoneyama, Y.; Zhang, Y. Confinement effect and synergistic function of H-ZSM-5/Cu-ZnO-Al2O3 capsule catalyst for one-step controlled synthesis. J. Am. Chem. Soc. 2010, 132, 8129–8136. [Google Scholar] [CrossRef] [PubMed]
  5. Iglesia, E.; Reyes, S.C.; Madon, R.J. Transport-enhanced α-olefin readsorption pathways in Ru-catalyzed hydrocarbon synthesis. J. Catal. 1991, 129, 238–256. [Google Scholar] [CrossRef]
  6. Khodakov, A.Y. Fischer-Tropsch synthesis: Relations between structure of cobalt catalysts and their catalytic performance. Catal. Today 2009, 144, 251–257. [Google Scholar] [CrossRef]
  7. Furimsky, E.; Massoth, F.E. Hydrodenitrogenation of Petroleum. Catal. Rev. 2005, 47, 297–489. [Google Scholar] [CrossRef]
  8. Storsæter, S.; Borg, Ø.; Blekkan, E.A.; Tøtdal, B.; Holmen, A. Fischer-Tropsch synthesis over Re-promoted Co supported on Al2O3, SiO2 and TiO2: Effect of water. Catal. Today 2005, 100, 343–347. [Google Scholar] [CrossRef]
  9. Davis, B.H. Fischer-Tropsch synthesis: Comparison of performances of iron and cobalt catalysts. Ind. Eng. Chem. Res. 2007, 46, 8938–8945. [Google Scholar] [CrossRef]
  10. Tavasoli, A.; Mortazavi, Y.; Khodadadi, A.A.; Mousavian, M.A.; Sadagiani, K.; Karimi, A. Effects of different loadings of Ru and Re on physico-chemical properties and performance of 15% Co/Al2O3 FTS catalysts. Iran. J. Chem. 2005, 24, 9–17. [Google Scholar]
  11. Iglesia, E. Design, synthesis, and use of cobalt-based Fischer-Tropsch synthesis catalysts. Appl. Catal. A Gen. 1997, 161, 59–78. [Google Scholar] [CrossRef]
  12. Khodakov, A.Y.; Chu, W.; Fongarland, P. Advances in the development of novel cobalt Fischer-Tropsch catalysts for synthesis of long-chain hydrocarbons and clean fuels. Chem. Rev. 2007, 107, 1692–1744. [Google Scholar] [CrossRef] [PubMed]
  13. Van Berge, P.J.; van de Loosdrecht, J.; Barradas, S.; van der Kraan, A. Oxidation of cobalt based Fischer–Tropsch catalysts as a deactivation mechanism. Catal. Today 2000, 58, 321–334. [Google Scholar] [CrossRef]
  14. Jacobs, G.; Das, T.K.; Zhang, Y.; Li, J.; Racoillet, G.; Davis, B.H. Fischer-Tropsch synthesis: Support, loading, and promoter effects on the reducibility of cobalt catalysts. Appl. Catal. A Gen. 2002, 233, 263–281. [Google Scholar] [CrossRef]
  15. Den Breejen, J.P.; Radstake, P.B.; Bezemer, G.L.; Bitter, J.H.; Frøseth, V.; Holmen, A.; Jong, K.D. On the origin of the cobalt particle size effects in Fischer-Tropsch catalysis. J. Am. Chem. Soc. 2009, 131, 7197–7203. [Google Scholar] [CrossRef] [PubMed]
  16. Sun, X.; Li, Y. Ga2O3 and GaN semiconductor hollow spheres. Angew. Chem. Int. Ed. 2004, 43, 3827–3831. [Google Scholar] [CrossRef] [PubMed]
  17. Xing, C.; Yang, G.; Wang, D.; Zeng, C.; Jin, Y.; Yang, R.; Suehiro, Y.; Tsubaki, N. Controllable encapsulation of cobalt clusters inside carbon nanotubes as effective catalysts for Fischer-Tropsch synthesis. Catal. Today 2013, 215, 24–28. [Google Scholar] [CrossRef]
  18. Bitter, J.H.; de Jong, K.P. Preparation of carbon-supported metal catalysts. In Carbon Materials for Catalysis; John Wiley & Sons: Hoboken, NJ, USA, 2009; pp. 157–176. [Google Scholar]
  19. Yahya, N. Carbon and Oxide Nanostructures; Springer: Berlin, Germany, 2010. [Google Scholar]
  20. Zhang, D.; Fu, H.; Shi, L.; Fang, J.; Li, Q. Carbon nanotube assisted synthesis of CeO2 nanotubes. J. Solid State Chem. 2007, 180, 654–660. [Google Scholar] [CrossRef]
  21. Novoselov, K.S.; Geim, A.K.; Morozov, S.; Jiang, D.; Katsnelson, M.; Grigorieva, I.; Dubonos, S.; Firsov, A.A. Two-dimensional gas of massless Dirac fermions in graphene. Nature 2005, 438, 197–200. [Google Scholar] [CrossRef] [PubMed] [Green Version]
  22. Zolfaghari, Z.; Tavasoli, A.; Tabyar, S.; Pour, A.N. Enhancement of bimetallic Fe-Mn/CNTs nano catalyst activity and product selectivity using microemulsion technique. J. Energy Chem. 2014, 23, 57–65. [Google Scholar] [CrossRef]
  23. Tavasoli, A.; Taghavi, S. Performance enhancement of bimetallic Co-Ru/CNTs nano catalysts using microemulsion technique. J. Energy Chem. 2013, 22, 747–754. [Google Scholar] [CrossRef]
  24. Tavasoli, A.; Trépanier, M.; Abbaslou, R.M.M.; Dalai, A.K.; Abatzoglou, N. Fischer-Tropsch synthesis on mono-and bimetallic Co and Fe catalysts supported on carbon nanotubes. Fuel Process. Technol. 2009, 90, 1486–1494. [Google Scholar] [CrossRef]
  25. Dresselhaus, M.S.; Dresselhaus, G.; Saito, R.; Jorio, A. Raman spectroscopy of carbon nanotubes. Phys. Rep. 2005, 409, 47–99. [Google Scholar] [CrossRef]
  26. Dresselhaus, M.S.; Jorio, A.; Hofmann, M.; Dresselhaus, G.; Saito, R. Perspectives on carbon nanotubes and graphene Raman spectroscopy. Nano Lett. 2010, 10, 751–758. [Google Scholar] [CrossRef] [PubMed]
  27. Trépanier, M.; Tavasoli, A.; Dalai, A.K.; Abatzoglou, N. Fischer-Tropsch synthesis over carbon nanotubes supported cobalt catalysts in a fixed bed reactor: Influence of acid treatment. Fuel Process. Technol. 2009, 90, 367–374. [Google Scholar] [CrossRef]
  28. Abbaslou, R.M.M.; Tavassoli, A.; Soltan, J.; Dalai, A.K. Iron catalysts supported on carbon nanotubes for Fischer–Tropsch synthesis: Effect of catalytic site position. Appl. Catal. A Gen. 2009, 367, 47–52. [Google Scholar] [CrossRef]
  29. Van Steen, E.; Prinsloo, F.F. Comparison of preparation methods for carbon nanotubes supported iron Fischer-Tropsch catalysts. Catal. Today 2002, 71, 327–334. [Google Scholar] [CrossRef]
  30. Chen, W.; Fan, Z.; Pan, X.; Bao, X. Effect of confinement in carbon nanotubes on the activity of Fischer–Tropsch iron catalyst. J. Am. Chem. Soc. 2008, 130, 9414–9419. [Google Scholar] [CrossRef] [PubMed]
  31. Behler, K.; Osswald, S.; Ye, H.; Dimovski, S.; Gogotsi, Y. Effect of thermal treatment on the structure of multi-walled carbon nanotubes. J. Nanopart. Res. 2006, 8, 615–625. [Google Scholar] [CrossRef]
  32. Chizari, K.; Janowska, I.; Houllé, M.; Florea, I.; Ersen, O.; Romero, T.; Bernhardt, P.; Ledoux, M.J.; Pham-Huu, C. Tuning of nitrogen-doped carbon nanotubes as catalyst support for liquid-phase reaction. Appl. Catal. A Gen. 2010, 380, 72–80. [Google Scholar] [CrossRef]
  33. Eschemann, T.O.; Lamme, W.S.; Manchester, R.L.; Parmentier, T.E.; Cognigni, A.; Rønning, M.; de Jong, K.P. Effect of support surface treatment on the synthesis, structure, and performance of Co/CNT Fischer-Tropsch catalysts. J. Catal. 2015, 328, 130–138. [Google Scholar] [CrossRef]
  34. Tavasoli, A.; Trépanier, M.; Dalai, A.K.; Abatzoglou, N. Effects of confinement in carbon nanotubes on the activity, selectivity, and lifetime of Fischer-Tropsch Co/carbon nanotube catalysts. J. Chem. Eng. Data 2010, 55, 2757–2763. [Google Scholar] [CrossRef]
  35. Trépanier, M.; Tavasoli, A.; Dalai, A.K.; Abatzoglou, N. Co, Ru and K loadings effects on the activity and selectivity of carbon nanotubes supported cobalt catalyst in Fischer-Tropsch synthesis. Appl. Catal. A Gen. 2009, 353, 193–202. [Google Scholar] [CrossRef]
  36. Schwarz, J. The adsorption/impregnation of catalytic precursors on pure and composite oxides. Catal. Today 1992, 15, 395–405. [Google Scholar] [CrossRef]
  37. Bezemer, G.L.; Bitter, J.H.; Kuipers, H.P.; Oosterbeek, H.; Holewijn, J.E.; Xu, X.; Kapteijn, F.; van Dillen, A.J.; de Jong, K.P. Cobalt particle size effects in the Fischer-Tropsch reaction studied with carbon nanofiber supported catalysts. J. Am. Chem. Soc. 2006, 128, 3956–3964. [Google Scholar] [CrossRef] [PubMed]
  38. Nguyen, T.T.; Serp, P. Confinement of metal nanoparticles in carbon nanotubes. ChemCatChem 2013, 5, 3595–3603. [Google Scholar] [CrossRef]
  39. Wang, D.; Yang, G.P.; Ma, Q.; Wu, M.; Tan, Y.; Yoneyama, Y.; Tsubaki, N. Confinement effect of carbon nanotubes: Copper nanoparticles filled carbon nanotubes for hydrogenation of methyl acetate. ACS Catal. 2012, 2, 1958–1966. [Google Scholar] [CrossRef]
  40. Pan, X.; Bao, X. The effects of confinement inside carbon nanotubes on catalysis. Acc. Chem. Res. 2011, 44, 553–562. [Google Scholar] [CrossRef] [PubMed]
  41. Xiao, J.; Pan, X.; Guo, S.; Ren, P.; Bao, X. Toward fundamentals of confined catalysis in carbon nanotubes. J. Am. Chem. Soc. 2014, 137, 477–482. [Google Scholar] [CrossRef] [PubMed]
Figure 1. Raman spectra of (a) as-received CNTs, (b) CNTs.A, (c) CNTs.A.600, (d) CNTs.A.700, (e) CNTs.A.800, (f) CNTs.A.900 °C.
Symmetry 10 00572 g001
Figure 2. FTIR spectra of (a) as-received CNTs (b) Acid and thermal treated CNTs at 900 °C (c) Acid and thermal treated CNTs at 600 °C (d) acid and thermal treated at 900 °C Co/CNTs (e) Acid and thermal treated at 600 °C Co/CNTs (f) Acid treated Co/as-received CNTs.
Symmetry 10 00572 g002
Figure 3. XRD spectrum of the (a) as-received CNTs (b) acid treated CNTs (c) thermal treated Co/CNTs at 600 °C (d) thermal treated Co/CNTs at 900 °C.
Symmetry 10 00572 g003
Figure 4. TEM images and particle size distribution with inset and d spacing measuring of Co on CNTs with (a) only acid treated (b) thermal treated at 600 °C (c) 700 °C (d) 800 °C and (e) 900 °C.
Symmetry 10 00572 g004aSymmetry 10 00572 g004b
Figure 5. TPR profiles of (a), MWCNTs after HNO3 refluxing treatment and Co/CNTs catalysts at (b) 600 °C (c), 700 °C (d), 800 °C (e), 900 °C thermal treatment.
Symmetry 10 00572 g005
Figure 6. Time-on-stream (TOS) at 240 °C, 2 MPa and H2/CO = 2.
Symmetry 10 00572 g006
Figure 7. TEM image of spent catalyst after FTS with thermal treatment (a) 600 °C (b) 900 °C.
Symmetry 10 00572 g007
Table 1. Textural properties of the samples.
Sample IDBET Surface Area (m2·g−1)Total Pore Volume (cm3·g−1)VMicro (cm3/g)VMeso (cm3/g)
as-received CNTs138.21.580.081.50
CNTs.A223.20.880.120.76
CNTs.A.600250.60.810.150.65
CNTs.A.700256.70.720.160.56
CNTs.A.800259.30.630.180.45
CNTs.A.900266.40.540.190.35
Co/CNTs.A198.50.550.060.49
Co/CNTs.A.600207.80.500.050.45
Co/CNTs.A.700209.80.480.040.44
Co/CNTs.A.800214.60.450.030.42
Co/CNTs.A.900221.40.410.020.39
Table 2. Intensity ratios ID/IG for acid treated samples in different thermal treatment temperature.
SamplesIDIGID/IG
as-received CNTs1358.991593.200.853
CNTs.A1389.491591.630.873
CNTs.A.6001431.911596.340.897
CNTs.A.7001462.991588.490.921
CNTs.A.8001494.171596.340.936
CNTs.A.9001497.721591.630.941
Table 3. Average particle size and its distribution on the CNTs.
SampleInner Particles (%)Outer Particles (%)Average Particle Size a (nm)Average Particle Size b dCo3O4 (nm)
Co/CNTs.A10905.15 ± 0.2
Co/CNTs.A.60031694.24 ± 0.2
Co/CNTs.A.70043575.35 ± 0.2
Co/CNTs.A.80062386.16 ± 0.2
Co/CNTs.A.90070307.27 ± 0.2
a Determined from TEM. b Determined from XRD.
Table 4. Dispersion, reducibility and chemisorption properties of 10% Co/CNTs catalyst.
CatalystsReduction (%)Dispersion (%)No. of Active Sites (×1020)
Co/CNTs.A38.48.73.8
Co/CNTs.A.60048.820.94.5
Co/CNTs.A.70055.224.54.9
Co/CNTs.A.80063.826.45.4
Co/CNTs.A.90068.129.15.8
Table 5. Effect of CNTs pre-treatment conditions on CO conversion and product selectivity (%).
CatalystCO ConversionCH4C2–C4C5+
Co/CNTs.A16.418.612.318.9
Co/CNTs.A.60028.315.211.533.2
Co/CNTs.A.70037.512.710.738.8
Co/CNTs.A.80050.911.38.454.6
Co/CNTs.A.90058.79.56.859.1
FTS Reaction conditions: T = 240 °C, P = 2.0 MPa, H2/CO = 2/1, W/F = 10 g h/mol.
Table 6. Effect of reaction temperature on activity and products selectivity.
Reaction T (°C)CO Conversion (%)Product Selectivity (%)
CH4C2–C4CO2C5+
22025.37.64.41.657.7
24058.79.55.610.459.1
26070.110.17.113.247.6
28075.410.88.214.641.2
FTS Reaction conditions: W/F = 10 g h/mol, P = 2.0 MPa, H2/CO = 2/1, catalyst: Co/CNTs-900.

