In-Depth Comparison of Lysine-Based Antibody-Drug Conjugates Prepared on Solid Support Versus in Solution

 ,
,
Abstract
:
1. Introduction
2. Results
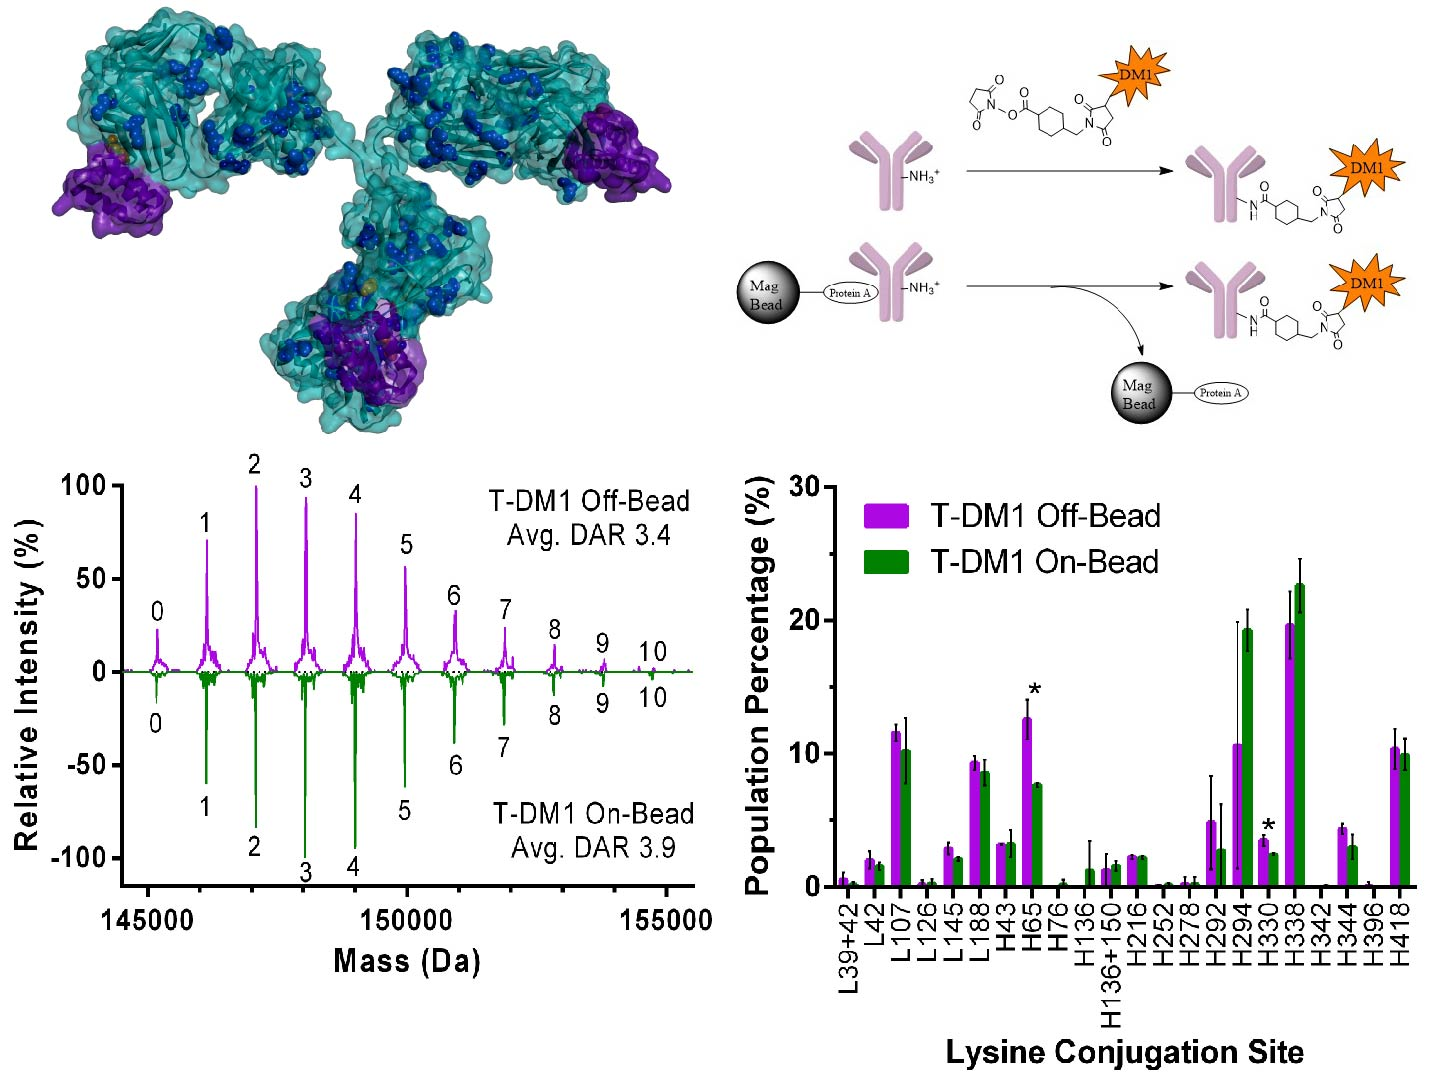
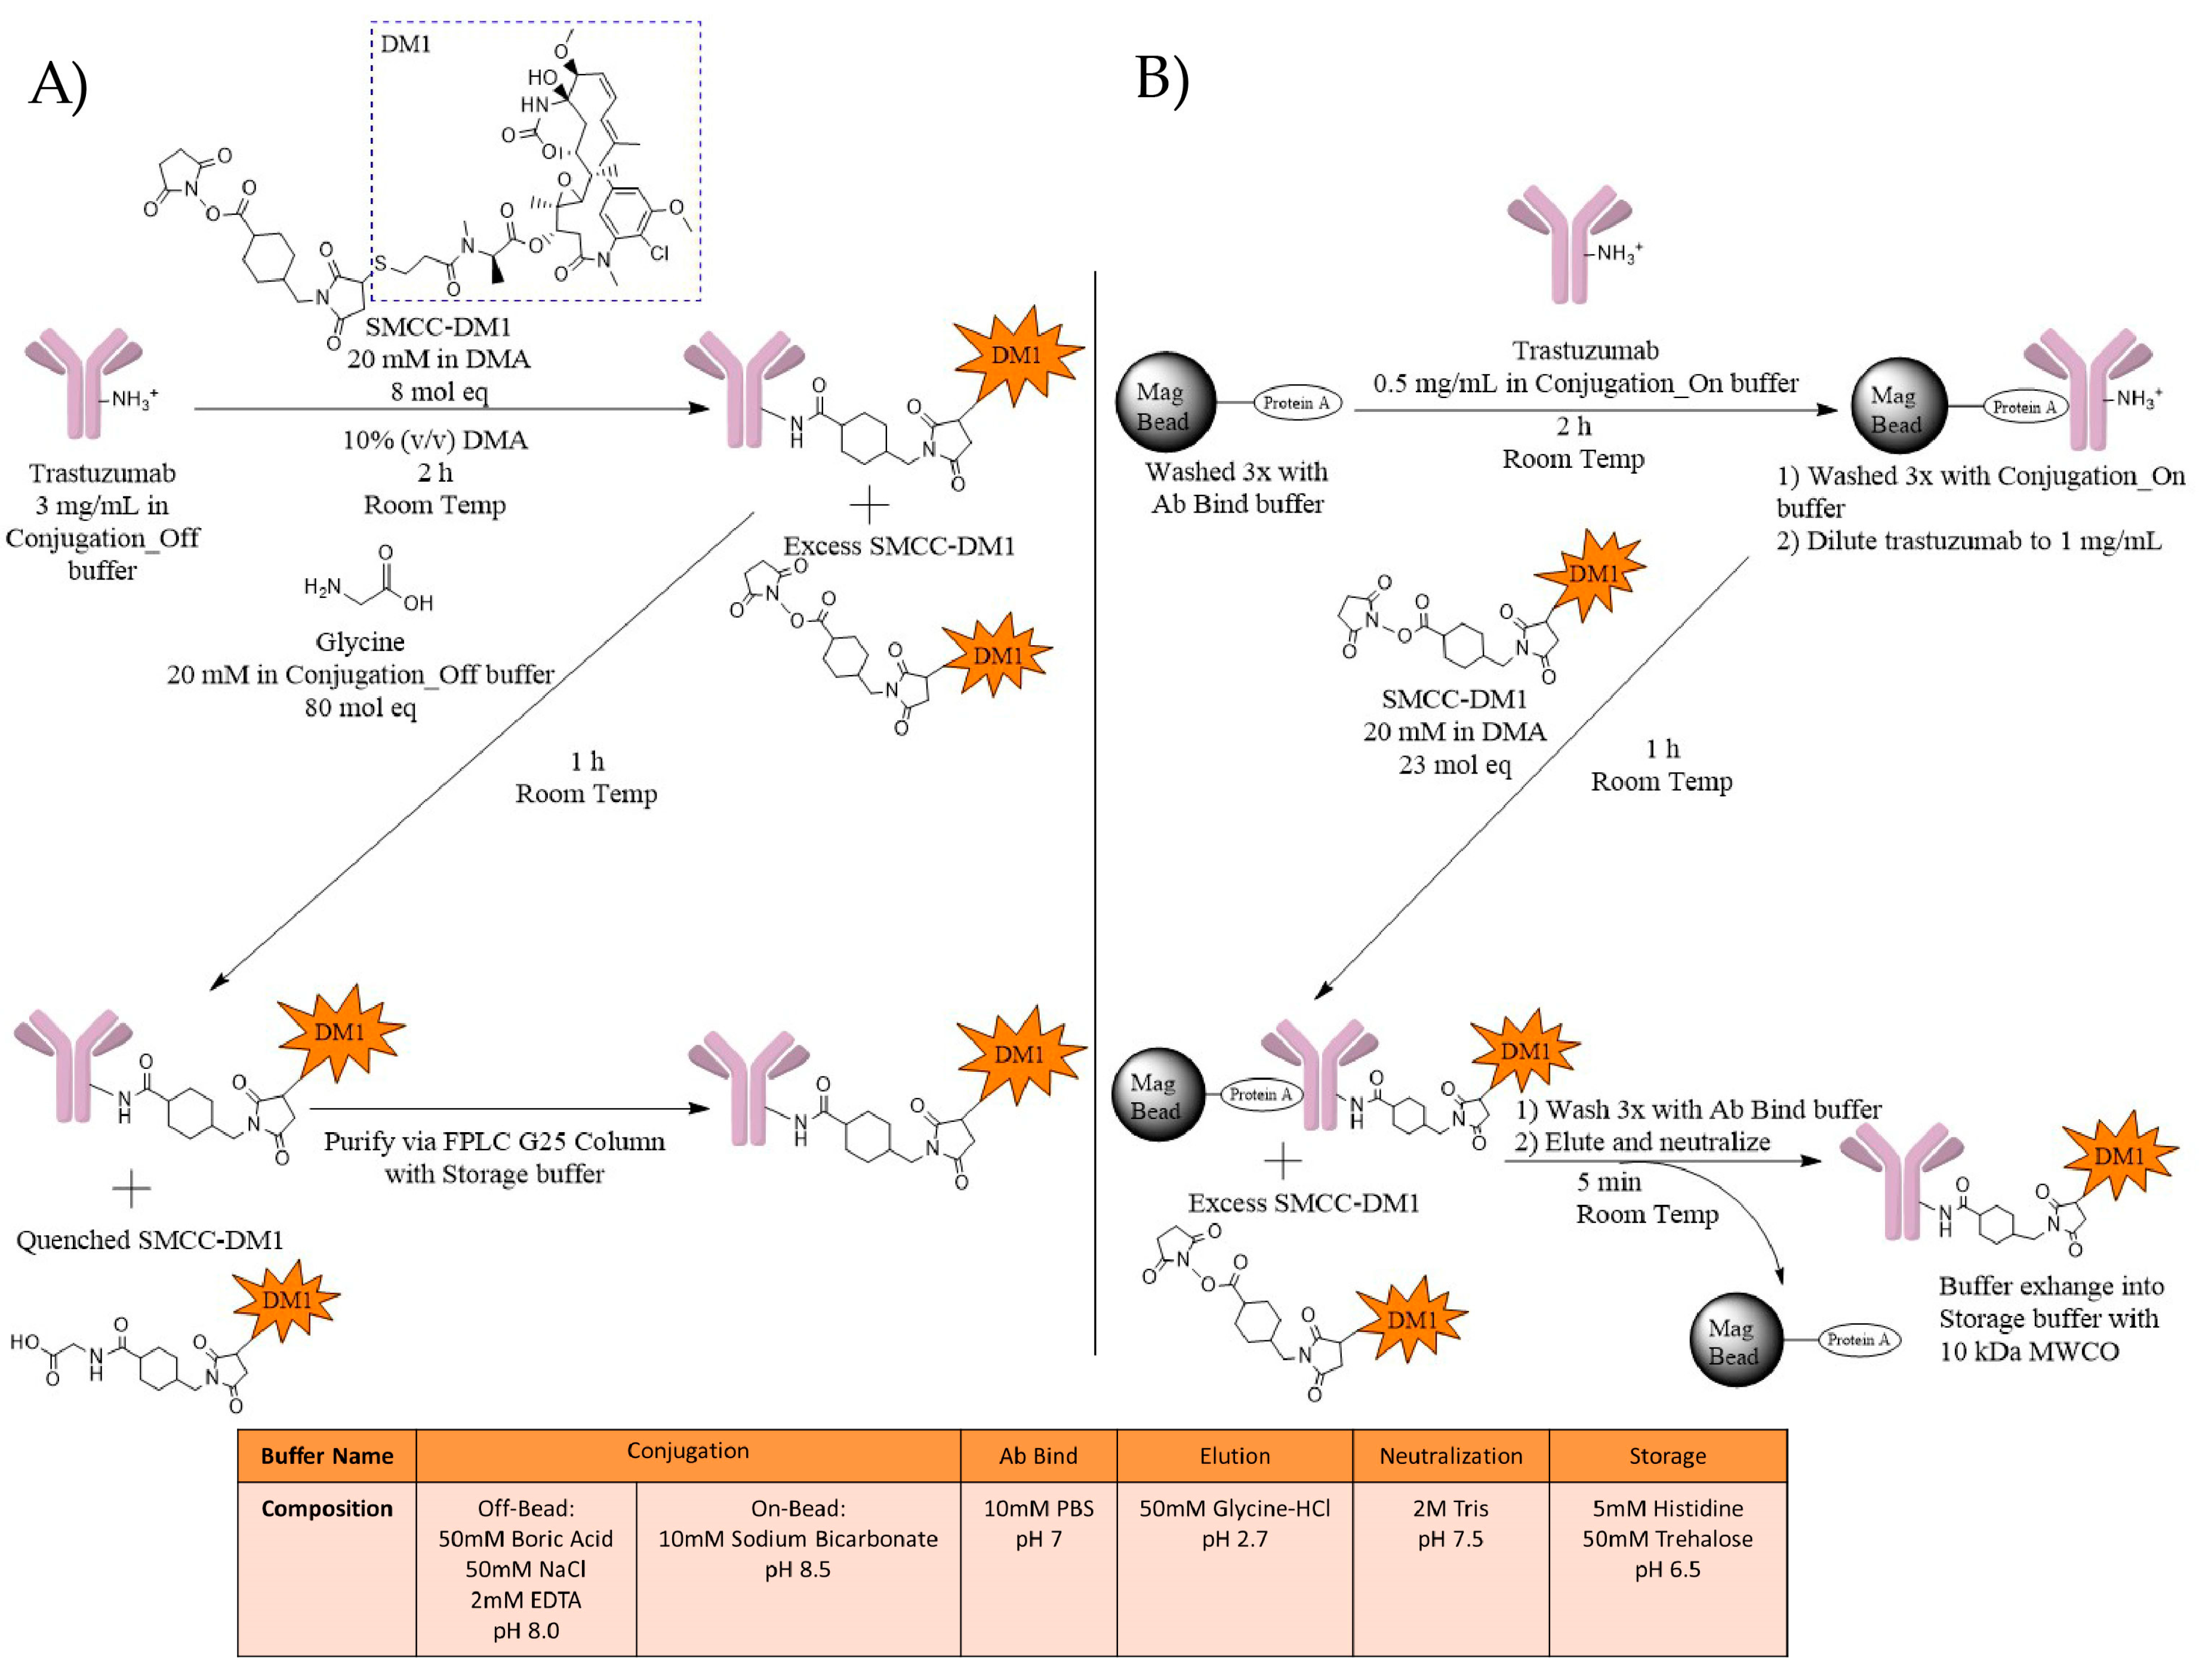
2.1. ADC Synthesis
2.2. Mass Spectrometry (MS)
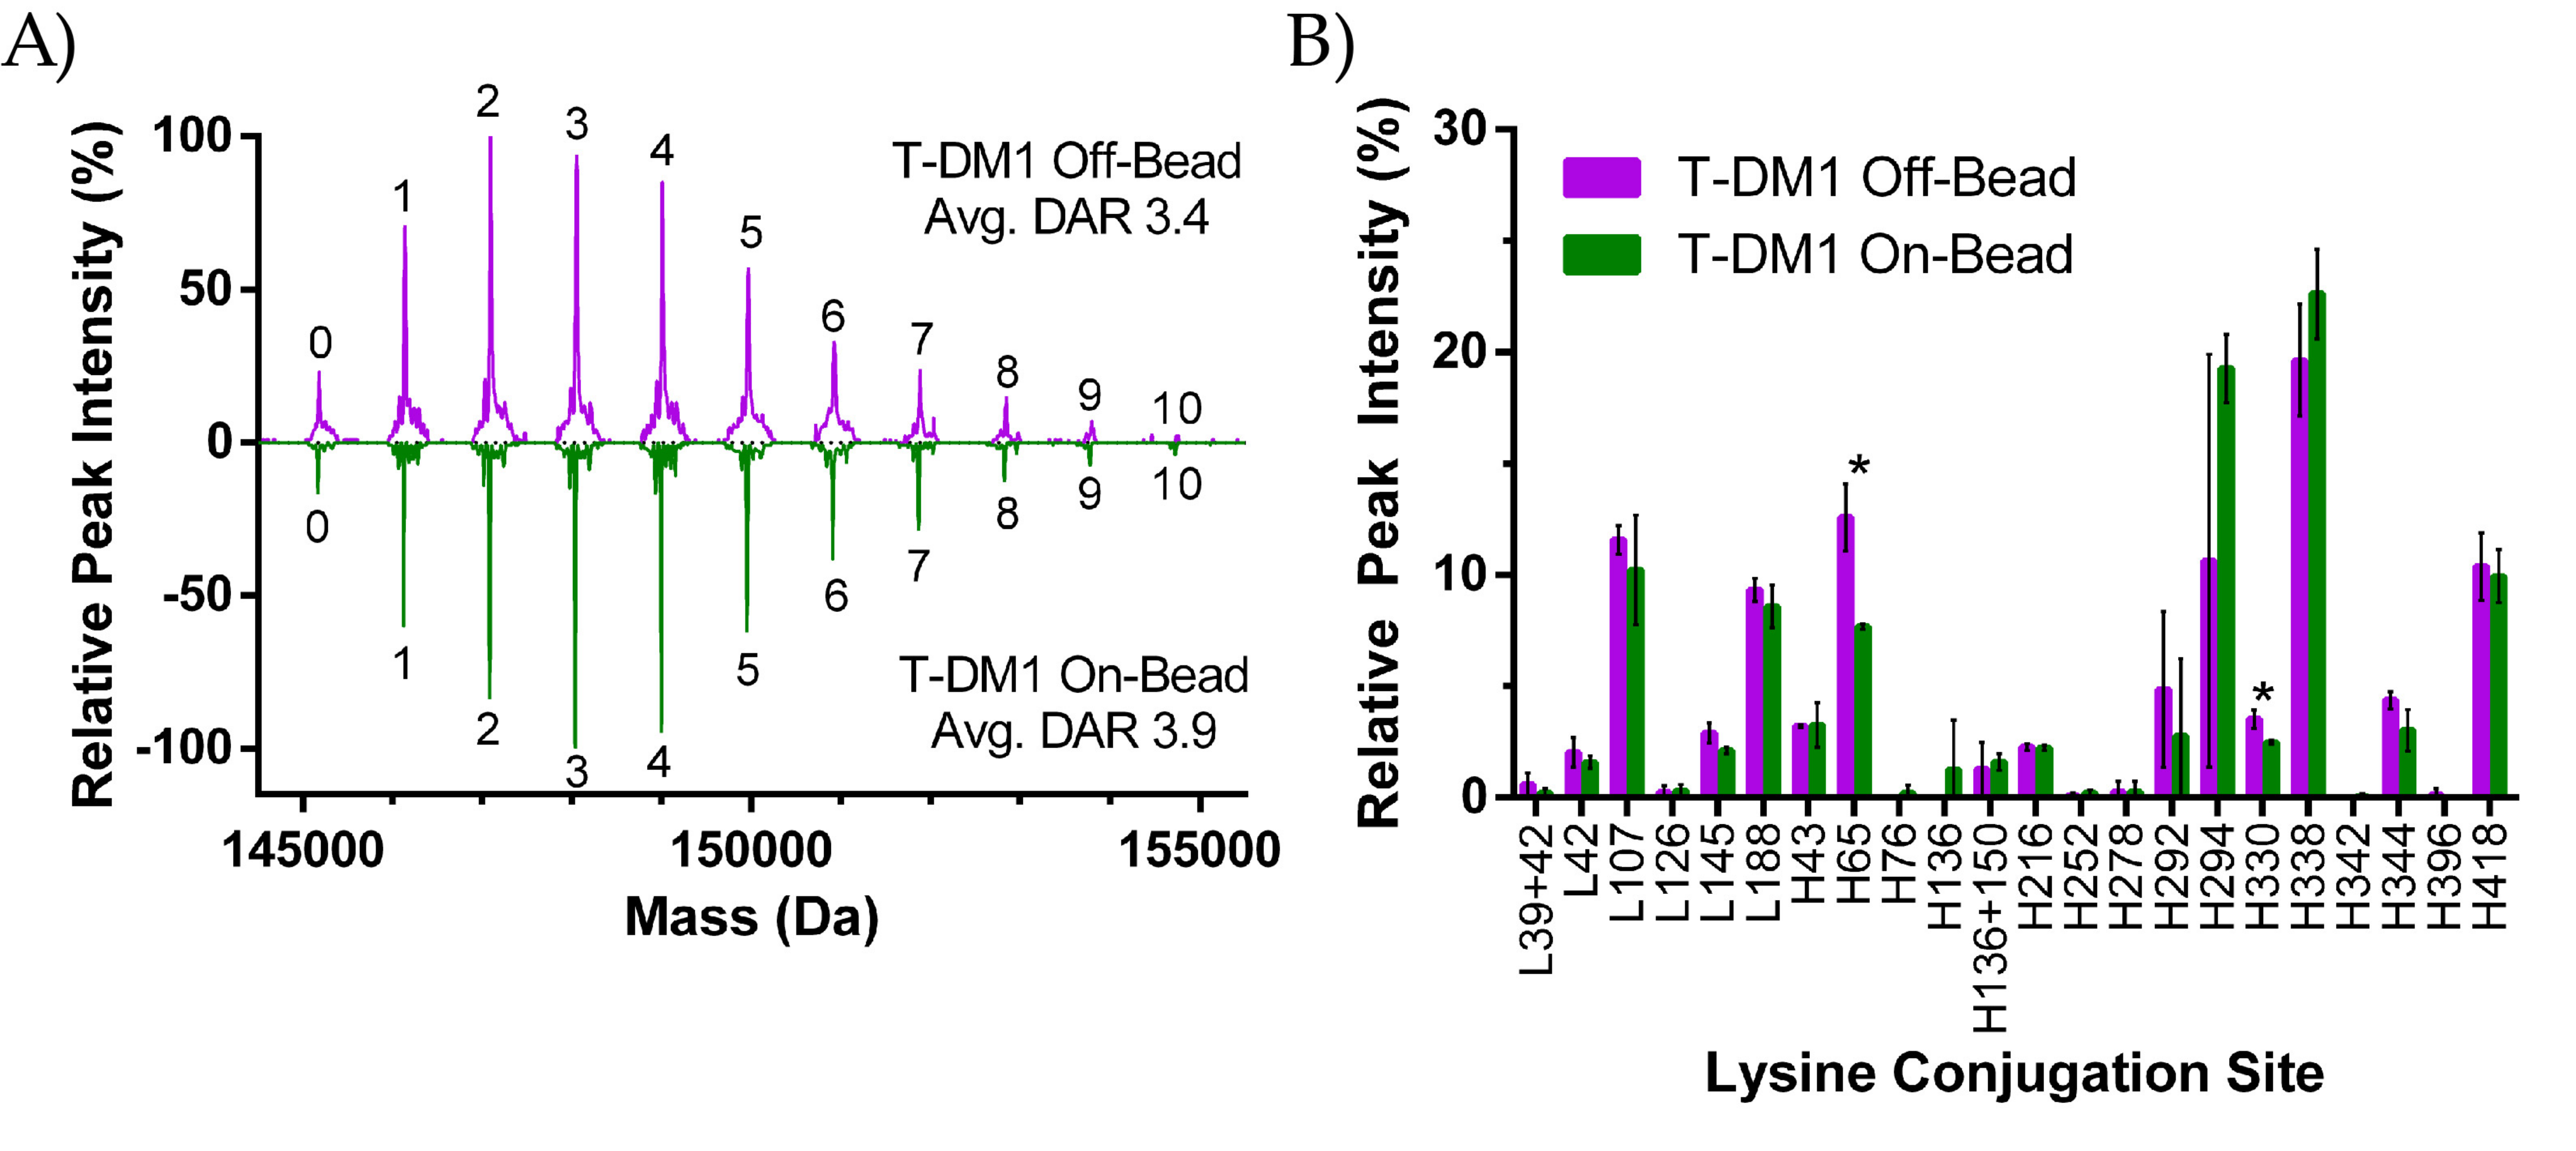
2.2.1. DAR Analysis
2.2.2. Peptide Mapping
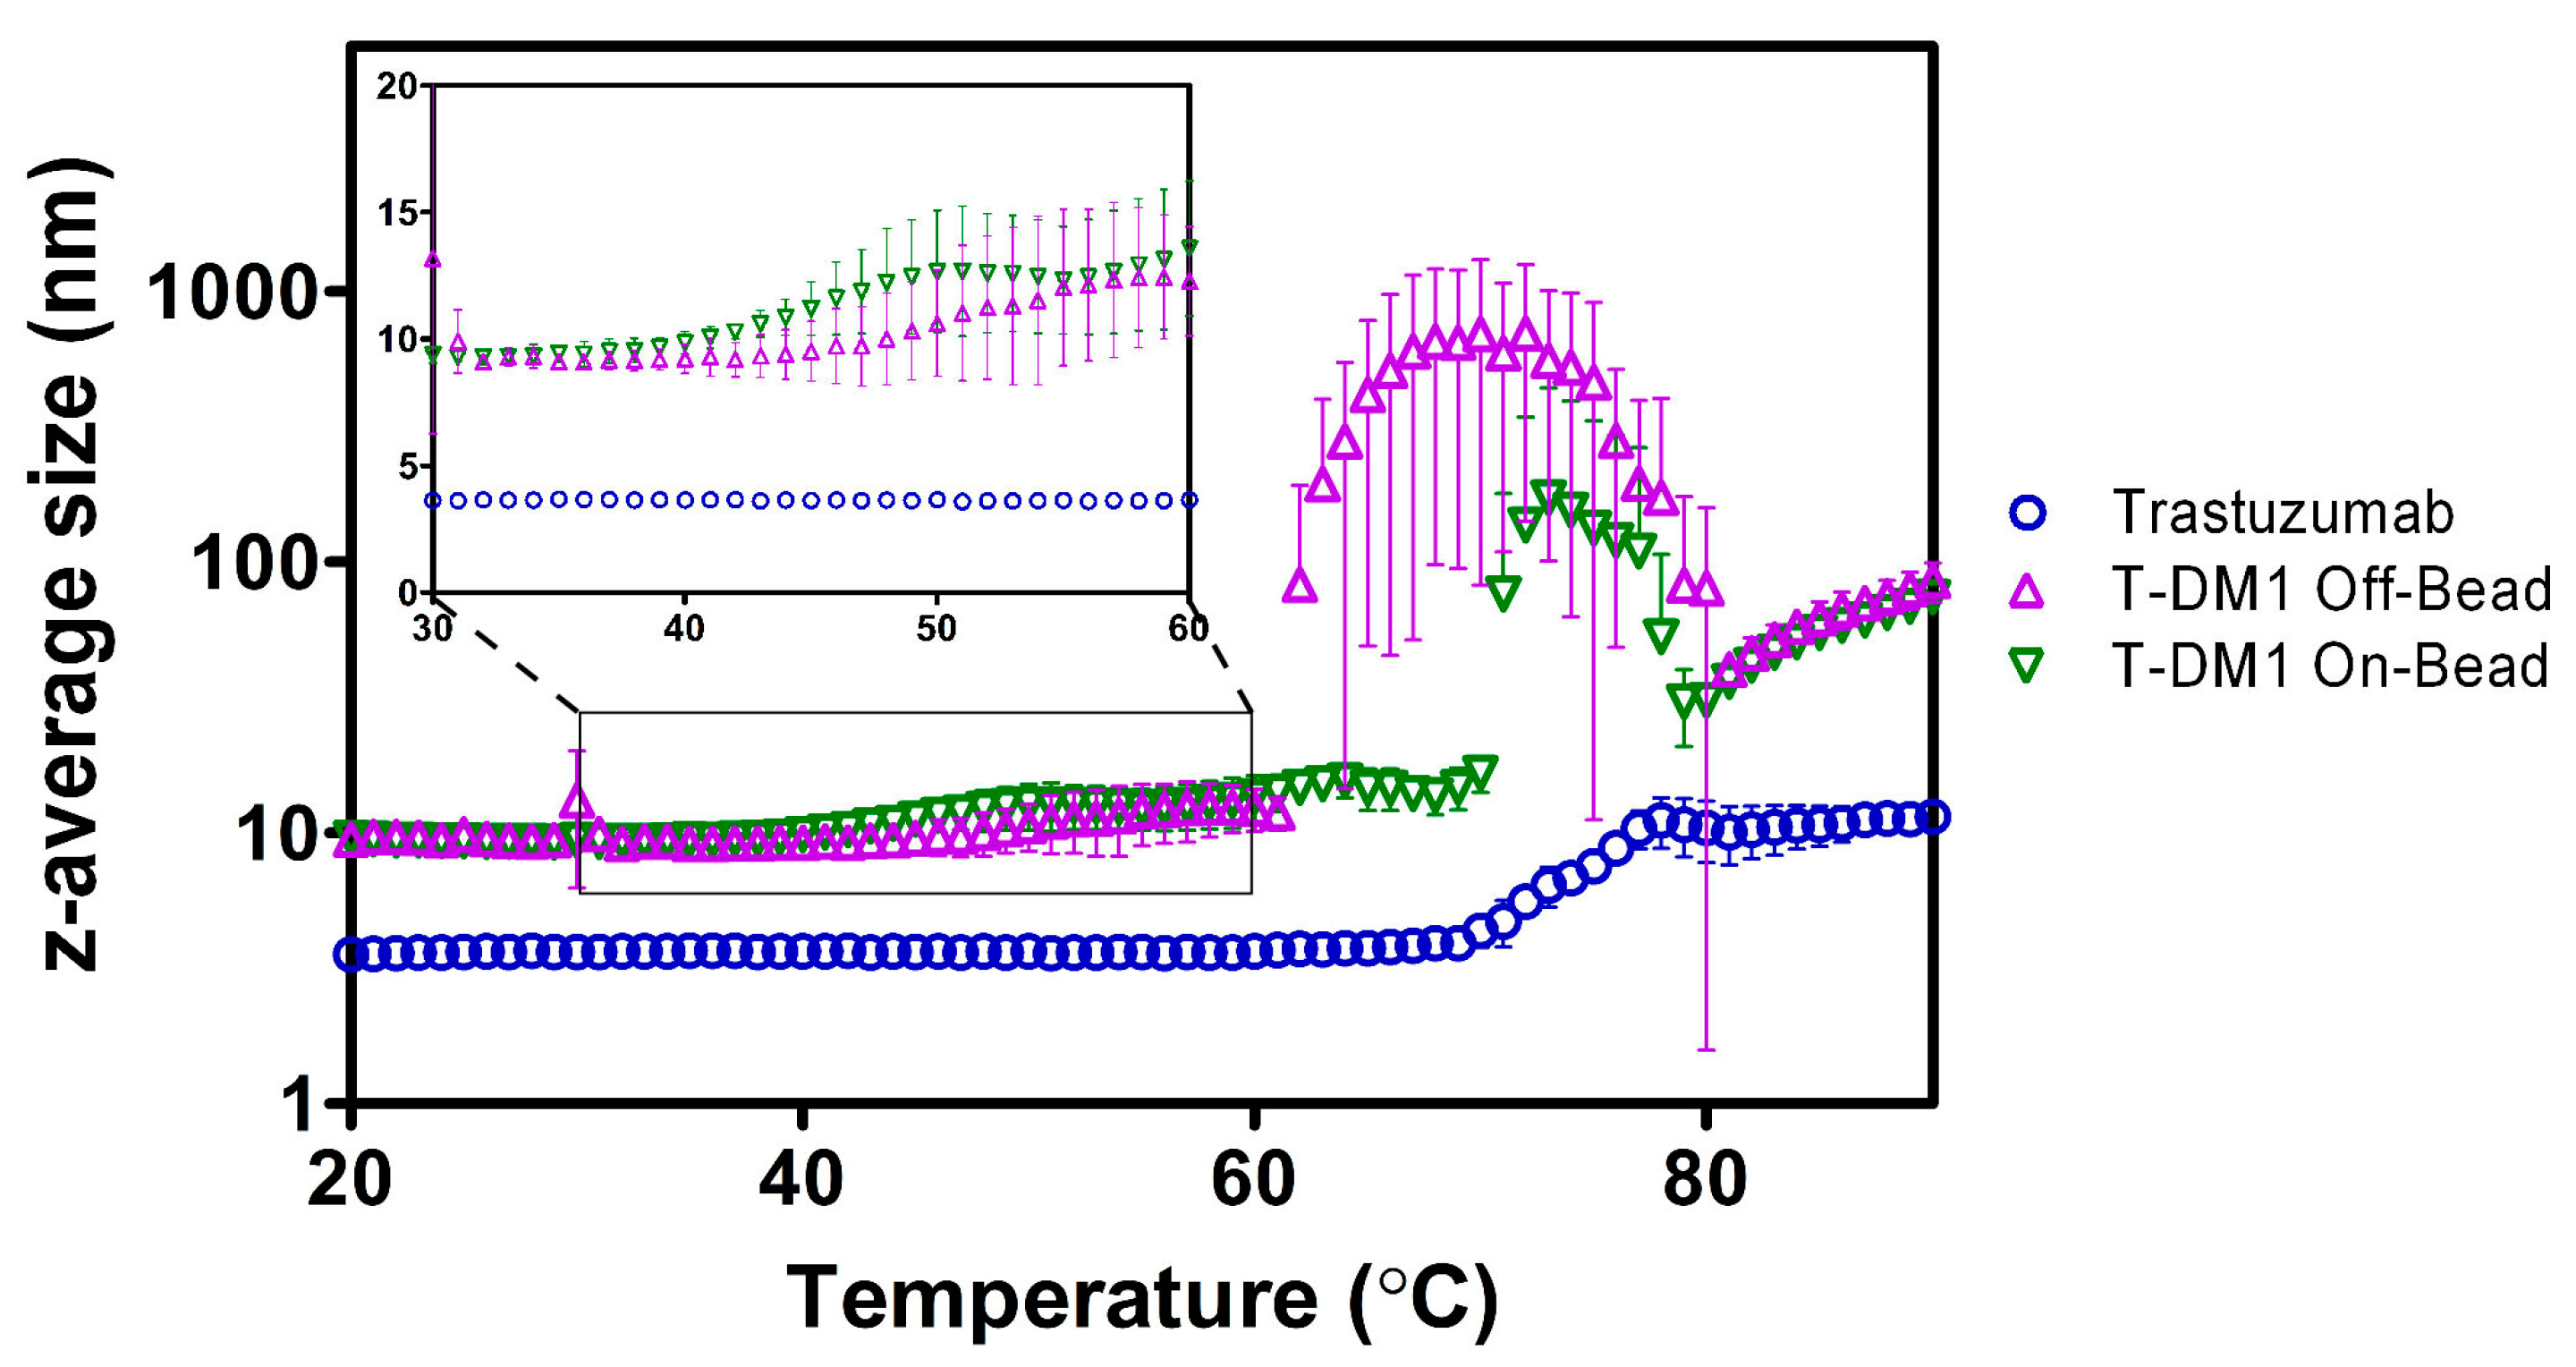
2.3. Dynamic Light Scattering (DLS)
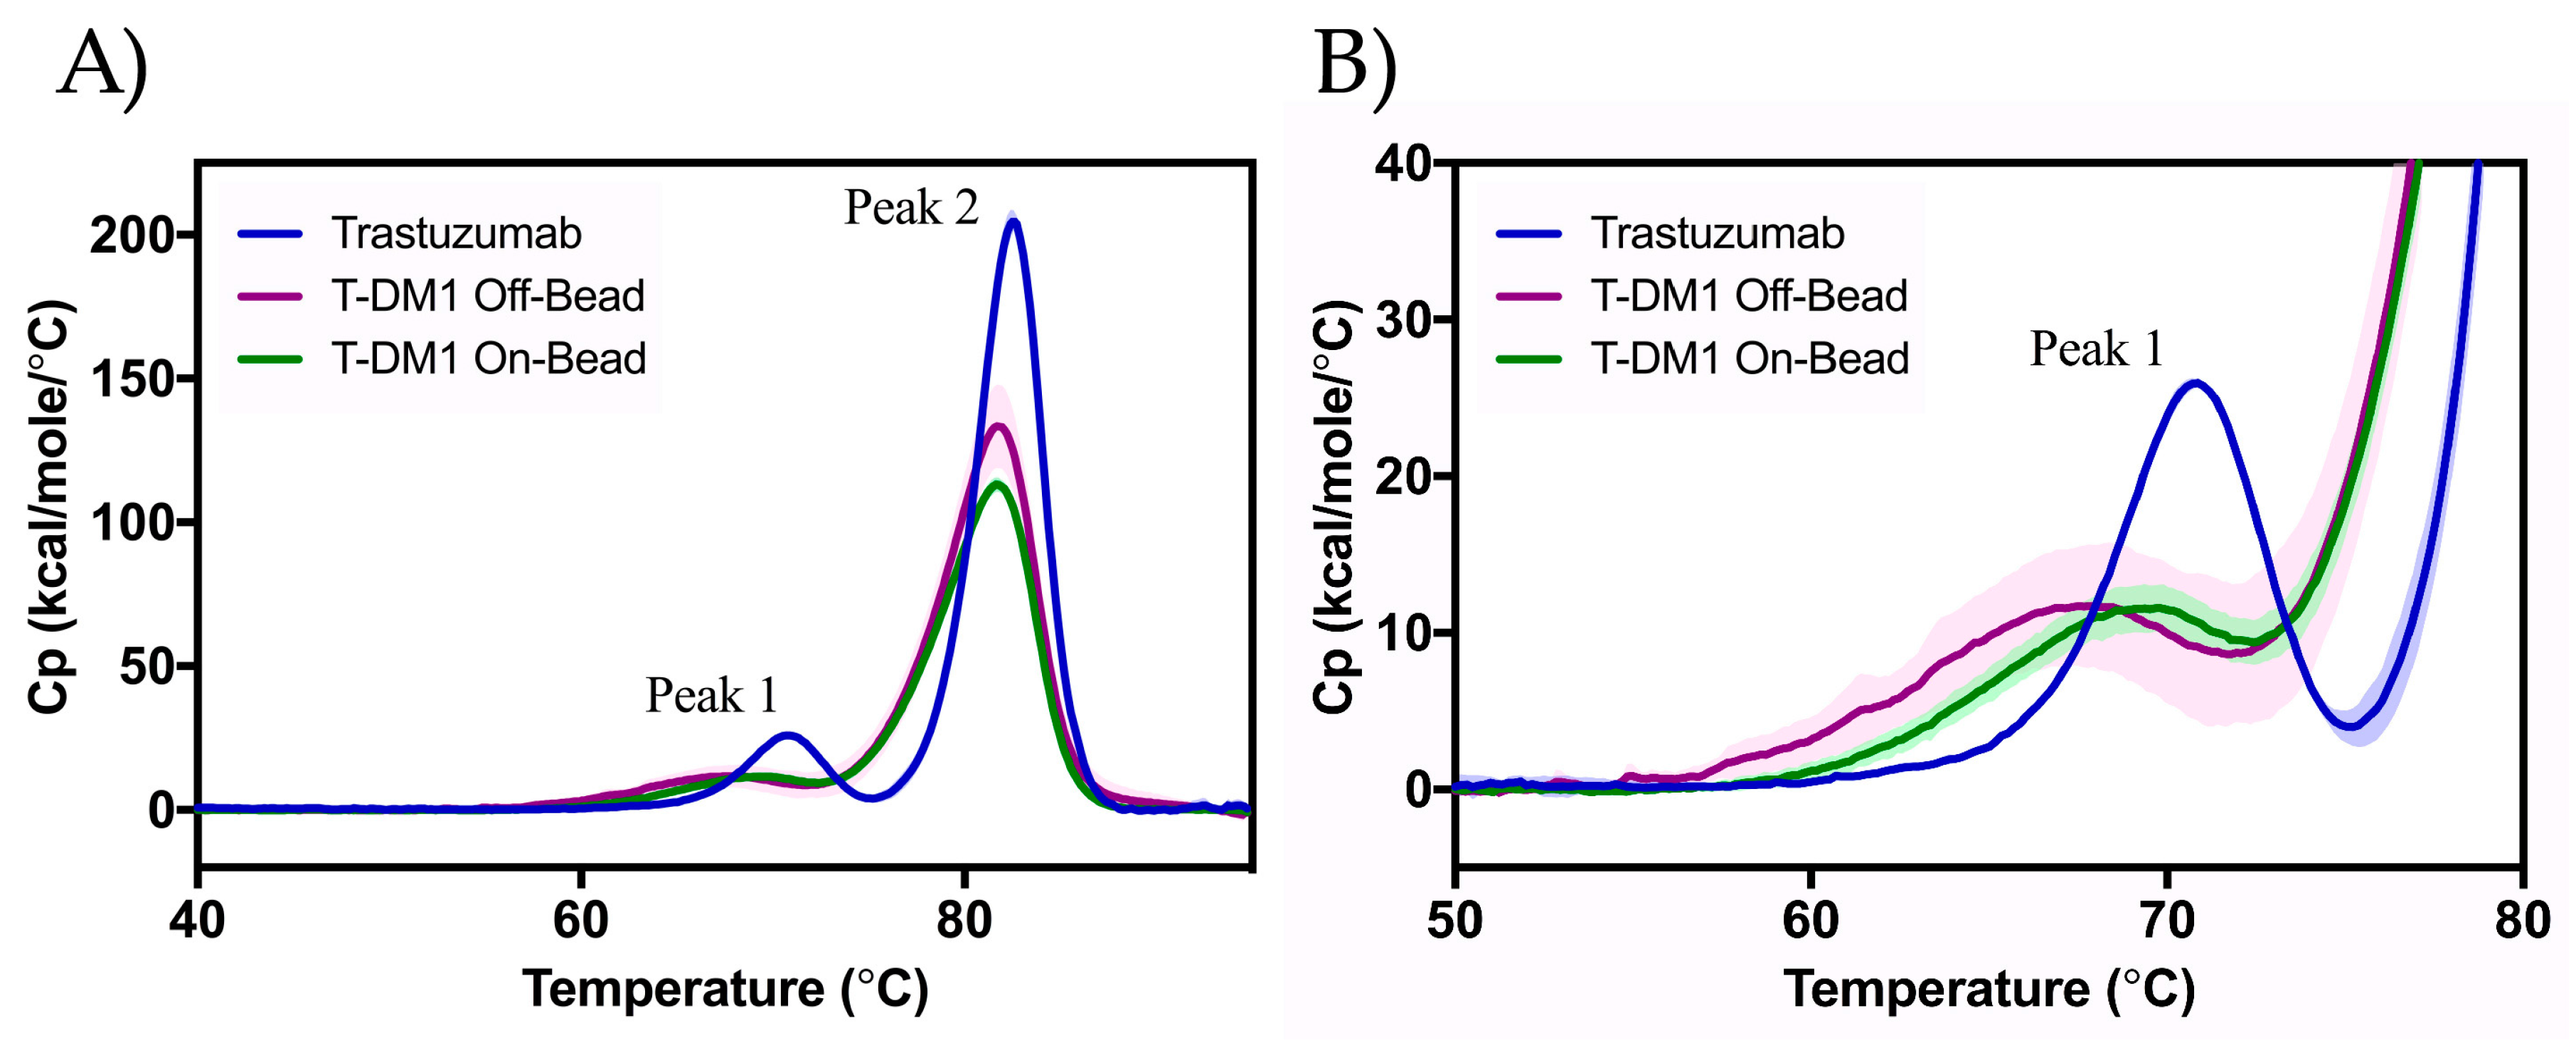
2.4. Differential Scanning Calorimetry (DSC)
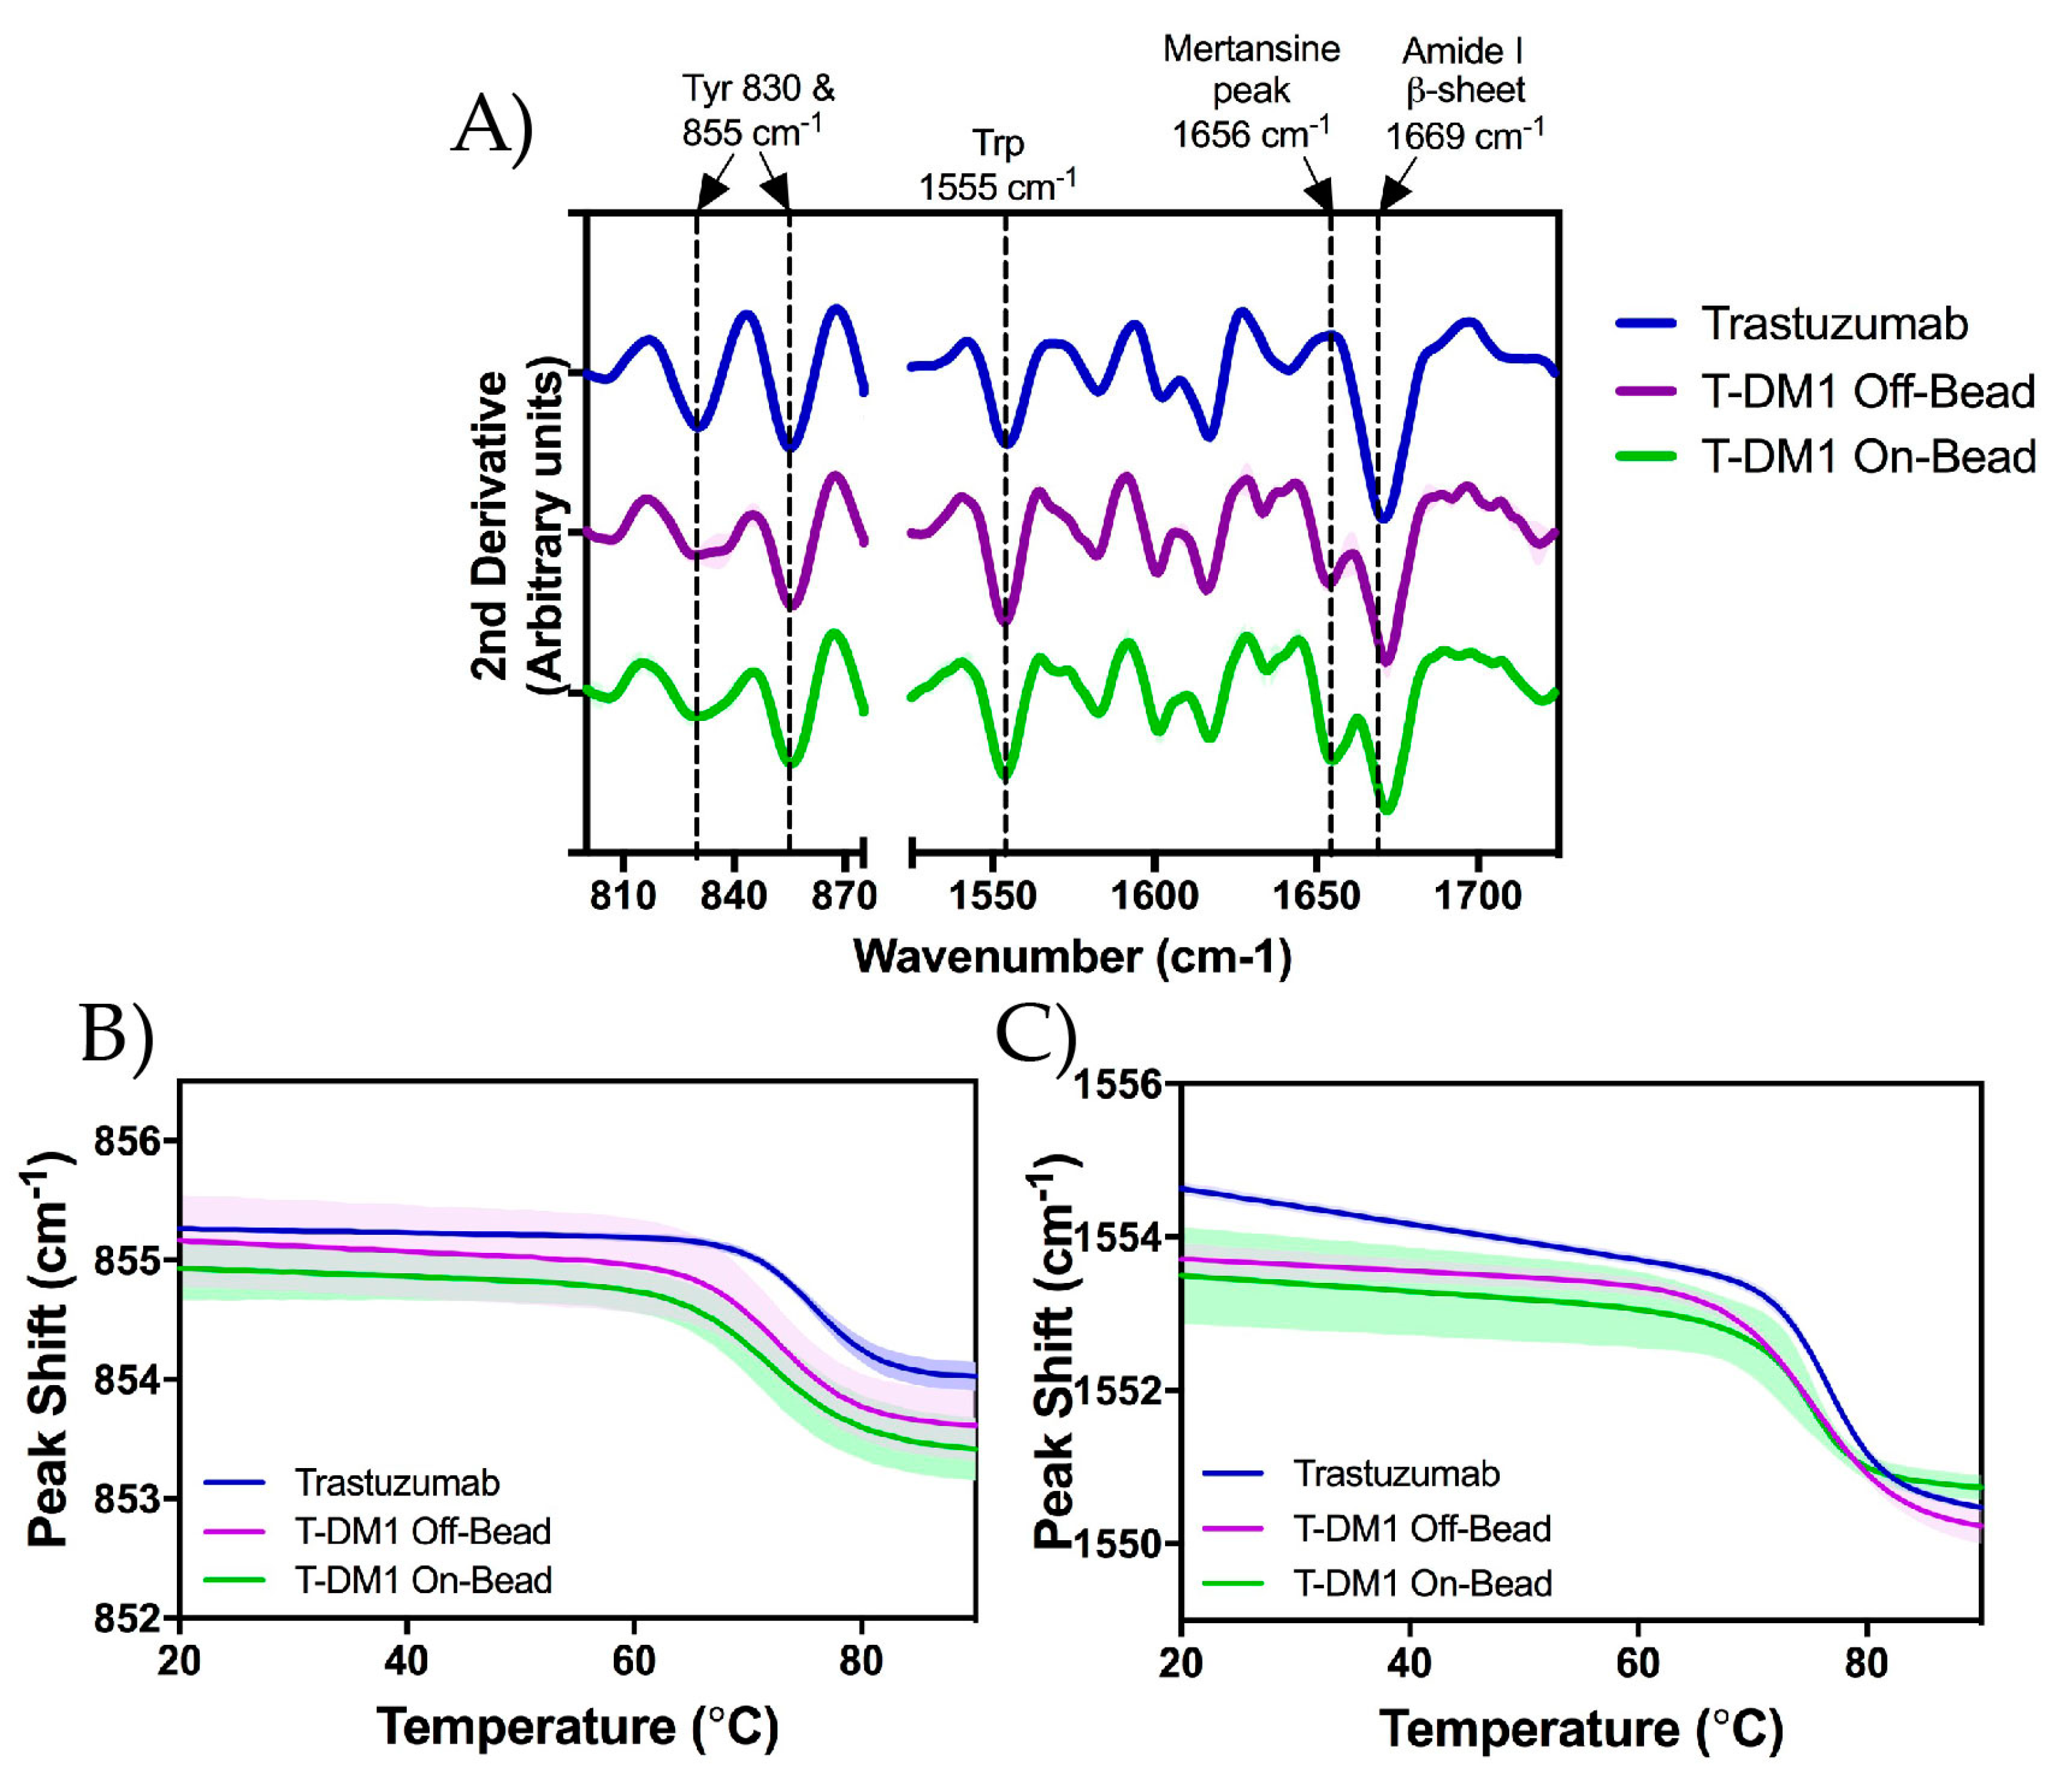
2.5. Raman Spectroscopy
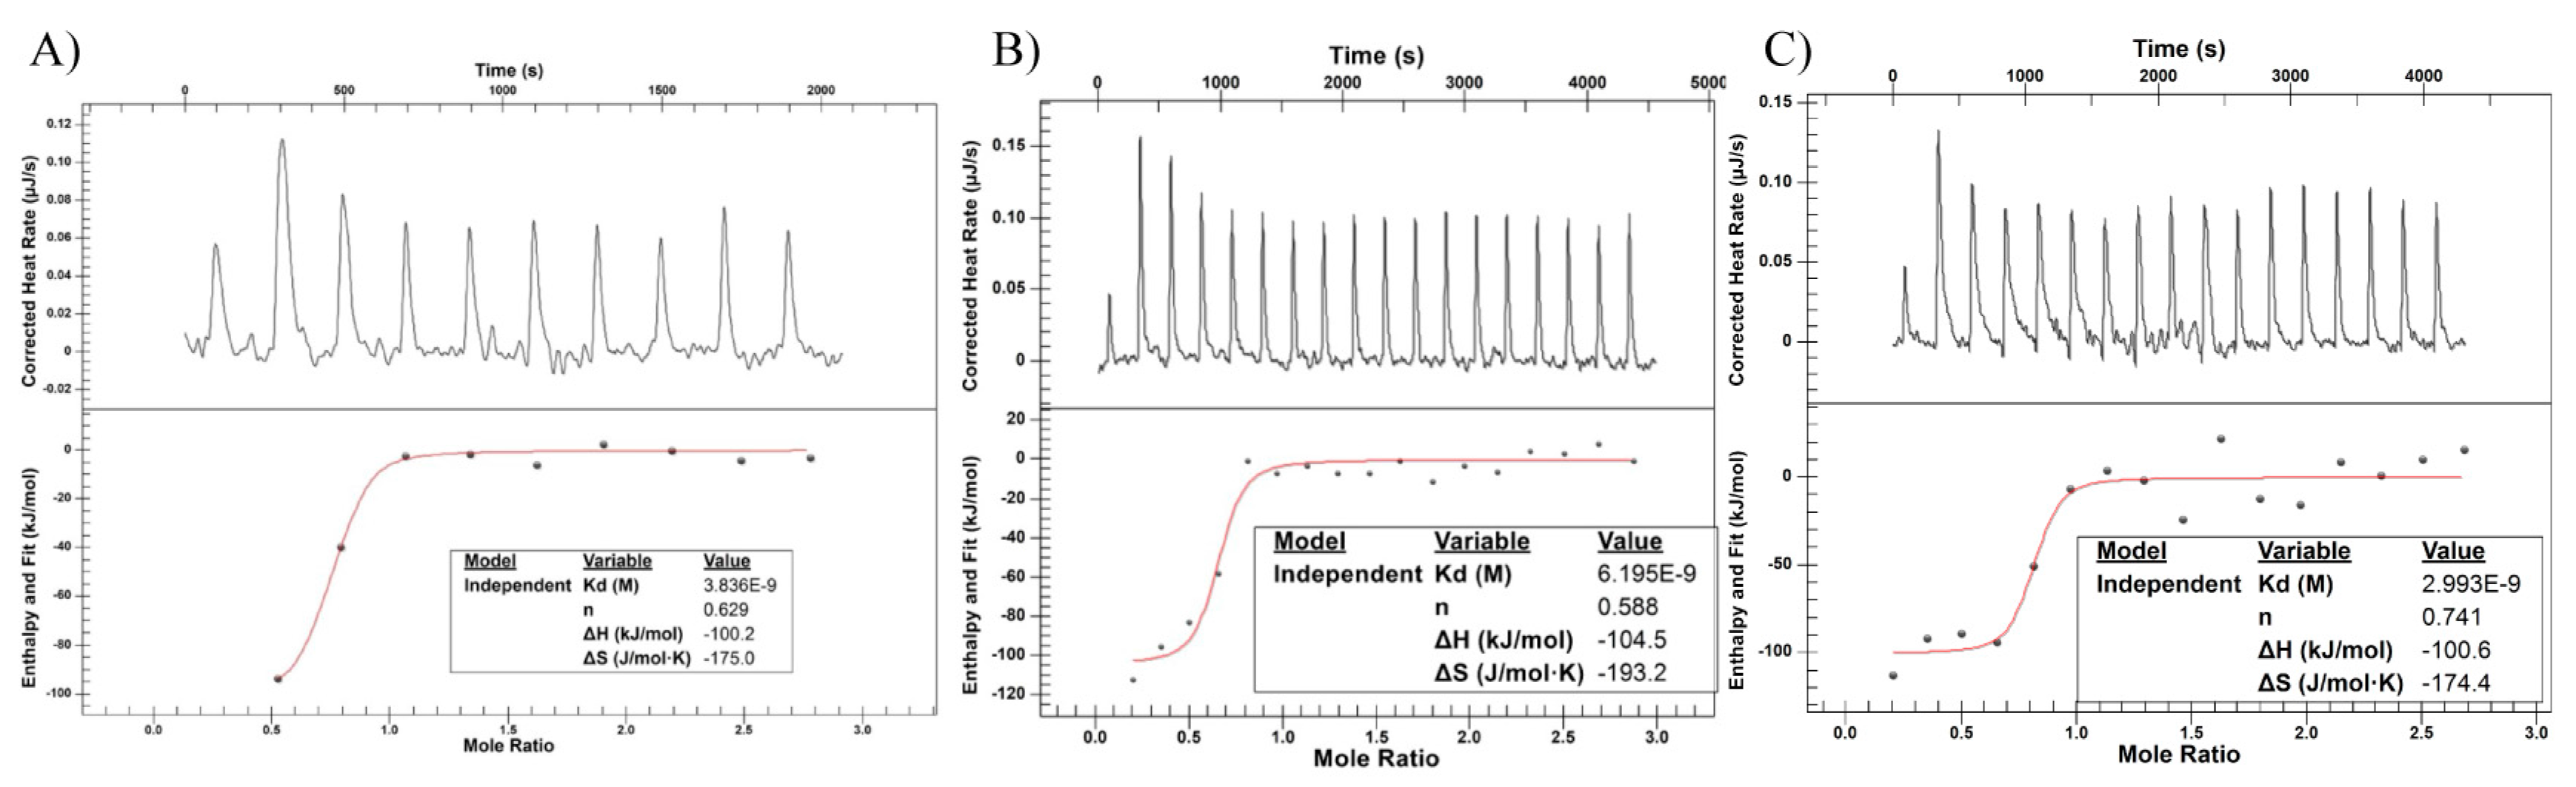
2.6. Isothermal Titration Calorimetry (ITC)
3. Discussion
3.1. ADC Synthesis and Payload Distribution
3.2. Thermal Stability and Aggregation
3.3. Higher Order Structure and Binding Affinity
4. Materials and Methods
4.1. Synthesis
4.1.1. T-DM1 Off-Bead Synthesis
4.1.2. T-DM1 On-Bead Synthesis
4.2. Mass Spectrometry
4.2.1. DAR Analysis by LC/MS
4.2.2. Peptide Mapping
4.3. Sample Prep
4.3.1. Post-Conjugation Protein A Purification Study
4.3.2. Characterization
4.4. Concomitant Raman Spectroscopy and DLS
4.5. DSC
4.6. ITC
4.7. Statistics
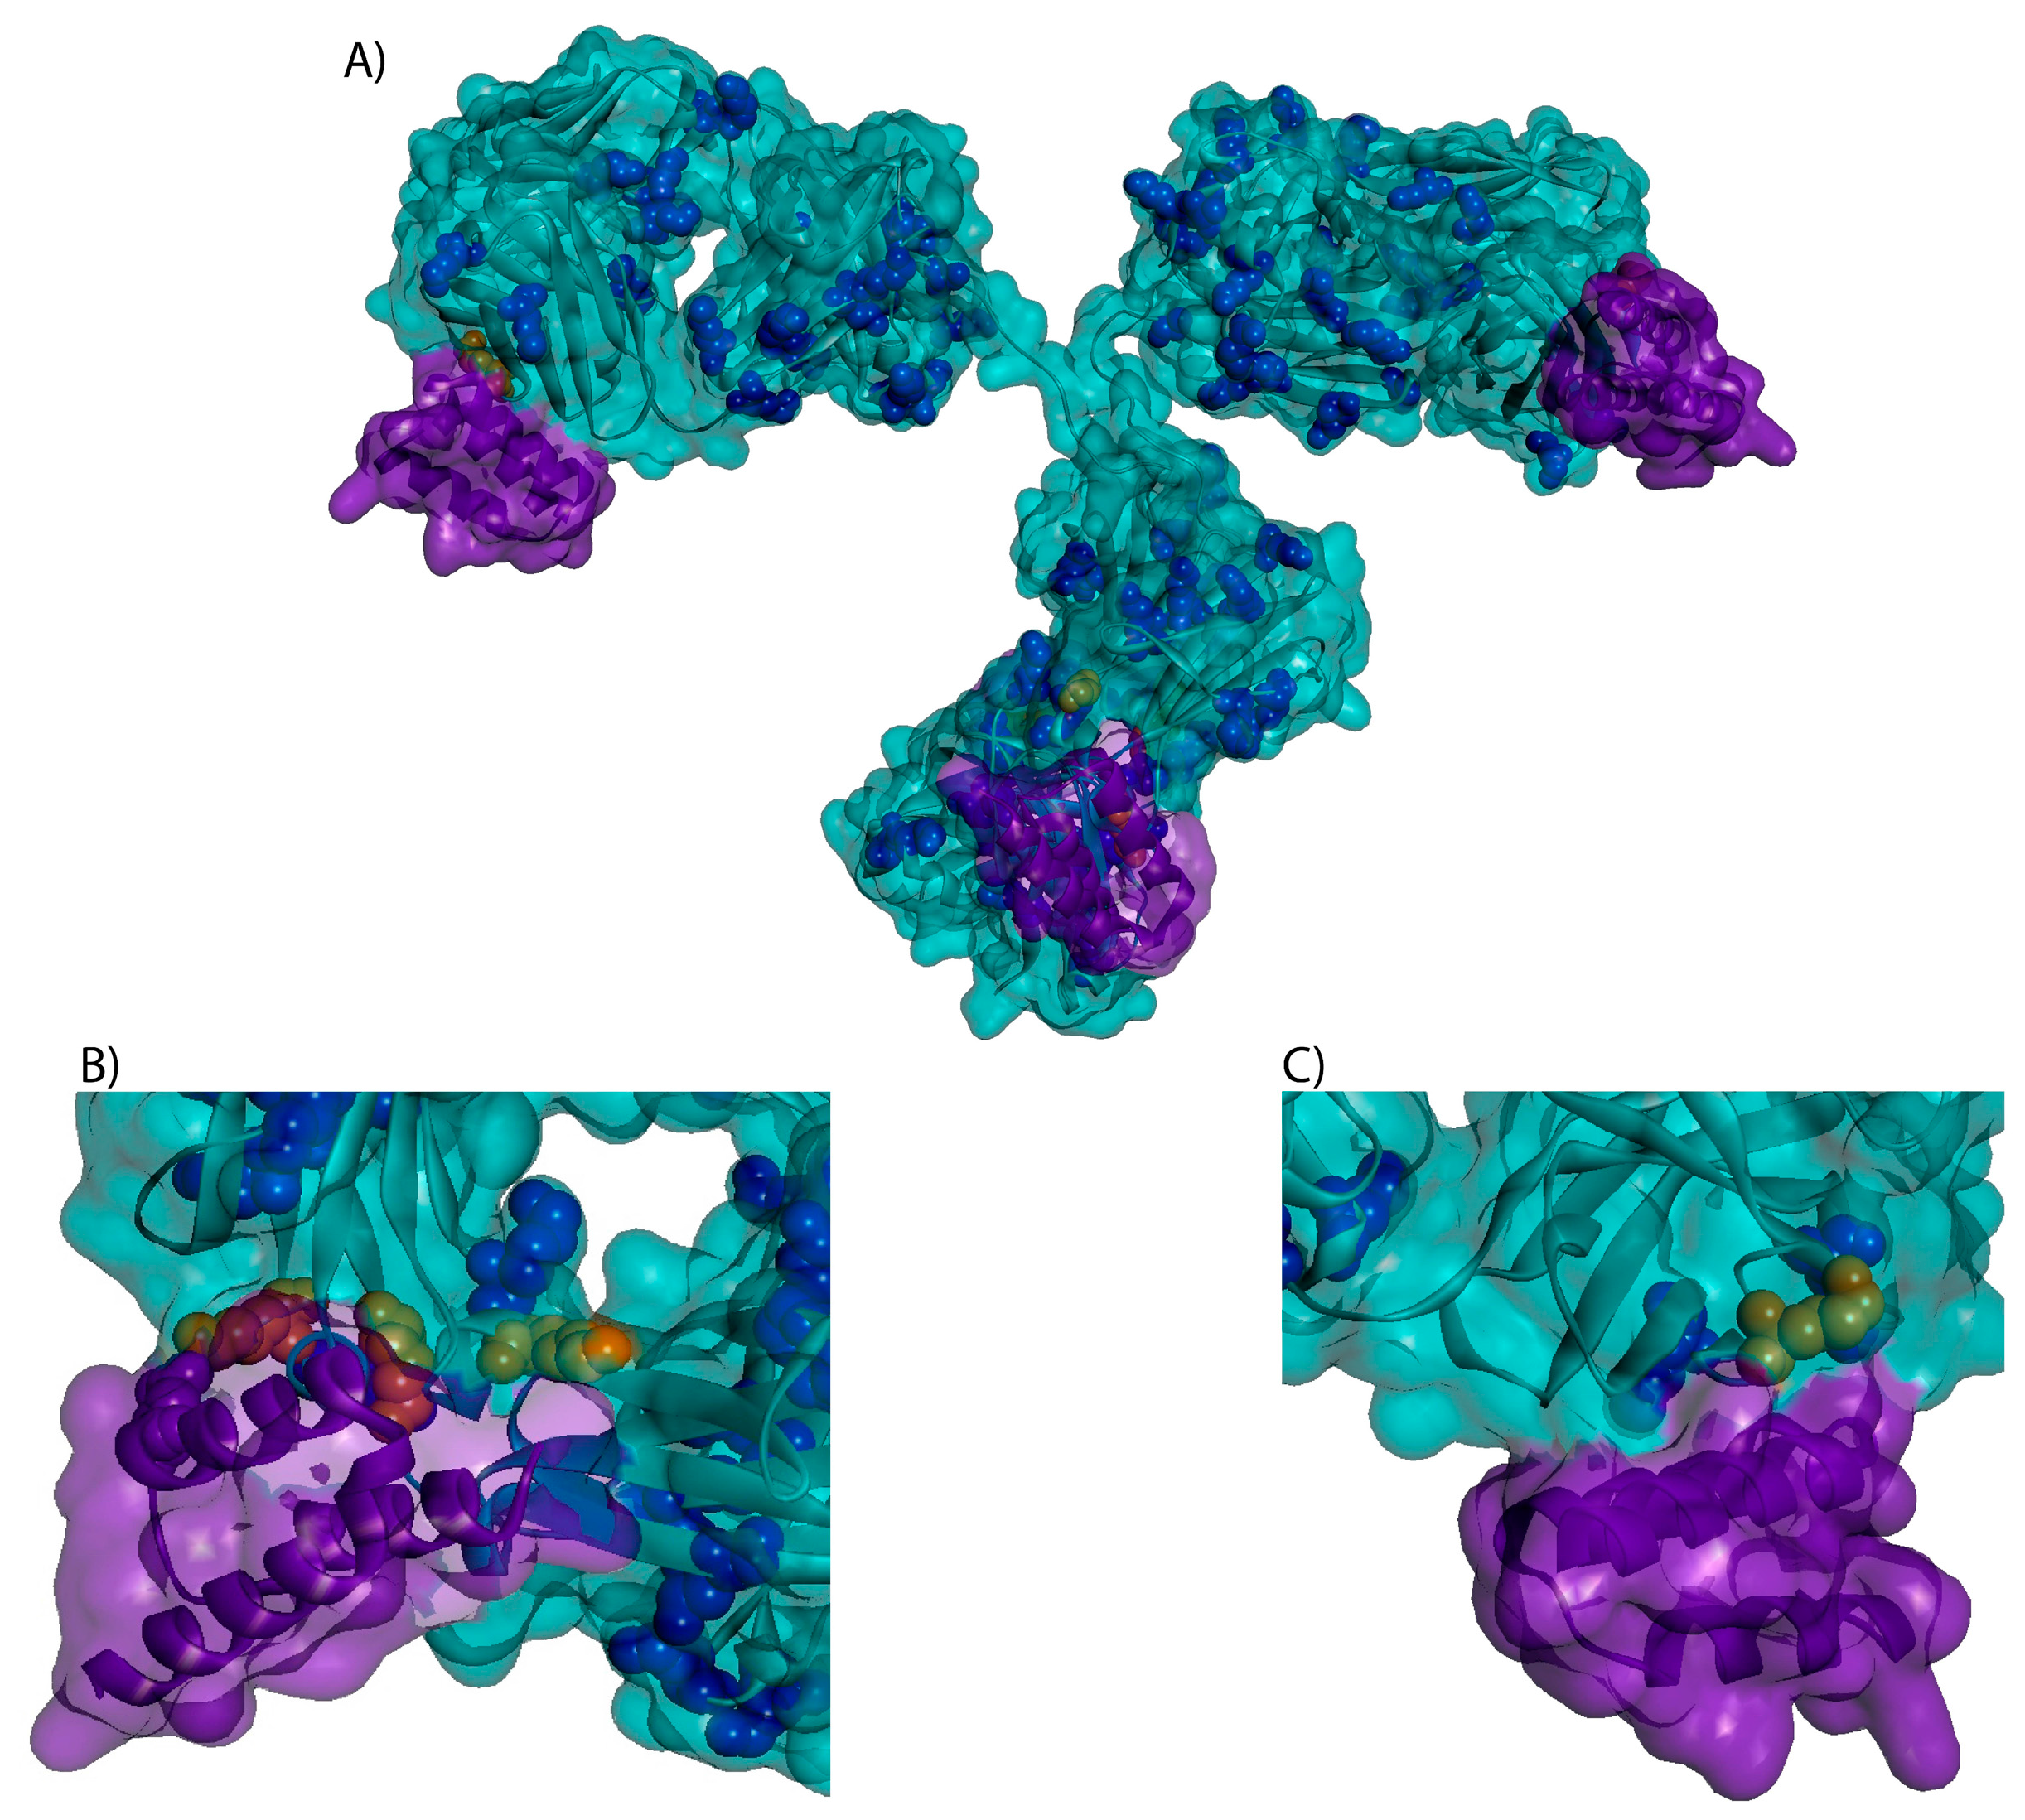
4.8. 3-D Trastuzumab-Protein A Model
5. Conclusions
Supplementary Materials
Acknowledgments
Author Contributions
Conflicts of Interest
References
- Strebhardt, K.; Ullrich, A. Paul Ehrlich’s magic bullet concept: 100 years of progress. Nat. Rev. Cancer 2008, 8, 473–480. [Google Scholar] [CrossRef] [PubMed]
- Meier, C.; Cairns-Smith, S.; Schulze, U. Can emerging drug classes improve R&D productivity? Drug Discov. Today 2013, 18, 607–609. [Google Scholar] [PubMed]
- Anthony, L. Personal Communication—Beacon; Hanson Wade: London, UK, 2017. [Google Scholar]
- Clinical Trials. 2017. Available online: https://clinicaltrials.gov/ (accessed on 21 BMarch 2017).
- Beck, A.; Goetsch, L.; Dumontet, C.; Corvaïa, N. Strategies and challenges for the next generation of antibody-drug conjugates. Nat. Rev. Drug Discov. 2017, 16, 315–337. [Google Scholar] [CrossRef] [PubMed]
- Catcott, K.C.; McShea, M.A.; Bialucha, C.U.; Miller, K.L.; Hicks, S.W.; Saxena, P.; Gesner, T.G.; Woldegiorgis, M.; Lewis, M.E.; Bai, C.; et al. Microscale screening of antibody libraries as maytansinoid antibody-drug conjugates. mAbs 2016, 8, 513–523. [Google Scholar] [CrossRef] [PubMed]
- Puthenveetil, S.; Musto, S.; Loganzo, F.; Tumey, L.N.; O’Donnell, C.J.; Graziani, E. Development of Solid-Phase Site-Specific Conjugation and Its Application toward Generation of Dual Labeled Antibody and Fab Drug Conjugates. Bioconjug. Chem. 2016, 27, 1030–1039. [Google Scholar] [CrossRef] [PubMed]
- Nath, N.; Godat, B.; Benink, H.; Urh, M. On-bead antibody-small molecule conjugation using high-capacity magnetic beads. J. Immunol. Methods 2015, 426, 95–103. [Google Scholar] [CrossRef] [PubMed]
- Sasso, E.H.; Silverman, G.J.; Mannik, M. Human-IgA and IgG F(ab′)2 that bind to staphylococcal protein-A belong to the VHIII-subgroup. J. Immunol. 1991, 147, 1877–1883. [Google Scholar] [PubMed]
- Deis, L.N.; Wu, Q.; Wang, Y.; Qi, Y.; Daniels, K.G.; Zhou, P.; Oas, T.G. Suppression of conformational heterogeneity at a protein–protein interface. Proc. Natl. Acad. Sci. USA 2015, 112, 9028–9033. [Google Scholar] [CrossRef] [PubMed]
- Wakankar, A.; Chen, Y.; Gokarn, Y.; Jacobson, F.S. Analytical methods for physicochemical characterization of antibody drug conjugates. mAbs 2014, 3, 161–172. [Google Scholar] [CrossRef]
- McCombs, J.R.; Owen, S.C. Antibody drug conjugates: Design and selection of linker, payload and conjugation chemistry. AAPS J. 2015, 17, 339–351. [Google Scholar] [CrossRef] [PubMed]
- Chen, L.; Wang, L.; Shion, H.; Yu, C.; Yu, Y.Q.; Zhu, L.; Li, M.; Chen, W.; Gao, K. In-depth structural characterization of Kadcyla® (ado-trastuzumab emtansine) and its biosimilar candidate. mAbs 2016, 8, 1210–1223. [Google Scholar] [CrossRef] [PubMed]
- Wang, L.; Amphlett, G.; Blättler, W.A.; Lambert, J.M.; Zhang, W. Structural characterization of the maytansinoid-monoclonal antibody immunoconjugate, huN901-DM1, by mass spectrometry. Protein Sci. 2005, 14, 2436–2446. [Google Scholar] [CrossRef] [PubMed]
- Nobbmann, U.; Connah, M.; Fish, B.; Varley, P.; Gee, C.; Mulot, S.; Chen, J.; Zhou, L.; Lu, Y.; Shen, F.; et al. Dynamic light scattering as a relative tool for assessing the molecular integrity and stability of monoclonal antibodies. Biotechnol. Genet. Eng. Rev. 2007, 24, 117–128. [Google Scholar] [CrossRef] [PubMed]
- Aditya, V.G.K.J.A.; Chen, H.-N.; Owen, S.C.; Carpenter, J.F. Biophysical Properties and Heating-Induced Aggregation of Lysine Conjugated Antibody-Drug Conjugates. Manuscript in revision.
- Guo, J.; Kumar, S.; Prashad, A.; Starkey, J.; Singh, S.K. Assessment of physical stability of an antibody drug conjugate by higher order structure analysis: Impact of thiol-maleimide chemistry. Pharm. Res. 2014, 31, 1710–1723. [Google Scholar] [CrossRef] [PubMed]
- Ionescu, R.M.; Vlasak, J.; Price, C.; Kirchmeier, M. Contribution of variable domains to the stability of humanized IgG1 monoclonal antibodies. J. Pharm. Sci. 2008, 97, 1414–1426. [Google Scholar] [CrossRef] [PubMed]
- Wen, Z.Q. Raman spectroscopy of protein pharmaceuticals. J. Pharm. Sci. 2007, 96, 2861–2878. [Google Scholar] [CrossRef] [PubMed]
- Dinh, N.N.; Winn, B.C.; Arthur, K.K.; Gabrielson, J.P. Quantitative spectral comparison by weighted spectral difference for protein higher order structure confirmation. Anal. Biochem. 2014, 464, 60–62. [Google Scholar] [CrossRef] [PubMed]
- Teska, B.M.; Li, C.; Winn, B.C.; Arthur, K.K.; Jiang, Y.; Gabrielson, J.P. Comparison of quantitative spectral similarity analysis methods for protein higher-order structure confirmation. Anal. Biochem. 2013, 434, 153–165. [Google Scholar] [CrossRef] [PubMed]
- Klebe, G. Applying thermodynamic profiling in lead finding and optimization. Nat. Rev. Drug Discov. 2015, 14, 95–110. [Google Scholar] [CrossRef] [PubMed]
- Wang, W.; Yin, L.; Gonzalez-Malerva, L.; Wang, S.; Yu, X.; Eaton, S.; Zhang, S.; Chen, H.-Y.; LaBaer, J.; Tao, N. In situ drug-receptor binding kinetics in single cells: A quantitative label-free study of anti-tumor drug resistance. Sci. Rep. 2014, 4, 6609. [Google Scholar] [CrossRef] [PubMed]
- Elmlund, L.; Käck, C.; Aastrup, T.; Nicholls, I. Study of the interaction of trastuzumab and SKOV3 epithelial cancer cells using a quartz crystal microbalance sensor. Sensors 2015, 15, 5884–5894. [Google Scholar] [CrossRef] [PubMed]
- Samra, H.S.; He, F. Advancements in high throughput biophysical technologies: Applications for characterization and screening during early formulation development of monoclonal antibodies. Mol. Pharm. 2012, 9, 696–707. [Google Scholar] [CrossRef] [PubMed]
- Boylan, N.J.; Zhou, W.; Proos, R.J.; Tolbert, T.J.; Wolfe, J.L.; Laurence, J.S. Conjugation site heterogeneity causes variable electrostatic properties in Fc conjugates. Bioconjug. Chem. 2013, 24, 1008–1016. [Google Scholar] [CrossRef] [PubMed]
- Kamath, A.V.; Iyer, S. Preclinical Pharmacokinetic Considerations for the Development of Antibody Drug Conjugates. Pharm. Res. 2015, 32, 3470–3479. [Google Scholar] [CrossRef] [PubMed]
- Bryant, P.; Pabst, M.; Badescu, G.; Bird, M.; McDowell, W.; Jamieson, E.; Swierkosz, J.; Jurlewicz, K.; Tommasi, R.; Henseleit, K.; et al. In Vitro and In Vivo Evaluation of Cysteine Rebridged Trastuzumab-MMAE Antibody Drug Conjugates with Defined Drug-to-Antibody Ratios. Mol. Pharm. 2015, 12, 1872–1879. [Google Scholar] [CrossRef] [PubMed]
- Adem, Y.T.; Schwarz, K.A.; Duenas, E.; Patapoff, T.W.; Galush, W.J.; Esue, O. Auristatin antibody drug conjugate physical instability and the role of drug payload. Bioconjug. Chem. 2014, 25, 656–664. [Google Scholar] [CrossRef] [PubMed]
- Morikis, D.; Lambris, J.D. Physical methods for structure, dynamics and binding in immunological research. Trends Immunol. 2004, 25, 700–707. [Google Scholar] [CrossRef] [PubMed]
- Frasca, V. Biophysical characterization of antibodies with isothermal titration calorimetry. J. Appl. Bioanal. 2016, 2, 90–102. [Google Scholar] [CrossRef]
- Tang, N.; Martosella, J.; Zhu, A. High Resolution and Rapid Peptide Mapping of Monoclonal Antibodies Using an Agilent 1290 Infinity UHPLC and an Agilent 6550 iFunnel Q-TOF LC/MS System; Agilent Technologies: Santa Clara, CA, USA, 2013. [Google Scholar]


| Tm,1 (°C) | Tm,2 (°C) | |
|---|---|---|
| Trastuzumab | 70.6 ± 0.1 | 82.6 ± 0.1 |
| T-DM1 Off-Bead | 67.7 ± 0.3 | 81.7 ± 0.0 |
| T-DM1 On-Bead | 69.6 ± 0.3 | 81.7 ± 0.0 |
| Raman Spectra (cm−1) | Structure |
|---|---|
| 830 & 855 | Tyrosine Side Chain |
| 1555 | Tryptophan Side Chain |
| 1656 | DM1 |
| 1669 | β-sheet |
| 1650–1680 | Amide I |
| Kd (nM) | n | ΔH (kJ/mol) | ΔS (J/mol × K) | |
|---|---|---|---|---|
| Trastuzumab | 5.56 ± 0.64 | 1.40 ± 0.77 | −101.10 ± 5.10 | −181.05 ± 16.15 |
| T-DM1 Off-Bead | 4.13 ± 2.06 | 0.64 ± 0.05 | −102.60 ± 1.90 | −182.25 ± 10.95 |
| T-DM1 On-Bead | 5.24 ± 2.25 | 0.66 ± 0.09 | −106.10 ± 5.50 | −196.50 ± 22.10 |
© 2018 by the authors. Licensee MDPI, Basel, Switzerland. This article is an open access article distributed under the terms and conditions of the Creative Commons Attribution (CC BY) license (http://creativecommons.org/licenses/by/4.0/).
Share and Cite
Arlotta, K.J.; Gandhi, A.V.; Chen, H.-N.; Nervig, C.S.; Carpenter, J.F.; Owen, S.C. In-Depth Comparison of Lysine-Based Antibody-Drug Conjugates Prepared on Solid Support Versus in Solution. Antibodies 2018, 7, 6. https://doi.org/10.3390/antib7010006
Arlotta KJ, Gandhi AV, Chen H-N, Nervig CS, Carpenter JF, Owen SC. In-Depth Comparison of Lysine-Based Antibody-Drug Conjugates Prepared on Solid Support Versus in Solution. Antibodies. 2018; 7(1):6. https://doi.org/10.3390/antib7010006
Chicago/Turabian StyleArlotta, Keith J., Aditya V. Gandhi, Hsiao-Nung Chen, Christine S. Nervig, John F. Carpenter, and Shawn C. Owen. 2018. "In-Depth Comparison of Lysine-Based Antibody-Drug Conjugates Prepared on Solid Support Versus in Solution" Antibodies 7, no. 1: 6. https://doi.org/10.3390/antib7010006
APA StyleArlotta, K. J., Gandhi, A. V., Chen, H.-N., Nervig, C. S., Carpenter, J. F., & Owen, S. C. (2018). In-Depth Comparison of Lysine-Based Antibody-Drug Conjugates Prepared on Solid Support Versus in Solution. Antibodies, 7(1), 6. https://doi.org/10.3390/antib7010006