1. Introduction
The growing demand for binders targeting specific proteins underscores the critical need for effective binder selection in protein engineering. Nanobodies, which are the antigen-binding fragments of heavy-chain-only antibodies, have proven highly valuable in research, diagnostics, and therapeutic applications [
1,
2,
3]. Traditionally, functional nanobodies are sourced from immunized or naive libraries, but many laboratories face limitations due to the lack of access to the necessary animal facilities. Synthetic nanobody libraries present a viable alternative, being fully constructed from DNA oligonucleotides and thus avoiding the need for animal involvement. Nonetheless, synthetic nanobody libraries frequently contain numerous detrimental clones due to the lack of natural immune system evolution and errors that occur during library construction and screening processes. Consequently, a robust protein selection method is essential for identifying the rare favourable candidates.
To date, only a few synthetic nanobody libraries have been published [
4,
5,
6,
7,
8,
9,
10,
11,
12]. While the methods for constructing and selecting antigen-specific nanobodies from synthetic nanobody libraries are well documented, their broad application is still under development. Phage display, which was established over 35 years ago, remains the most widely used method for protein selection [
13]. However, its inherent limitation in library size constrains its application for very large synthetic libraries. In contrast, ribosome display uses ribosomal complexes formed during in vitro translation to link genotype with phenotype, thereby avoiding the use of living cells—the primary limiting factor for library size [
14]. Although ribosome display based on
E. coli S30 extracts has been developed over many years, its application to synthetic nanobody libraries remains limited. This is primarily due to reduced selection efficiency caused by the presence of RNases and proteases, which particularly hinders the recovery of low-copy or suboptimal members in synthetic nanobody libraries [
15].
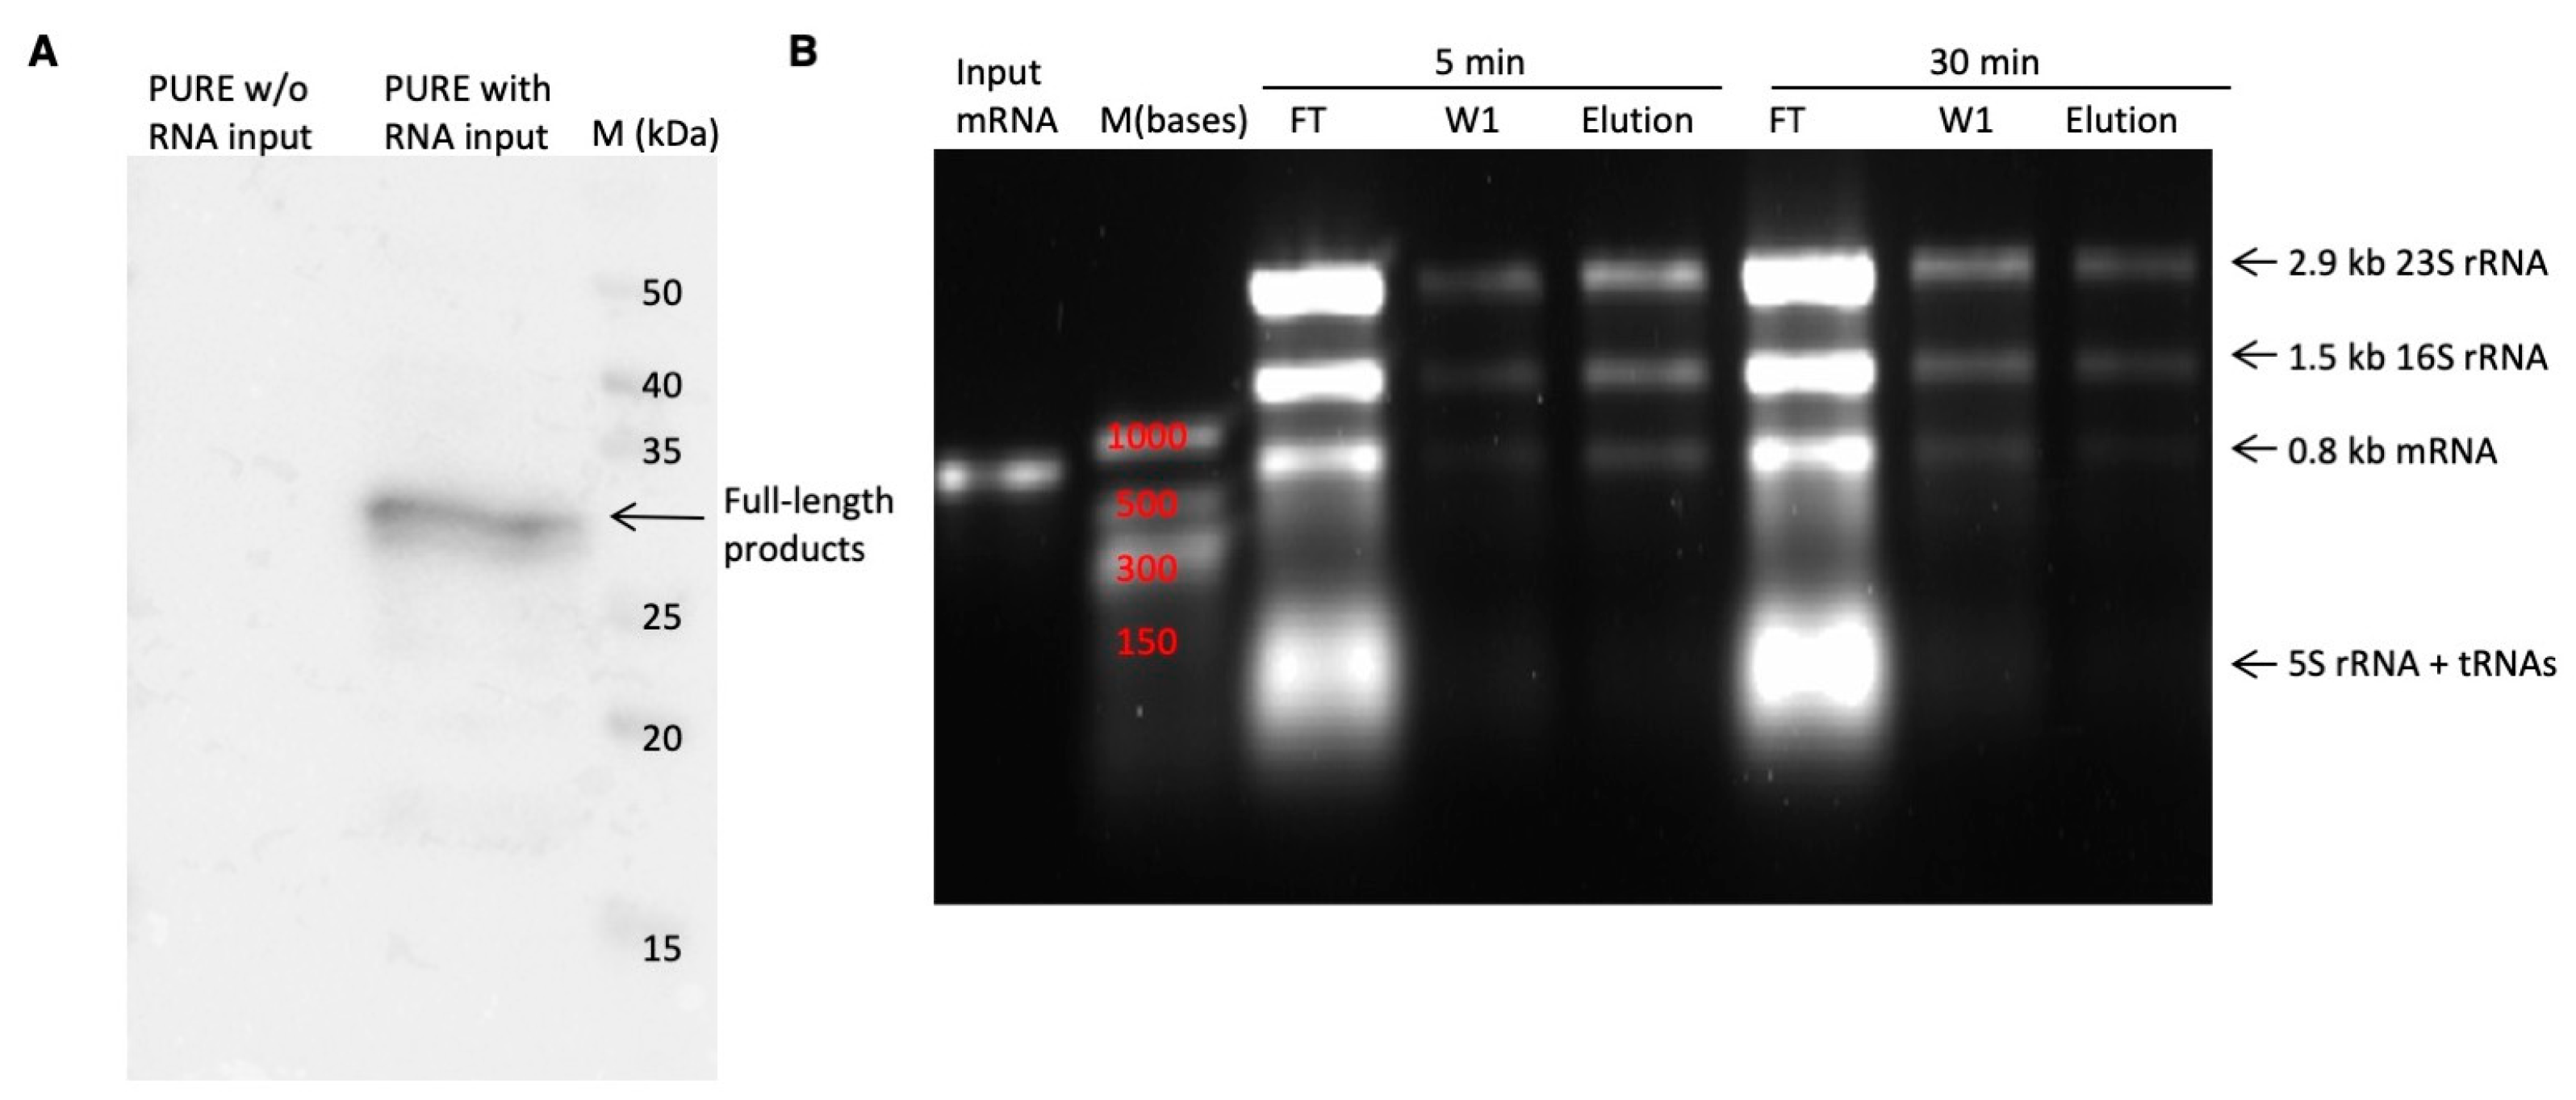
The reconstitution of the PURE system addresses this issue by eliminating RNases and proteases, resulting in a higher mRNA recovery rate compared to traditional S30 extracts [
16,
17]. However, the PURE system introduces new challenges due to its oversimplified nature. Comparative experiments have shown that, under identical conditions, the PURE system yields a greater quantity of protein than the S30 extract, likely due to the low protease content in the PURE system. However, enzyme activity assays have revealed higher enzyme activity in the S30 extract group than in the PURE system group, suggesting that a portion of the proteins produced in the PURE system are improperly folded, likely due to the absence of molecular chaperons [
15]. Furthermore, Iwan Zimmermann and colleagues reported that three successive rounds of PURE ribosome display effectively identified maltose binding protein (MBP) binders from synthetic nanobody libraries. However, this approach proved inadequate for selecting nanobodies targeting membrane proteins [
11,
18]. The authors attributed this limitation to the inherent selection bias of ribosome display, which may favour certain background binders and impede the enrichment of target-specific nanobodies. Protein expression and presentation can vary across different selection systems; specific library members may fail to fold correctly in the PURE system yet manage to fold properly under intracellular expression conditions. Nevertheless, it is noteworthy that the enrichment of background binders should be largely influenced by the target protein display method and selection stringency, rather than the PURE ribosome display itself.
Addressing the limiting factors of the PURE system for screening synthetic nanobody libraries and subsequently optimizing the process can significantly enhance the utility of these libraries. In this study, we investigated the efficiency limitations imposed by mRNA secondary structure—an aspect overlooked during the transition from the S30 system to the PURE system. We employed a real-time analysis method to monitor the enrichment of specific binders, thereby significantly reducing troubleshooting time. Additionally, we developed strategies to facilitate the identification of nanobodies specific to target proteins by incorporating a target protein elution step prior to the EDTA-mediated disassembly, as well as altering the immobilization surface. Finally, we improved the PURE ribosome display system by altering the spacer genes to minimize mRNA secondary structure formation.
3. Discussion
The application of PURE ribosome display has been somewhat limited by the lack of a comprehensive understanding. Although most principles are the same for ribosome display, whether using cell extract or the PURE system, some factors have been undervalued in terms of their impact on selection efficiency. In this study, we highlighted the importance of spacer gene choice, which has often been overlooked when applying designs from ribosome display using cell extracts. The incubation time for the in vitro translation process also needs to be fine-tuned for different spacer genes, as ribosome movement speed varies across sequences. An incubation time that is too short might result in immature products, while one that is too long could cause ribosome complexes to dissociate from the mRNA.
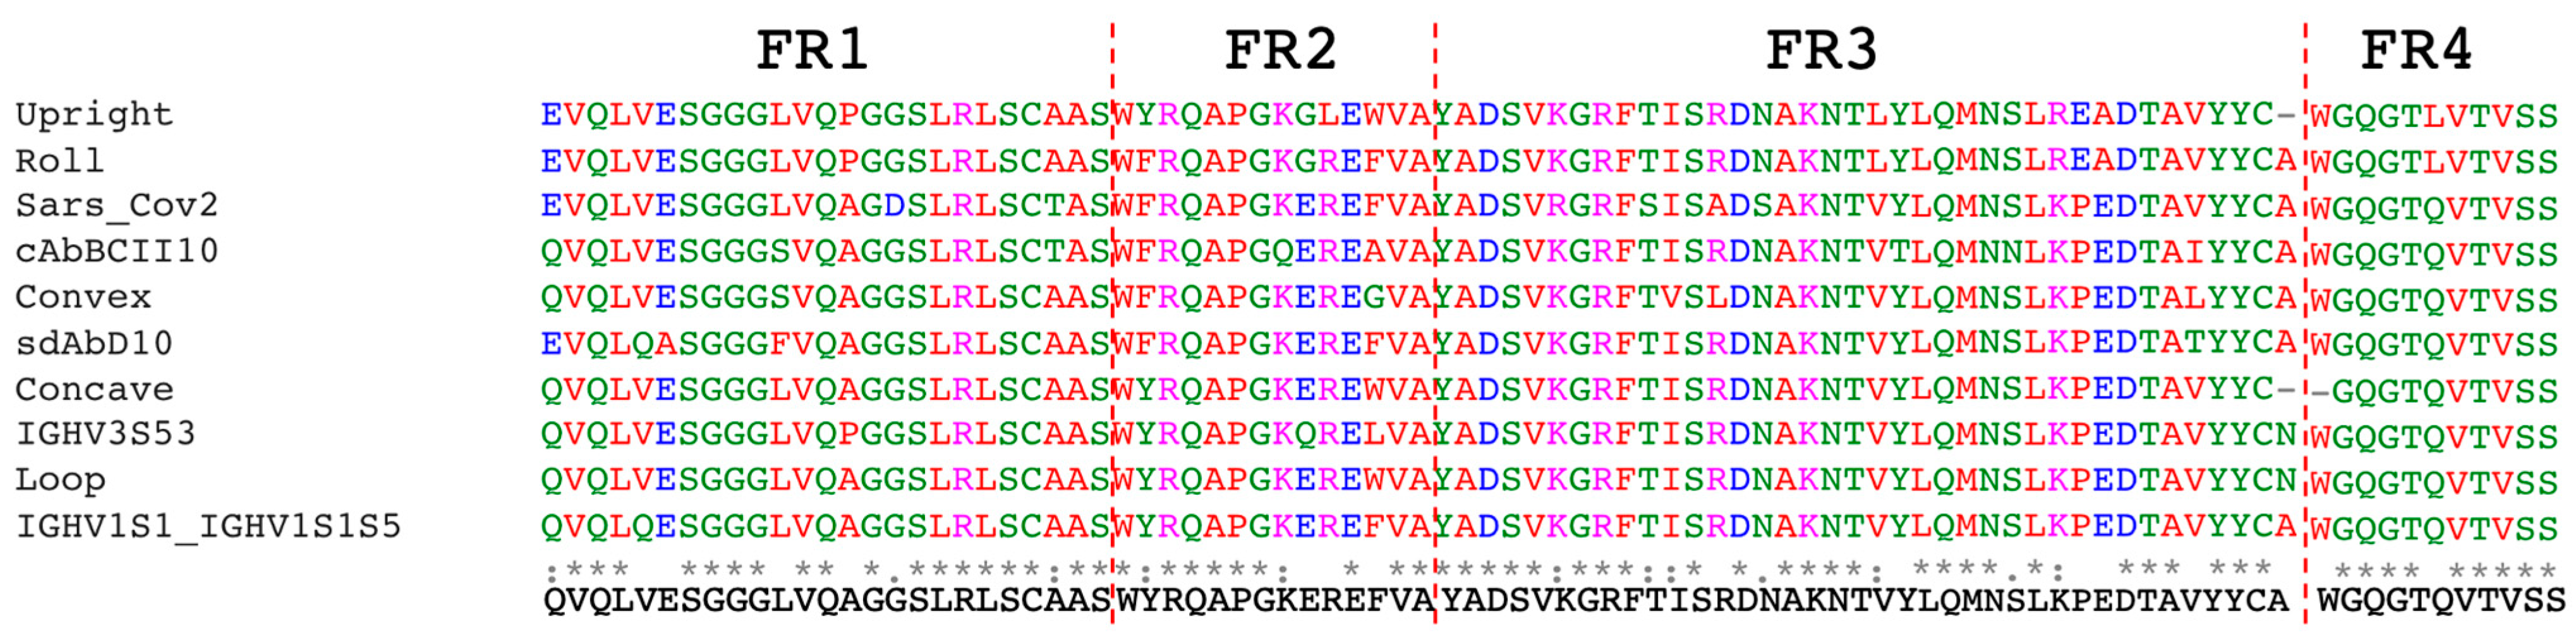
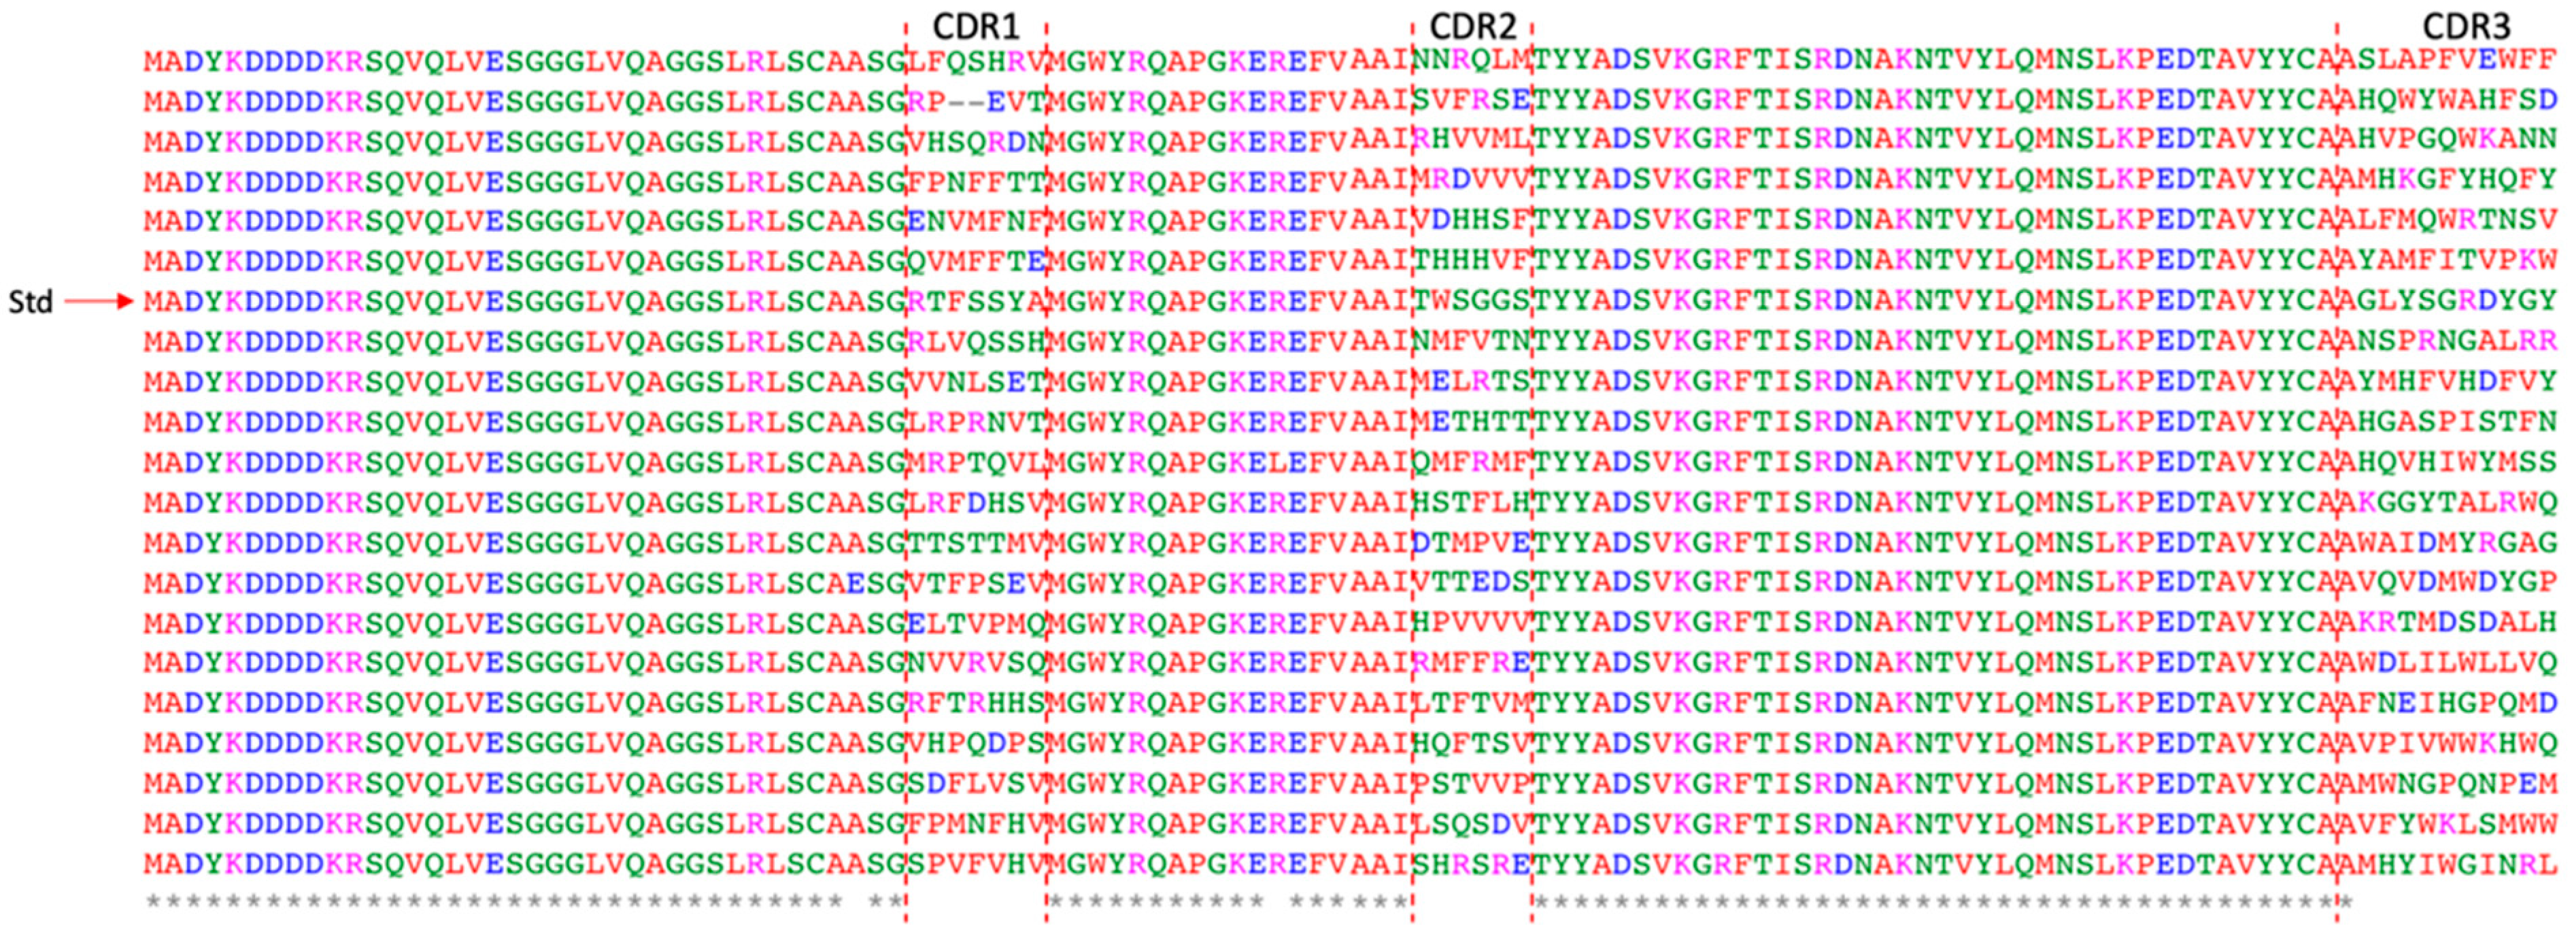
In this work, a synthetic nanobody library was constructed by employing the amino acids with the highest frequencies, derived from a multiple sequence alignment of previously published synthetic nanobody libraries, as the framework sequence. This framework was combined with full randomization of three CDRs. Trimer phosphoramidites were utilized during the synthesis of degenerate primers to control amino acid types and minimize frameshifts, like single-base deletions, which may occur in the CDRs during primer synthesis. Furthermore, this method prevented the inclusion of rare codons that could affect protein yield, potentially leading to expression level biases during culturing in 96-well plates for the single-clone ELISA analysis. The incorporation of Nb2 into the synthetic nanobody library enables real-time confirmation of the successful enrichment of EGFP-specific binders through a straightforward PCR test. This method can serve as a preliminary step for verifying the functionality of the entire system and is particularly beneficial for beginners using PURE ribosome display or when utilizing new libraries.
Non-specific binding consistently presents a challenge by hindering the effective enrichment of specific binders, regardless of the selection methods employed. To reduce non-specific binding, several strategies are commonly employed. One approach involves a pre-incubation step, where the display system is exposed to the immobilized surface without the antigen, aiming to eliminate surface-specific binders. Another strategy involves altering the chemistry of the immobilized surface, such as utilizing magnetic beads, Ni-NTA agarose beads, and 96-well plates, as employed in this study. Alternatively, altering the protein on solid surfaces itself can be effective, for instance, by utilizing streptavidin- or avidin-coated solid surfaces as substitutes. Additionally, adjusting selection pressure factors like washing stringency or gradually reducing the concentration of the target protein can also reduce non-specific binding. Approaches such as prolonging washing incubation time, increasing the number of washing steps, or adjusting detergent concentration have been shown to effectively enhance the washing efficiency for removing non-specific binding.
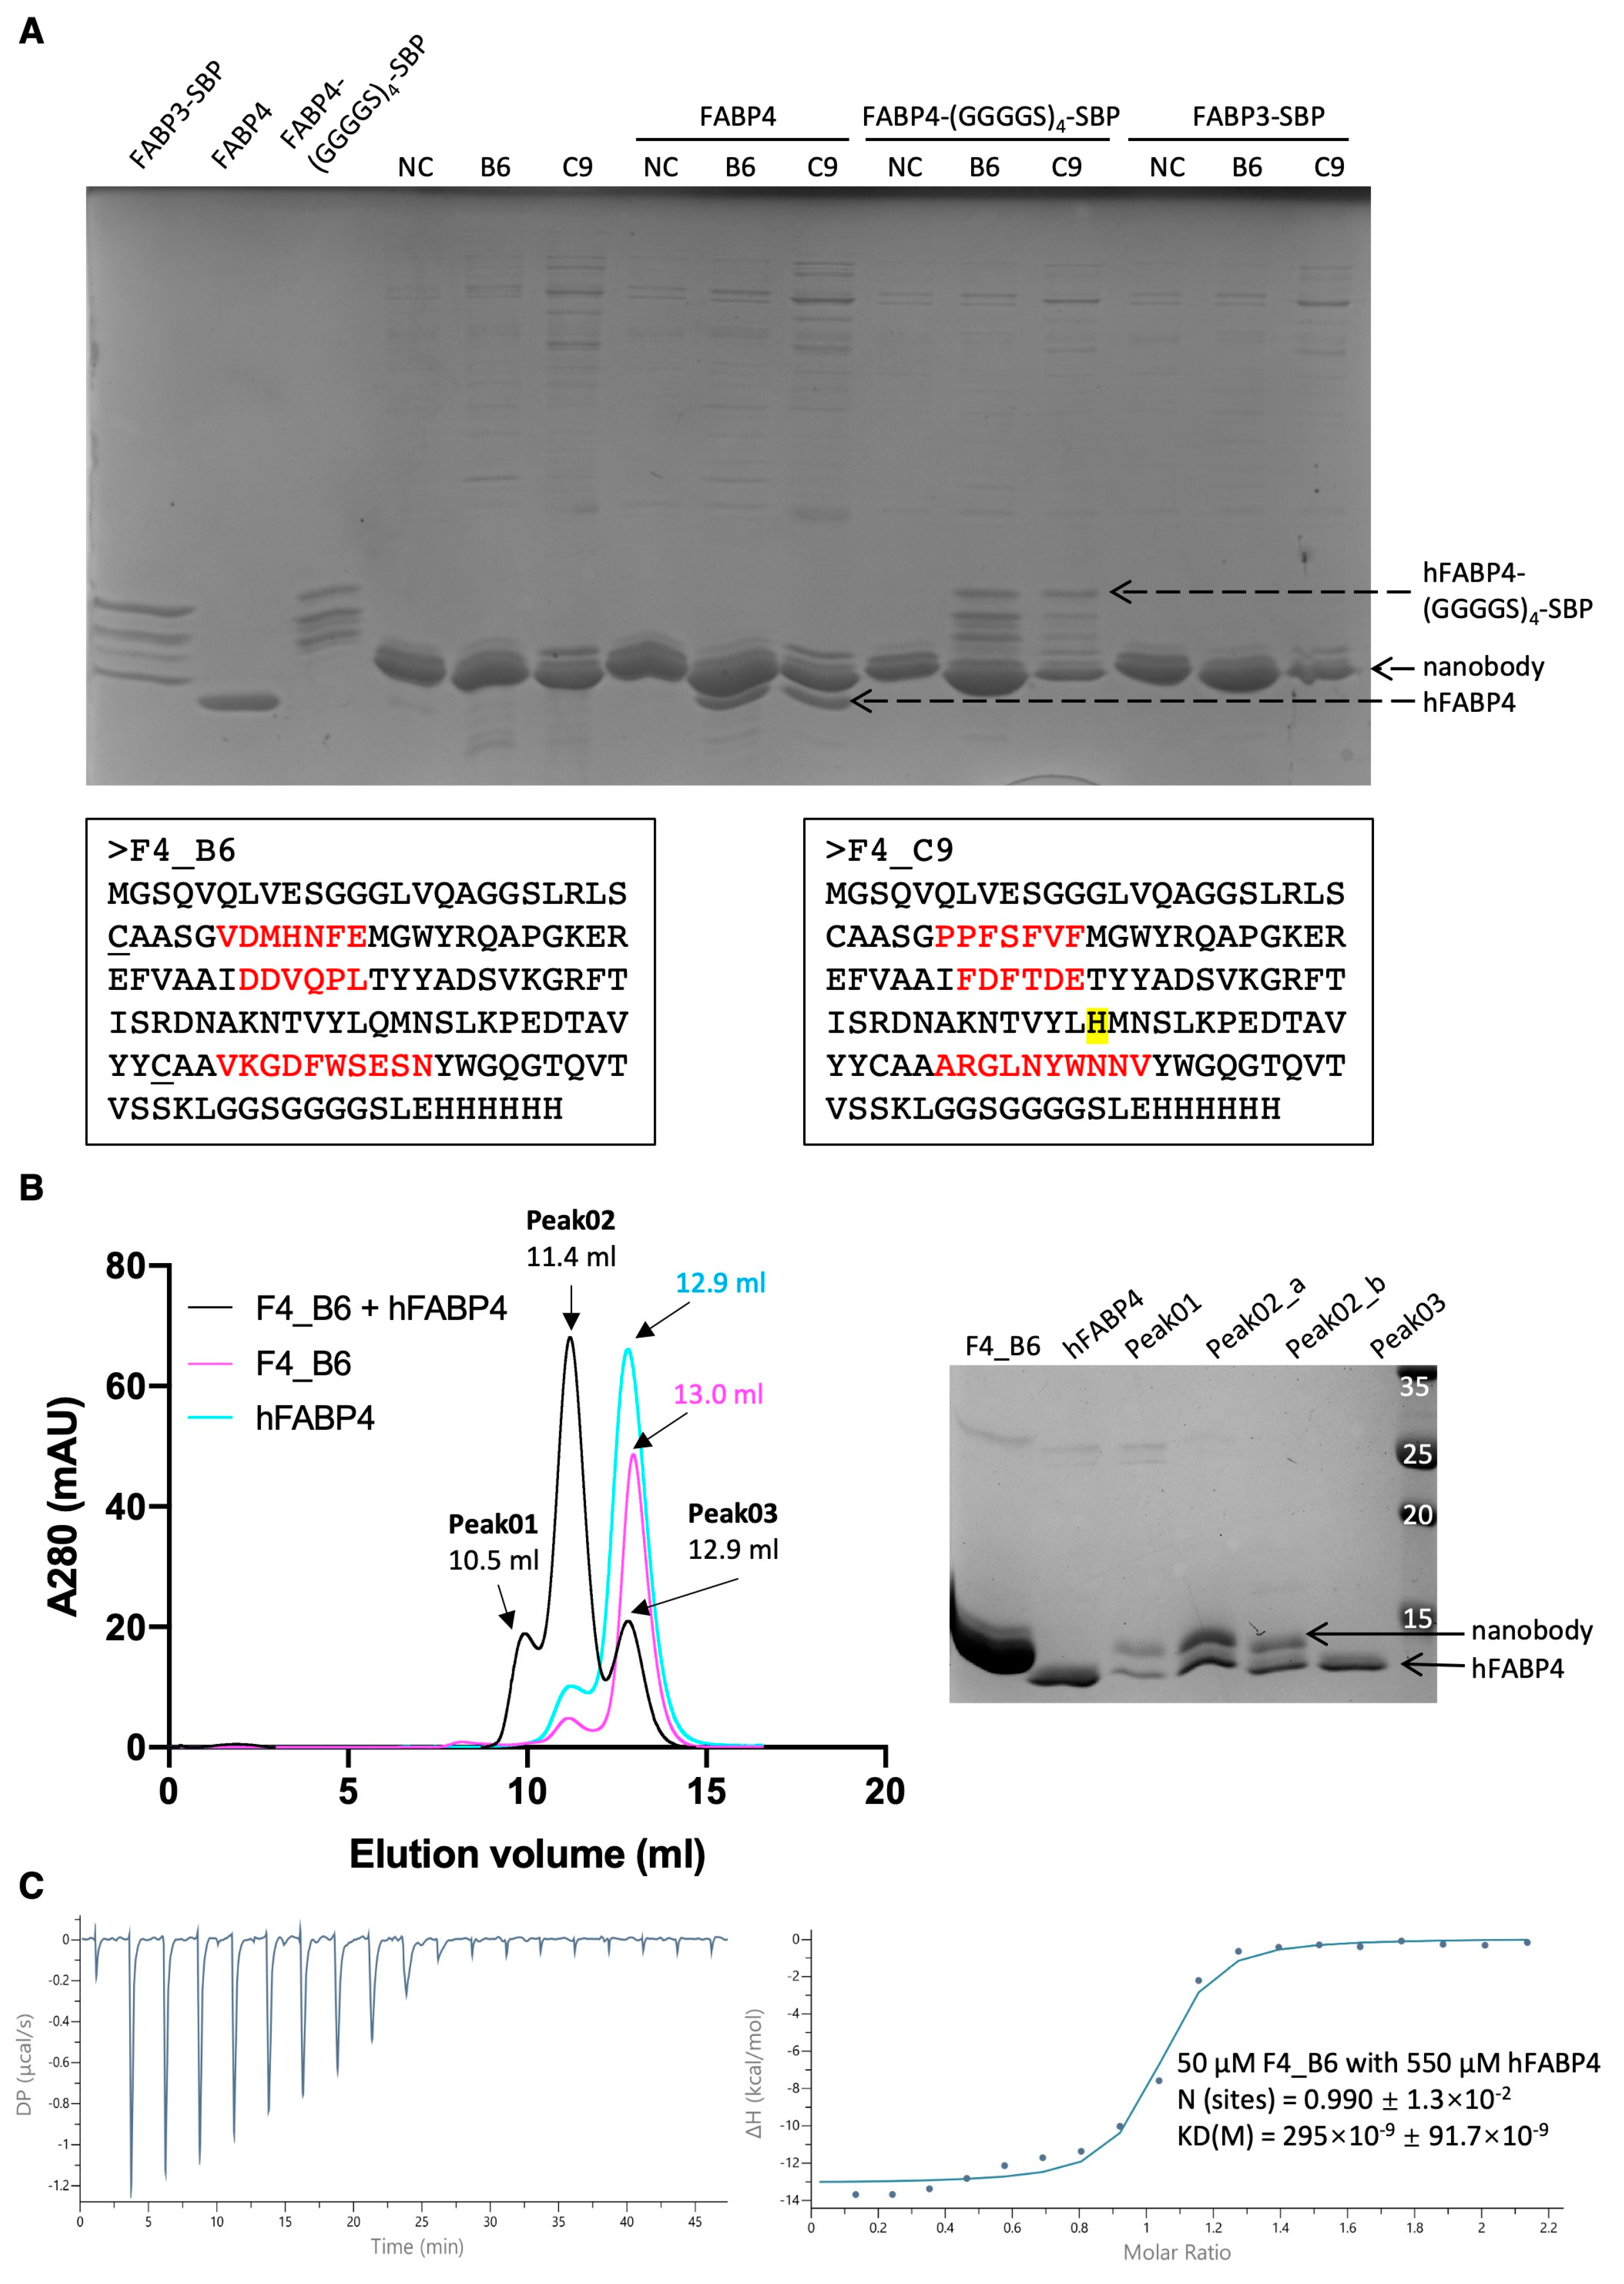
Through the thorough examination of ribosome display using the PURE system, a clearer understanding of its strengths and limitations has emerged. The robustness of PURE ribosome display was validated using our in-house synthetic nanobody library, successfully screening for EGFP- and hFABP4-specific nanobodies, even with the use of an unpreferred spacer gene, M13 pIII. Following this validation and optimization, the application of PURE ribosome display for screening large libraries is expected to grow in the near future.
5. Materials and Methods
5.1. Protein Expression and Purification
Plasmids containing His-EGFP-(GGGGS)4-SBP or His-SUMO-hFABP4-(GGGGS)4-SBP were transformed into E. coli BL21 (DE3) cells for the overexpression of recombinant proteins. E. coli BL21 cells containing the desired plasmid were grown in 1 litre of LB broth (containing 0.1 mg/mL ampicillin or 0.05 mg/mL kanamycin) to an OD600 of 0.6 at 37 °C. Subsequently, the temperature was lowered to 20 °C, and the cells were induced with 200 µM IPTG for 18 h. Harvested cells were disrupted using a sonicator at 30% sonication amplitude, with 1 s on/off intervals, in PBS buffer (137 mM NaCl, 2.7 mM KCl, 10 mM Na2HPO4, 1.8 mM KH2PO4, pH 7.4). The lysate resulting from sonication was subjected to centrifugation at 8000× g and 4 °C for 40 min to separate the soluble and insoluble components. The supernatant, containing the soluble fraction, was loaded onto a column containing 5 mL Ni-NTA beads (QIAGEN, Singapore, Singapore). The slurry was incubated at 25 °C for 1 h on a rocker at 30 rpm. After washing out the impurities, the proteins were eluted with 10 mL PBS containing 200 mM imidazole. Following cleavage of the His-tag or SUMO-tag by thrombin or ULP1, the proteins were dialyzed against PBS to remove imidazole and His-tag. For hFABP4, the protein solution was reloaded onto a Ni-NTA column to remove the SUMO-tag. The proteins were concentrated using centrifugal filters with a 3 kDa cut-off and separated by size exclusion chromatography using a Superdex 75 10/300 GL column (Cytiva, Singapore, Singapore) in PBS.
5.2. Circular Dichroism Spectroscopy
Circular dichroism (CD) spectroscopy was employed to assess the thermal stability of the nanobodies. The protein sample, maintained at a concentration of 0.2 mg/mL, was placed in a phosphate buffer (20 mM, pH 7.1). CD spectra were recorded using a JASCO J-1100 CD Spectrophotometer (Tokyo, Japan) equipped with a thermal controller. For the thermal denaturation experiment, the temperature was incrementally increased from 20 °C to 90 °C at a rate of 2 °C/min. The change in ellipticity at 219 nm with respect to temperature was employed to determine the melting temperature (Tm) of the nanobodies.
5.3. RNA Bleach Agarose Gel
To protect RNA from degradation by RNase, a bleach agarose gel was prepared to minimize RNase activity. This involved adding 0.5 g of agarose into 50 mL of TBE buffer (89 mM Tris, 89 mM boric acid, 2 mM EDTA, pH ~8.3) containing 0.6% sodium hypochlorite. After incubation at room temperature for 5 min, the agarose was dissolved by microwaving the solution for 2 min. SYBRTM Green II RNA gel stain was then added at a dilution of 1:10,000. The resulting gel solution was poured into a gel tank for solidification. Electrophoresis was carried out at 140 V for 20 min on ice.
5.4. RT-qPCR
The RT-qPCR analysis was carried out utilizing the NEB Luna® Universal One-Step RT-qPCR Kit. Each reaction was conducted in a 20 µL volume, comprising 10 µL of Luna Universal One-Step Reaction Mix, 0.4 µM of each primer (RT_universal_Fr and RT_universal_Rv), 1 µL of 20 × Luna WarmStart® RT Enzyme Mix, and 2 µL of 10 × diluted mRNA. The cycling conditions involved a 10 min incubation at 55 °C for reverse transcription, followed by initial denaturation at 95 °C for 1 min. Subsequently, 40 cycles were performed with denaturation at 95 °C for 10 s and annealing at 60 °C for 30 s. Reactions were run on a Bioer LineGene 9600 Plus machine.
To generate a standard curve, a dilution series of mRNA corresponding to a specific nanobody was used. The initial concentration was determined using NanoDrop UV–Visible Spectroscopy. The quantity of eluted mRNA was then determined by referencing the standard curve.
5.5. Synthetic Nanobody Library Construction
Primers containing randomized regions were created using trimer phosphoramidites (GenScript, Singapore, Singapore). The full-length nanobody nucleotide sequence was divided into seven segments denoted as FR1, CDR1, FR2, CDR2, FR3, CDR3, and FR4. Except for FR3, which was synthesized through a standard PCR procedure, the other six segments were obtained as primers (FR1_Fr, CDR1_Rv, FR2_Fr, CDR2_Rv, CDR3_Fr, FR4_Rv) (
Table S3). These primers were assembled and amplified via overlap extension PCR using Q5 DNA Polymerase (NEB), as depicted in
Figure S2. Each 50 μL overlap extension PCR reaction contained 10 μL of 5 × Q5 reaction buffer, 0.4 mM dNTPs, 0.4 μM forward primer, 0.4 μM reverse primer, and 0.5 μL of Q5 DNA polymerase. The annealing temperatures for the three PCR experiments were 67 °C (CDR3), 67 °C (CDR1), and 60 °C (CDR2). Each reaction consisted of 30 cycles with an extension time of 3 s per cycle. The 3 resulting double-stranded PCR products and FR3 were assembled through another round of overlap extension PCR. This second round involved two sets of PCR conditions to fuse the DNA fragments and amplify the product. To assemble FR3 and CDR3-FR4, the reaction consisted of an initial 5 cycles at 61 °C with a 2 s extension time, followed by 20 cycles at 57 °C with a 3 s extension time. To assemble FR1-CDR1 and FR2-CDR2, the procedure included an initial 5 cycles at 70 °C with a 2 s extension time, followed by 20 cycles at 59 °C with a 3 s extension time. The products obtained from these reactions were then fused using the same overlap extension PCR method (
Figure S2). As the melting temperatures of both the overlap regions and the primers were consistent at 67 °C, the final PCR reaction was streamlined to 20 cycles at 67 °C.
The complete nanobody constructs were subjected to double digestion with BamHI and HindIII, then ligated into similarly double-digested ribosome-display vectors using T4 DNA ligase (NEB). The 300 μL ligation mixture contained 30 μL of 10× T4 ligation buffer, 10 μL T4 DNA ligase, 25 μg of double-digested vector, and 10 μg of double-digested insert. The ligation reaction was carried out at 16 °C for 16 h, after which the T4 ligase was inactivated at 65 °C for 15 min. The ligation mixture was purified using the NEB Monarch® PCR Cleanup Kit. The purified ligation product served as the template for generating the transcription template. The forward primer (T7_transcript_Fr) was designed to anneal upstream of the T7 promoter, and the reverse primer (T7_transcript_Rv) annealed at the 3′ stem loop region. PCR was carried out in a 50 μL reaction comprising 10 μL of 5× Q5 reaction buffer, 0.4 mM dNTPs, 0.4 μM forward primer, 0.4 μM reverse primers, 100 ng of the ligation product, and 0.5 μL Q5 DNA polymerase. The cycling conditions included 20 cycles with an annealing temperature of 70 °C. The PCR products were verified by agarose gel electrophoresis and purified using the QIAGEN gel purification kit.
In vitro transcription reaction was carried out utilizing the RiboMAXTM Large-Scale RNA Production System (T7) from Promega. A 50 μL reaction comprised 10 μL of 5× T7 transcription buffer, 15 μL of rNTPs (25 mM each), 5 μL of Enzyme mix, and 0.8 μg of DNA templates. The reaction was incubated at 37 °C for 2 h. Subsequently, 1 μL of DNase I was added to digest the DNA templates at 37 °C for 15 min. The mRNA was purified using the NEB Monarch® RNA Cleanup Kit, flash-frozen in liquid nitrogen, and stored at −80 °C.
5.6. PURE Ribosome Display Screening
The PUREfrex2.1 Cell-Free Protein Synthesis Kit (GeneFrontier Corporation, Kashiwa, Japan) was used to display synthetic nanobody libraries on ribosomes. Each 10 μL reaction contained 4 μL of Solution I (amino acids, NTPs, tRNAs and substrates for enzymes), 0.5 μL of Solution II (proteins in 30% glycerol buffer), 1 μL of Solution III (20 µM ribosome), 0.5 μL of 10 mM cysteine, 0.5 μL of 80 mM reduced glutathione (GSH), 0.5 μL of 60 mM oxidized glutathione (GSSG), 0.5 μL of 1.875 mg/mL DsbC (disulfide bond isomerase), and 2.5 μL of mRNA solution (approximately 2 μg/μL). After incubation at 37 °C for 30 min, 100 μL of ice-cold biopanning buffer (WTB-BSA: 50 mM Tris-acetate pH 7.4, 150 mM NaCl, and 50 mM magnesium acetate, 0.5% BSA) supplemented with 2.5 μL of 0.2 g/mL heparin solution and 1 μL of SURPEase-InTM RNase inhibitor was added to the ribosome display system and maintained at 4 °C for the subsequent biopanning process. The ribosome display mixture was applied to antigen-coated surfaces and incubated at 4 °C for 1 h with shaking at 30 rpm on a rocker.
Following incubation, unbound or weakly bound components were removed by washing with WTB or WTB-T (50 mM Tris-acetate pH 7.4, 150 mM NaCl, and 50 mM magnesium acetate, 0.1% Tween-20). The washing stringency varied across rounds of panning (
Tables S1 and S2). For bead-based washes, 500 µL of WTB was utilized per wash with 3 pipetting cycles, followed by a 5 min incubation to enable magnetic beads separation. For 96-well plate washes, 300 µL of WTB was used with 3 pipetting cycles and no incubation.
The retained RMP complexes were disassembled using 100 μL of elution buffer (50 mM Tris-acetate pH 7.4, 150 mM NaCl, 50 mM EDTA, 100 µg/mL yeast RNA), and the resulting mRNA was purified using the NEB Monarch® RNA Cleanup Kit. Following optimization, proteins were disassociated from streptavidin by biotin prior to RMP disassembly by EDTA. The purified mRNA was subject to reverse transcription and amplification using the QIAGEN OneStep RT-PCR Kit to produce DNA templates for the next round of selection. Each 50 μL RT-PCR reaction included 10 μL of 5X QIAGEN OneStep RT-PCR buffer, 0.4 mM dNTP mix, 0.6 μM of each primer (RT_universal_Fr, RT_universal_Rv), 2 μL of QIAGEN OneStep RT-PCR Enzyme mix, and 7 μL of eluted mRNA (equivalent to half of the total amount). Reverse transcription was performed at 50 °C for 30 min. PCR amplification followed an annealing temperature of 50 °C for 25 cycles. The resulting PCR products were purified, digested with BamHI and HindIII, and ligated into the ribosome display vector using T4 DNA ligase. Ligation was carried out at 16 °C for 16 h. The purified ligation product was then utilized as the template for PCR to generate the transcription template for the next selection round.
5.7. Single-Clone ELISA Analysis of Potential Binders
Single-clone ELISA analysis was conducted using a MaxiSorp 96-well plate. Each well was coated with 100 µL of 0.01 mg/mL target protein or BSA (used as negative control) in the ELISA coating buffer (50 mM carbonate–bicarbonate buffer, pH 9.6), followed by incubation at 4 °C for 16 h. The plate was then washed three times with 200 µL of PBS and blocked with 200 µL of blocking buffer (2% skimmed milk in PBS) at 25 °C for 1 h. After discarding the initial blocking buffer, 50 µL of fresh blocking buffer was added to each well, and the plate was ready for use.
The RT-PCR products from the final round were ligated into a protein expression vector and transformed into E. coli BL21 cells. Individual clones were cultured and induced in a 96-well deep-well plate (containing 1 mL of medium per well). Protein expression was induced with 200 µM IPTG at 20 °C for 16 h. Following induction, cells were harvested by centrifugation at 500× g for 10 min and then resuspended in 200 µL of resuspension buffer (PBS supplemented with 2 mM EDTA, and 0.1% Triton X-100). The cell resuspension underwent one freeze–thaw cycle, with incubation at −80 °C for 10 min followed by 37 °C for 10 min. Subsequently, 20 µL of freshly prepared lysozyme solution (10 mg/mL) was added to each well, and the plate was incubated at 37 °C for 30 min. A second freeze–thaw cycle was performed to further lyse the E. coli cells. Following this, 0.02 units of DNase I in 100 mM MgCl2 solution was added to each well, and the plate was incubated at 25 °C for 15 min. Finally, the plate was centrifuged at 3500× g for 30 min to separate the soluble and insoluble fractions.
The supernatant, containing nanobodies tagged with 6-histidines, was transferred to the wells coated with either target proteins or BSA. After 1 h of incubation, the wells were washed three times with 200 µL of PBS-T (0.1% Tween-20). Next, 100 µL of a 1:10000 dilution HisProbeTM-HRP (Thermo Scientific, Singapore, Singapore) in PBS was added to each well and incubated for 1 h. Excess probe was removed by three additional washes with 200 µL of PBS-T (0.1% Tween-20). Then, 100 µL of the 1-step TMB ELISA substrate solution (3,3′,5,5′-Tetramethylbenzidine, Thermo Scientific) was added to each well and incubated at room temperature for 15 min. Finally, the chromogenic reaction was stopped by adding 2 M sulfuric acid, and the absorbance was measured at 450 nm.
5.8. Pull-Down Assay
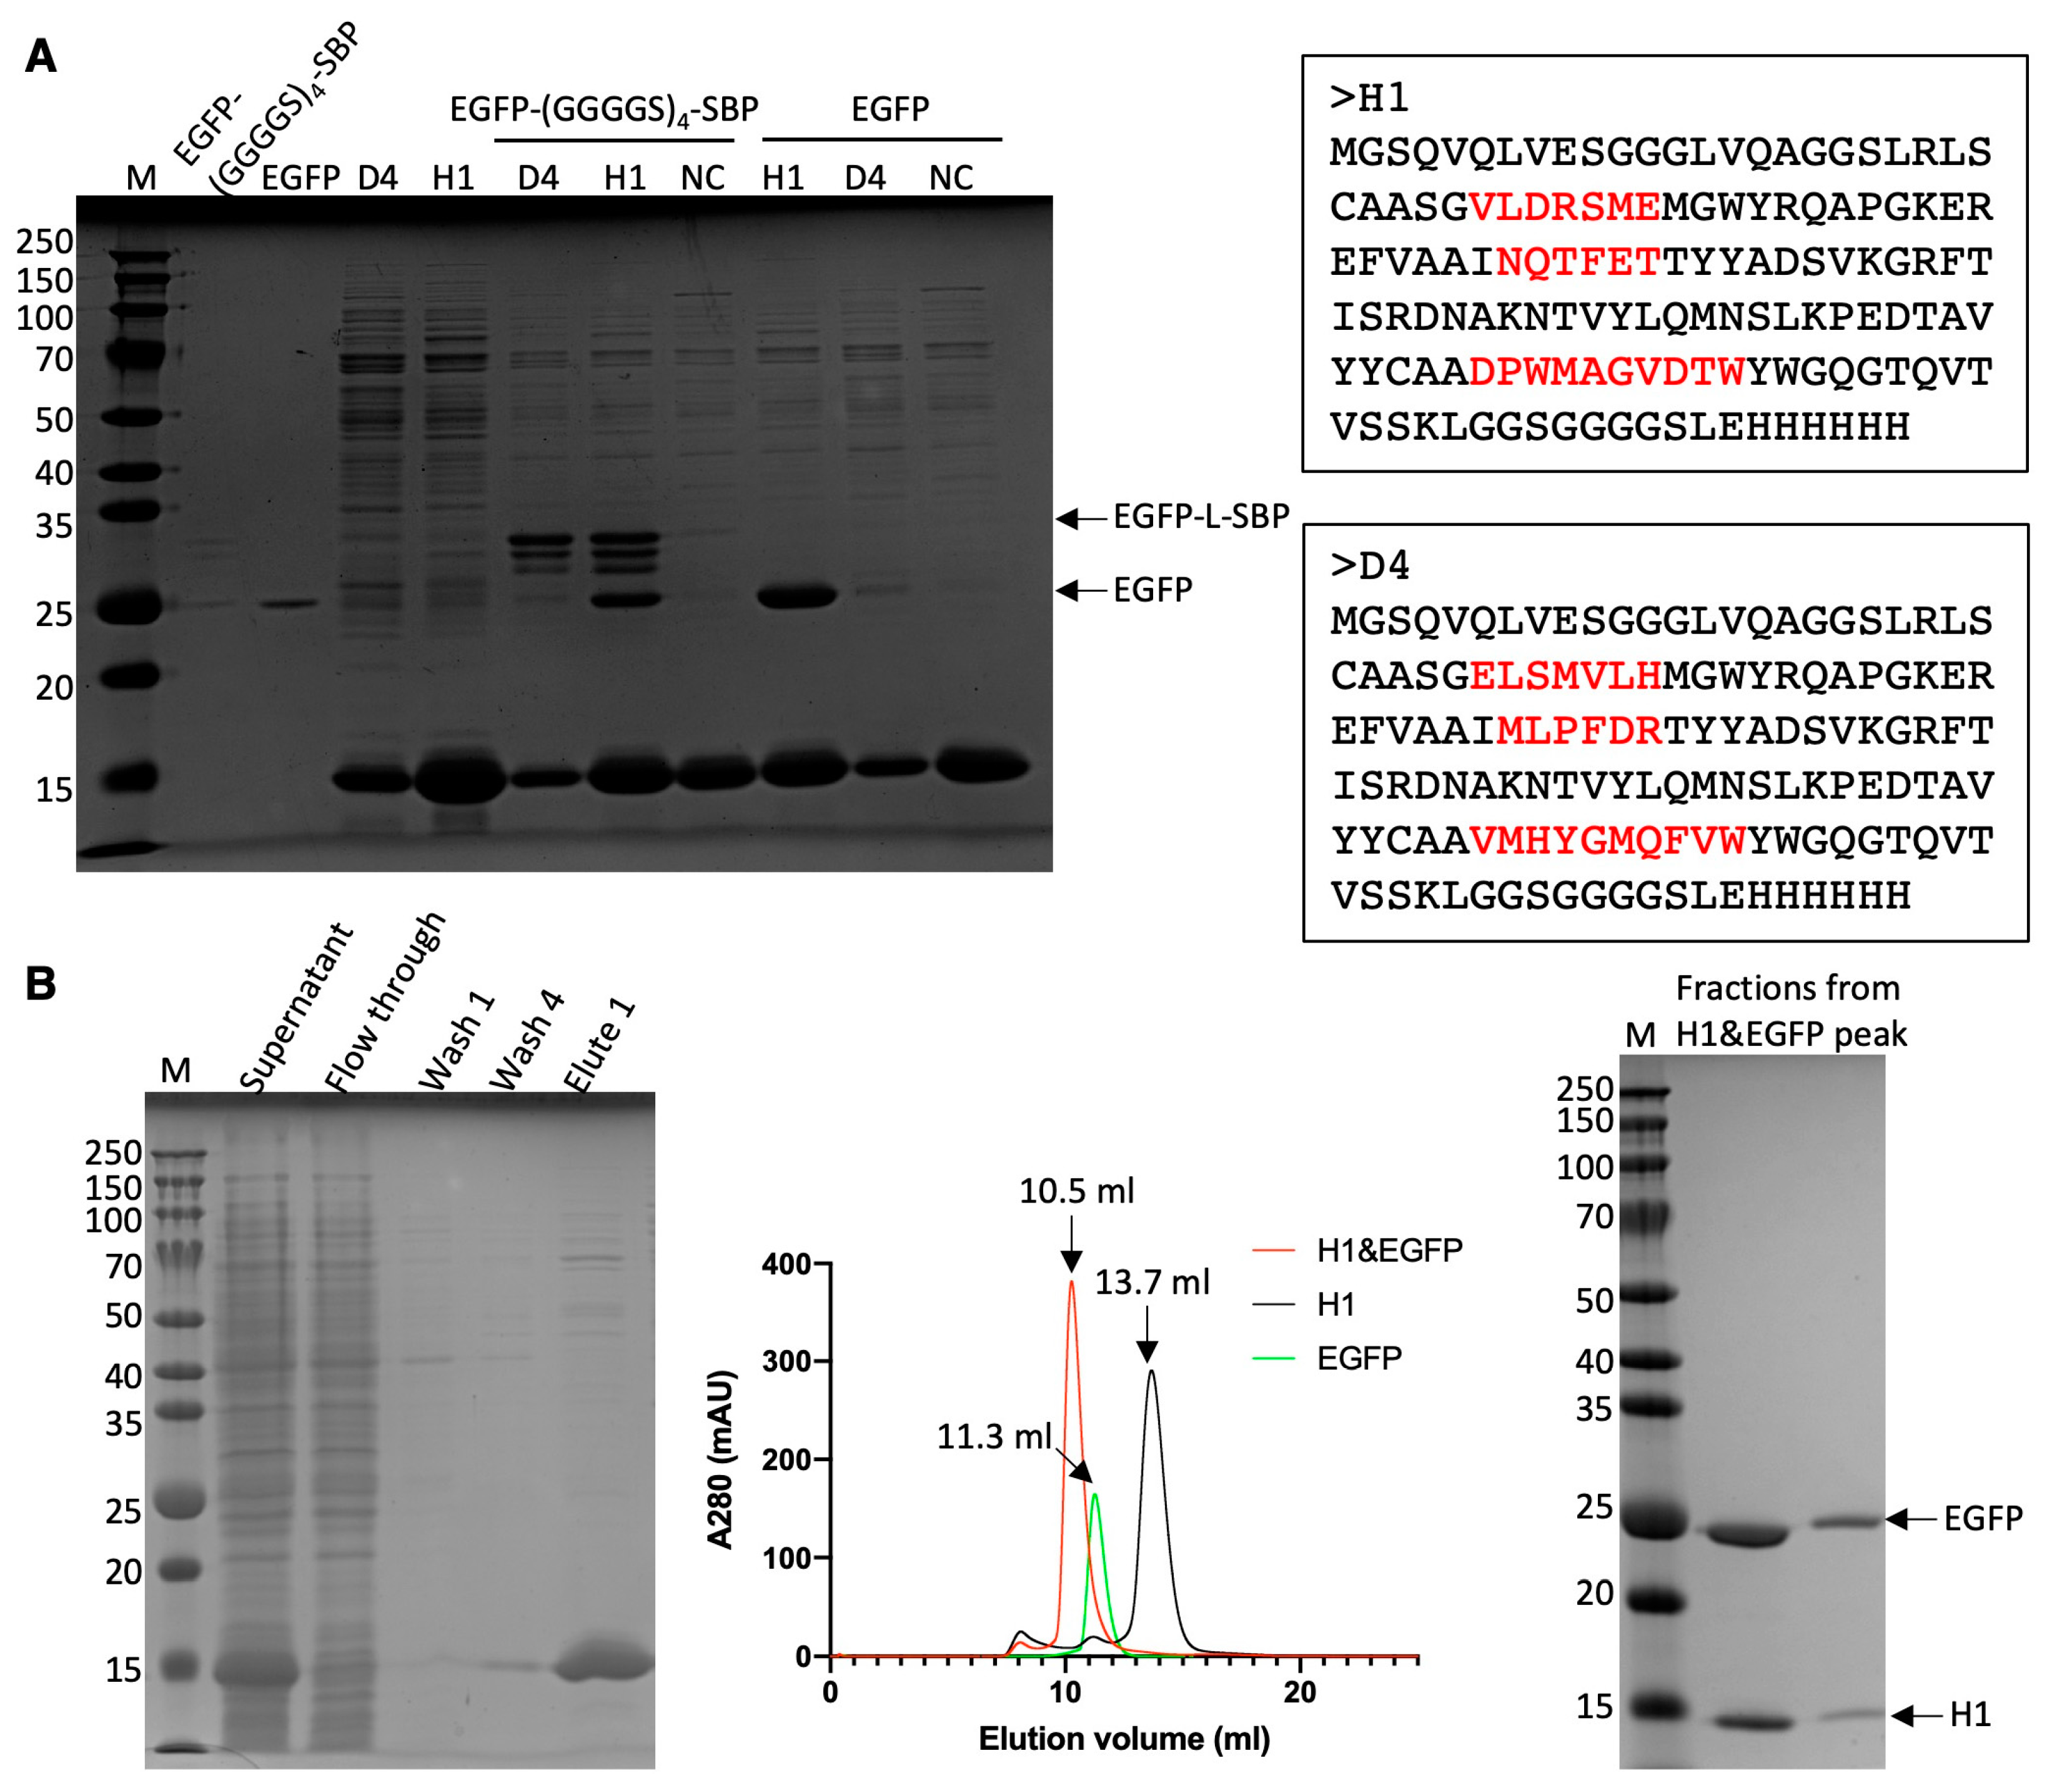
Candidate binders identified via the single-clone ELISA experiments were upscaled in a 10 mL cell culture for further binding analysis. The resulting cell pellet was resuspended in 1 mL of PBS and subjected to sonication for 60 s (25% sonication amplitude with 1 s on/off intervals). A 300 µL aliquot of the resulting supernatant was mixed with 20 µL of Ni-NTA agarose resin to selectively capture His-tagged nanobodies. Unbound proteins or impurities were removed through four washes with 500 µL of PBS (with 10 mM imidazole included in the 3rd and 4th washes). Subsequently, 100 µL of target protein solution (approximately 0.2 mg/mL) was added to the nanobody-coated beads. After three additional washes with 500 µL of PBS (with 10 mM imidazole in the 3rd wash) to eliminate non-specific binding, bound proteins were eluted using 50 µL of PBS containing 200 mM imidazole. The eluted fractions were then analyzed by SDS-PAGE to assess protein composition.
5.9. Isothermal Titration Calorimetry
The binding affinities between the identified nanobodies and their respective target proteins were evaluated using a MircoCal PEAQ ITC instrument at 25 °C. After gel filtration chromatography, both nanobodies and target proteins were exchanged into the same buffer (PBS). Protein concentrations were determined using a NanoDrop UV–Visible Spectrophotometer. Target proteins were loaded into the cell holder at a concentration of 10 µM, while the nanobodies were loaded into the syringe at 150 µM. The experimental protocol included an initial injection of 0.4 µL, followed by 19 injections of 2 µL each, with 150 s intervals between the injections. The stirring speed was set at 500 rpm. Subsequently, the raw data were processed and then fitted to a one binding site model.


