1. Introduction
Bispecific antibodies (BsAb), which combine specificities of two antibodies, have become the most promising classes of therapeutic antibodies. As referenced by [
1], there is a limitless domain of innovative design for these molecules because of molecular engineering involving the association of different types of binding molecules, the combination of two different heavy chain/light chain variable domains (VH/VL), but also molecules such as the single-chain variable fragment (scFv) and the camelid heavy chain variable domain (V
HH) associated together or with an antibody (Ab) shape. The unique ability to tether two antigen specificities into a single protein structure has allowed for new therapeutic strategies and opened a new field of fundamental knowledge in immunology. The only limitation is the structural protein biological laws that determine the optimal 3D shape of the functional bispecific Ab. Such molecule configurations that already have US Food and Drug Administration or European Medicines Agency agreement demonstrated the possibility to target both tumors and T cells [
2], bridging two enzymes to offset the missing catalytic factor [
3] or modulating the immune response by capturing cytokines that are both a cause and an amplifying factor of inflammation mechanisms in autoimmune diseases [
4]. According to the number of BsAbs patented or in development [
5], their interest is validated and their growing development will support new therapeutic strategies and a significant increase in knowledge of immunology.
In addition to BsAbs that could be said to be conventional, many other molecules have binding properties that could be judiciously used in combination, or not, with Abs [
6]. These molecules are able to bind to other molecules, such as VHH lipocalins, adnectins, aptamers, or DARPins with a non-immunoglobulin scaffold for the last four families [
7,
8]. All of these molecules together can be considered as “engineered affinity proteins” and could be a breeding ground for new antigenic specificities or new formats such as lipocalins. Lipocalins are a group of circulating, abundant, extracellular proteins [
9]. In humans, 12 different lipocalins have been identified and serve to transport hydrophobic or chemical molecules in blood and lymph. These molecules are characterized by a structurally conserved rigid α-barrel structure and four flexible loops. In particular, the anticalins have been reprogrammed from lipocalins by protein engineering based on their structural similarity with the combining site of immunoglobulins (Igs). Some companies have already understood the potential of merging anticalins with monoclonal antibodies (mAbs). Pieris Pharmaceuticals, has a huge pipeline to develop molecules against cancer, asthma and COVID-19 pathogens. A large number of anticalins have been developed by combinatorial protein engineering; they present various antigen specificities, such as against vascular endothelial growth factor A [
10] or the plant digoxigenin [
6]. With their small size and high affinity, these molecules are suitable tools for diagnosis [
11] and new therapeutic developments [
12].
Regarding the potential value of merging an anticalin with an antibody shape, we attempted to use anticalins to design a BsAb with a new shape. Such molecules were readily produced in mammalian expression systems and exhibited favorable biophysical properties [
13]. We chose the well-known trastuzumab (TTZ) and rituximab (RTX) mAbs and connected them at C- or N-terminal of each light (L) and heavy (H) chain, an anticalin molecule specific for the EB domain of human fibronectin (Fn) and the anticalin N7A (ACFn) [
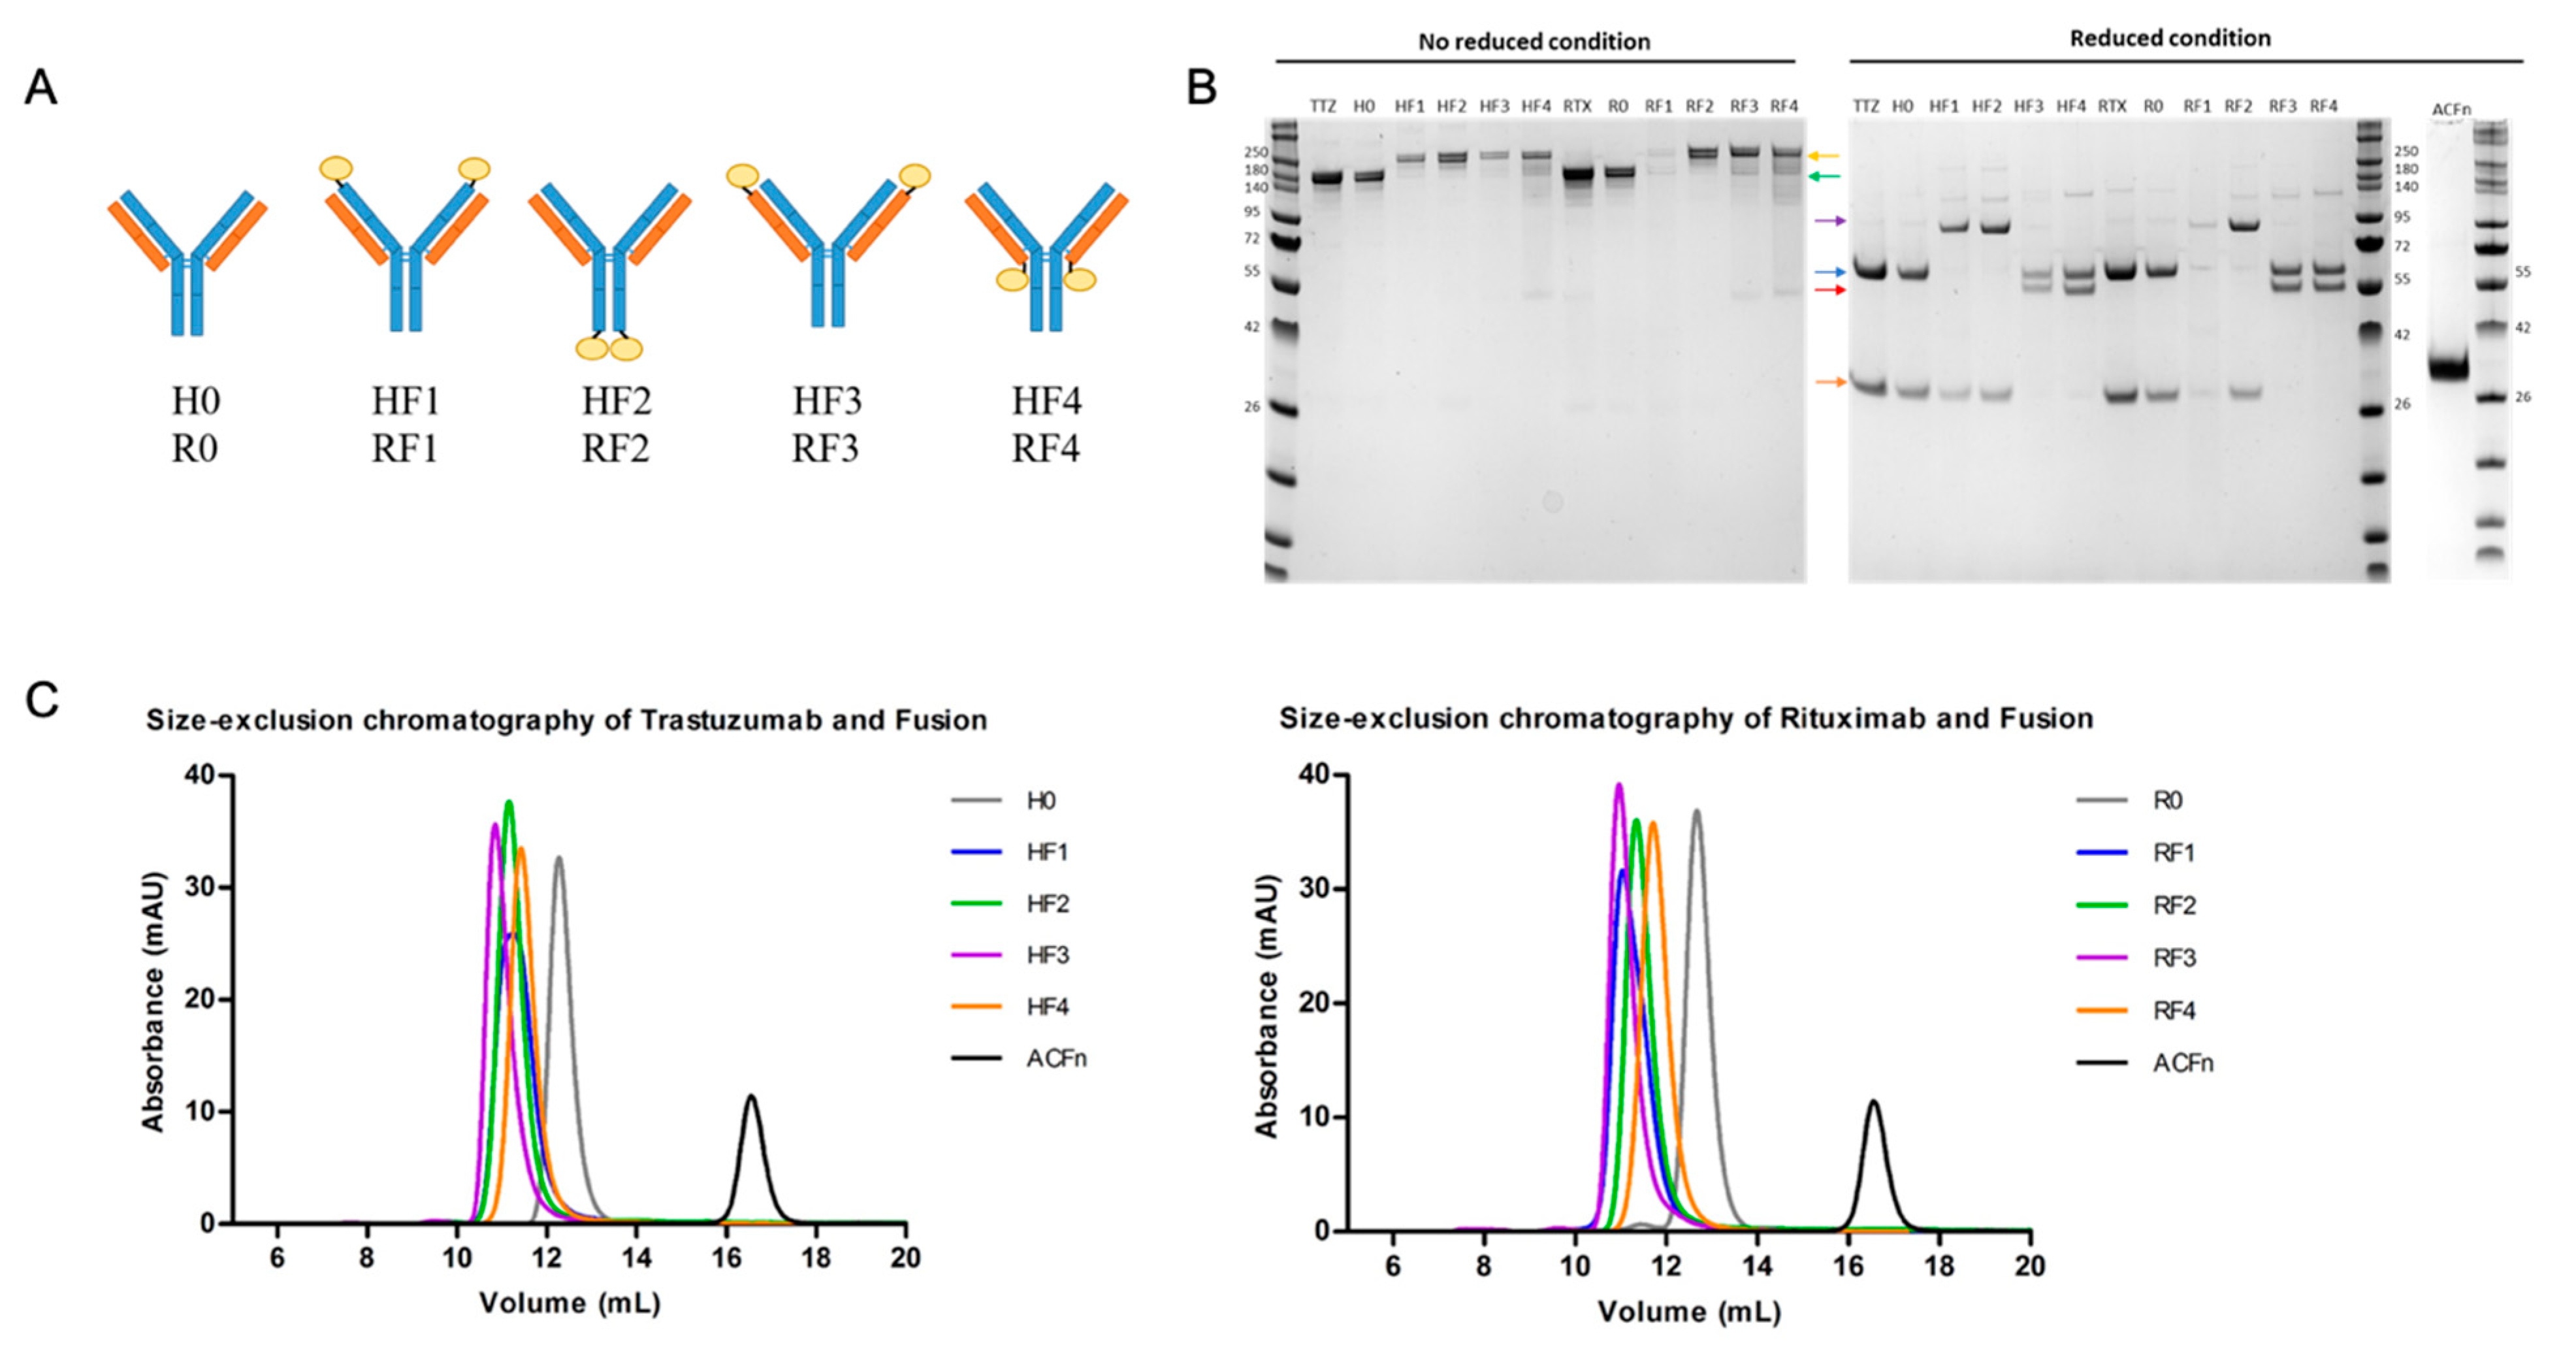
14]. A priori, these positions may have different effects on mAb functional properties. Indeed, the anticalin linked on the N-terminal of both L and H chains (i.e., in the vicinity of the paratope) could strongly influence the antigen binding of the mAb. In the same way, the anticalin linking the C-terminal of H or L chains (i.e., at the end of the Fc or in the vicinity of the hinge region) could affect Fc-dependent properties. Finally, whatever the position, the linking of the anticalin could affect the anticalin functional properties, especially its ability to bind to its cognate ligand. Therefore, all these positions were evaluated, which led to building eight different molecules (four for each therapeutic Ab). We examined the biophysical properties of the novel molecules, such as their thermostability and characterized their higher-order structure, as well as binding to their target antigens. Particular attention was paid to their capacity to bind to FcγRs such as CD16A, CD32A and FcRn because of the functional properties that result from it, in particular the ability of the hybrid molecules (BsAbs) to induce effector mechanisms such as functional responses of natural killer (NK) cells, CD32A-dependent phagocytosis by macrophages and FcRn-dependent transcytosis. In summary, this work seeks to understand the best position for an anticalin to fuse to an Ab format with respect to the functionality of the BsAb so formed.
2. Materials and Methods
2.1. Design and Construction
The anticalin selected in this study was the neutrophil gelatinase-associated lipocalin protein N7A [
14]. The sequence from the protein data bank is QDSTSDLPAPPLKVPLQQNFQDNQFHGKWVVGKAGNHDLREDKDPRMQATYELKEDKSYNVTNVRFVHKKCNYRIWTFVPGSQPGEFLGNIKSWPGLTSWLVRVVSNYNQHAMVFFKRVYQNRELFEITLYGRTKELTNELKENFIRFSKSLGLPENHIVFPVPIDQCIDG. For anticalin purification, a twin strep-tag was added at the C-terminal position (SAWSHPQFEKGG-GSGGGSGGSAWSHPQFEK). The corresponding gene was synthesized and cloned in pcDNA3.4 by using GeneArt (Thermo Fisher Scientific, Waltham, MA, USA). The heavy (H) and light (L) chains of TTZ (H0) and RTX (R0) were synthesized and cloned in pcDNA3.4 by using GeneArt (Thermo Fisher Scientific, Waltham, MA, USA). We obtained four plasmids: pcDNA3.4-HH, pcDNA3.4-HL, pcDNA3.4-RH, pcDNA3.4-RL for H and H chains of TTZ and H and L chains of RTX, respectively. Anticalin was fused on the H or L chain of each antibody at the N-terminal or C-terminal position with the linker “GGGGS GGGGS GGGGS”. For generating the plasmid pcDNA3.4-fusion, the golden gate technique was used (New England Biolabs). The genes were amplified by PCR with suitable primers, and ligations involved using BsaI-HF v2 (New England Biolabs). Eight plasmids were obtained: pcDNA3.4-ACFn-HH, pcDNA3.4-HH-ACFn, pcDNA3.4-ACFn-HL, pcDNA3.4-HL-ACFn and pcDNA3.4-ACFn-RH, pcDNA3.4-RH-ACFn, pcDNA3.4-ACFn-RL, pcDNA3.4-RL-ACFn. TG1 chemically competent bacteria were transformed with the newly-formed plasmids and constructions were validated by sequencing.
2.2. Expression and Purification
All proteins were produced by transient transfection of ExpiCHO cells with the max titer protocol as described in the Thermo Fisher manufacturer’s protocols. Briefly, cells were grown in ExpiCHO Expression Medium and maintained in a humidified incubator with 8% CO2 at 37 °C with shaking. Before the transfection (day-1), cell concentration was adjusted to 4.106 viable cells/mL and incubated overnight in culture growth conditions. On the next day (day 0), cell culture was diluted to 6.106 cells/mL and ExpiFectamine CHO–DNA complexes were added slowly to a flask with gently swirling. For Abs, the proportion of H and L chains were determined with a 1:3 ratio. The expression enhancer was added at 18 h to 22 h post-transfection, and the flask was placed at 32 °C with 5% CO2. An additional expression feed was added on day 5, and cells were harvested at about day 10 post-transfection. Cell viability was measured by using CytoSMART (Corning) and cells were centrifuged at 10,000× g for 10 min. Clarified supernatants were stored at −20 °C until purification.
For purification of antibodies, samples were deep-frozen, centrifuged at 10,000× g for 20 min and passed over a 0.22-µm filter. All supernatants were passed over the HiTrap Protein A HP column (Cytiva, 17040301) in the ÄKTA pure protein purification system and equilibrated with phosphate buffered saline (PBS) buffer (2.7 mM KCl, 0.10 M NaCl, 2 mM KH2PO4, 8 mM Na2HPO4, pH 7.4). The column was washed with four column volumes of PBS, and proteins were eluted with 0.1 M citrate, pH 3.
For purification of anticalin, samples were deep-frozen and dialyzed overnight at +4 °C in binding buffer (20 mM NaH2PO4, 280 mM NaCl, 6 mM KCl, pH 7.4), centrifuged at 1000× g for 20 min and filtered with a 0.22-µm filter. All supernatants were passed over a StreTrap HP column (Cytiva, 28907546) in the ÄKTA pure protein purification system and equilibrated with binding buffer. The column was washed with four column volumes of PBS-ST, and protein was eluted with elution buffer (2.5 mM desthiobiotin in binding buffer).
The proteins were desalted through the HiPrep 26/10 desalting column (Cytiva Life sciences, Marlborough, MA, USA) in PBS buffer. The concentration was determined with a UV detector at 280 nm. Protein molecular mass and molar extinction coefficient data were generated by using the Protparam tool (
http://web.expasy.org/protparam/ (accessed on 1 April 2018)).
Proteins were concentrated by centrifugation using Amicon Ultra (Merk Millipore, Molsheim, France) 30 kD until a molarity of about 30 µM was obtained for Abs and fusions and with Amico Ultra 10 kD (Merk Millipore, Molsheim, France) until a molarity of about 10 µM was obtained for anticalin. Proteins were filtered with a 0.22-µm filter and stored at +4 °C before analysis. For long-term storage, proteins were kept at −20 °C.
2.3. Biophysical Characterization
2.3.1. SDS-PAGE
The integrity of all purified proteins was assessed by SDS-PAGE on homogeneous 10% polyacrylamide gel under reducing or non-reducing conditions. Samples were all loaded at 1 µg for anticalin, 3.8 µg for H0 and R0 and 5 µg for mAbs or BsAbs, for Coomassie blue staining. ProSieve QuadColor Protein Markers (Lonza, Fribourg, Switzerland) were used. For anticalin, after migration in a SDS-PAGE gel, proteins were transferred onto nitrocellulose membranes (Invitrogen, Carlsbad, CA, USA), which were blocked with 5% non-fat milk diluted in TNT (15 mM Tris–HCl, 140 mM NaCl, 0.05% Tween 20) overnight at +4 °C with shaking, then incubated for 1 h 30 min at room temperature with Strep-Tactin AP Conjugate (IBA-Lifesciences, Gottingen, Germany) diluted 1:1000 in 5% milk-TNT. After washes with TNT, alkaline phosphatase activity was detected by using BCIP/NBT substrate (Promega, Chicago, IL, USA).
2.3.2. Size-Exclusion Chromatography-High Performance Liquid Chromatography (SEC-HPLC)
The purified proteins were analyzed by SEC-HPLC on a Superdex 200 Increase 10/300 GL column (Cytiva Life sciences) with an Akta purifier. The column was loaded with 100 µL of 5 µM for each protein (20 µg for anticalin, 109 µg for H0, 142 µg for HF1 to HF4, 108 µg for R0 and 141 µg for RF1 to RF4) and was eluted with PBS at 0.4 mL/min. Protein was detected with a UV detector at 280 nm. Volume of elution and percentage of peak area were determined for analysis of monomeric antibodies.
2.3.3. Thermal and Aggregation Analysis
Prometheus NT.48 was used to measure the thermal unfolding profiles of proteins by differential scanning fluorimetry experiments (Prometheus NT.48, NanoTemper, Munich, Germany). All samples were used at a final concentration of 10 µM and loaded into high-sensitivity capillaries (Nanotemper, Munich, Germany). The protein unfolding process was subjected to a thermal ramp (20–95 °C, 1 °C/min). Data analysis involved using Prometheus PR ThermControl software (NT. 48, NanoTemper, Munich, Germany). The Tm value was determined by fitting the tryptophan 350/330 nm fluorescence emission ratio using a polynomial function in which the maximum slope is indicated by the peak of its first derivative.
2.3.4. Mass Spectrometry (MS)
Characterization of Abs was performed by high-resolution MS using an Acquity UPLC H-Class system coupled with a Vion IMS QT mass spectrometer, both from Waters (Waters, Wilmslow, UK). Before MS analysis, 800 ng Ab was injected onto a XBridge Protein BEH C4 2.1 × 30 mm, 1.7-μm column heated to 90 °C. A desalting step was carried out with 95% solvent A (H2O + 0.1% formic acid) and 5% solvent B (acetonitrile + 0.1% formic acid) during 2 min at 0.5 mL/min, with the flow diverted to waste. After that, a 3 min gradient from 5% to 50% of solvent B then a gradient from 50% to 90% of solvent B was applied at a 0.4 mL/min flow rate to elute the sample with the flow diverted to MS. MS data were acquired in positive ionization mode with an ESI source over a 500- to 4000-m/z window with 1-Hz scan. Voltage capillary was set to 2.5 kV; desolvation temperature and source temperature to 600 °C and 120 °C, respectively; and cone voltage 150 V. The results were processed by using Waters (Milford, MA, USA), software UNIFI v1.9.4 and the MaxEnt1 algorithm was used for deconvolution.
2.3.5. Interferometry
Affinities of constructs were measured by biolayer interferometry (BLI) with an RED96 Octet system (ForteBio Sartorius, Hamburg, Germany) at 25 °C with 0.1 M phosphate buffer, 150 mM NaCl, and 0.05% Tween 20 at pH 7.4 as running buffer. For H0 and HF1-4 BsAbs, recombinant Her-2 (12.5 μg/mL) was immobilized on penta-His biosensors, then H0 or BsAbs were associated (300-s concentrations of 400, 200, 100, 50 and 0 nM). Then dissociated (300 s) before regeneration with glycine 10 mM at pH 1.5. For ACFn, RF1-4 and HF1-4 BsAbs, recombinant fibronectin (FN) (5–20 μg/mL) was immobilized on penta-His biosensors, and the variants were associated (600-s concentrations of 200, 100, 50, 25 and 0 nM), then dissociated (600 s) before regeneration (glycine 10 mM, pH 1.5). For data analysis, the 0 nM wells were used as a reference, the y-axis was aligned on the last second of the baseline, the interstep correction was based on dissociation, and the fitting followed a 1/1 model during the first 10 s of dissociation. Resulting KD (affinity) values were determined from the aligned and referenced sensograms in Data Analysis HT10.0 software with reported values as the mean of ≥5 independent runs.
2.4. Affinity Measurement
2.4.1. Affinity to CD16
Human CD16A (FcγRIIIA-V158)-transduced NK92 (NK92-CD16A) cells (kindly provided by Dr. B. Clemenceau, INSERM CR 1232 CRCINA, Nantes, France) were grown in RPMI 1640 culture medium (Sigma-Aldrich, St. Louis, MO, USA) supplemented with 10% heat-inactivated fetal bovine serum (FBS; Dominique Dutscher, Brumath, France), 1 mM sodium pyruvate (Invitrogen, Carlsbad, CA, USA); 50 units/mL penicillin (Sigma-Aldrich, St. Louis, MO, USA); and 50 μg/mL streptomycin (Sigma-Aldrich, St. Louis, MO, USA) and 100 UI/mL IL-2 (Proleukin) (Chiron Corp, Emeryville, CA, USA.).
NK92 hCD16V cells were used to analyze CD16A binding in competition experiments. NK92 hCD16V cells were first incubated with increasing concentrations of the mAbs or BsAbs of interest for 30 min at 4 °C. Then NK92 hCD16V cells were incubated with anti-CD16 antibody (3G8 clone) labeled with FITC (Beckman Coulter, Brea, CA, USA). The mean fluorescence intensity (MFI) was measured by flow cytometry to determine the percentage of inhibition binding on NK92 hCD16V cells. Flow cytometry was performed on a Cytoflex S flow Cytometer (Beckman Coulter, Brea, CA, USA) with FlowLogic software 7 (Miltenyi Biotec, Paris, France).
Results are expressed as a percentage of anti-CD16-FITC inhibition binding. The point with anti-CD16-FITC alone was considered 100% binding. Cells stained by isotype antibody-labeled FITC (Beckman Coulter, Brea, CA, USA) were used to evaluate Ab non-specific binding. Results were calculated as a percentage of the ratio of anti-CD16-FITC minus isotype-FITC and mAb (X) MFI.
2.4.2. Affinity to CD32
The THP1 cell line was maintained in RPMI 1640 culture medium (Sigma-Aldrich, St. Louis, MO, USA), supplemented with 10% heat-inactivated FBS (Dominique Dutscher, Brumath, France), 2 mM L-glutamine (Sigma-Aldrich, St. Louis, MO, USA), 1 mM sodium pyruvate (Invitrogen, Carlsbad, CA, USA), 500 units of 0.5 mg/mL penicillin-streptomycin (Sigma-Aldrich, St. Louis, MO, USA) and 50 µM 2-mercaptoethanol (Serva, Heidelberg, Germany). THP1 cells were first incubated with increasing concentrations of the mAbs or BsmAbs of interest for 30 min at 4 °C, then incubated with anti-CD32 antibody (clone IV.3) FITC-labeled (Stemcell, Vancouver, BC, Canada). MFI was measured by flow cytometry to determine the percentage of inhibition binding on THP1 cells. Flow cytometry was performed on a Cytoflex S flow Cytometer (Beckman Coulter, Brea, CA, USA) with FlowLogic software (Miletnyi Biotec, Paris, France). Results are expressed as the percentage of anti-CD32-FITC inhibition binding. The point with anti-CD32-FITC alone was considered 100% binding. Cells stained by isotype antibody FITC-labelled (Stemcell, Vancouver, BC, Canada) were used to evaluate Ab non-specific binding. Results were calculated as a percentage of the ratio of anti-CD32-FITC minus isotype-FITC and mAb (X) MFI.
2.4.3. Affinity to FcRn
JurkatΔFcRn cells were obtained by stable transfection of the Jurkat cell line (ATCCrg TIB-152TM) with a plasmid containing the human FcRn (hFcRn) sequence deleted from 99 nt corresponding to the 33 aa of the C-terminal protein. The Jurkat cell line was maintained in RPMI 1640 culture medium (Sigma-Aldrich, St. Louis, MO, USA) supplemented with 10% heat-inactivated FBS (Dominique Dutscher, Brumath, France), 2 mM L-glutamine (Sigma-Aldrich, St. Louis, MO, USA), 500 units of 0.5 mg/mL penicillin-streptomycin (Sigma-Aldrich, St. Louis, MO, USA), and 1 mg/mL G418 (Thermofisher Scientific, Waltham, MA, USA) was added for JurkatΔFcRn cells.
RTX was conjugated to Alexa Fluor 488 fluorescent dye (rituximabAF488) by using the Ab labeling kit (Thermofisher Scientific, Waltham, MA, USA), according to the manufacturer’s instructions. RituximabAF488 was used at 4 μg/mL in competition with unlabeled RTX (R0), TTZ (H0), or the BsmAbs of interest at 0.04- to 30-µM concentrations to evaluate FcRn binding. Jurkat and JurkatΔFcRn cells were mixed in a 1:1 ratio. In a microtitration 96-well plate, 4 × 10⁴ cells/well were suspended in HBSS (PAN Biotech, Aidenbach, Germany) adjusted to pH 6 with MES (Sigma-Aldrich, St. Louis, MO, USA) and incubated 30 min at 4 °C with rituximabAF488 and the different mAbs or BsAbs at increased concentrations. MFI was measured by flow cytometry (Cytoflex S, Beckman Coulter, CA, USA). FlowLogic software (MiltenyiBiotec, Paris, France) was used for analysis. Results are expressed as the percentage of rituximabAF488 inhibition binding. The point with rituximabAF488 alone was considered 100% binding. Untransfected Jurkat cells (WT) were used to evaluate Ab non-specific binding. Results were calculated as a percentage of the ratio of mAb (X) MFI JurkatΔFcRn/JurkatWT and rituximabAF488 MFI JurkatΔFcRn/JurkatWT.
2.4.4. Affinity to Target Antigens
Competition assays were set up with fluorescent RTX on Daudi cells expressing CD20 and with fluorescent TTZ on SK-BR-3 cells positive for Her2. Rituximab
AF488 (see
Section 2.4.3) was used at 1 μg/mL in competition with unlabeled R0 or RF1-4 at 0.2- to 250-fold rituximab
AF488 concentrations. TTZ was conjugated to Alexa Fluor 488 fluorescent dye (trastuzumab
AF488) by using the Ab labelling kit (Thermofisher Scientific, Waltham, MA, USA), according to the manufacturer’s instructions. Trastuzumab
AF488 was used at 0.1 ug/mL in competition with unlabeled H0 or BsAbsat 0.2- to 250-fold trastuzumab
AF488 concentration. Daudi cells (4.10
4 cells) and SK-BR-3 cells (4.10
4 cells) were resuspended in culture medium and incubated with rituximab
AF488 and trastuzumab
AF488 respectively and/or the different mAbs at various concentrations.
After 30 min at 4 °C, MFI was evaluated by flow cytometry (Cytoflex S) and analyzed with FlowLogic. Results are expressed as the MFI of rituximabAF488 binding inhibition on Daudi cells or trastuzumabAF488 binding inhibition on SK-BR-3 cells. RituximabAF488 or trastuzumabAF488 alone were considered 100% binding for determining the percentage of inhibition binding.
2.5. Functional Analyses
2.5.1. Cell Culture
The Daudi cell line (ATCC Cat#CCL-213) and SK-BR-3 cell line (ATCC Cat#HTB-30) were used for experiments targeting CD20 and HER2, respectively. Daudi cells were cultured in RPMI-1640 (Sigma-Aldrich, St. Louis, MO, USA) containing 10% FBS (Dominique Dutscher, France), 100 U/mL penicillin and 100 µg/mL streptomycin (Sigma-Aldrich, St. Louis, MO, USA). SK-BR-3 cells were maintained in DMEM Glutamax culture medium (Thermo Scientific, Waltham, MA, USA) containing 10% FBS (Dominique Dutscher, France), 100 U/mL penicillin and 100 µg/mL streptomycin (Sigma-Aldrich, St. Louis, MO, USA).
MDCKII cells expressing human FcRn [
15] were maintained in RPMI 1640 culture medium (Sigma-Aldrich, St. Louis, MO, USA) supplemented with 10% heat-inactivated FBS (Dominique Dutscher, Brumath, France), 2 mM l-glutamine (Sigma-Aldrich, St. Louis, MO, USA), 500 units of 0.5 mg/mL penicillin-streptomycin (Sigma-Aldrich, St. Louis, MO, USA) and 4 mg/mL G418 (Thermofisher Scientific, Waltham, MA, USA).
2.5.2. Phagocytosis
To prepare peripheral blood mononuclear cells (PBMCs), whole blood was diluted with PBS. Density gradient separation of blood involved using Lymphoprep (Eurobio, 91940 Les Ulis, France). Tubes were centrifuged at 450× g for 25 min at 25 °C degrees, then cell layers (buffy coat) were immediately collected and transferred to 50 mL conical tubes, resuspended with PBS and centrifuged at 300× g for 10 min at 25 °C.
CD14+ cells were sorted by positive selection from PBMCs by using CD14 MicroBeads and a MS Column, according to the manufacturer recommendations (Miltenyi Biotec, Germany). CD14+ cells were cultured in X-VIVO culture medium (Thermo Scientific, Waltham, MA, USA) supplemented with M-CSF at 60 ng/mL (Miltenyi Biotec, Paris, France). Medium with added M-CMF was changed 3 days later for differentiation to macrophages. At day 6, SKBR3 or Daudi cells stained with CFDA-SE (Stemcell, Vancouver, BC, Canada) were incubated with CD14+ cells differentiated in a 1:1 ratio (E:T) in the presence of the cytokine interleukin 10 (IL-10; 1/500; Stemcell, Vancouver, BC, Canada), with mAbs at 10 µg/mL for 3 h at 37 °C, 5% CO2. Then cells were stained with viability-fixable violet dead cell marker (ThermoFisher, Waltham, MA, USA) and anti-CD64 APC-Vio770-labelled antibody (Miltenyi Biotec, Bergisch Gladbach, Germany) for 20 min at 4 °C. The MFI was analyzed by FCM on at least 5 × 10⁴ cells.
2.5.3. Transcytosis
Transcytosis experiments were performed as described (Ternant et al. 2016), with the following modifications. Briefly, MDCKII cells expressing human FcRn (7.5.10
4 cells/well, 3 wells for each condition) were seeded in 96-well Transwell plates (0.4 µm, Merck Milliport, Burlington, MA, USA) with 75 µL and 250 µL growth medium in the inner and outer chambers, respectively. After 2 days, rituximab
AF488 (see
Section 2.4.3) was introduced in the outer chambers at 20 μg/mL in the presence of unlabeled RTX or TTZ or the mAbs or BsAbs to be tested (15.63–1000 µg/mL) in HBSS– 0.67% gelatin (Sigma-Aldrich, St. Louis, MO, USA) adjusted to pH 6 with MES (Sigma-Aldrich, St. Louis, MO, USA) for 2 h at 37 °C, 5% CO
2. Then, supernatants were removed from the apical pole and transferred into black 384-well plates (Dominique Dutscher, Brumath, France). Fluorescence was measured by microplate reader (Mithras LB940, Berthold, Germany). Wells containing rituximab
AF488 alone were considered 100% mAb transcytosis. Results (mean of triplicate) are expressed as inhibition of rituximab
AF488 transcytosis.
2.5.4. CD16A-Dependent Functional Responses
To evaluate CD16A-dependent functional responses, NK92 hCD16V (see
Section 2.4.1) effector cells were incubated with target cells. NK92 hCD16V (5 × 10
4 cells) were incubated for 4 h with Daudi or SK-BR-3 cells (E:T 1:2) in the presence of 10 µg/mL of mAbs or BsmAbs at 37 °C, anti-CD107a mAb and 0.1 µg/mL BD GolgiPlug containing Brefeldin A (BD Biosciences, San Jose, CA, USA) at 37 °C in 5% CO2 humidified air. Cells were then stained with anti-CD16 and anti-CD56 Abs for 30 min at 4 °C, then fixed and permeabilized by using the BD Cytofix/cytoperm Plus Kit (BD Biosciences, San Jose, CA, USA) and stained for intracellular interferon γ (IFN-γ) for 30 min at 4 °C. The following Abs were used: APC Alexa Fluor 750-conjugated anti-CD16 (clone 3G8), ECD-conjugated anti-CD56 (clone N901), PE-conjugated anti-IFN-γ (clone 45.15) and isotype control (Beckman Coulter, CA, USA), PC5-conjugated anti-CD107a (clone H4A3) and isotype control (BD Biosciences). Functional responses and MFI of each fluorochrome of cell subsets were analyzed by FCM.
2.6. Statistics
All data are presented as mean ± SD unless otherwise stated. Statistical and graphical analyses involved using Graphpad Prism (GraphPad Software, San Diego, CA, USA). Statistical significance was determined by one-way ANOVA to compare differences among multiple groups. p < 0.05 was considered statistically significant.
4. Discussion
In this work, we evaluated the different positions of an anticalin on Ab shape to analyze the advantages of this BsAb format in terms of simplicity of construction and modularity of the different partners. We associated two different Ab shapes, TTZ and RTX, for this anticalin because both Abs are well characterized and tools to analyze their functionality are available.
TTZ is a therapeutic mAb inhibiting Her2 dimerization and blocking tumor cell proliferation [
16]. Competition assays and ELISA using Her2-expressing cells and recombinant Her2 are the best way to evaluate this binding affinity [
17]. In contrast, RTX is a mAb used for many B-cell malignancies with high response and long-term remission [
18]. Affinity analyses of RTX and derived molecules are complex because CD20 antigen is expressed on the surface in a supramolecular form [
19]. Therefore, in this case, competition assays with fluorescent antibody and CD20-expressing cells are the easiest way to compare the BsAb binding to CD20.
Today, predicting the production of recombinant mAbs is not possible, although some in silico tools have been developed for this purpose [
20]. H0 corresponds to trastuzumab. As well, the R0, biosimilar of RTX and the anticalin N7A (ACFn) have been a natural and necessary basis for this work. H0 appears to have better production than R0. Under the same production conditions, anticalin has a yield of 30 mg/L (
Table 1). This yield in milligrams per liter, or even converted to millimoles per liter, is still lower than that of R0 and H0. However, regardless of its position, it has little effect on the production of RF BsAbs, although the N-terminal is considered important for production. ACFn seems to have more effect on HF BSAb production. Comparing the production yield of these two families of Abs (HF and RF) seems to indicate the primacy of the mAb structure, which affects the production yield more than the position of anticalins on it. In any case, all BsAbs could be obtained in sufficient quantities for all analyses.
The anticalin does not interfere with the structure of the mAbs as seen by SDS-PAGE under non-reducing conditions. Its presence does not alter the oligomeric profile of the Abs. However, the elution volume is a function of the location, with greater impact for positions 3, 1, 2 and 4 (i.e., when the anticalin is placed toward the paratope of the Ab). The conformation can also be studied by thermal profile analysis. Here again the absence of significant difference does not allow drawing a real conclusion. The anticalin has a Tm of 64.5 °C, different from the TM1 of H and R, but regardless, there is no marked trace of the anticalin at any position on the BsAb profile.
In terms of aggregation temperature, with position 3, both BsAbs (RF3 and HF3) had a similar temperature to that of anticalin alone. On close observation, the curves show two aggregation states: that of the anticalin and that of the mAb. Thus, at position 3, the anticalin seems to be able to aggregate alone before the mAb, whereas at the other three positions, it seems to be protected, probably showing a stronger interaction with the mAb domains than at the hinge region.
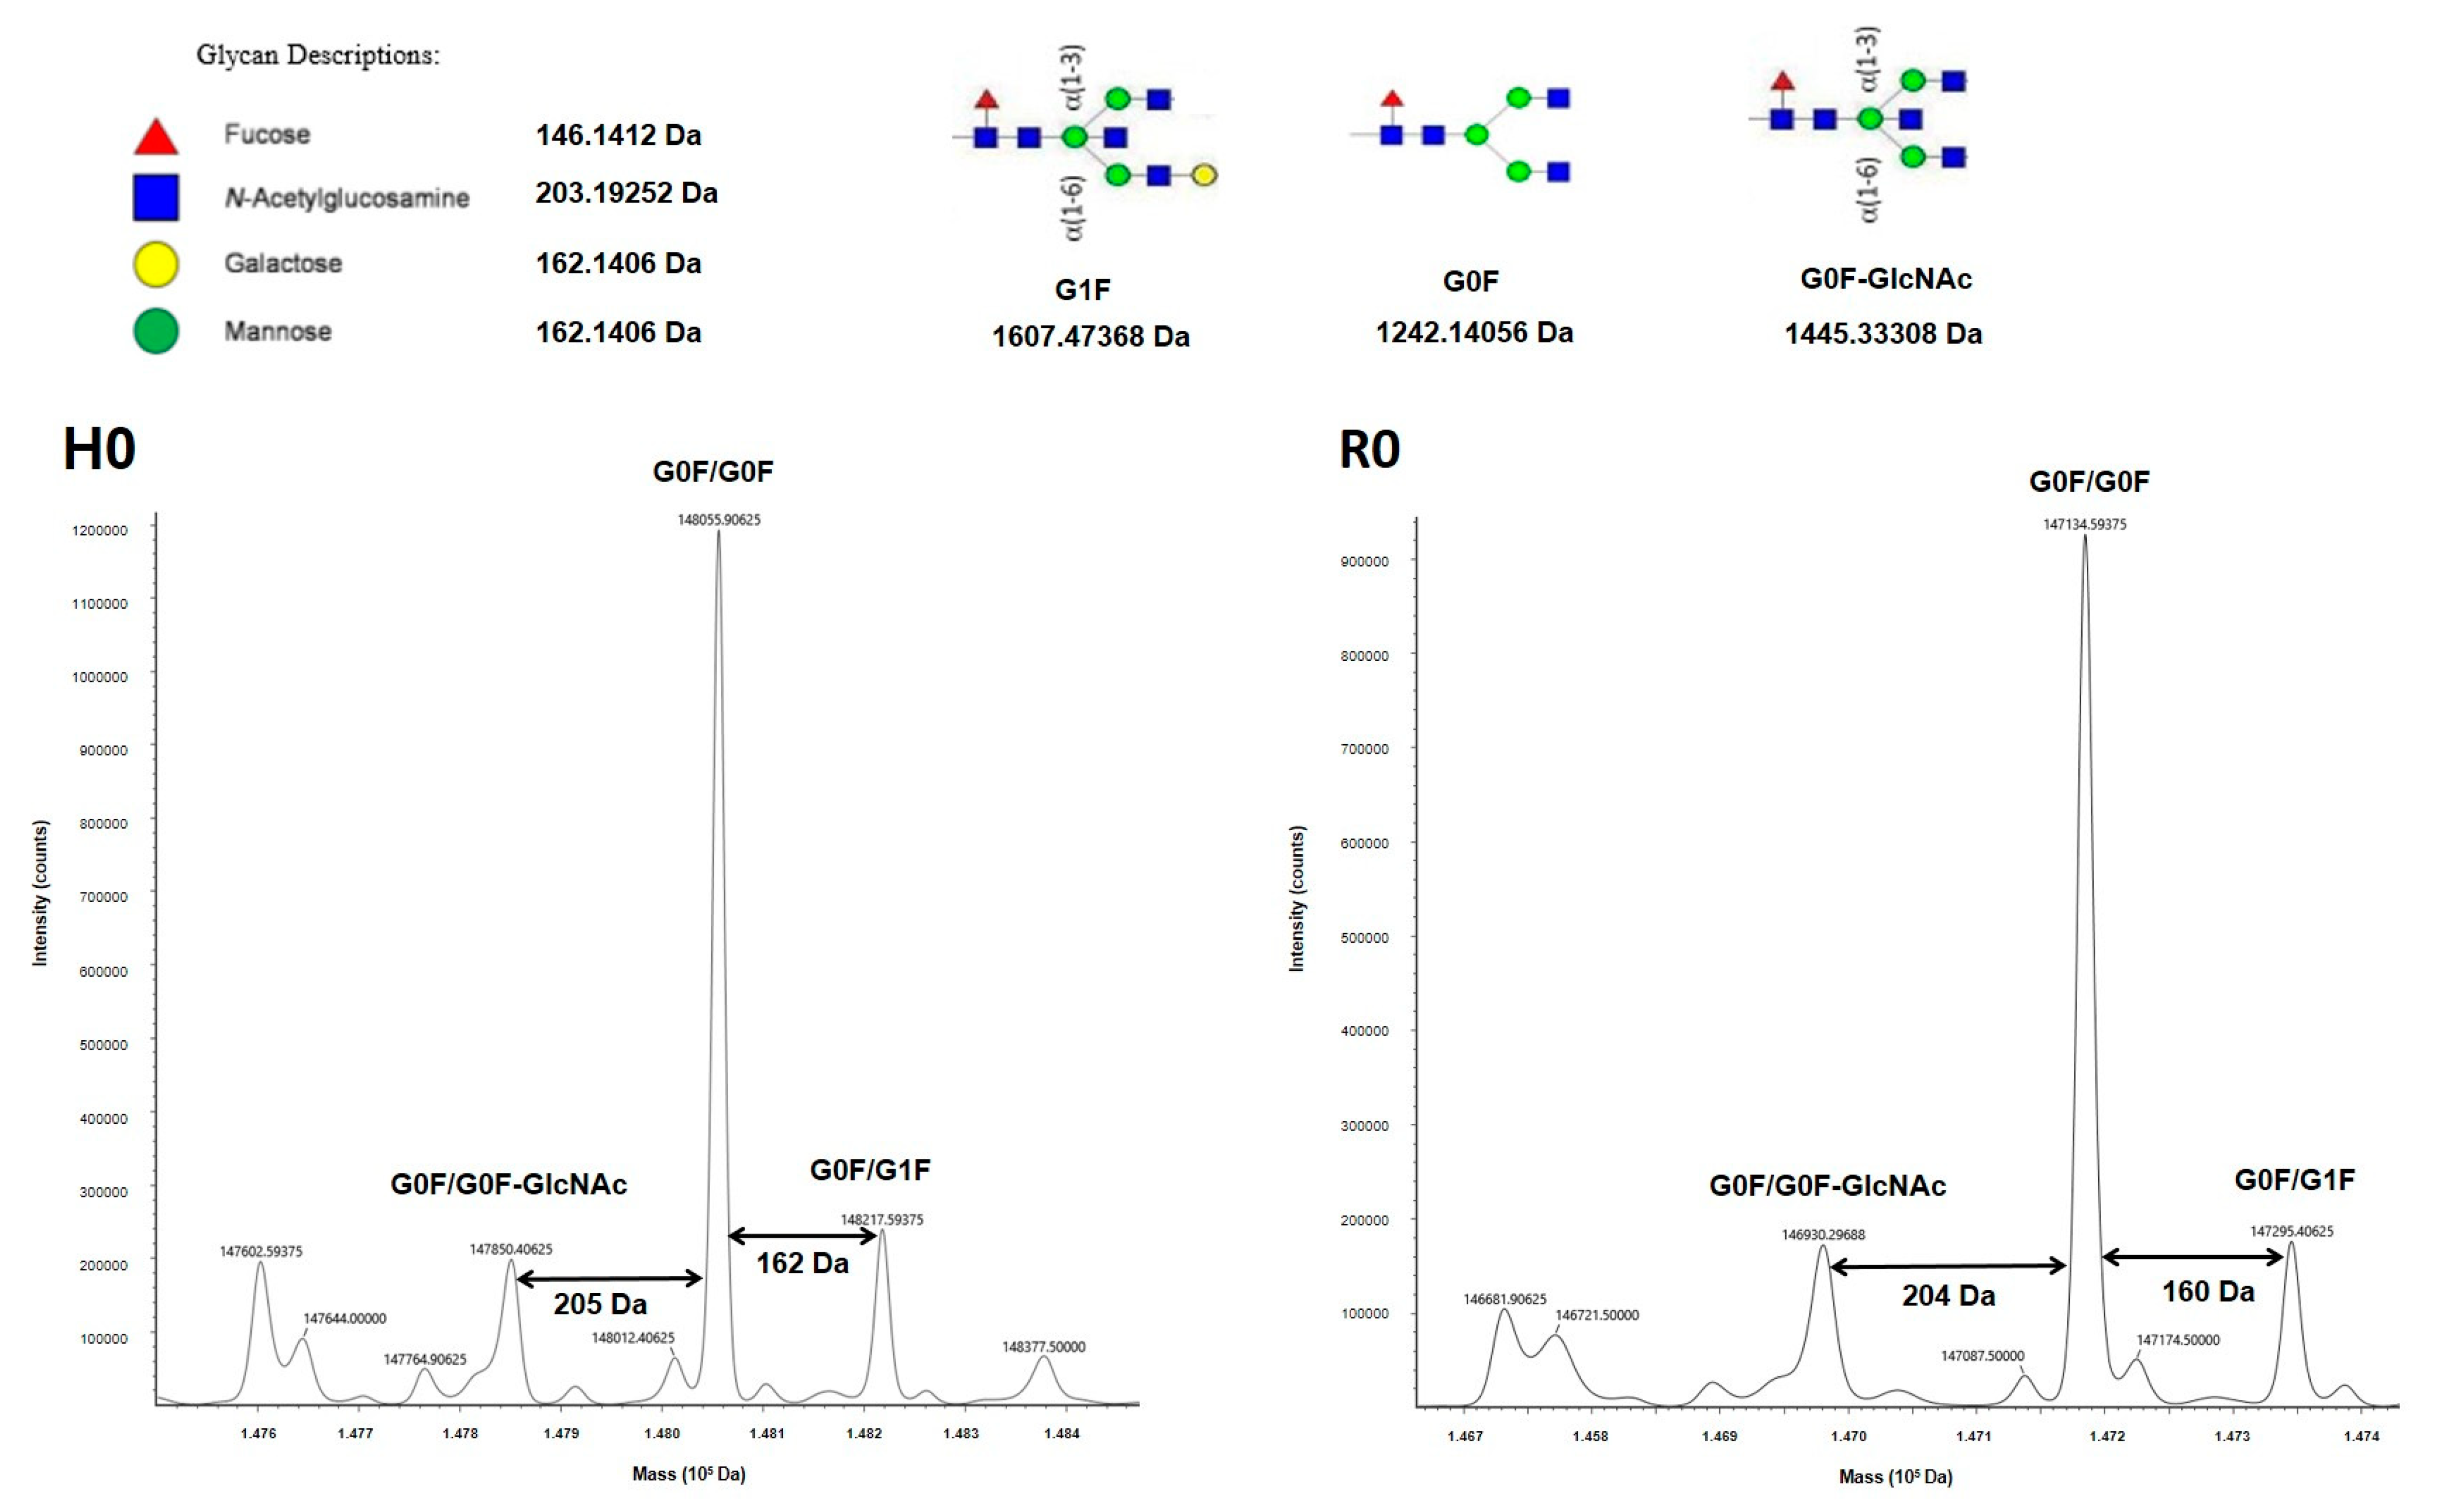
Higher-order structure and glycosylation profile of a therapeutic mAb are important determinants of its function. Both TTZ and RTX, as for IgG1, carry N-glycosylation on Asn 297, which is essential for stability and functional activities [
21,
22,
23,
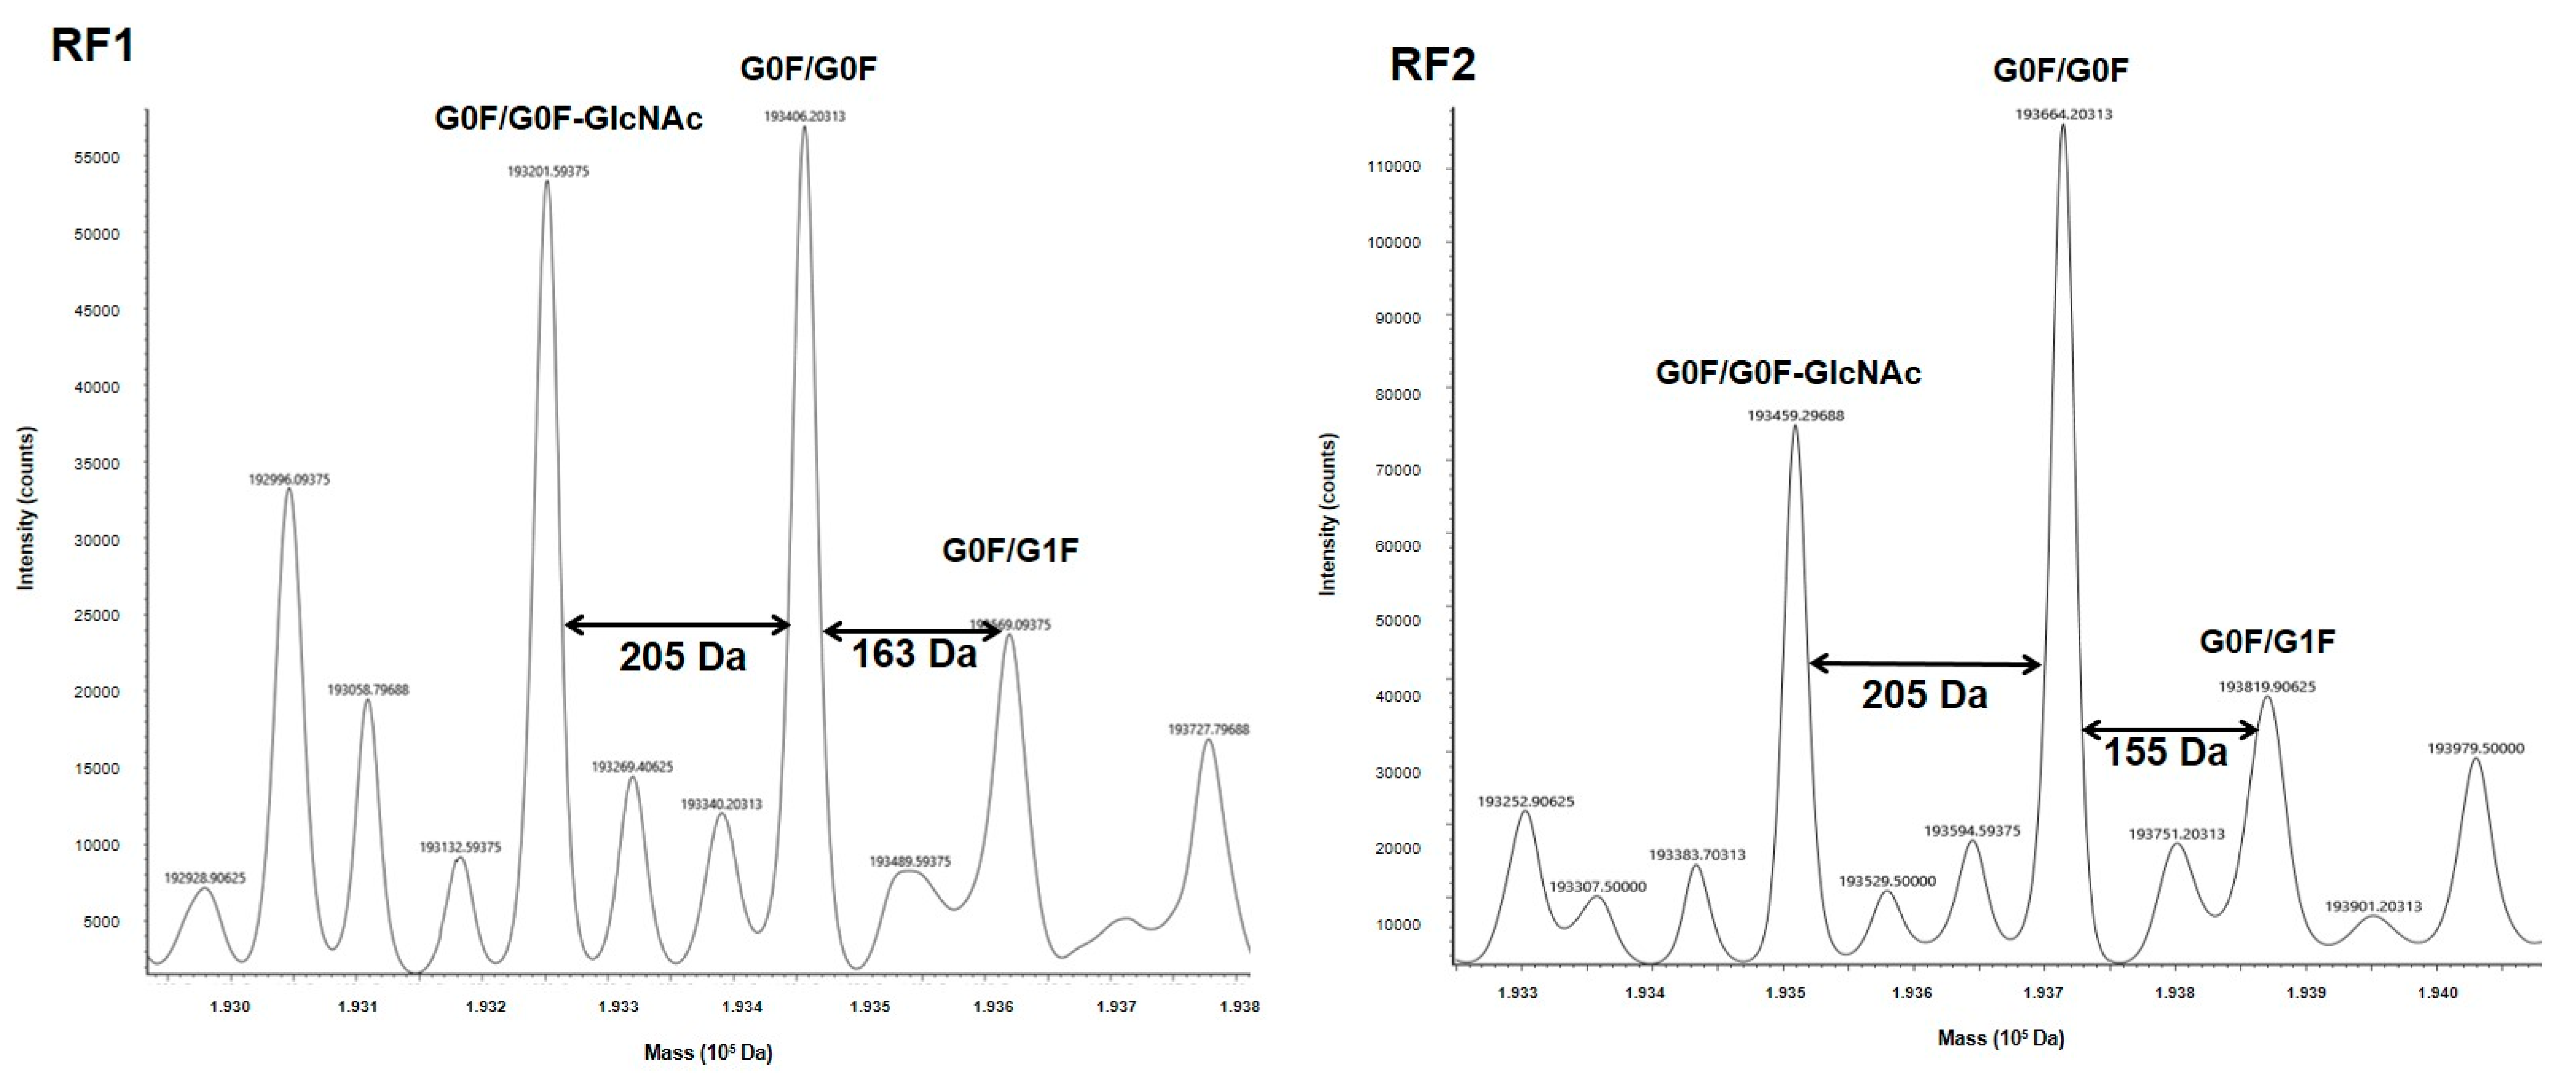
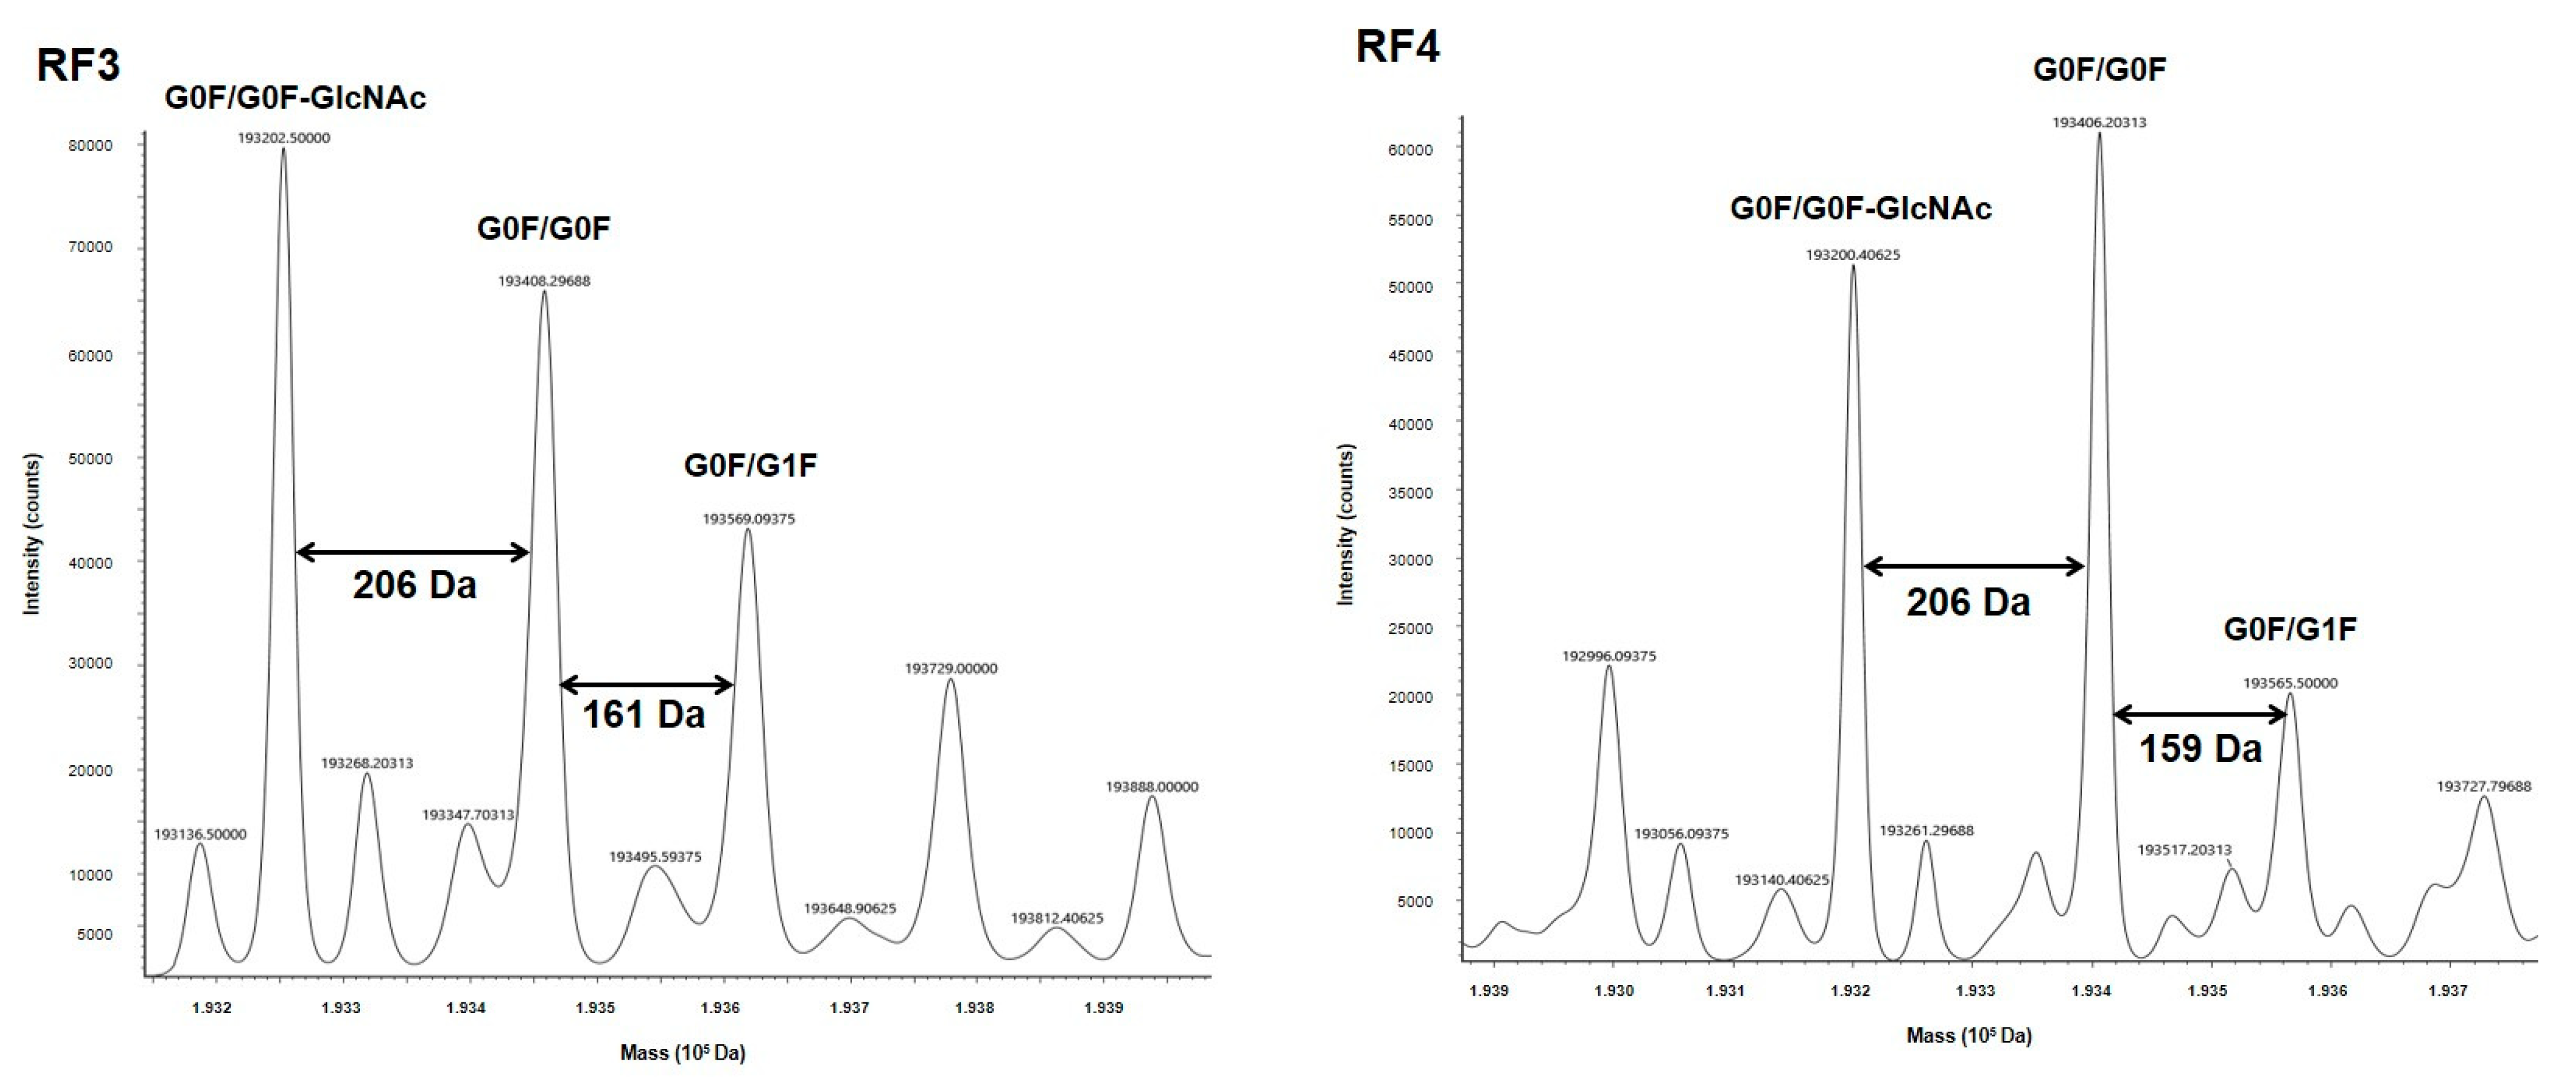
24]. MS is a valuable tool for both structure and glycosylation validations for our constructs. MS profiles of both mAbs revealed at least three major glycoforms (G0/G0F, G0F/G1F, G0/G0F-GlcNAC), which are observed on both commercial and biosimilar molecules [
25,
26,
27]. In fact, MS also confirmed that the glycosylation level was similar between all BsAbs and their respective H0 and R0 counterparts. Especially, the fucosylation level, which has a huge impact on functional properties [
28], was similar to that observed for H0 and R0. So, all the constructs conformed to what was expected and represented valuable BsAbs.
Overall, the properties of both HF and RF families are not superimposable, even concerning yield (
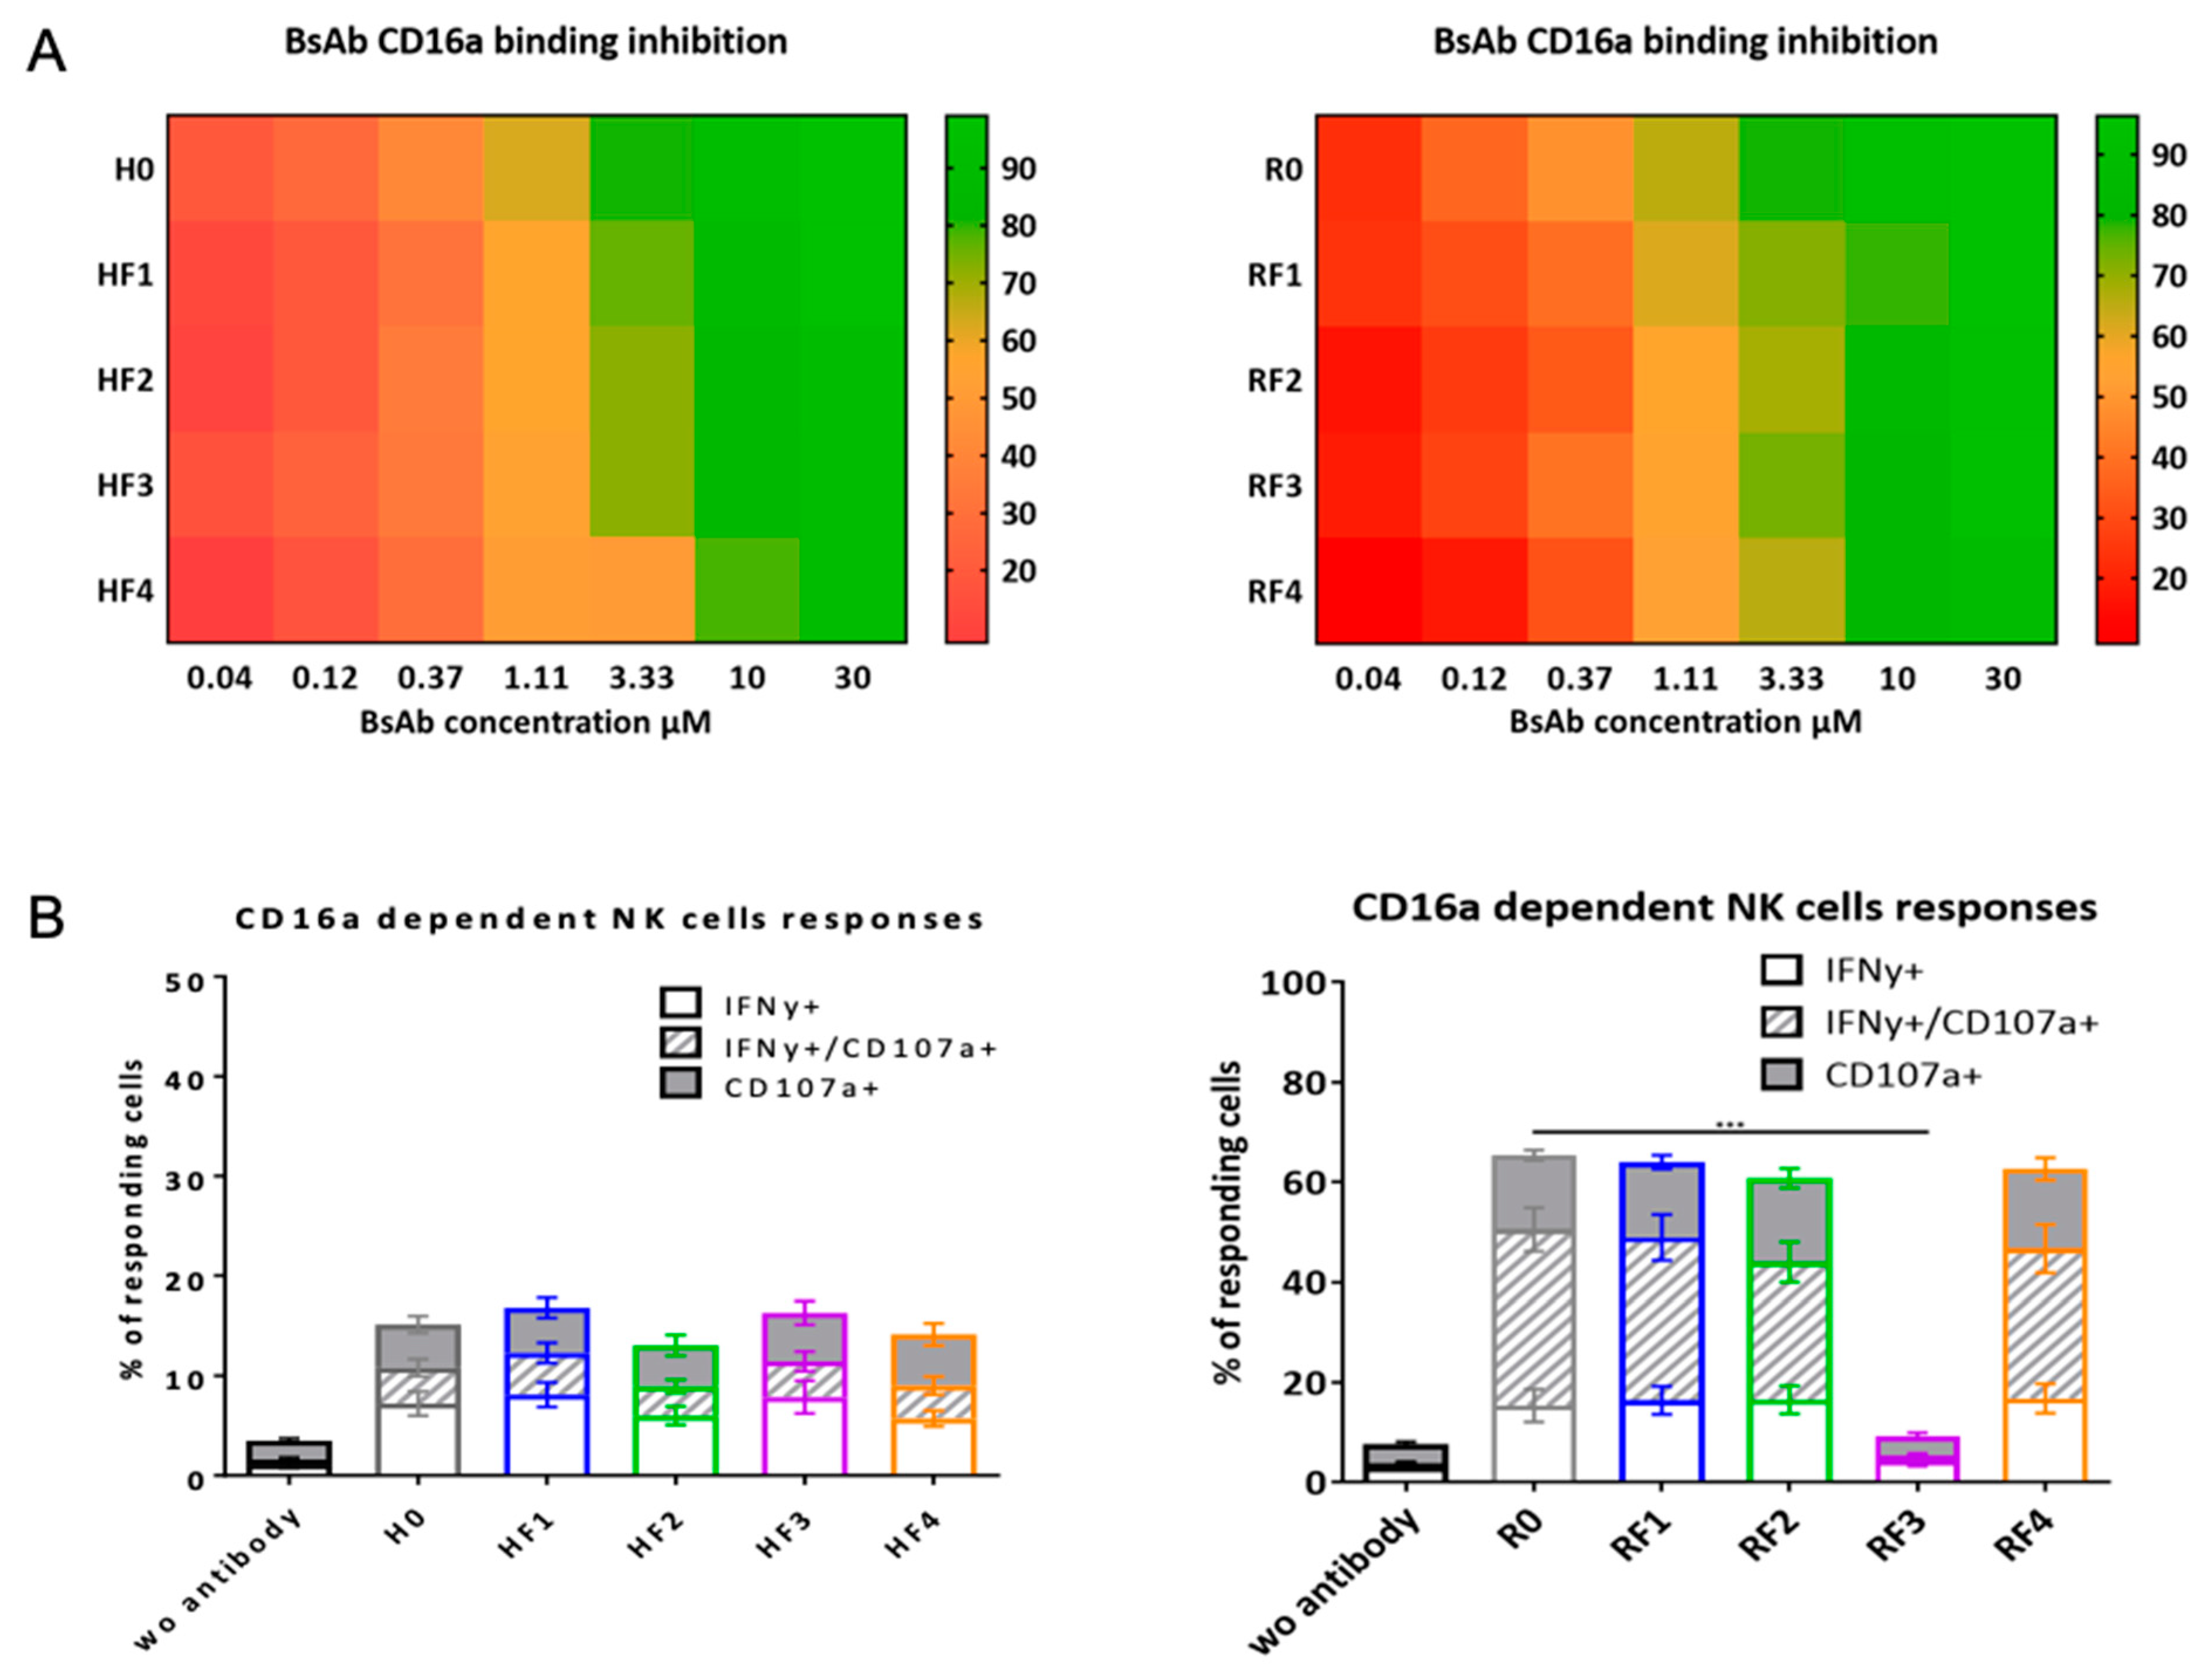
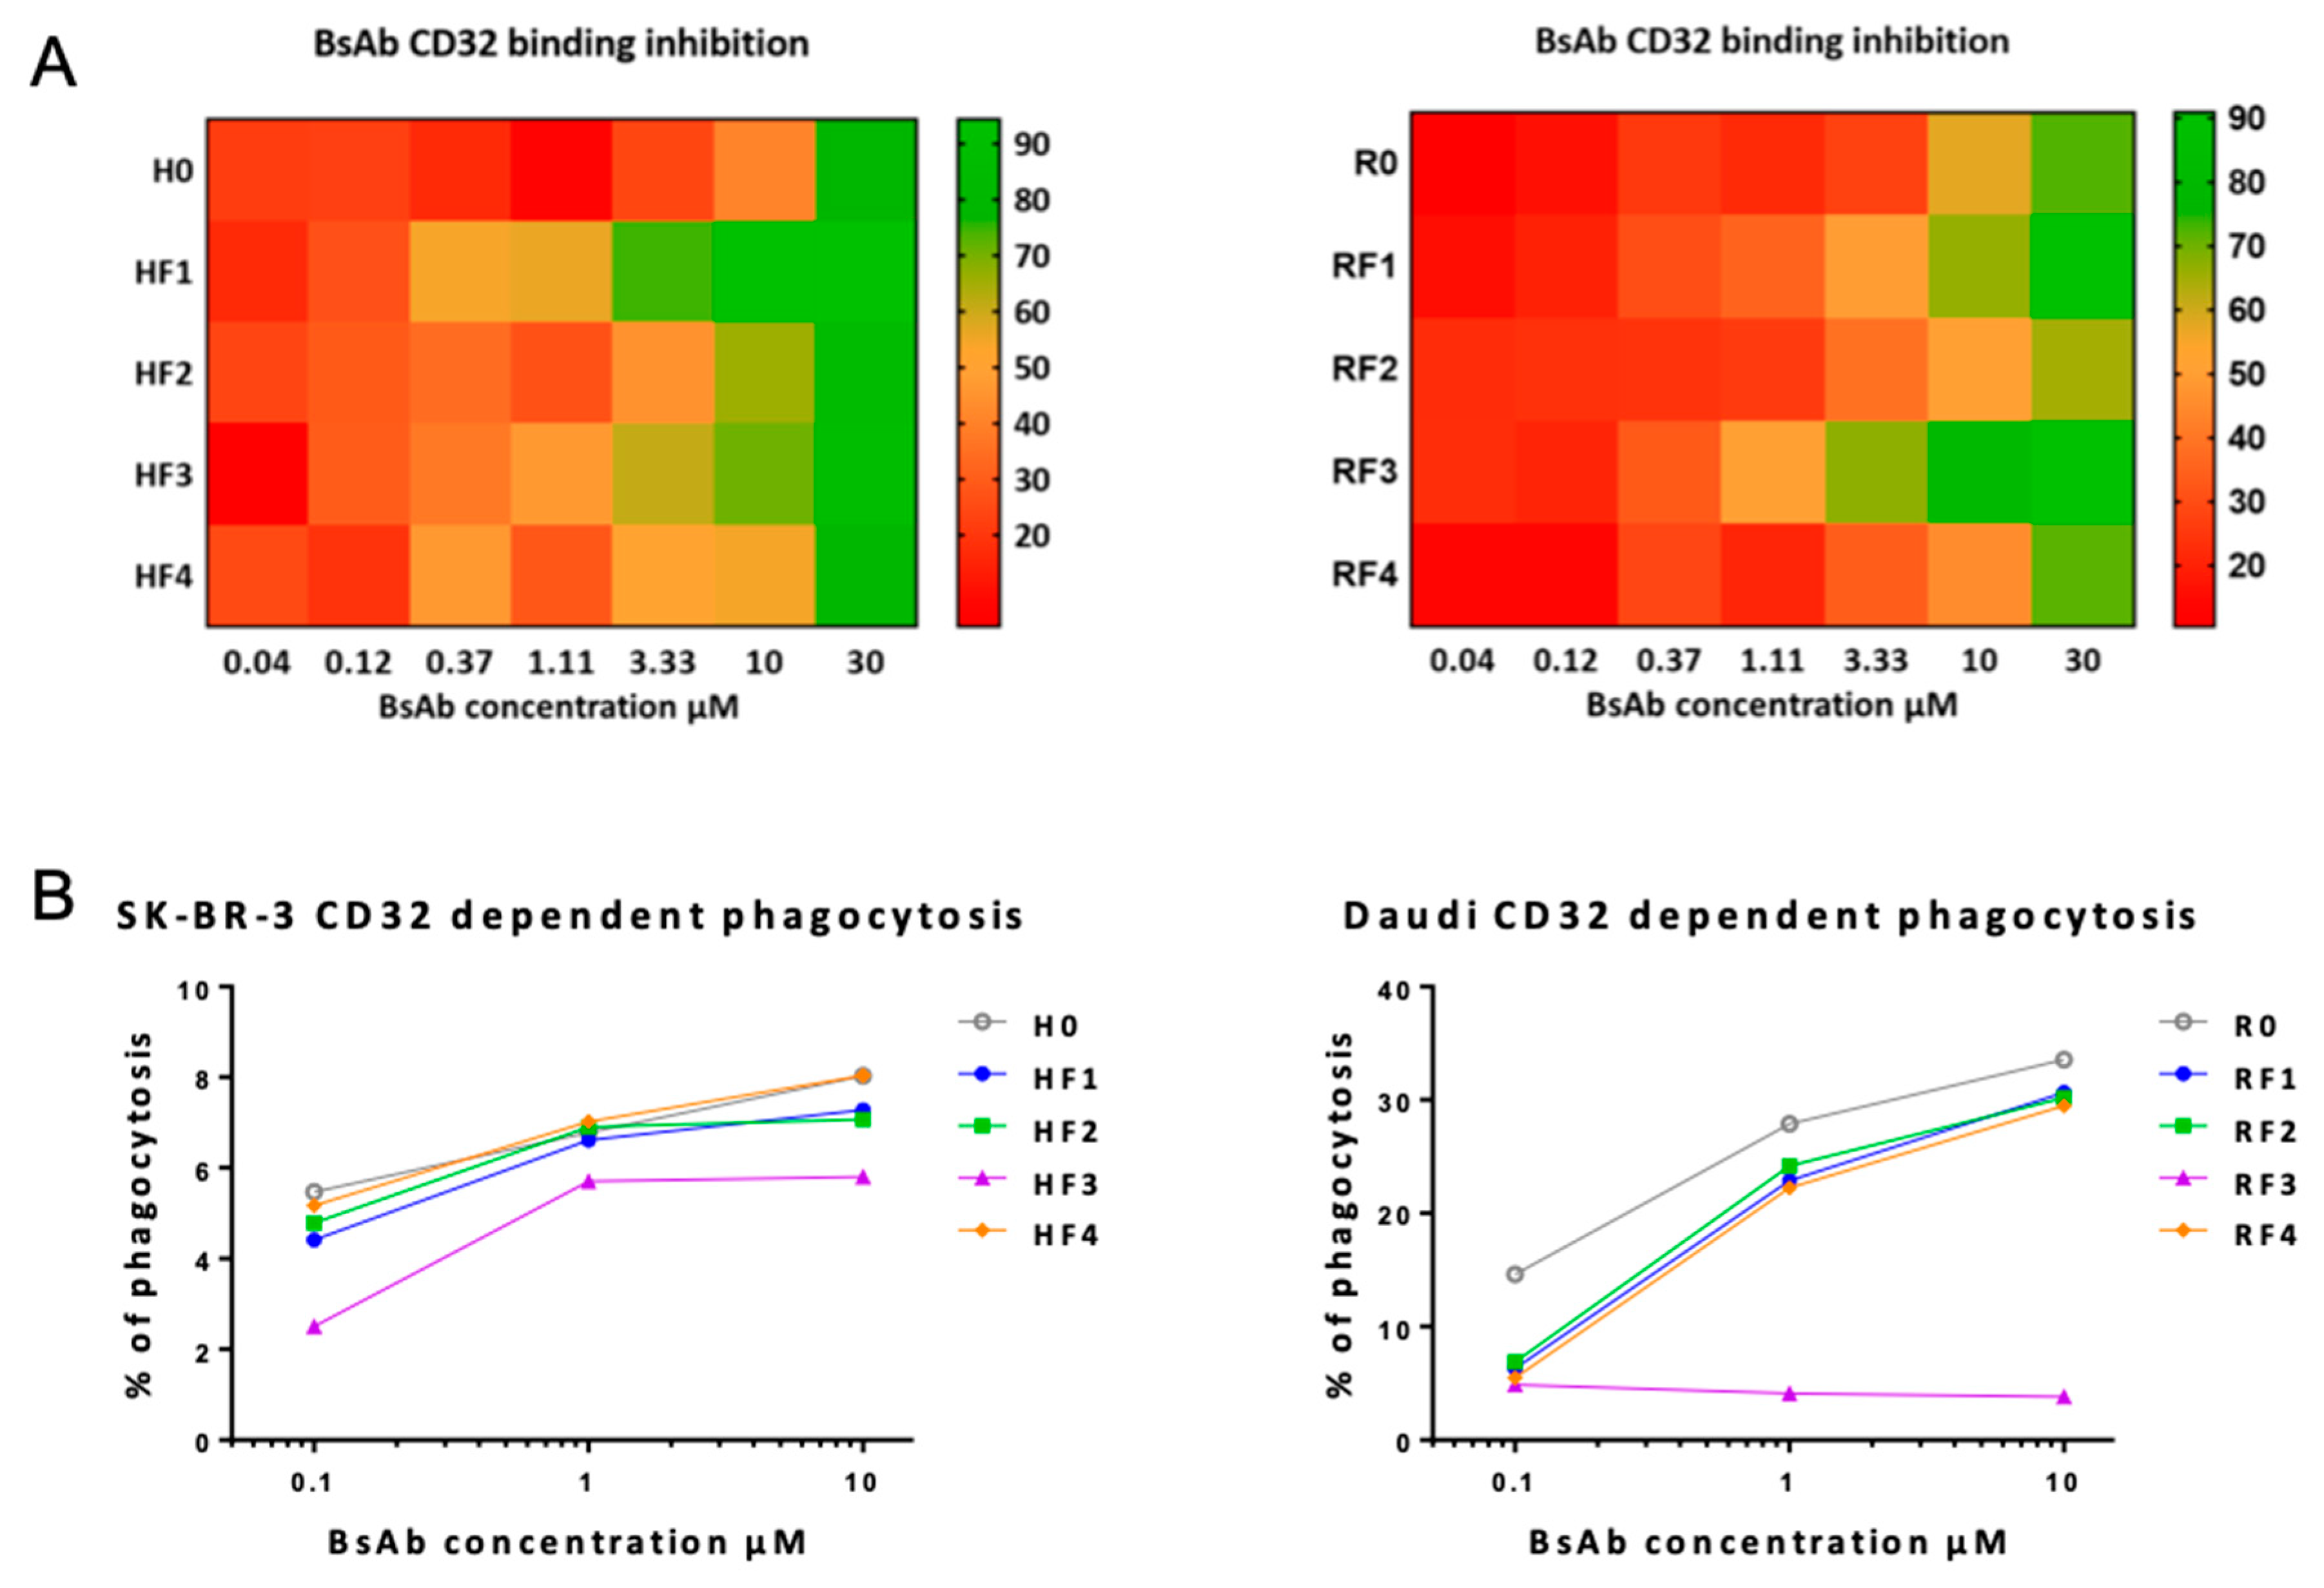
Figure 8). Some BsAbs, such as RF3, showed no functional activities. However, some, such as HF1, seemed to have improved functionality. The carrying mAb affected both BsAbs and their functionality, and according to the mAb, the impaired formats differ: RF3 for the RF family and HF4 for the HF family. Thus, BsAb functionalities seemed to depend on the chosen mAb. Second, within each family, no remarkable BsAb stands out, except for HF4/RF4, which demonstrated lower affinity for CD16A and CD32A (more so RF4) (
Figure 8). Except for RF3, the binding of each Ab to its antigenic target was slightly modified. This latter position with ACFn in the N-terminal of the L chain, which impairs the mAb binding probably for stereotypic reasons, could also occur for position 1, yet HF1 and less so RF1 had standard binding to their antigen. This reinforces the importance of the carrier mAb on the BsAb behavior.
Anticalin binding to Fn was variably impaired (
Table 2,
Figure S9 and
Figure 8), more so for the RF than HF family for mAb-linked anticalin. Concerning the RF family, its global Fn affinity was much lower than free ACFn, and RF1, with 200-times less affinity as the worst position for Fn binding. In this latter case, the Fn binding site could be hidden because of the different possible conformations of ACFn at the end of its arm. Interactions of ACFn with the Ab structure could depend on the size and rigidity of the arm, its conformation and interactions on the domains of the mAb. Some other anticalins must be tested in these different configurations to evaluate the relative impact of the anticalin affinity versus the carrying mAb.
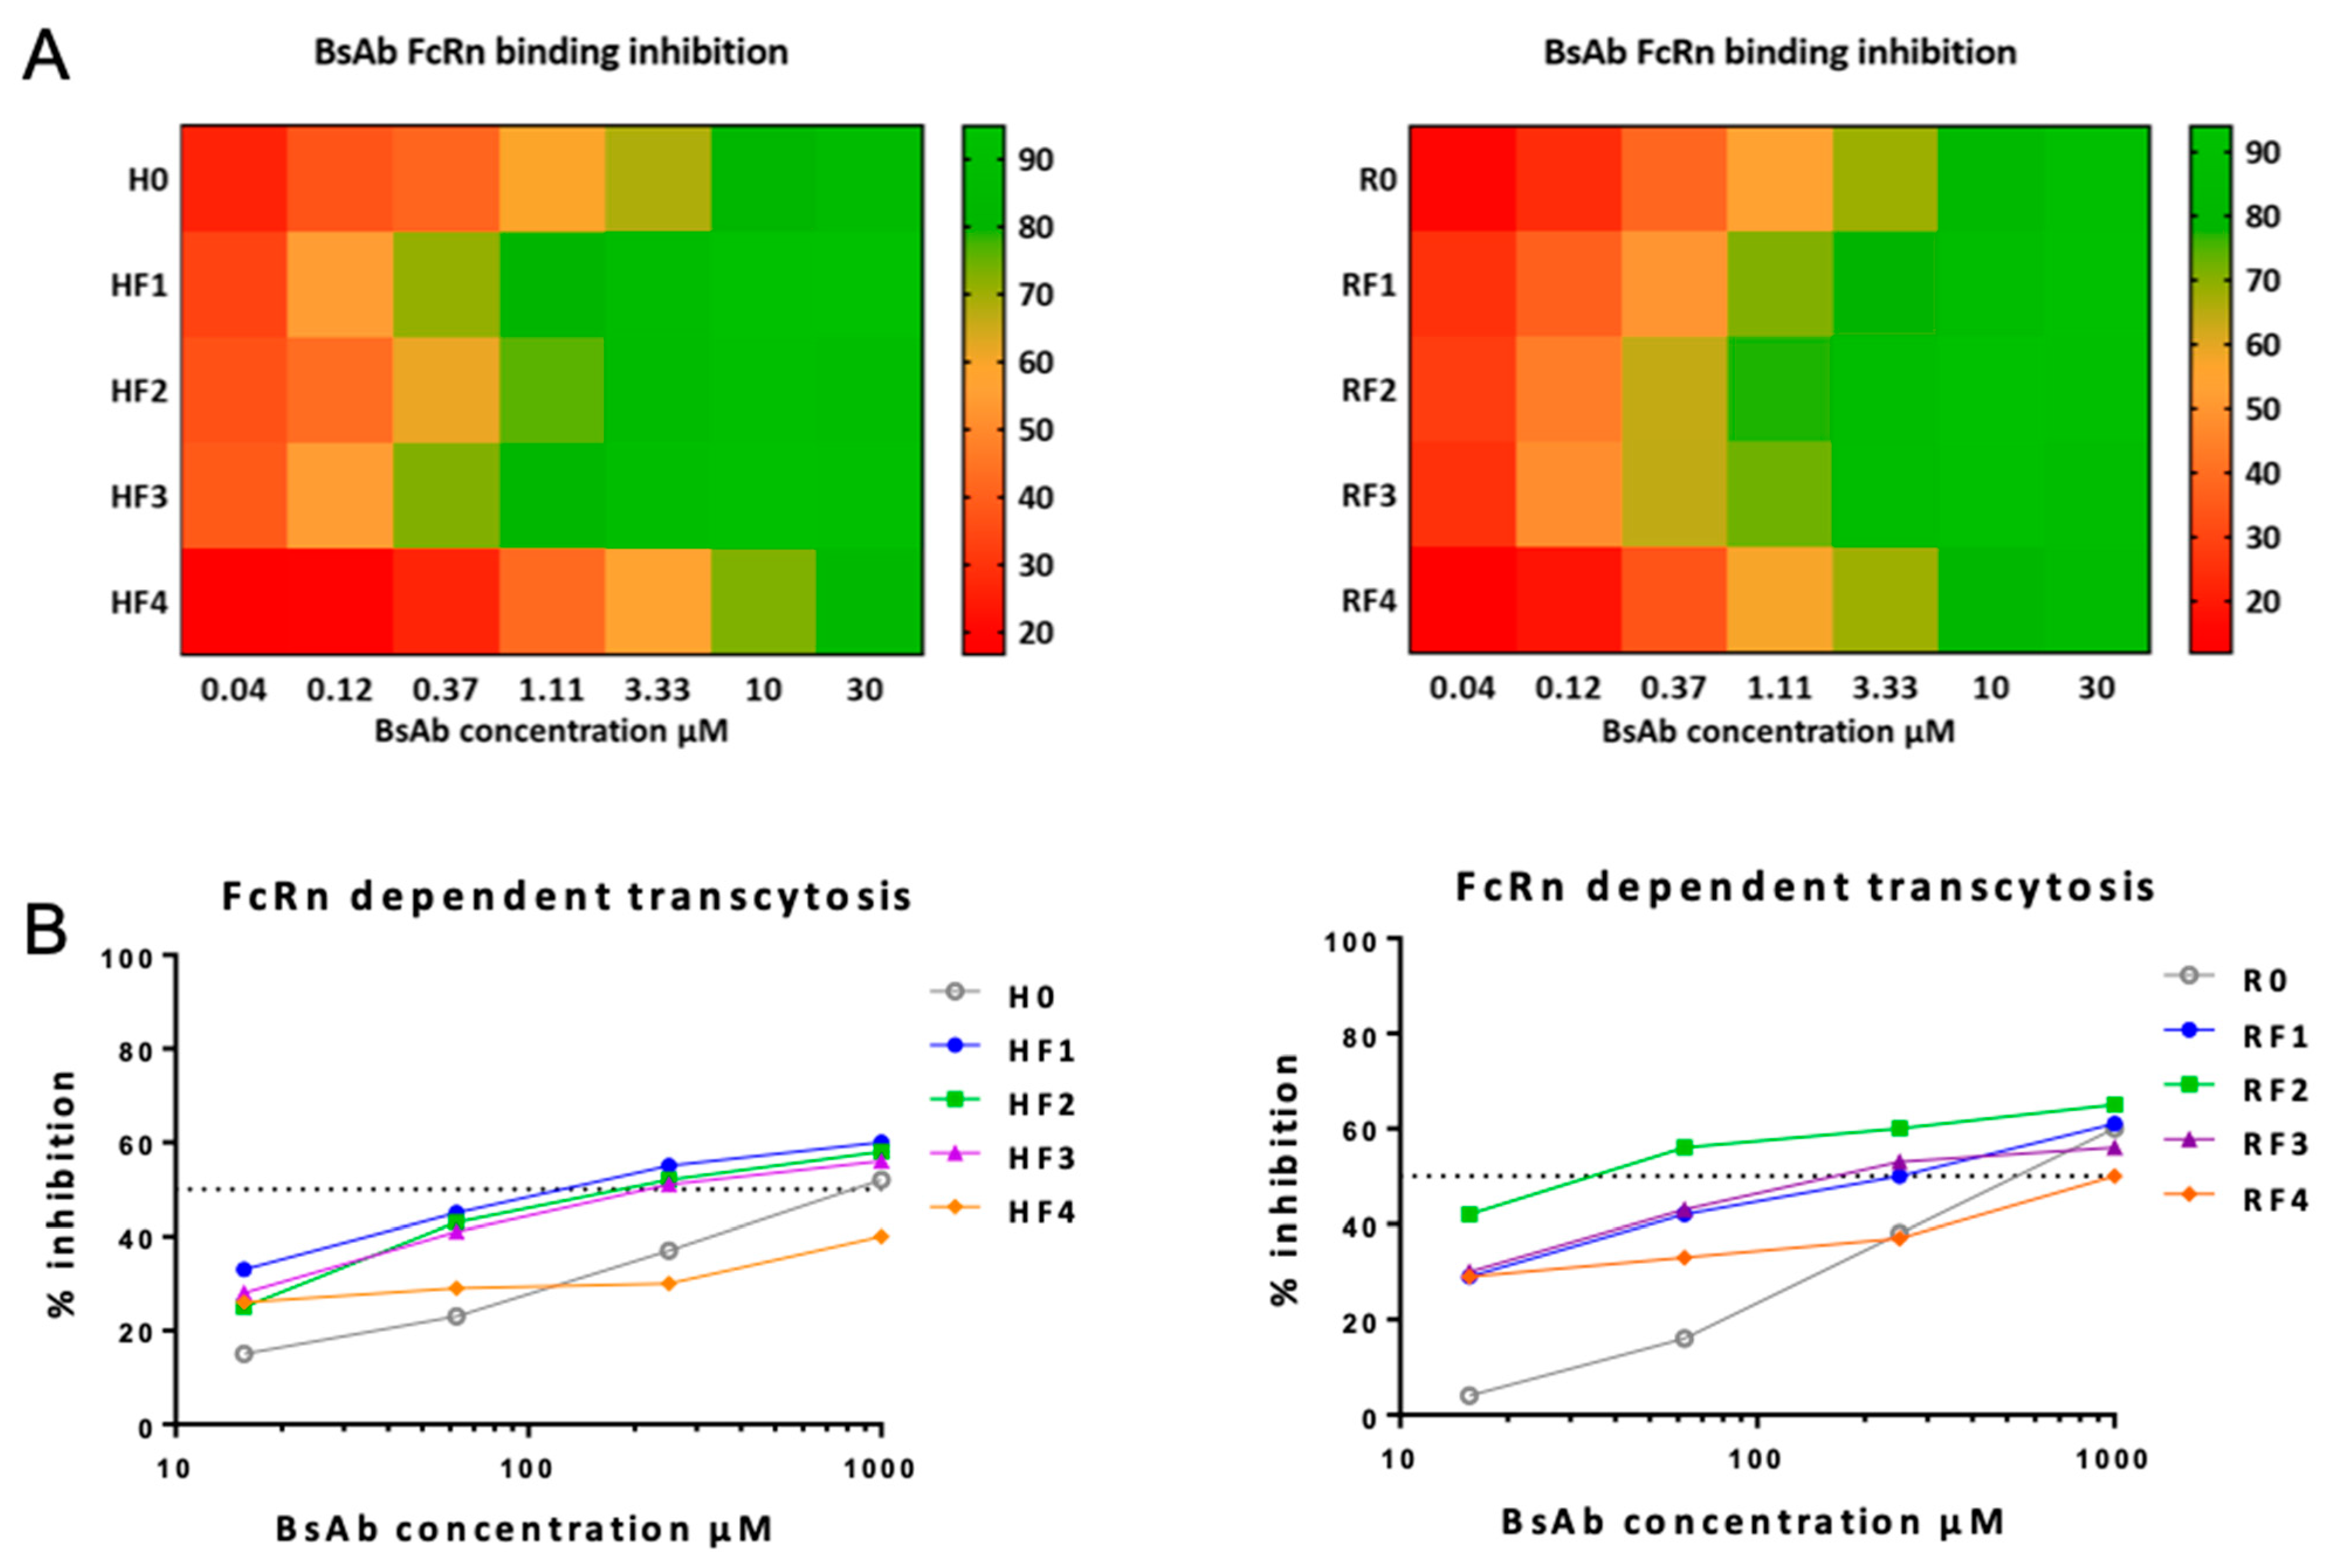
In contrast, the presence of ACFn has various effects on the FcR affinities of BsAbs: it seemed to have little effect on FcγRIIIA/CD16A binding and improving FcRn binding and had a mixed effect on FcγRIIA/CD32A binding. For this latter binding, positions 2 and 4 for both BsAb families seemed less favorable. Access to the hinge-CH2 region is highly important for CD32A binding; both positions were closest to this region, which might impede this FcR binding. Nevertheless, except for RF3, functional activities depending on FcγR binding seem to be less affected by the presence of ACFn. However, the binding to the antigenic target seemed the most important event, whether with NK92 activation or phagocytosis functions, as shown by the fact that both functions were impossible for RF3, which did not bind to CD20. Another important parameter in the study of new format BsAbs, is the binding of FcRn, because it is a key molecule involved in IgG and albumin recycling and transcytosis [
29]. Via cellular transcytosis, it is responsible for the two ligands, allowing their biodistribution all over the body [
30]. Hence, it is involved in pharmacokinetics and pharmacodynamics of therapeutic molecules bearing an Fc portion, and many studies deal with these properties to extend the FcRn-dependent half-life of these biotherapies [
31]. Binding of IgG to FcRn occurs at acidic pH, whereas it is extremely low at neutral pH and involves the CH2-CH3 domains with the participation of histidine [
32]. In this work, we found no significant difference in binding and consequently transcytosis of BsAbs of the HF and RF families with anticalin at position 1 to 3. Of note, no position compromised the link to FcRn; all were better (position 1 to 3) or the same (position 4) as the related mAbs. Therefore, positions 1 to 3 had a positive effect on binding and transcytosis of BsAbs of the HF family as compared with H0 and HF4 and of the BsAbs of the RF family as compared with R0 and RF4. Different teams have published that mutations located at a distance from the FcRn binding site may modify IgG affinity for the receptor [
15,
33]. Isoelectric-point and charge modifications may explain this difference. Based on our results, it is difficult to draw a rule relating distance and affinity for FcRn. Indeed, the BsAbs with ACFn in position 1 or 3 (i.e., located very far from the binding site in the Fab) and 2 (located close to the FcRn biding site in the Fc) had similarly high affinity, although the profile also depended on the family (HF1 = HF3 > HF2 and RF1 < RF2 = RF3). By contrast, the affinity of the BsAbs with AFCn in position 2 and 4, which are on either side of the FcRn binding site and at a close distance to it, were substantially different (HF2 >> HF4 and RF2 >> RF4).
Until now, at least two BsAbs involving anticalins have been developed, including anti-Her2 Abs associated with anticalin anti-CD137 [
13] or anti-PD-L1 associated with anticalin anti-4-1BB [
34]. In both cases, the anticalin was merged on the C-terminal of the H chain (position 2), but no other position has been tested. Our work aimed to provide an overview of all possible positions from the perspective of BsAb production, binding properties and functionalities. In light of our data, position 2 seems a reasonable choice because all binding or functional properties were maintained but this could depend on the mAb choice. Likewise, position 4 should be avoided because FcRn-dependent homeostasis may be compromised, but this point may depend on the carrying Ab also.
In summary, the findings of this work are an important demonstration that BsAbs with linked anticalin are an easy and safe way to build new BsAbs that could be adapted to each therapeutic need. Nevertheless, as for all mAbs, the BsAb structural configuration can affect functionalities and elimination differently. Careful evaluation of each position of anticalin linking might be necessary to lead to the selection and design of BsAbs with optimized therapeutic values.
