Article

Multi-Dimensional Benefit Evaluation of Urban Spaces Driven by Consumer Preferences

by
Xin Zhang
1,
Yi Yu
1,* and
Lei Cao
2,*
1
School of Architecture & Art Design, Hebei University of Technology, Tianjin 300132, China
2
School of Architecture, Tianjin University, Tianjin 300072, China
*
Authors to whom correspondence should be addressed.
Land 2025, 14(12), 2322; https://doi.org/10.3390/land14122322
Submission received: 4 October 2025 / Revised: 28 October 2025 / Accepted: 30 October 2025 / Published: 26 November 2025

Abstract

Against the backdrop of efforts to improve the quality of urban spatial stock, assessments of spatial benefits driven by consumption preferences integrate subjective decision-making and objective environmental factors to provide quantitative evidence for urban planning and public investment. This study constructed a “environment-perception–behavior” analytical framework grounded in SOR (stimulus–organism–response) theory. We combined structural equation modeling with the hedonic pricing method to identify causal pathways and quantify the marginal value of spatial elements. XGBoost was employed to uncover consumption-preference thresholds, Coupling Coordination Degree (CCD) was used to identify spatial supply–demand relationships, and Social Return on Investment (SROI) was applied to evaluate multidimensional urban spatial benefits. The results showed that transportation accessibility, commercial diversity, green-space quality, and cultural ambiance significantly shaped distinct consumption preferences. Central urban areas approached supply saturation in commercial and daily consumption and exhibited diminishing marginal returns, whereas peripheral zones demonstrated greater potential for sports and cultural consumption. Based on these findings, we reveal the underlying logic of spatial benefit distribution and classify the study area into High-efficiency matching zones, transition matching zones, and potential zones. We further propose targeted optimization recommendations that can inform policy on urban spatial functional positioning and social investment and provide evaluation criteria for prioritizing interventions.

1. Introduction

As China’s urbanization shifts from incremental, land-expansion–driven growth to stock management focused on quality, the drivers of urban economic growth are moving from investment- and export-led models toward ones dominated by mass consumption and lifestyle services [1]. Walt Rostow characterized this phase as the final stage of socioeconomic development in Stages of Economic Growth. This profound shift toward “new-type urbanization” arises not only from the need to correct excessive investment and overcapacity in traditional models, but also from a national strategic effort to advance market-oriented reforms of land factors and to promote intensive, sustainable development. Orderly land transfer policies optimize resource allocation and provide essential spatial platforms and institutional safeguards for urban consumption upgrades and supply-side modernization [2]. At the same time, with the goal of high-quality sustainable development, China’s urbanization increasingly emphasizes coordination with low-carbon strategies [3], prompting cities to evolve from aggregates of large-scale production functions into consumption engines that offer diverse leisure, cultural, sports, and ecological experiences [4]. Urban spaces-as primary arenas for commodity exchange and value circulation-support diverse consumption behaviors, including everyday spending, social interaction, and cultural participation [5]. However, consumption downgrading associated with structural adjustment has produced commercial vacancies, declining neighborhood vitality, and increased social imbalance [6]. These trends make it urgent to uncover the latent value of urban spatial elements, align citizen consumption preferences with spatial supply, and enhance the multidimensional benefits of urban space for planning and investment decisions.
The multidimensional benefits of urban space—spanning cultural experience, human well-being, and commercial activity—are shaped by residents’ perceptions and preferences toward the consumption environment [7,8]. Because these benefits are often implicit and not immediately reflected in monetary metrics, researchers commonly apply the Hedonic Price Model (HPM) introduced by Rosen to infer marginal implicit values from observed willingness to pay [9]. From individual and societal perspectives, consumption preferences determine the form and intensity of value embodied in urban spaces [10]; thus, assessments of spatial benefits should consider both social resource allocation and the alignment between environmental attributes and consuming behaviors to meet diverse stakeholder needs [11]. The Stimulus–Organism–Response (SOR) framework explains how environmental stimuli are processed cognitively and emotionally into behavioral responses, offering a theoretical pathway to examine how consumption environments shape preferences [12]. In practice, governments provide spatial elements through macro regulation and regional planning, while demand-side preferences feed back into policy and investment decisions via benefit appraisal [13,14].
This study examines Tianjin to develop a consumer-preference-centered framework for assessing multidimensional spatial benefits. We investigate causal pathways linking consumption environment, perception, and behavior; evaluate the differential impacts of environmental factors on consumption patterns and supply-demand matching; quantify spatial values; and assess multidimensional benefits to inform policy and investment. By revealing the spatial logic of Tianjin’s benefits, the study offers actionable evidence for government and private investors to improve service effectiveness and resource-allocation efficiency and to support balanced, high-quality urban development across economic, cultural, and social dimensions.

2. Literature Review and Theoretical Framework

2.1. Literature Review

The potential of urban spaces to promote social welfare, economic development, and cultural dissemination is widely recognized. This potential encompasses not only direct benefits such as everyday consumption and the leisure economy but also latent values arising from cultural transmission, social interaction, and recreational activities [15]. In 2012, the United Nations Human Settlements Programme (UN-Habitat) introduced the City Prosperity Index (CPI), shifting urban development assessment from pure economic growth to a multidimensional, people-centered approach and thereby broadening perspectives on how to measure urban spatial value [16]. Mitchell et al. [17] found that rational infrastructure allocation can substantially improve citizens’ subjective well-being and physical health. At the same time, improved environmental quality increases willingness to consume and perceptions of fairness [13,18]. Moreover, leveraging cultural resources can help offset intangible cultural losses caused by rapid urbanization and enhance spatial value [19]. In sum, urban spaces act as ecological and cultural carriers as well as venues for commerce and services; their effects on consumption preferences shape the social value of space through multiple feedback mechanisms [20,21].
Academic work has largely focused on the quality of consumption venues and on how improvements in environmental attributes translate into tangible consumer benefits. Studies emphasize the roles of urban transport, facility distribution, and ecological conditions in shaping consuming behavior [22,23]. Song et al. [24] employed a “space–perception–behavior” framework to investigate how classical gardens influence visitors’ embodied cognition, confirming that natural and spatial qualities enhance public perception and willingness to engage with cultural heritage. Liu et al. [23] utilized social media data to reveal the relationship between experiential perceptions and visitor satisfaction and travel preferences. Zhou et al. [25] used the SOR (Stimulus–Organism–Response) framework to identify how spatial form and individual perception influence commercial-space vitality. SOR is frequently combined with structural equation modeling (SEM) to represent the logical chain in which environmental stimuli are processed via perception and in turn drive individual behavior [26]. Scholars have further extended this line of inquiry by integrating the HPM, thereby monetizing consumer perceptions and behaviors to provide valuation tools for policy evaluation and resource allocation [27].
In efforts to identifying urban spatial value and consumer preferences, integrating HPM and SEM has proven feasible for estimating housing prices and environmental values [28]. Lee et al. [29] combined these approaches to estimate willingness to pay while analyzing variable interactions, which enabled more accurate interpretation of environmental allocation and investment intensity. At the same time, SEM’s strengths in theoretical modeling complement machine-learning techniques for feature identification and nonlinear relationship detection [30], and GIS spatial econometric analysis for revealing geographic heterogeneity and spatial patterns [31]. This multi-method strategy addresses limitations of single approaches in threshold identification, predictive accuracy, and spatial non-stationarity [32]. Guided by this integrative perspective, an increasing number of studies have begun to couple traditional econometric methods with new data sources and algorithms to derive policy conclusions that are both interpretable and actionable. Although methodological integration has significantly enhanced the precision and breadth of research, a systematic understanding of urban spatial value itself remains underdeveloped. Existing studies predominantly focus on single-dimensional values (for example, ecological value or economic output) and often overlook the diversity of, and preferences among, residents as the primary consumers of urban space. Few studies have systematically evaluated these diverse demand preferences within a consumption–supply coupling framework.

2.2. Research Gap and Question

Current research exhibits several shortcomings. First, although numerous studies examine how urban spatial environments separately promote residents’ well-being and resource-utilization efficiency, few integrate these two aspects. Moreover, these studies mainly describe the current state of resource use within spatial environments and do not explore the underlying mechanisms from a human perspective. Second, research on urban spatial benefits predominantly focuses on ecosystem service values such as climate regulation [33], carbon sequestration [34], and biodiversity conservation [35]. Apart from Lita’s work [36], few studies have attempted to value urban spatial benefits through consumer experiences and perceptions. Finally, the multidimensional benefits of urban space fundamentally represent materialized perceived values formed through consumer–environment interactions. This implies that the influence of spatial environments on consumer behavior is not a simple linear sum but involves complex nonlinear relationships. However, existing research predominantly employs traditional linear paradigms to study human activities and thus fails to fully reveal the underlying driving mechanisms.
To address the aforementioned issues, this paper proposes a research pathway of “value identification—preference supply and demand—benefit assessment.” It identifies the value of spatial elements via the causal chain consumption environment—perception —behavior, while simultaneously revealing the nonlinear influence mechanisms of the environment on different consumption behaviors to comprehensively evaluate the multidimensional benefits of urban space. This provides practical decision support for differentiated spatial investment and consumption-positioning transformation. This study aims to: (1) clarify the causal pathways through which consumption-environment factors influence consumption behavior via consumption perception using SEM and HPM, and thereby quantitatively measure the implicit value of each spatial element; (2) employ XGBoost (a machine-learning regression method) to reveal nonlinear relationships and critical thresholds between the consumption environment and different consumption preferences, and combine this with a coordination–coupling-degree model to diagnose the current matching between spatial supply and consumption demand; (3) synthesize these findings and apply the Social Return on Investment (SROI) model to monetize the multidimensional benefits generated by urban spaces under different consumption orientations; (4) based on empirical findings, systematically reveal the underlying logic and formation mechanisms of Tianjin’s multidimensional spatial benefit distribution, and propose differentiated, practical spatial-optimization strategies and policy recommendations to support new urbanization transformation, industrial-structure reform, and people-centered, high-quality urban development.

2.3. Theoretical Exposition and Conceptual Definition

The value and multidimensional benefits of urban spaces are not merely the sum of physical elements, but rather the comprehensive outcome of a series of psychological and behavioral responses generated by users within the environmental context [37], encompassing cultural, social, and lifestyle dimensions [38]. Guided by consumption preferences, this paper concretizes the multidimensional benefits of urban spaces into cultural benefits, recreational benefits, and commercial benefits, manifested in daily consumption behaviors such as cultural consumption, sports consumption, and commercial consumption. These benefits originate from citizens’ daily lives and aim to enhance overall social welfare. However, due to their often lagging and intangible nature, their value is more evident in long-term returns such as cultural dissemination and social satisfaction [39], necessitating a systematic theoretical framework for analysis and quantification.
To achieve this objective, this paper introduces the Stimulus–Organism–Response (SOR) theory to construct a core analytical framework. This theory elucidates the causal chain where environmental “stimuli” influence an individual’s internal “organism” state, ultimately driving behavioral “responses”. It reveals the intrinsic logic linking the effects of the consumption environment to consumption perceptions, which in turn trigger consumption behaviors. Based on this, this study screens and categorizes variables with consumption-promoting potential through a literature review, constructing a theoretical model of consumption environment—consumption perception—consumption behavior (Figure 1). It also defines the core concepts of the model and proposes the following research hypotheses:
H1: 
Consumer perception mediates the effect of consumption environment on consuming behavior;
H2: 
Consumption environment exerts a direct influence on consuming behavior;
H3: 
A reciprocal feedback relationship exists between the consumption environment and social-economic attributes;
H4: 
Social-economic attributes moderate the effect of consumer perception;
H5: 
Social-economic attributes moderate the effect of consuming behavior.

2.3.1. Stimulus

The consumption environment, as an external “stimulus,” serves as the starting point for triggering the consumption decision-making process. It refers to the external objective factors acting upon individuals during consumption activities, including commercial services, cultural elements, transportation, and ecological environment [40]. Among these, the quantity and diversity of commercial service facilities determine a region’s capacity to attract foot traffic and its commercial vitality. They serve as fundamental stimuli that generate direct economic benefits and influence consumer choices [41]. Accessibility, meanwhile, determines the relative locational value of the commercial environment and opportunities for generating benefits [42,43]. Historical districts and cultural-educational facilities, as carriers of urban memory [44], combined with specific business formats (such as art galleries, cultural restaurants, and commercial theme streets), can create unique cultural atmospheres. This extends consumer dwell time and attracts higher willingness to pay, making them crucial components of cultural stimuli [45]. Topography, road network density, and public transit stop density reflect a region’s accessibility and economic potential [46], serving as convenience stimuli that influence consumption willingness and correlate with perceptions of social equity [47]. Furthermore, ecological conditions like green spaces and water bodies have become core factors in consumption choices by regulating mood and experiential quality. Within the context of sustainable development, ecological elements as comfort stimuli have emerged as vital components in advancing urban ecological and cultural value [48].

2.3.2. Organism

Consumer perception, functioning as an internal “organism,” serves as a psychological mediator through which environmental stimuli are processed and evaluated by individuals. It manifests as internal responses such as perception, attention, and emotion, ultimately influencing behavioral decisions via intention and decision-making mechanisms [49]. This study selected three perception dimensions as mediating variables based on corresponding environmental stimulus responses. Comfort in natural environments stems from subjective perceptions of microclimate, green spaces, and water bodies. Enhancing this comfort effectively prolongs sports consumers’ dwell time and promotes high-intensity physical activities [50,51]. Perceived satisfaction with service quality and facility richness directly determines commercial consumers’ enthusiasm, decision-making efficiency, and repurchase propensity [52], while significantly amplifying the economic returns of cultural consumption [53]. Meanwhile, the sense of regional cultural identity generated by historic districts and cultural facilities can stimulate consumers’ deep place attachment. This not only extends dwell time and increases willingness to pay for local goods but also drives word-of-mouth dissemination and marginal consumption growth, serving as a key psychological driver of cultural consumption [54,55].

2.3.3. Moderator

Socio-economic attributes, as crucial moderating variables, influence both the perception processes of the “organism” and the intensity of its “response” behaviors. This dimension comprises three sets of latent variables: demographic structure, land use intensity, and economic vitality. Population, age, and gender composition collectively define the foundational scale and preference structure of the consumer market [56]. Land use intensity, represented by nighttime illumination, building density, and land use mix, reflects regional carrying capacity and consumption supply potential. High-intensity development typically correlates with more comprehensive services and higher income levels, thereby creating greater consumption opportunities [57,58]. Economic vitality, as a composite indicator of urban development and industrial dynamism, generally attracts greater production-side investment and employment [59]. This fosters a virtuous cycle of production, employment, income, and consumption, fundamentally shaping consumers’ purchasing choices and spatial positioning [60].

2.3.4. Response

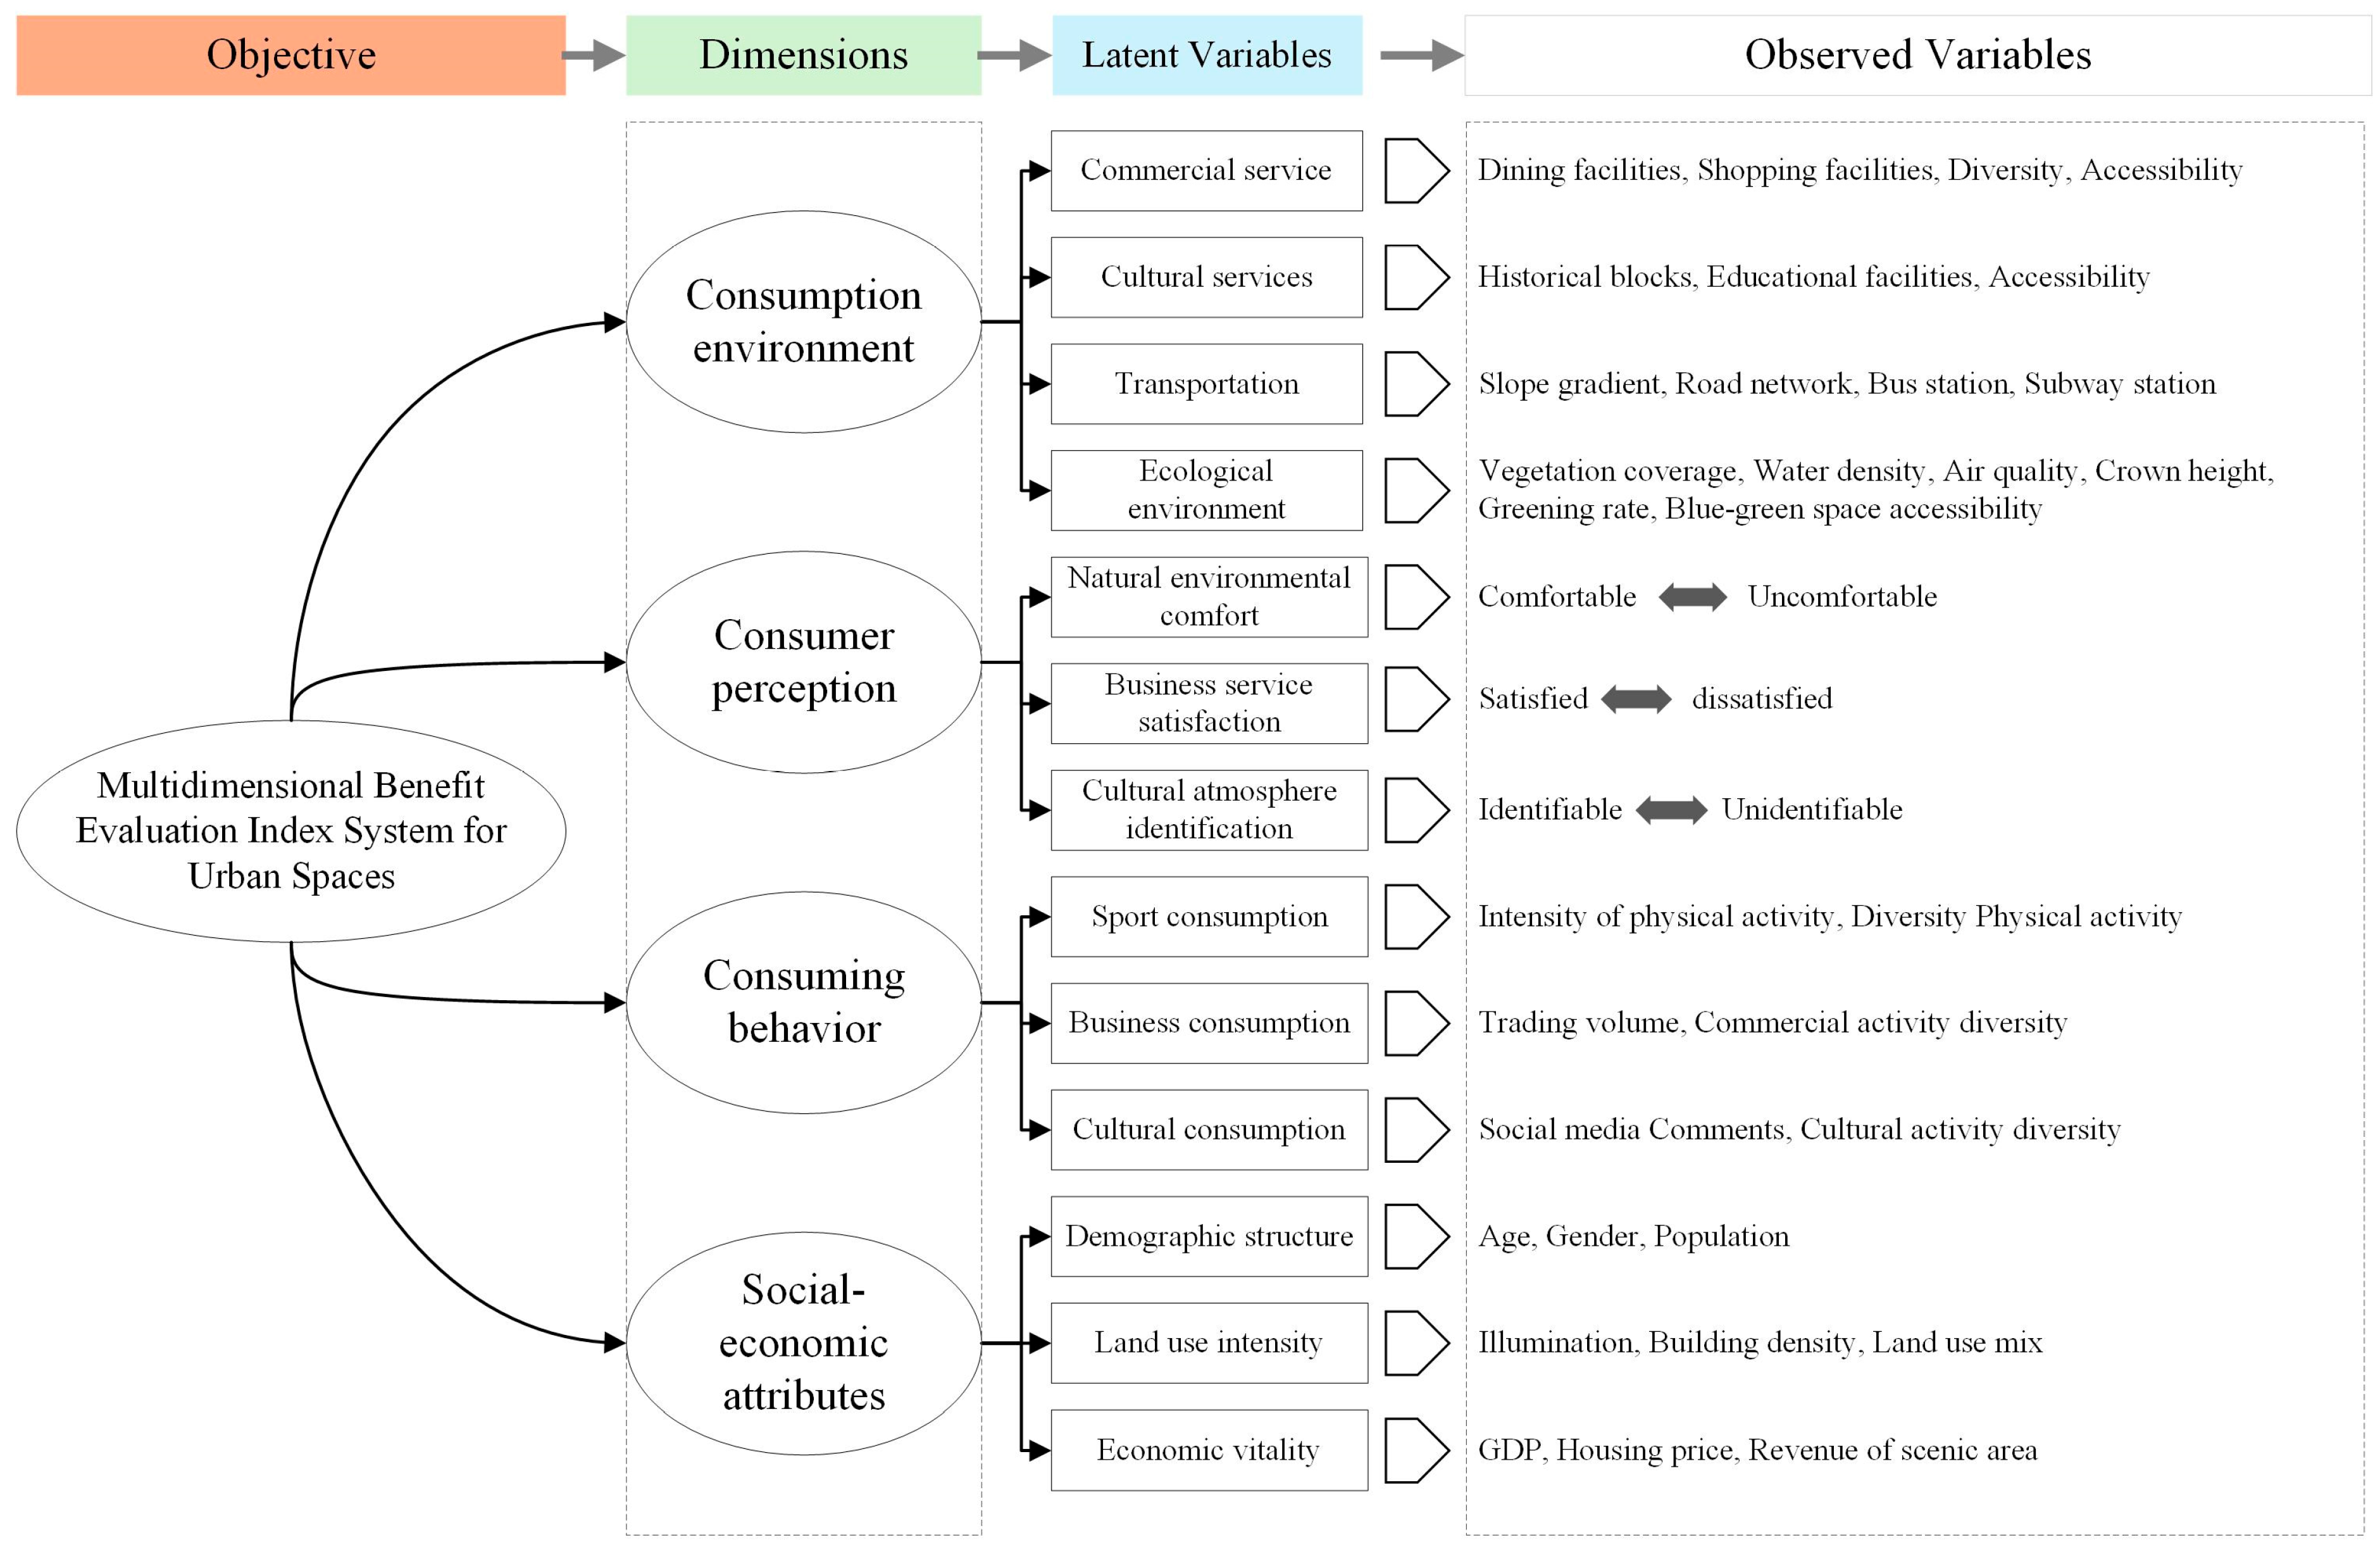
Consuming behavior, as the ultimate “response,” represents the observable outcome generated by the aforementioned processes. This paper focuses on three categories of behavior—sports consuming, commercial consuming, and cultural consuming—to quantify the actual benefits of urban spaces across dimensions such as recreational activities, business development, and cultural dissemination. In this paper, sports consumption refers to the physical exertion consumers undertake to gain health benefits and leisure experiences, with its core benefit being the realization of wellness value, manifested in the intensity of activities like fitness and recreation. Commercial consuming denotes the transactional behavior consumers engage in to acquire goods and services, with its core benefit being the enhancement of material utility and market value. Cultural consuming denotes cognitive activities undertaken by consumers to gain cultural identity and knowledge enhancement, with core benefits being the fulfillment of spiritual and cultural values, manifested in consumer participation in cultural, educational, and heritage activities. Thus, this paper preliminarily establishes a multidimensional benefit assessment framework for urban spaces comprising four research dimensions, ten latent variables, and several observed variables (Figure 2).

3. Materials and Methods

3.1. Study Area

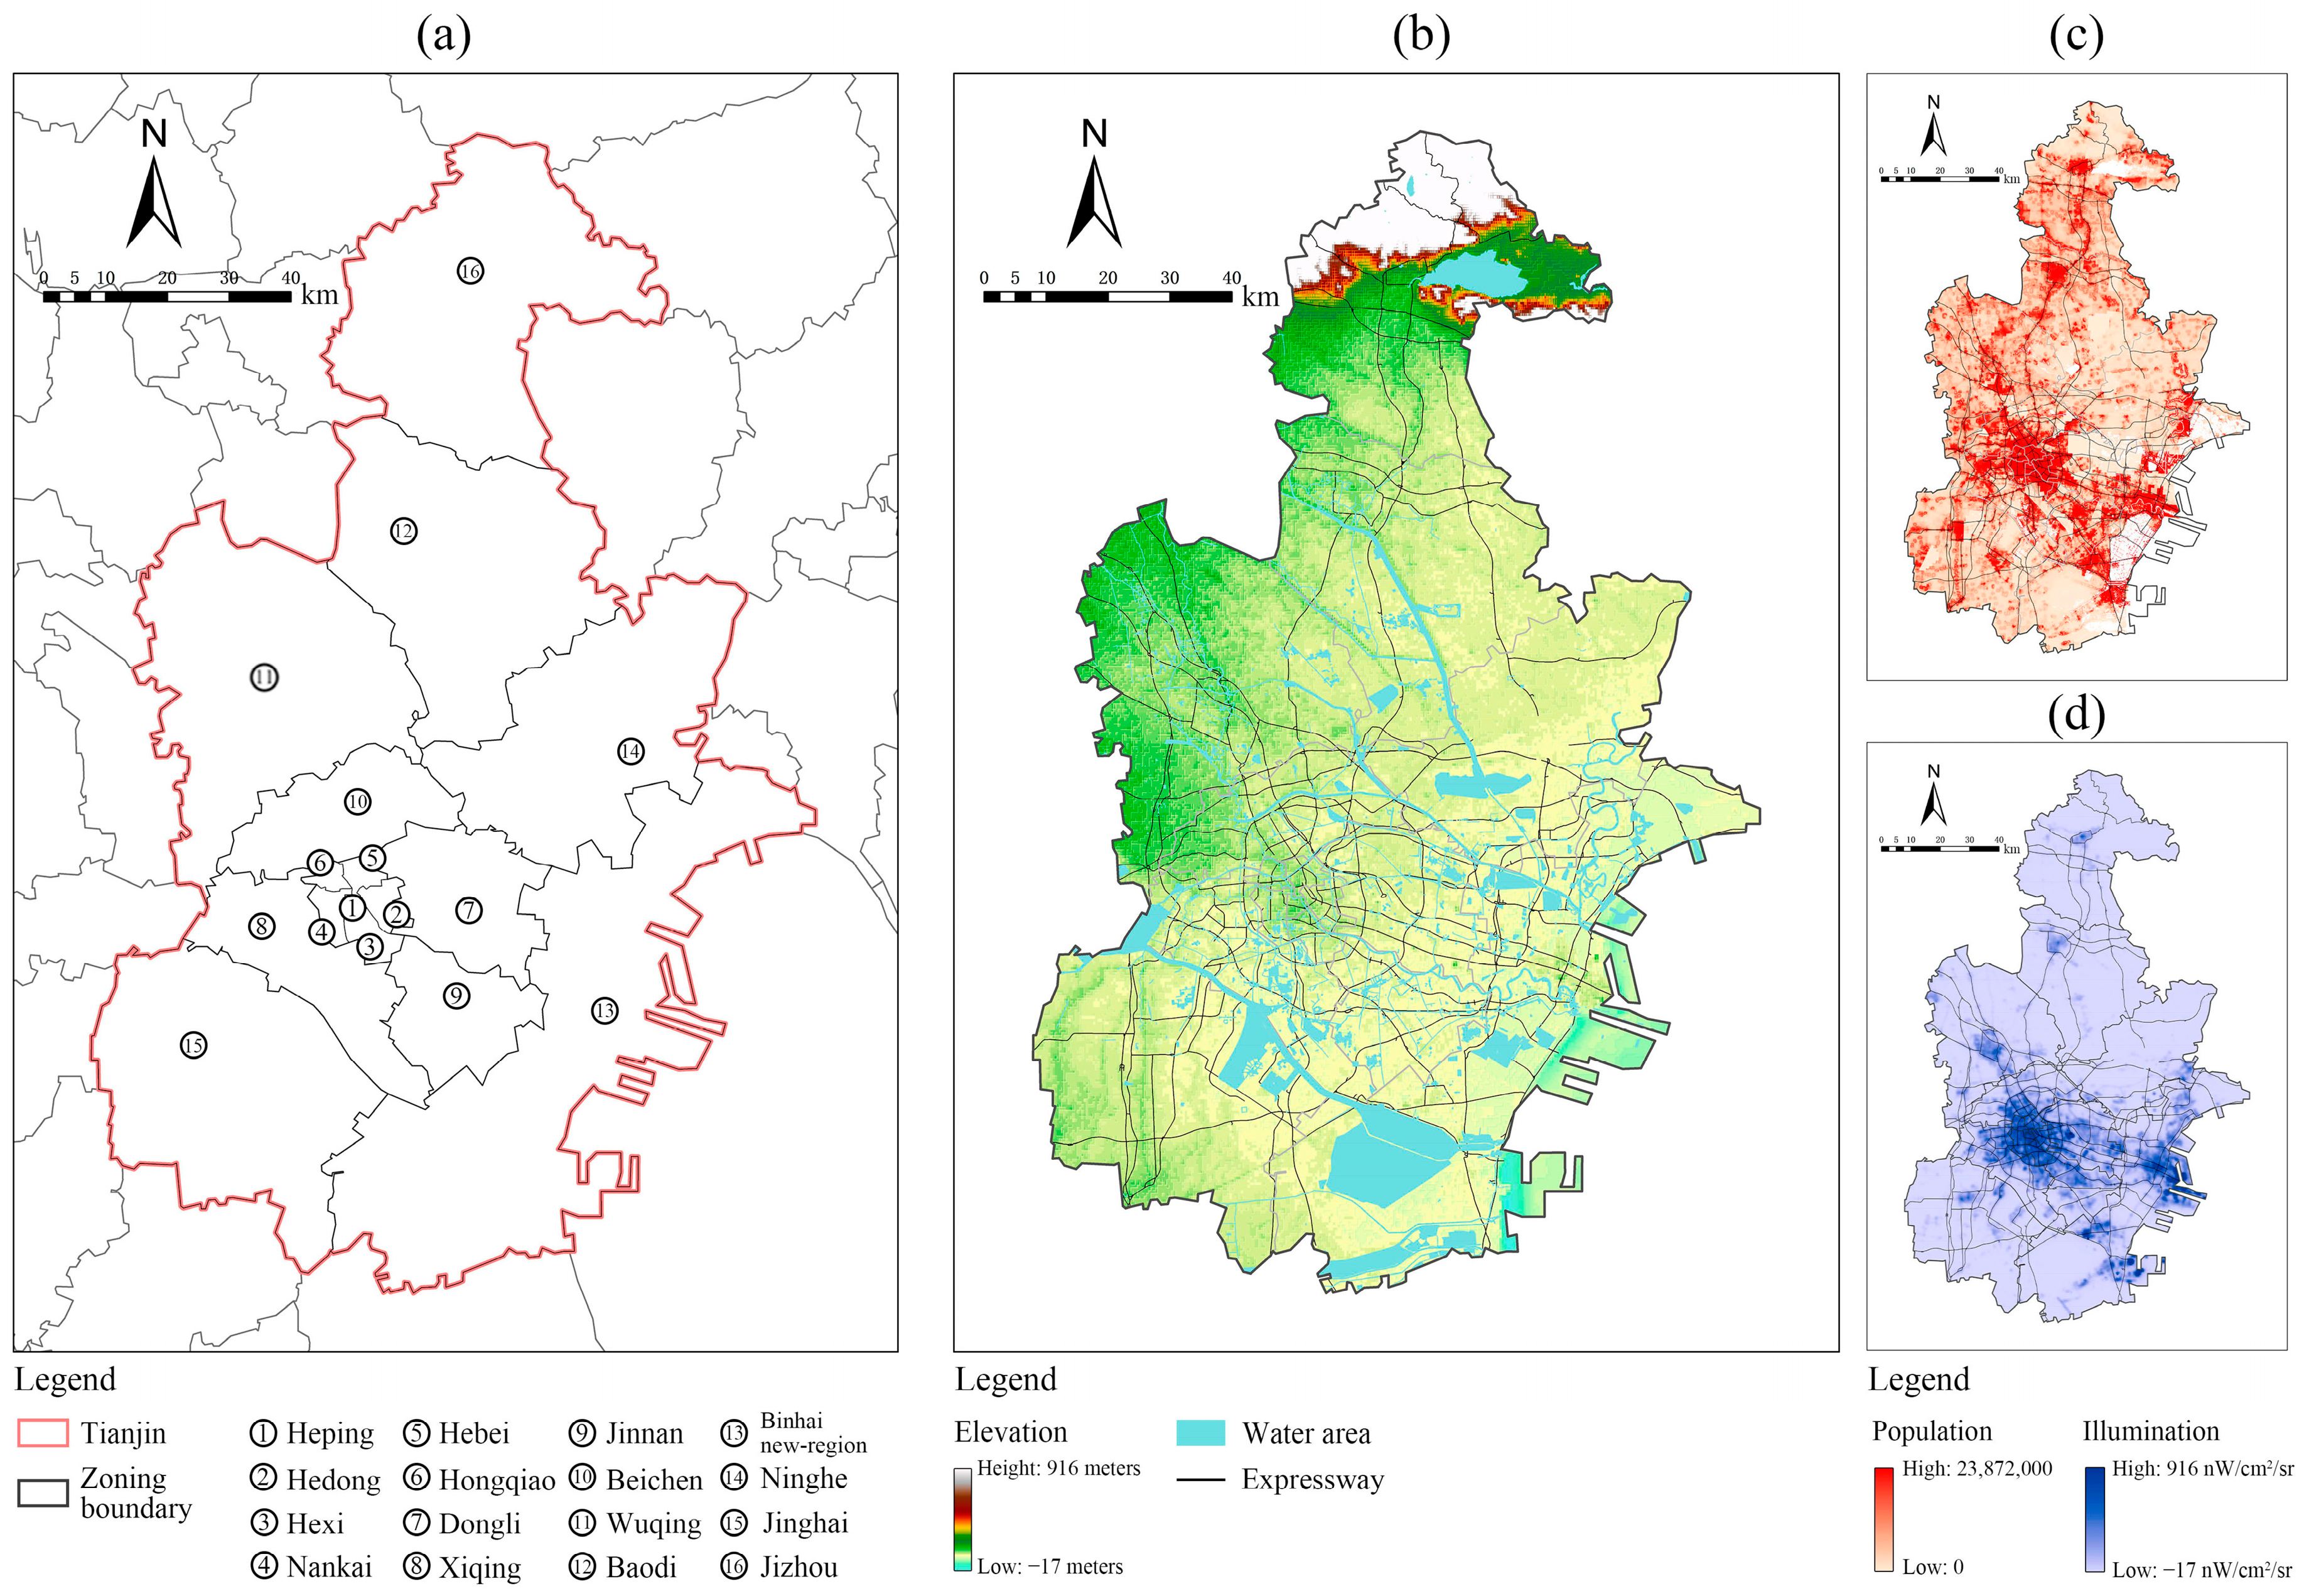
Tianjin Municipality consists of 16 administrative districts: six central districts, four suburban districts, and six peripheral districts (Figure 3a). The city covers a total area of 11,966.45 km2, bordered by the Bohai Sea to the east and the Yanshan Mountains to the north. Its terrain slopes gradually from north to south and is enriched with abundant river resources (Figure 3b). The permanent population is concentrated mainly in the central urban districts and the Binhai New Area, forming a substantial consumer base (Figure 3c). As a historic and cultural city in northern China, Tianjin contains numerous heritage districts and cultural resources. The Haihe River and its tributaries provide essential ecological services, while modern commercial leisure coexists with traditional market consumption, resulting in diverse consumption scenarios. Nevertheless, significant disparities exist among districts in terms of economic development and urban construction levels (Figure 3d). To capture spatial benefit differences at a finer granularity, the study area was gridded into 250 m × 250 m analysis units.

3.2. Data Sources and Processing

This study collects multi-source big data, including satellite remote sensing imagery, social media commentary, fitness check-in records, and official statistical yearbooks, to obtain objective environmental conditions, subjective perceptions, and specific consumption behavior information required for the research. All data undergoes preprocessing and grid-based processing before being input into the analysis grid units (totaling 12,571 analysis unit samples).

3.2.1. Consuming Behavior Data

Sports consumption data originates from Keep, China’s largest fitness application, which records anonymized users’ voluntarily uploaded exercise logs. We scraped outdoor activity records from April to September 2024 via API interfaces, encompassing outdoor running, cycling, brisk walking, jump rope, ball sports, etc. Physical activity intensity is represented by duration, while Shannon diversity index measures activity variety. Business consumption data is sourced from lifestyle service apps like Dianping and Ctrip. We first categorized commercial activities into retail, food service, daily services, and entertainment. Using these categories, we scraped user counts and average per capita spending from May to September 2024 to represent commercial transaction volume. Cultural consumption data was obtained through social media and official statistics released by tourist attractions.

3.2.2. Consumer Perception Data

Consumer perception data is sourced from public social media platforms such as Dianping and Weibo. By searching topic columns related to attractions, museums, dining, retail, entertainment, and green spaces, we systematically crawled and categorized anonymous consumer reviews posted online within the past six months for sentiment analysis. After cleaning sentences that were too short or lacked clear emotional bias, we applied the BosonNLP sentiment lexicon to calculate sentiment scores [61], converting textual data into continuous values ranging from −1 to 1.

3.2.3. Consumer Environment and Socio-Economic Data

To comprehensively characterize Tianjin’s consumption environment and socioeconomic context, this study integrates multi-source spatial data from platforms including AutoNavi Maps, OpenStreetMap, WorldPop, and NASA Earthdata. In data processing, transportation accessibility was quantified using ArcGIS 10.8 network analyst. The quantity and density distribution of various facilities were statistically analyzed through spatial overlay analysis, while facility diversity was measured using the Shannon diversity index. Other continuous variables, such as population density and vegetation coverage, were uniformly aggregated to standard grid cells via raster analysis.

3.3. Technical Routes

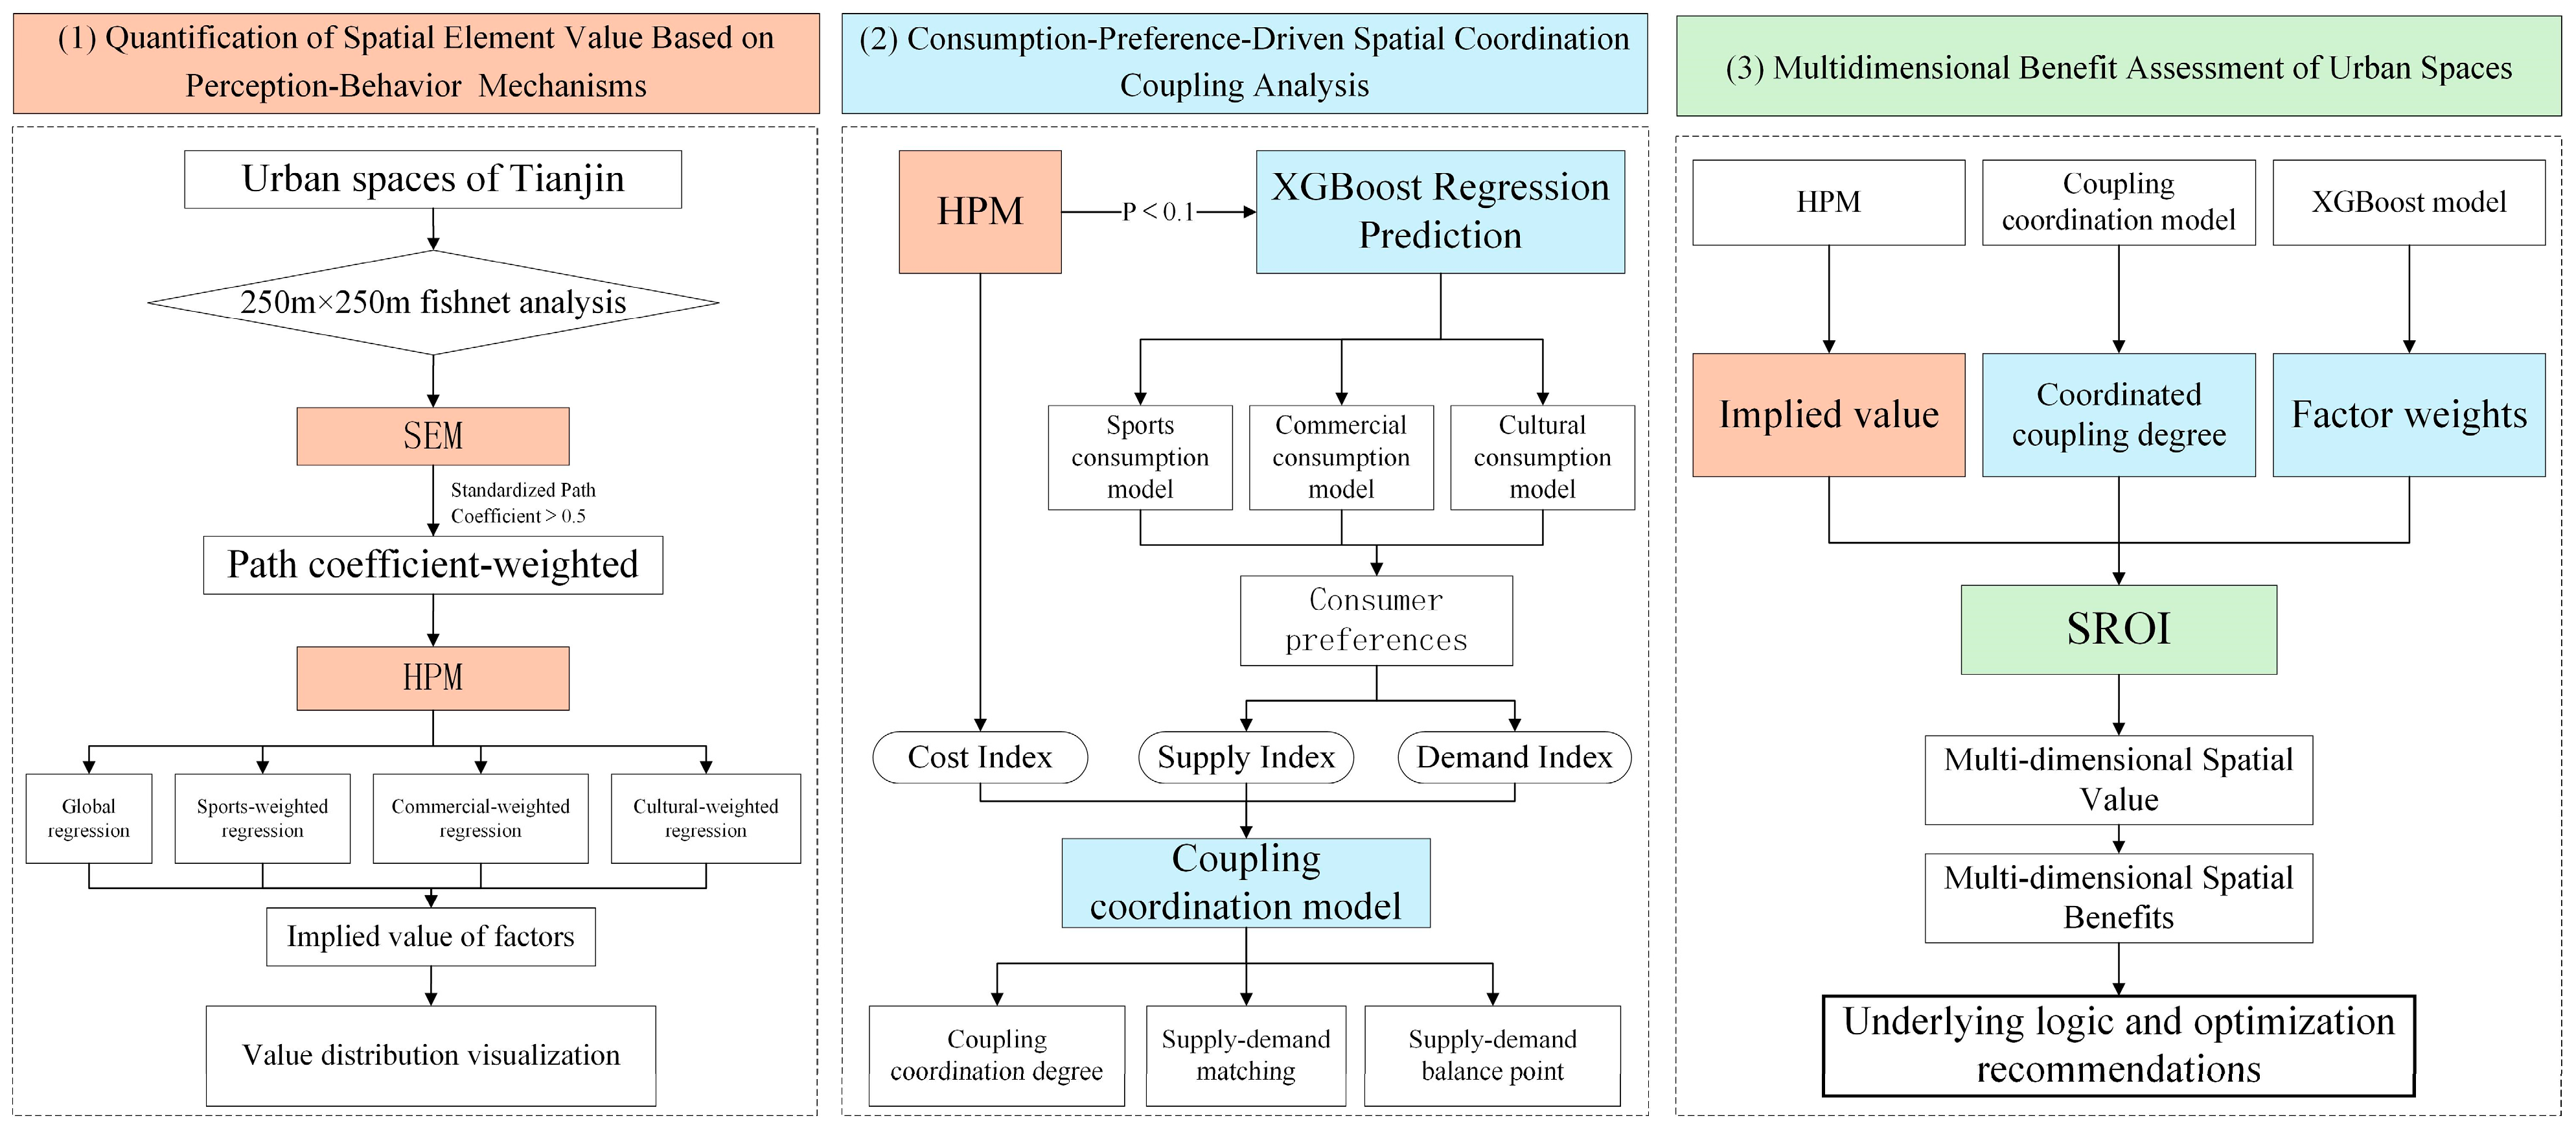
The research design followed three main stages (Figure A1 and Figure 4). First, a systematic review was conducted to examine the mechanisms linking multidimensional urban spatial value and consumption preferences in the context of spatial consumption transformation and supply-demand imbalance. Based on this, a theoretical research model was constructed and empirically tested using Tianjin as the study case. Finally, the underlying logic of spatial benefit distribution was identified, and optimization strategies were proposed.
In the first stage, SEM was combined with the HPM to establish an analytical framework for multidimensional urban spatial benefits and to quantify the latent value of key indicators. In the second stage, indicators with higher latent value were selected as features for XGBoost regression to predict residents’ consumption preferences and to assess the coordination between spatial supply and consumption demand. In the final stage, the results were synthesized to calculate overall urban spatial value and multidimensional benefits, thereby providing a comprehensive evaluation of Tianjin’s spatial efficiency and policy implications.

3.4. Methodology

3.4.1. Structural Equation Modeling

Structural equation modeling is a technique used to explore complex causal relationships among variables [26]. This study employs SEM to validate the mediating effects of variables such as consumer perceptions and socioeconomic attributes within the SOR chain, while quantifying the influence pathways between these variables. Building upon this, standardized path coefficients are incorporated as key weights into the HPM, ensuring the relative importance of consumer preferences in quantifying the latent value of spatial elements.

3.4.2. Hedonic Pricing Model

The hedonic pricing model is an economic model used to assess the value of goods or services:
P i = β 0 + i = 1 p β i X i
In this paper, Pi represents the monetary value generated by a series of consumption behaviors such as residential prices, scenic spot admission fees, or commercial transaction volumes. Xi denotes factors influencing this value (e.g., transportation, ecology, culture). By revealing consumers’ willingness to pay for the consumption environment, the value of environmental factors is assessed. This study employs ordinary least squares (OLS) and weighted least squares (WLS) for calculation:
β ^ O L S = a r g   min β i = 1 n P i β 0 i = 1 p β i X i 2
β ^ W L S = a r g   min β i = 1 n w r P i β 0 i = 1 p β i X i 2
In the equation, Xi represents the SEM path coefficient-weighted independent variable, wr denotes the consumption behavior weight, and βi signifies the regression coefficient, i.e., the latent value of the factor.

3.4.3. XGBoost Regression Model

This study employs XGBoost to investigate the threshold relationship between consumption environment and consumption preferences [62]. By selecting indicators with high implicit value, we model and predict the impact of sports consumption, commercial consumption, and cultural consumption on consumption preferences, while deriving indicator weights and supply-demand indices. The formula is as follows:
ω i = V a r r S h a p l e y r , i j = 1 V a r r S h a p l e y r , j
In the formula, ω i represents the weight of the i-th indicator; S h a p l e y r , i denotes the importance of the i-th indicator in the r-th unit; S h a p l e y r , j indicates the importance of all indicators.
S r = i = 1 n ω i S r , i
D r = y ^ r x g b o o s t
In the formula, S r denotes the supply index of the rth unit; S r , i represents the normalized value of the ith supply indicator within the rth unit; ω i signifies the weight of the ith supply indicator. D r indicates the demand index of the rth unit; y ^ r x g b o o s t represents the normalized predicted value for the rth unit.

3.4.4. Coupling Coordination Degree

The coupling coordination degree model emphasizes the integrated and intrinsic development convergence and hierarchical structure of systems to reveal the interactions within urban systems [63]. In this paper, it is used to identify the supply-demand patterns and equilibrium points between the consumption environment and consumption preferences, as expressed by the following formula:
C = 2 · S r · D r ( S r · D r ) 2
T = α S r + 1 α D r
D = C · T
In the formula, C represents the coupling degree; T denotes the coordination degree; signifies the weighting factor for the supply and demand systems (where supply and demand are equally important in this paper, thus α = 0.5); D indicates the coupling coordination degree, with D [ 0 ,   1 ] . The closer the value approaches 1, the better the spatial coupling effect.

3.4.5. Social Return on Investment

SROI aims to integrate environmental, social, and economic costs with payment capacity by monetizing the social value generated from investments [64]. This study employs SROI to forecast the value and spatial benefits-such as sports, commercial, and cultural activities-derived from investments in the consumer environment. The formula is as follows:
B i = ω i β i X i N p o p u l a t i o n · D
C i = i = 1 3 γ i Y i
S R O I i = B i C i
In the formula, B i represents spatial value; β i denotes the indicator′s implied value; X i signifies the indicator′s standardized value; D indicates the coordination coupling degree. C i reflects societal payment capacity; γ i represents the SEM normalized path coefficient; Y i signifies the economic vitality indicator; S R O I i denotes spatial multidimensional benefits.

4. Results

4.1. Quantification of Spatial Element Value Based on Perception–Behavior Influence Mechanisms

4.1.1. Perception–Behavior Path Analysis

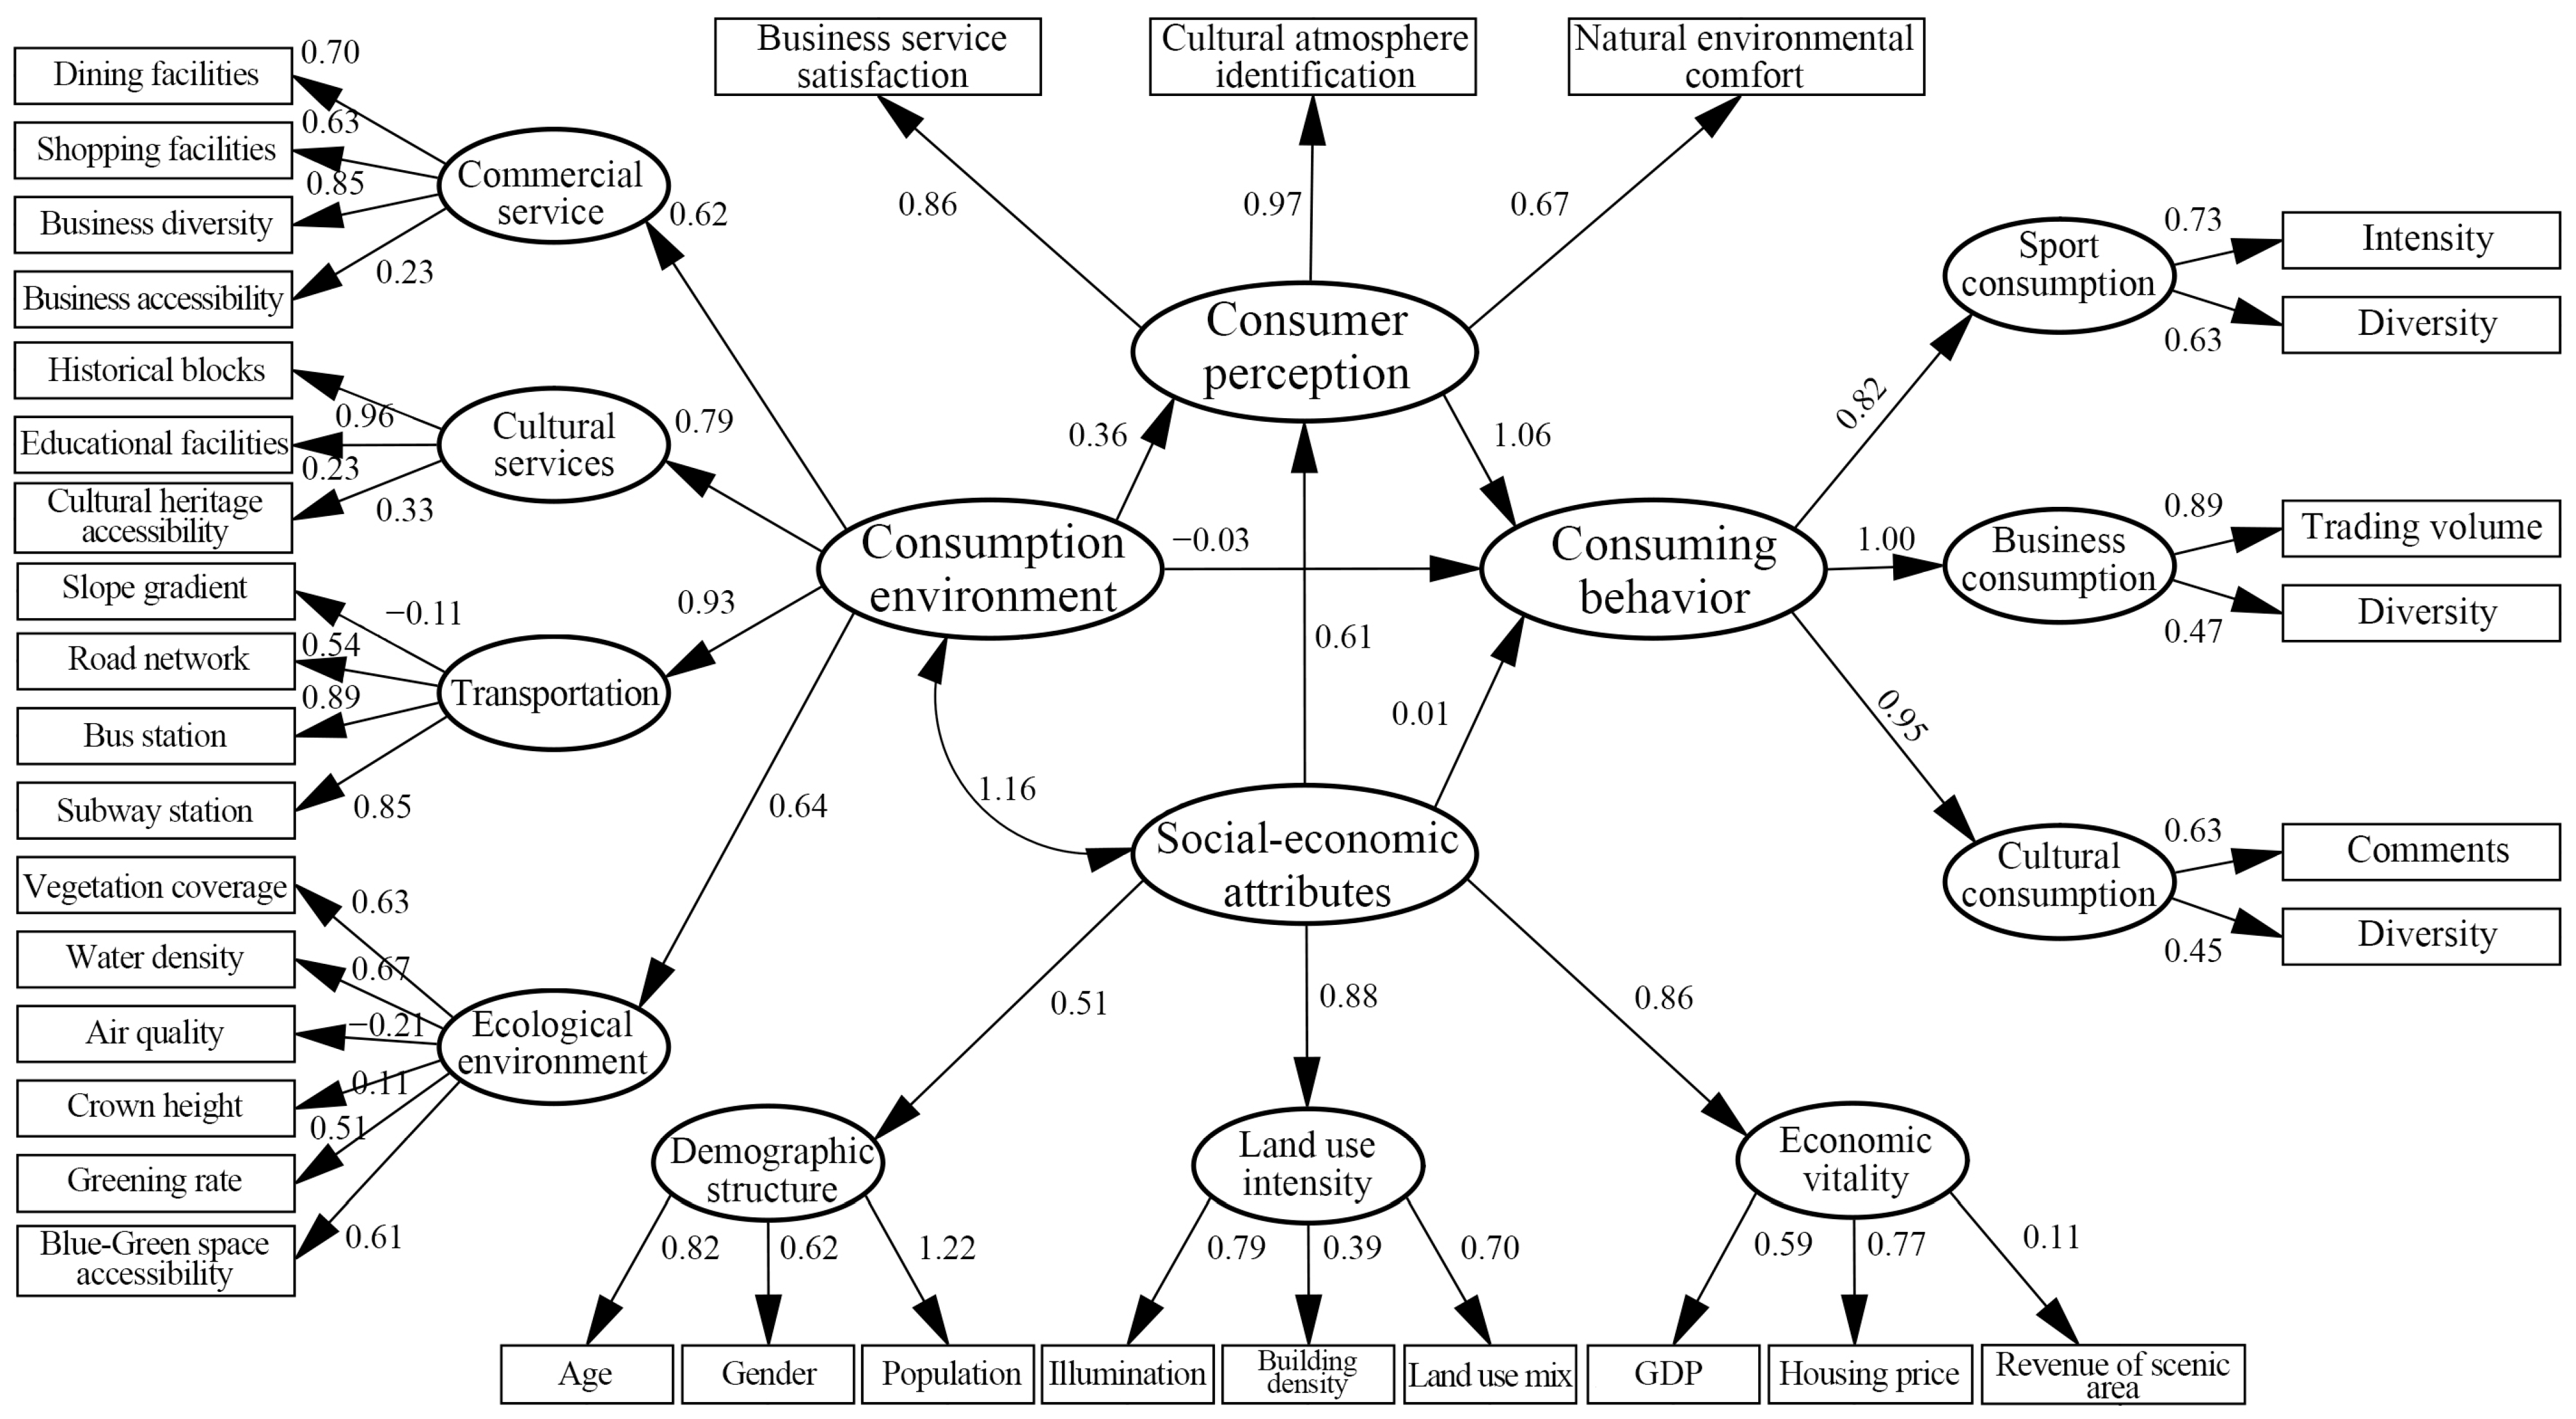
Within the perception–behavior theoretical framework, the urban consumption environment was jointly determined by multidimensional factors and multiple pathways (Figure 5). The results indicated that transportation was a key factor influencing consumption preferences, suggesting that travel convenience and destination accessibility formed the foundation for engaging in various consumption activities. Areas with more developed transportation hubs typically offered greater consumption opportunities and higher attractiveness.
The influence of the consumption environment on consuming behavior was primarily mediated through a chain of consumer perceptions, with business service satisfaction and cultural atmosphere identification playing central roles. This pattern indicated that commercial and cultural elements often served as primary destinations for citizens’ travel and consumption. By natural environment comfort mainly functioned to moderate or amplify these effects [65].
A significant feedback relationship was observed between the consumption environment and socio-economic attributes. Investment in the consumption environment was closely linked to regional population structure, land use intensity, and economic vitality, which together shaped and reinforced citizens’ consumption perceptions. Overall, the consumption environment mainly influenced consumption preferences through cognitive processing via these perceptual mediators; the direct effects of either the consumption environment or socio-economic attributes on consuming behavior were relatively limited. Therefore, enhancing subjective experiences (for example, improving service quality and enriching cultural offerings) was found to promote consumption behavior more effectively than single-factor environmental improvements, thereby increasing the social value of urban spaces.

4.1.2. Quantification of Spatial Element Value

Based on SEM path results, we further quantified the marginal willingness to pay and the implicit value of variables for different consumption preferences using the HPM framework (Table 1). The analysis showed that business diversity, road network, bus station, vegetation coverage, cultural atmosphere identification, and natural environmental comfort were significantly associated with citizens’ willingness to pay.
Distinct willingness to pay patterns emerged across consumer segments. Sports-oriented consumers exhibited higher willingness to pay for greater vegetation coverage, adequate nighttime illumination, and strong ecological-cultural perception. Business-oriented consumers were most sensitive to the number and diversity of business facilities; in some areas, however, additional investment in ecological amenities and infrastructure produced negative marginal effects, suggesting those areas are approaching or have reached supply saturation. Cultural consumers obtained substantial economic returns from investments in cultural carriers (e.g., historic blocks), and their willingness to spend increased further when perceptions of the natural environment were favorable.
By comparing the spatial distribution characteristics of five highly significant factors (Figure A2), revealed that the implicit value of business diversity for daily and commercial consumption concentrated in densely populated residential areas, reflecting these regions’ strong reliance on everyday commercial services. By contrast, the ecological and cultural resources demanded by sports- and culture-oriented consumers were found to be saturated in these dense zones. Consequently, more effective investments should have been directed toward the periphery of the central districts. Road network exhibited high marginal value for consuming behavior. The spatial pattern of willingness to pay for bus station closely matched road network and business diversity, indicating supply saturation in the urban core. Illumination also produced diminishing marginal returns in dense areas: beyond meeting specific nighttime activity needs (e.g., evening sports), additional investment rarely increased overall willingness to spend. In summary, the implicit values of factors displayed significant spatial clustering and were strongly shaped by supply-demand saturation: areas with superior ecological and service endowments suppressed the marginal value of corresponding factors, generating a gradient pattern with lower values in the inner six districts and higher values toward peripheral counties.

4.2. Spatial Coordination Coupling Analysis Driven by Consumption Preferences

4.2.1. Multidimensional Drivers of Consumption Preferences

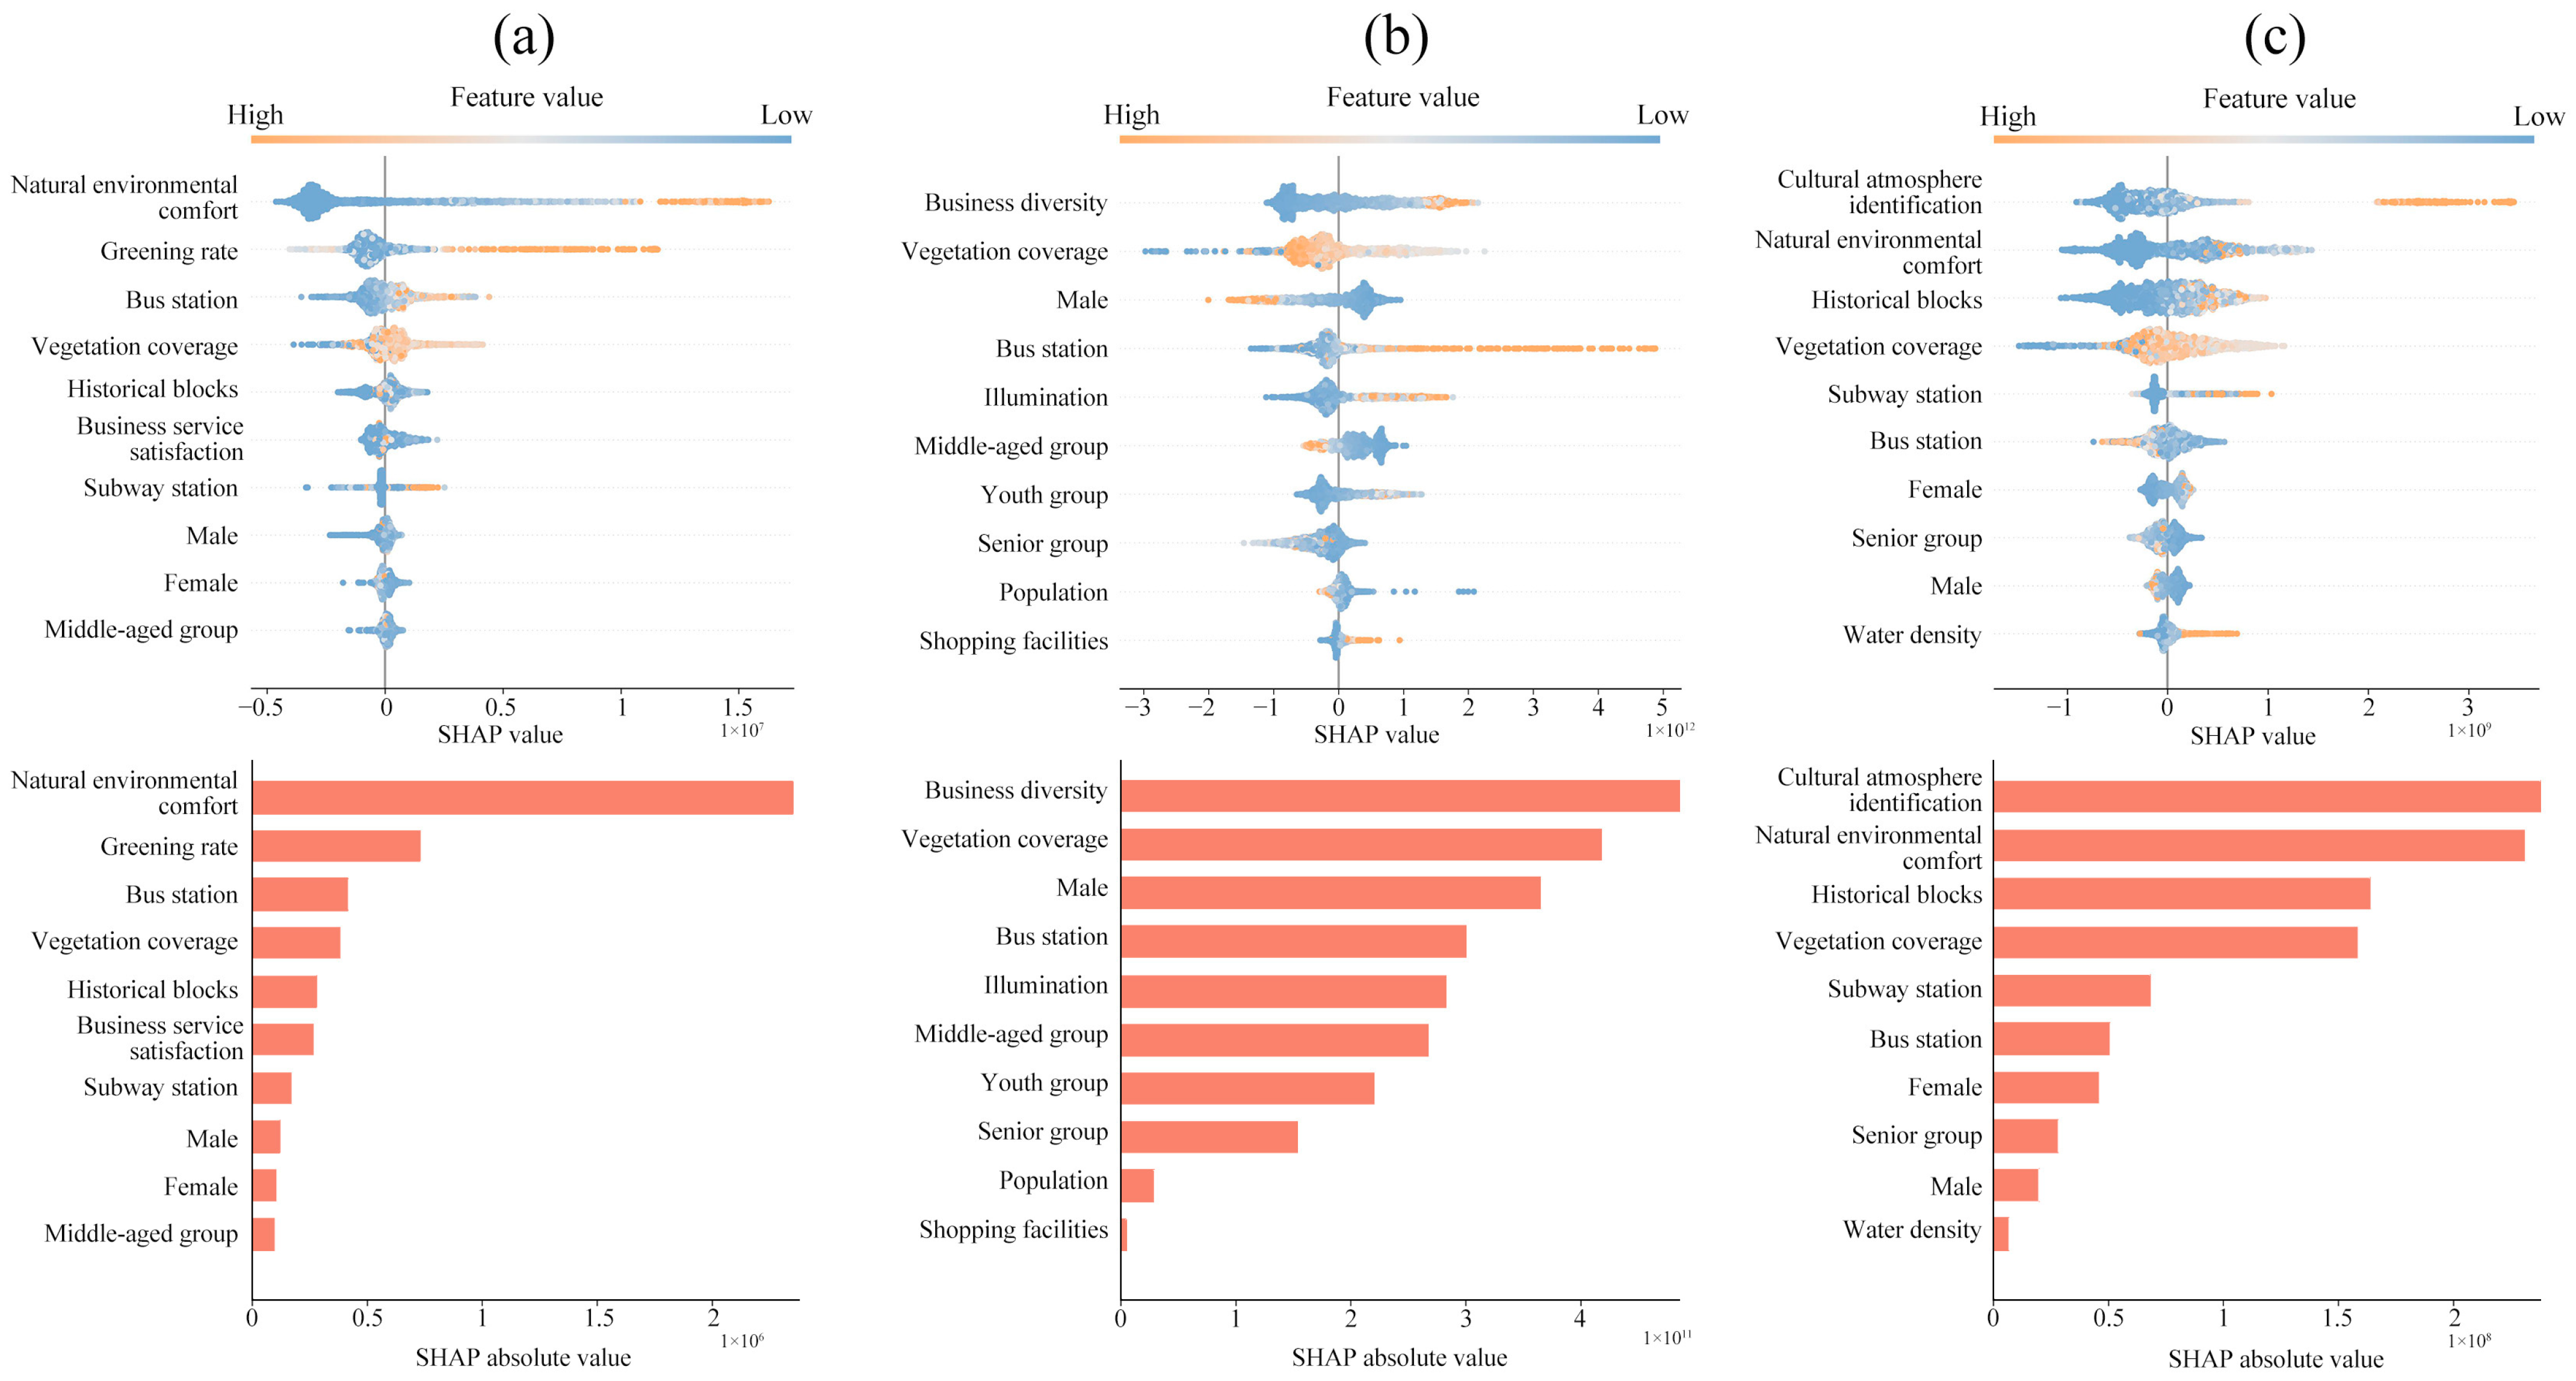
We employed XGBoost regression to model variables with high implicit value for sports, business, and cultural consumption (Table 2). Based on these models, we analyzed consumption preferences, threshold effects, and interaction effects to evaluate supply-demand coupling in the consumption environment and to identify optimal balance points. Overall, greening ratio, business diversity, public facility density, and environmental perception exerted significant influences on consumption preferences. However, distinct consumption types displayed different sensitivities and directional responses to these factors (Figure 6).
Sports consumption depended more heavily on perceived natural environment quality, contiguous green spaces, and illumination, while it showed lower reliance on commercial facilities and public transit. Business consumption was primarily driven by business diversity, bus station, and illumination; however, commercial activity was suppressed in areas with dense vegetation or higher proportions of male consumers, indicating that ecological and demographic factors could weaken commercial demand in some zones. Cultural consumption was principally driven by perceived cultural identification and natural environment comfort, with transportation accessibility exerting a weaker effect, suggesting that cultural consumers prioritized venue atmosphere and quality over mere accessibility or commercialization.
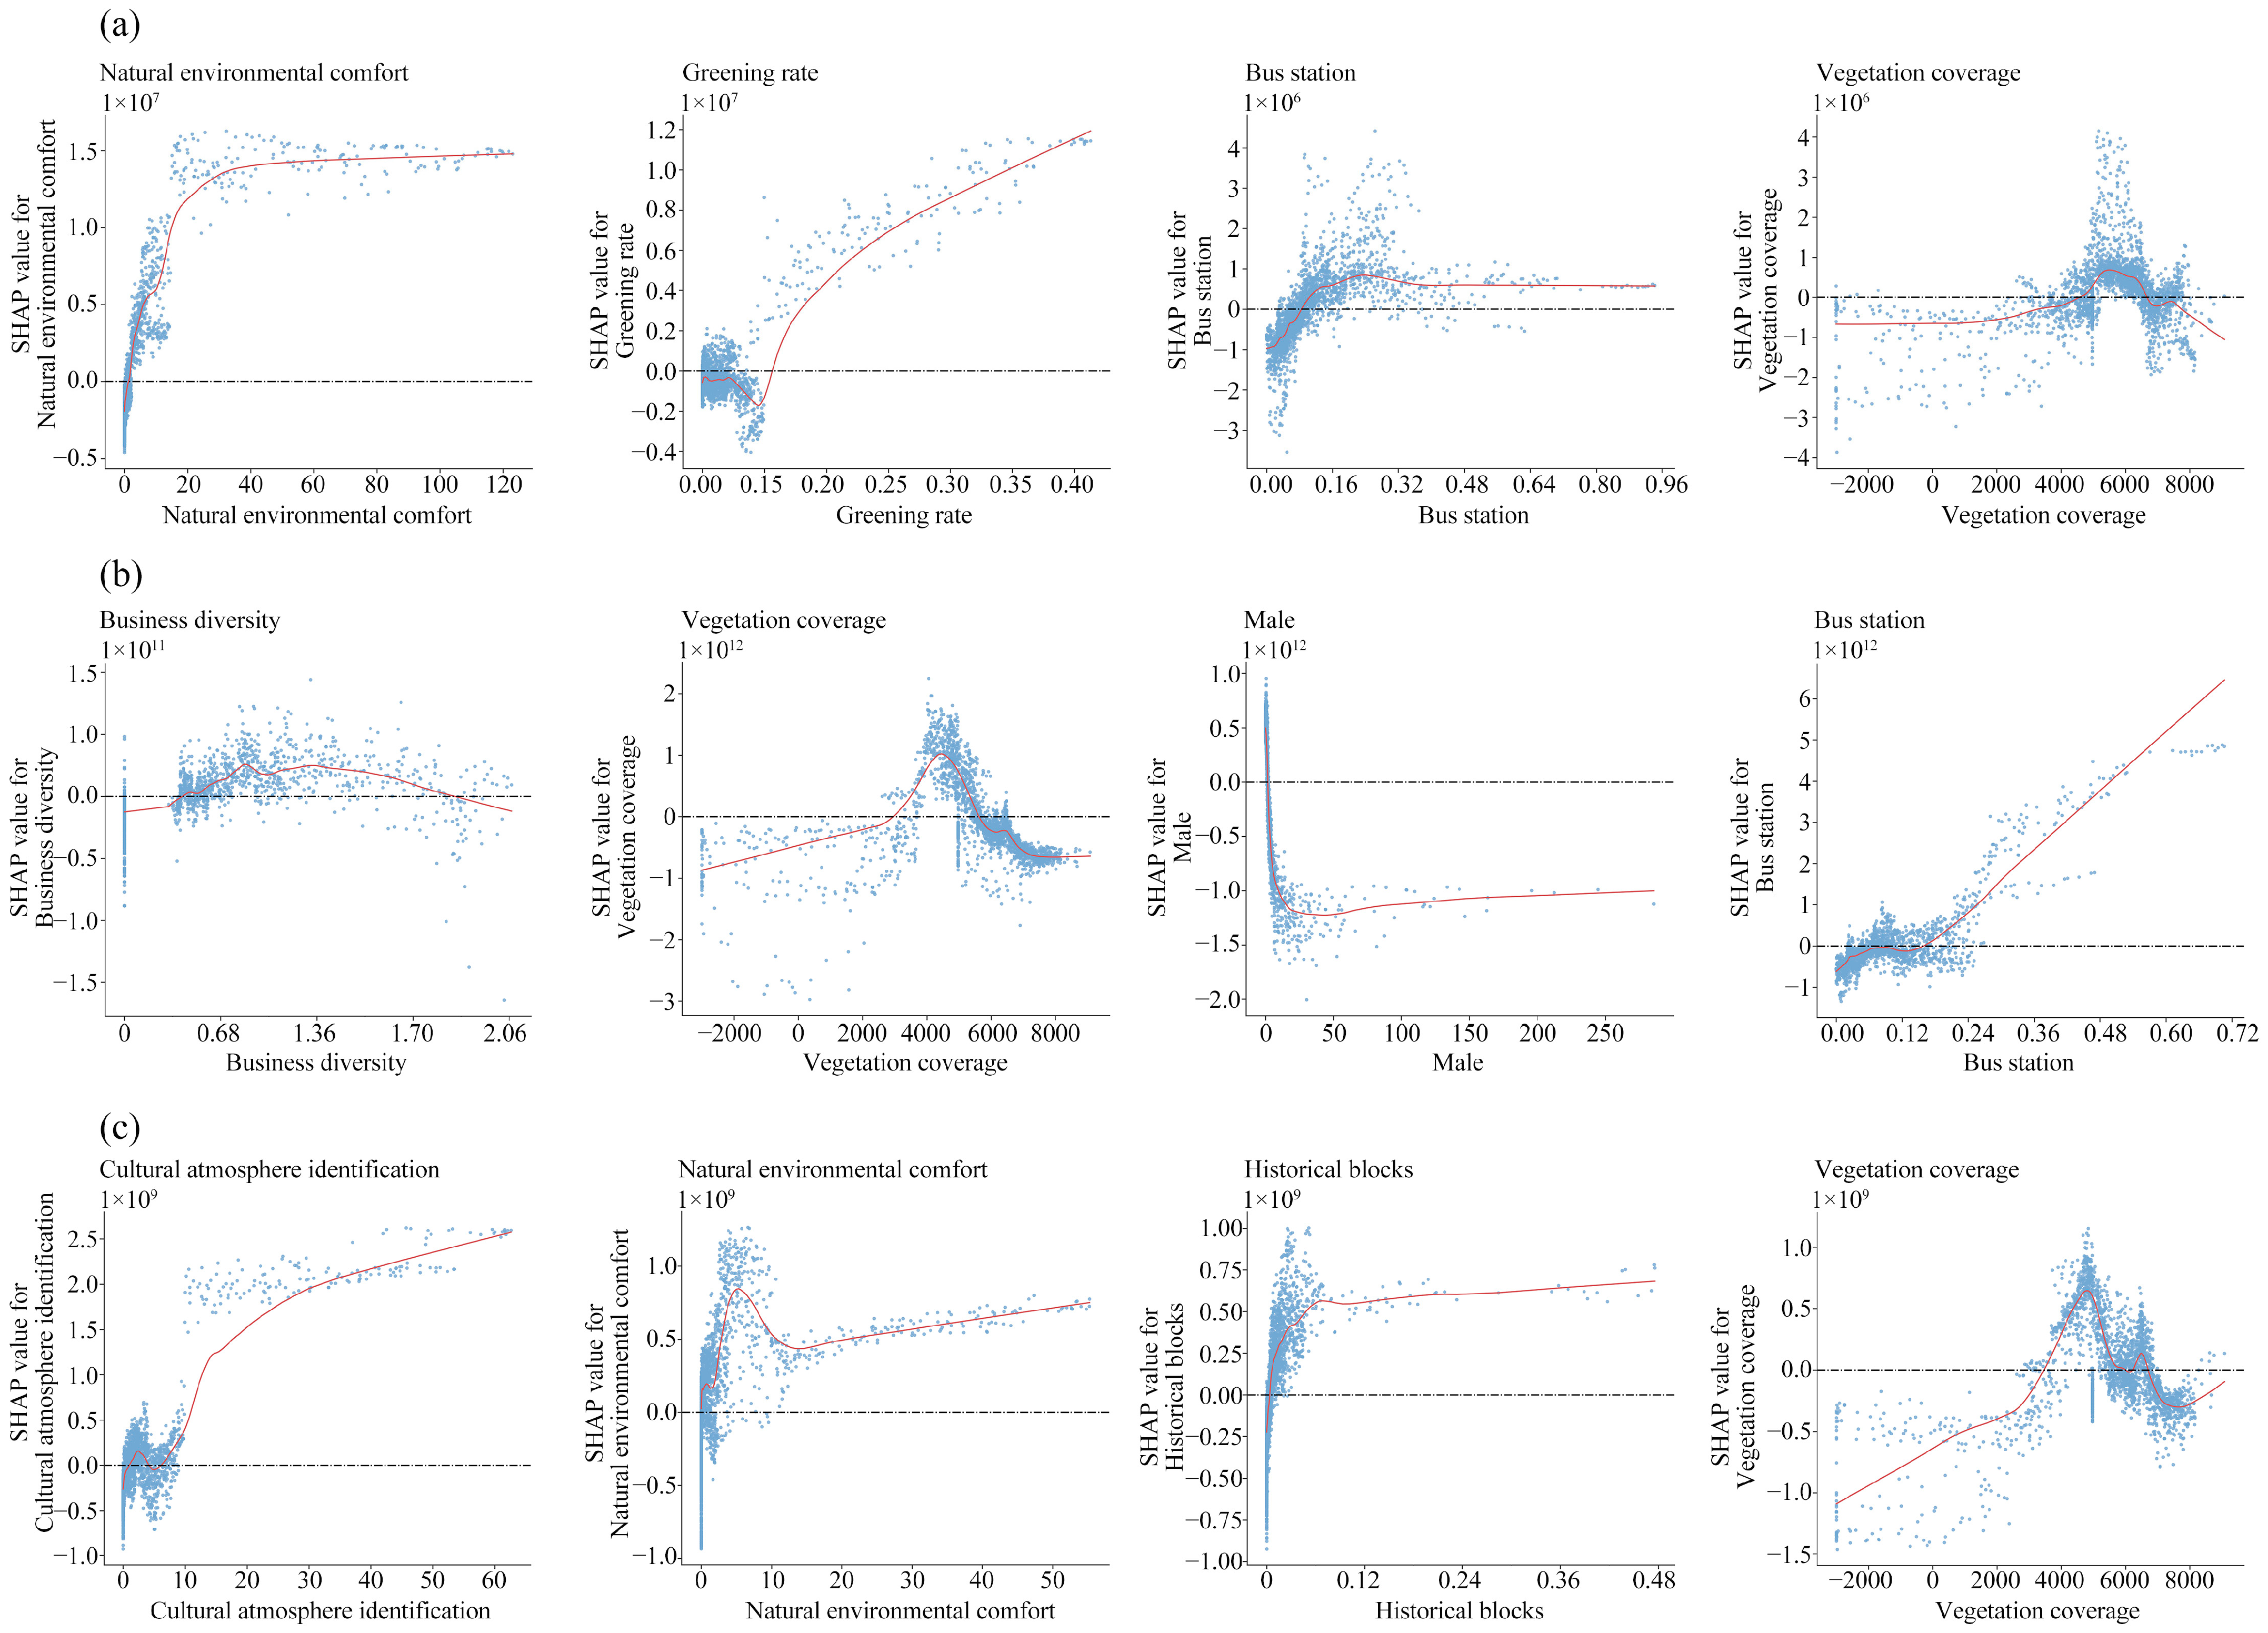
We further examined threshold effects and marginal impacts for the four most influential indicators. Perceived natural environment quality exerted a significant pulling effect on sports consumption even at low investment levels, though it exhibited diminishing marginal returns. The positive effect of greening ratio on sports consumption increased markedly after a threshold of approximately 0.15. The univariate effects of bus station and vegetation coverage were relatively moderate and primarily played auxiliary roles via interactions with other factors (Figure 7a). In commercial consumption model, the promotional effect of public transport accessibility was particularly pronounced. Responses to business diversity and vegetation coverage followed an approximately normal-shaped pattern: both very high and very low levels reduced consumer interest (Figure 7b). For cultural consumption, the influence of cultural atmosphere identification substantially exceeded that of perceived natural environment quality. Historic blocks approached saturation at a low threshold (≈0.09), suggesting that a modest presence of cultural carriers could establish basic cultural recognition and appeal. Further improvements in perceived place atmosphere were required to expand cultural consumption (Figure 7c).
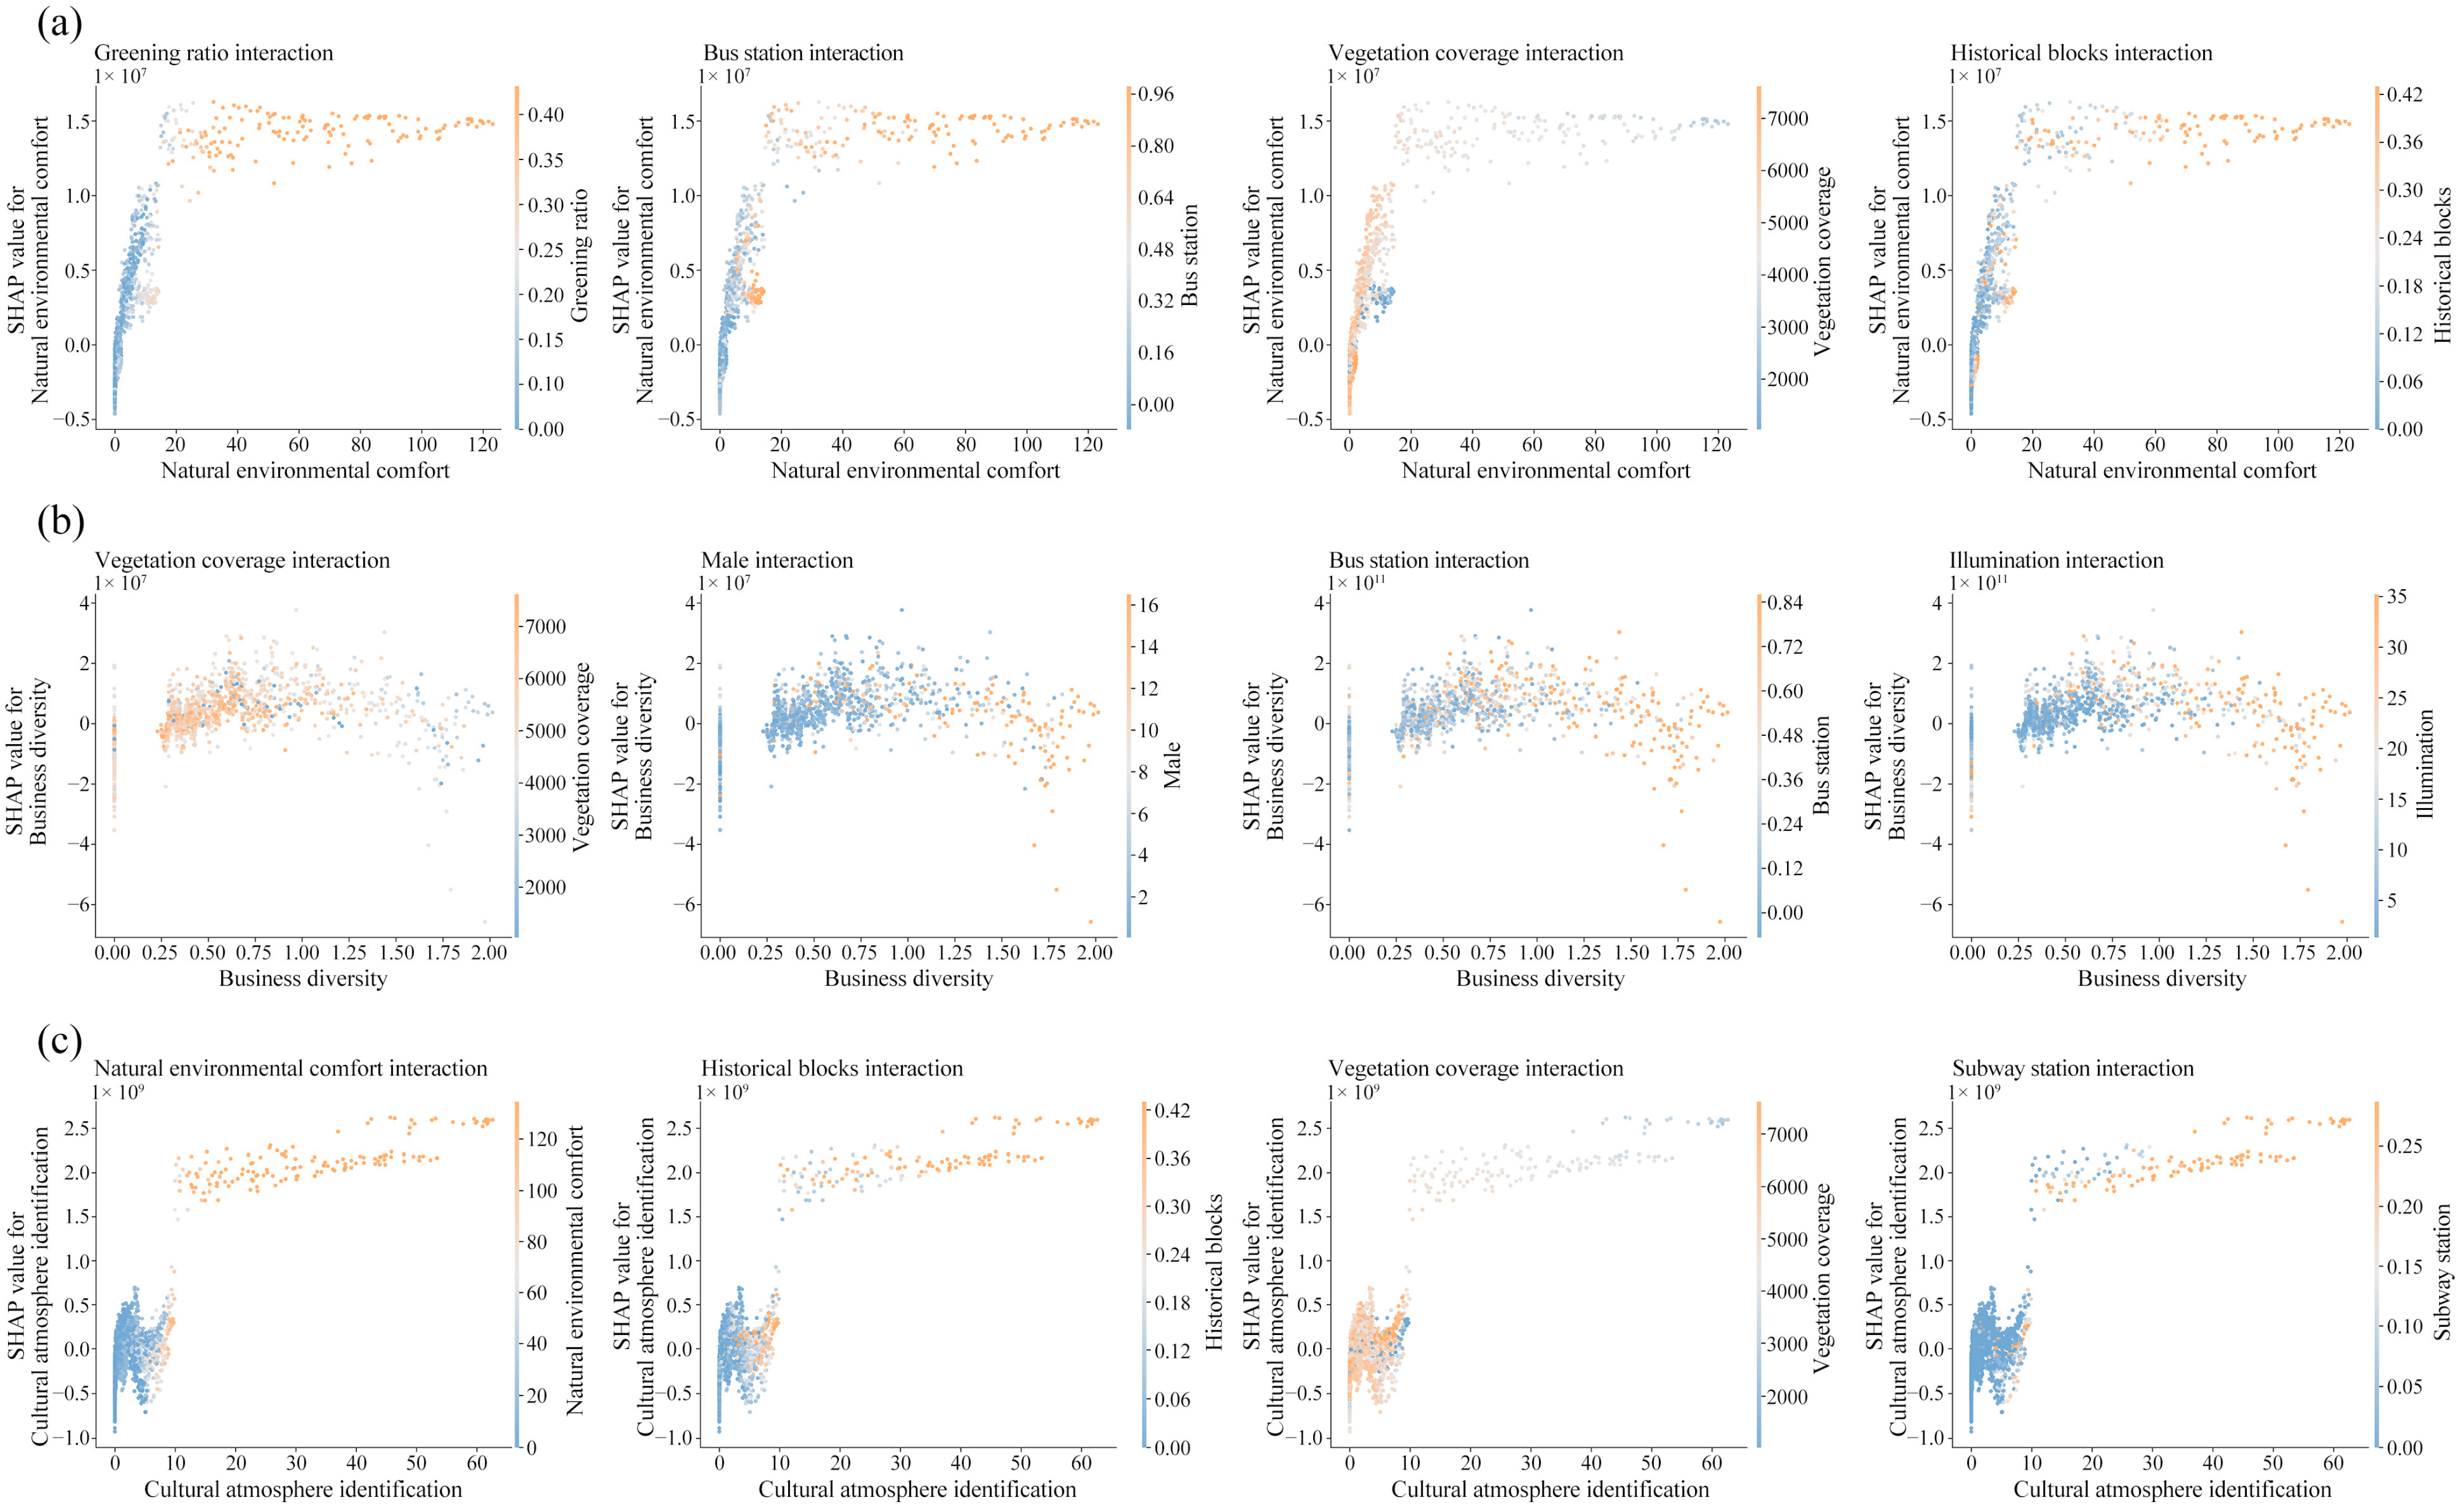
Interaction analysis showed that the combined effect of vegetation coverage mainly appeared in low-value samples and often manifested as negative impacts, implying that merely increasing inaccessible or unusable greenery could weaken perceptions of the natural environment and constrain sports and cultural consumption (Figure 8). For sports consumption, greening ratio, bus station, and historic blocks interacted positively with natural environmental comfort, jointly enhancing participation in sports activities. For commercial consumption, business diversity needed to be complemented by adequate public transit and lighting infrastructure to produce substantial increases in citizen spending. Cultural consumption relied primarily on the synergy between natural environment perception and historic blocks density under conditions of high cultural atmosphere identification.
In summary, merely increasing a single type of physical element while neglecting accessibility, supporting facilities, and usability will struggle to significantly boost citizens’ actual consuming behavior. This phenomenon reveals the underlying logic of environment-driven consumer preferences: consuming behavior is not triggered by the linear accumulation of elements but rather depends on whether they can reach a critical threshold and generate synergistic effects. First, excessive investment in a single environmental element faces diminishing marginal returns. Once the functional saturation point is exceeded, further investment fails to generate additional consumption incentives. Second, the realization of benefits from any consumption environment factor depends on the “system.” For instance, green spaces lacking accessible pathways and usable facilities cannot translate into effective perceptions of natural comfort, thereby extinguishing their potential value in consumption behavior. Therefore, urban planning and investment decisions should shift from a “supply-oriented” to a “purpose-oriented” approach, ensuring public investments precisely reach critical thresholds to efficiently convert spatial resources into spatial benefits and citizen well-being.

4.2.2. Coordinated Coupling Degree and Spatial Matching

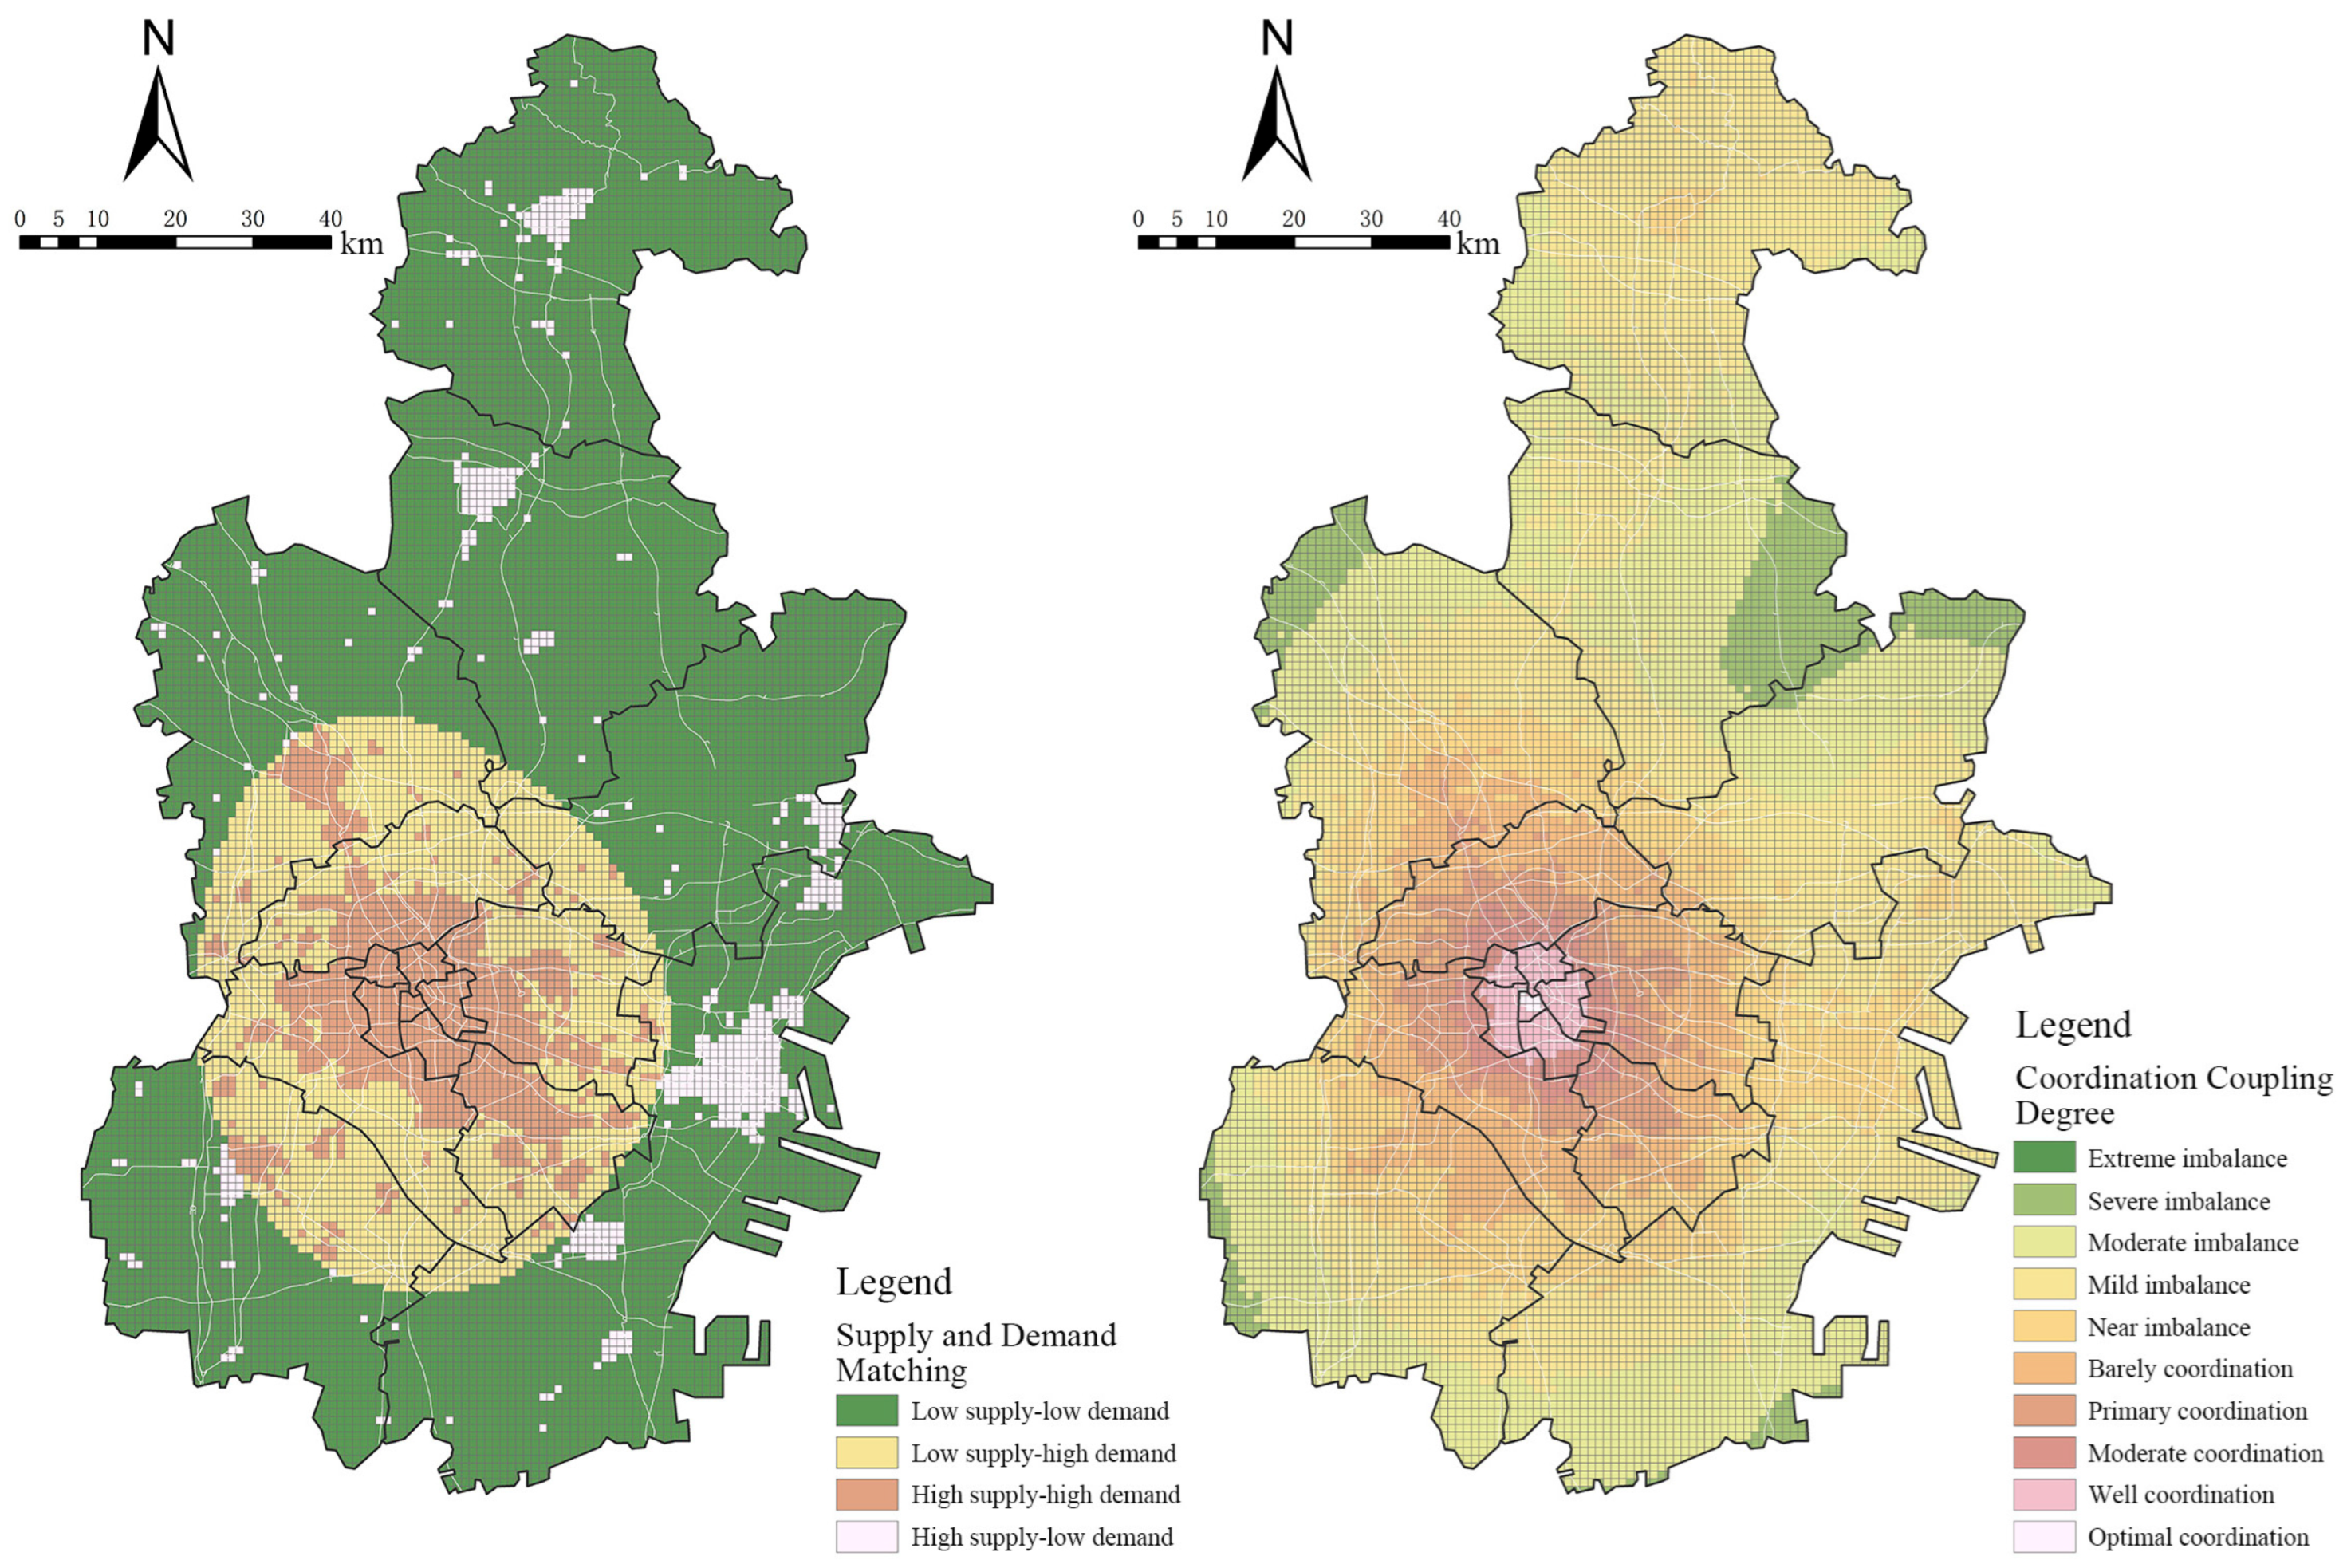
By integrating SEM path weights with XGBoost feature importance, we constructed a supply-demand index for consumption preferences and calculated the coupling-coordination degree (Figure 9). Spatially, Tianjin’s central districts (the six central districts and the four suburban districts) exhibited overall high consumption demand, while high supply was concentrated in the urban core. Several densely populated peripheral districts and counties displayed excess supply relative to demand, producing a gradient in coupling intensity that declined from inner to outer areas. This pattern suggested that investment in the consumption environment tended to favor the city center with limited spillover to surrounding zones.
Analysis of balance points further indicated (Figure A3) that activating business consumption required greater diversity in commercial formats (with a higher balance point than culture and sports), whereas sports consumption required balanced investment in high-quality road networks and contiguous green space. By contrast, balance points for illumination and bus station were relatively low, implying that marginal increases in these elements approached diminishing returns in some areas under the existing structure. Therefore, planning and investment in supply-dense areas should have focused on improving service quality and business diversity to meet residential and commercial needs; in the periphery of saturated dense zones, increased investment in transport, continuous green space, and cultural facilities were needed to support the spatial expansion of sports and experiential consumption.

4.3. Multidimensional Spatial Benefit Assessment

4.3.1. Consumption-Driven Urban Spatial Value

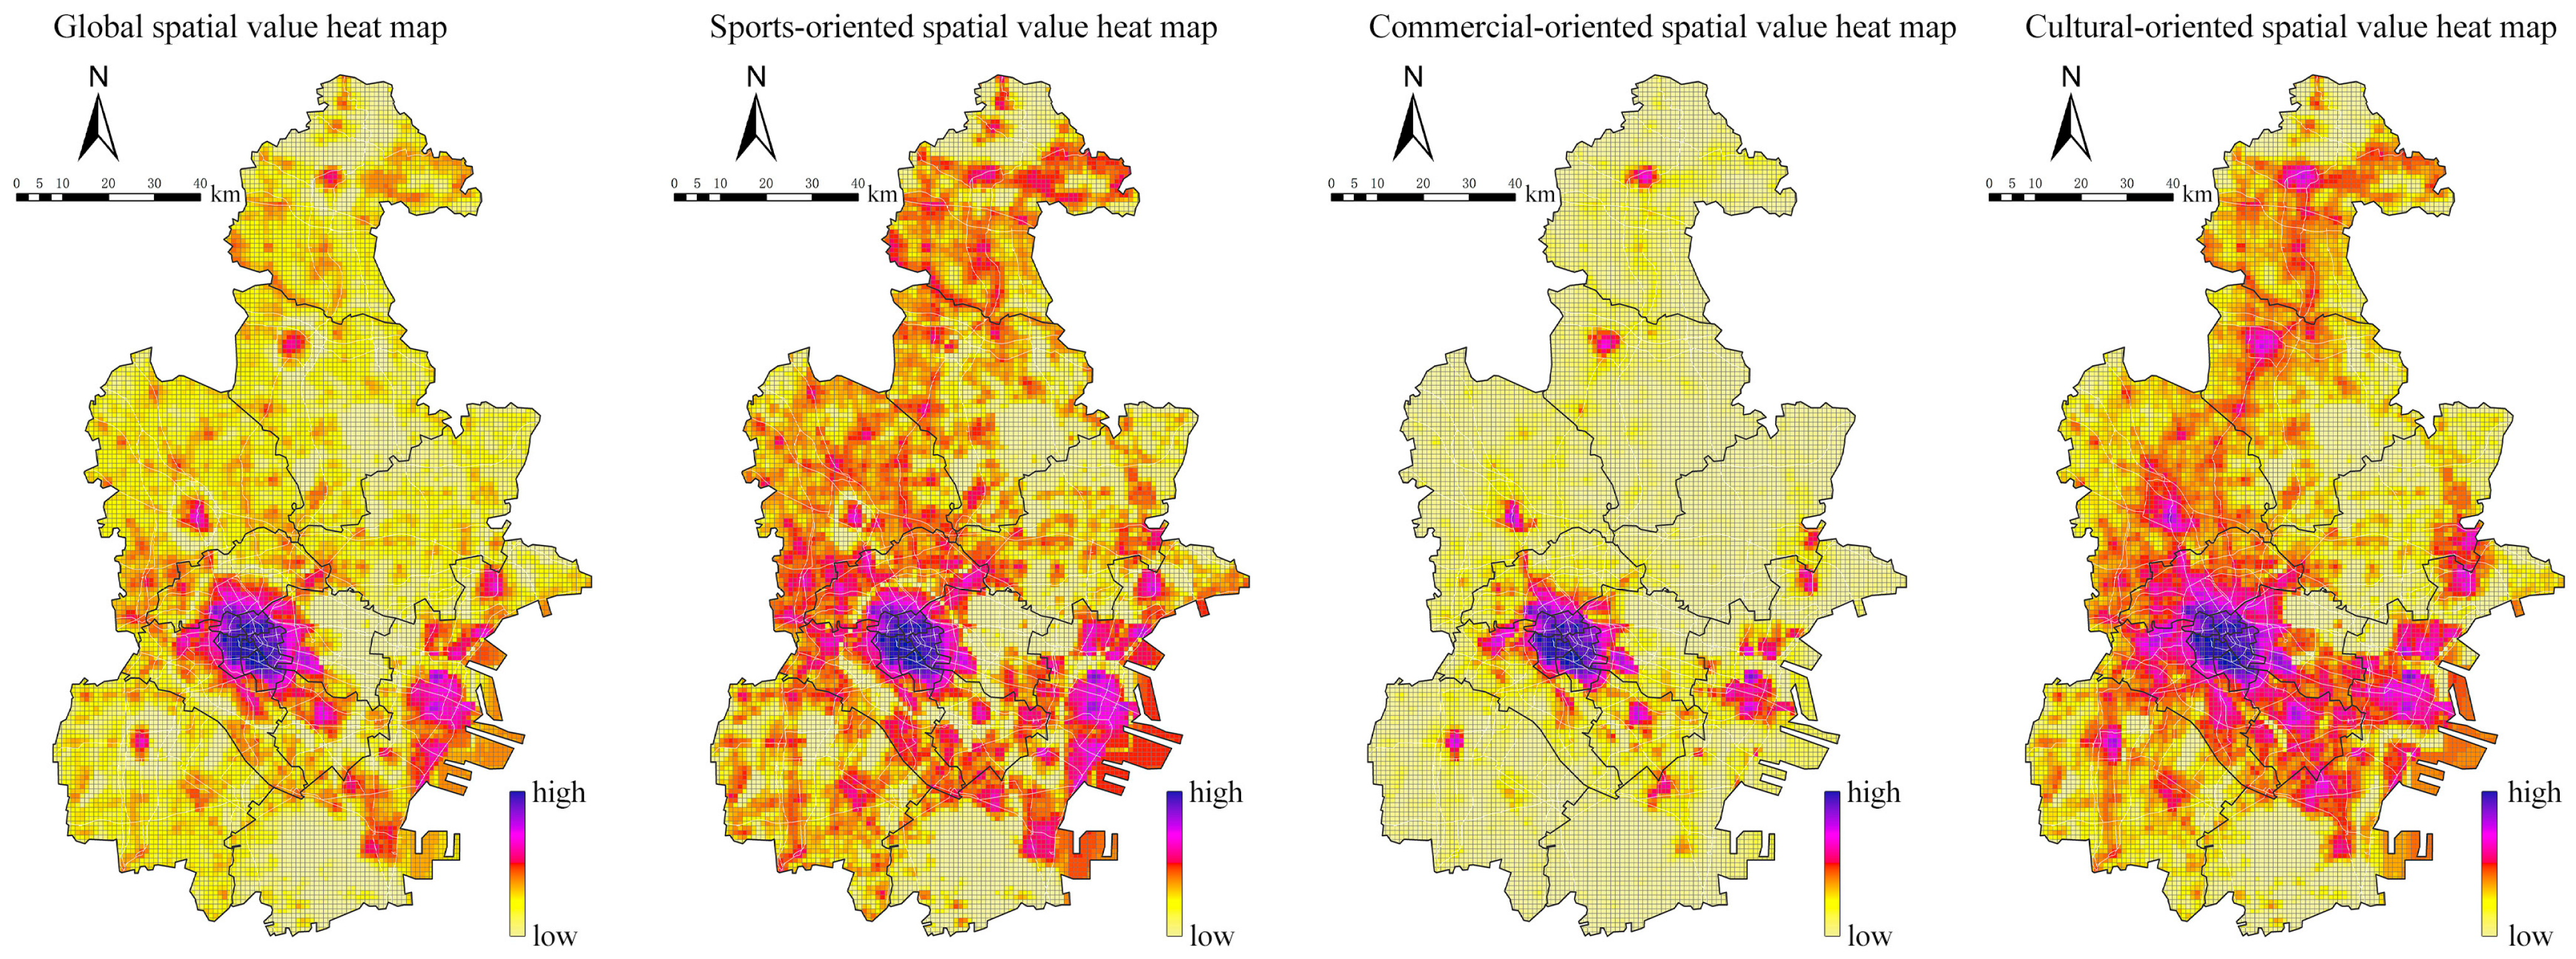
Using consumption preferences and the spatial coupling coordination degree, we computed Tianjin’s spatial value for different consumption orientations (Figure 10). Overall, high-value spaces clustered within the six central urban districts and the Binhai New Area and were positively associated with population density and development level. Business-oriented spatial value largely mirrored the overall spatial-value distribution, while sports- and culture-oriented spatial value increased markedly in peripheral counties. This pattern reflected spatial-value heterogeneity driven by supply-demand preferences: central districts attained higher value for daily and business consumption due to dense populations and comprehensive amenities, whereas experiential sports and cultural consumption did not necessarily yield greater spatial value in core areas. On the contrary, high facility density in the center sometimes reduced consumers’ perceptions of cultural and sports environments, resulting in a diffusion of value toward peripheral areas.

4.3.2. Multidimensional Benefit Assessment of Urban Spaces

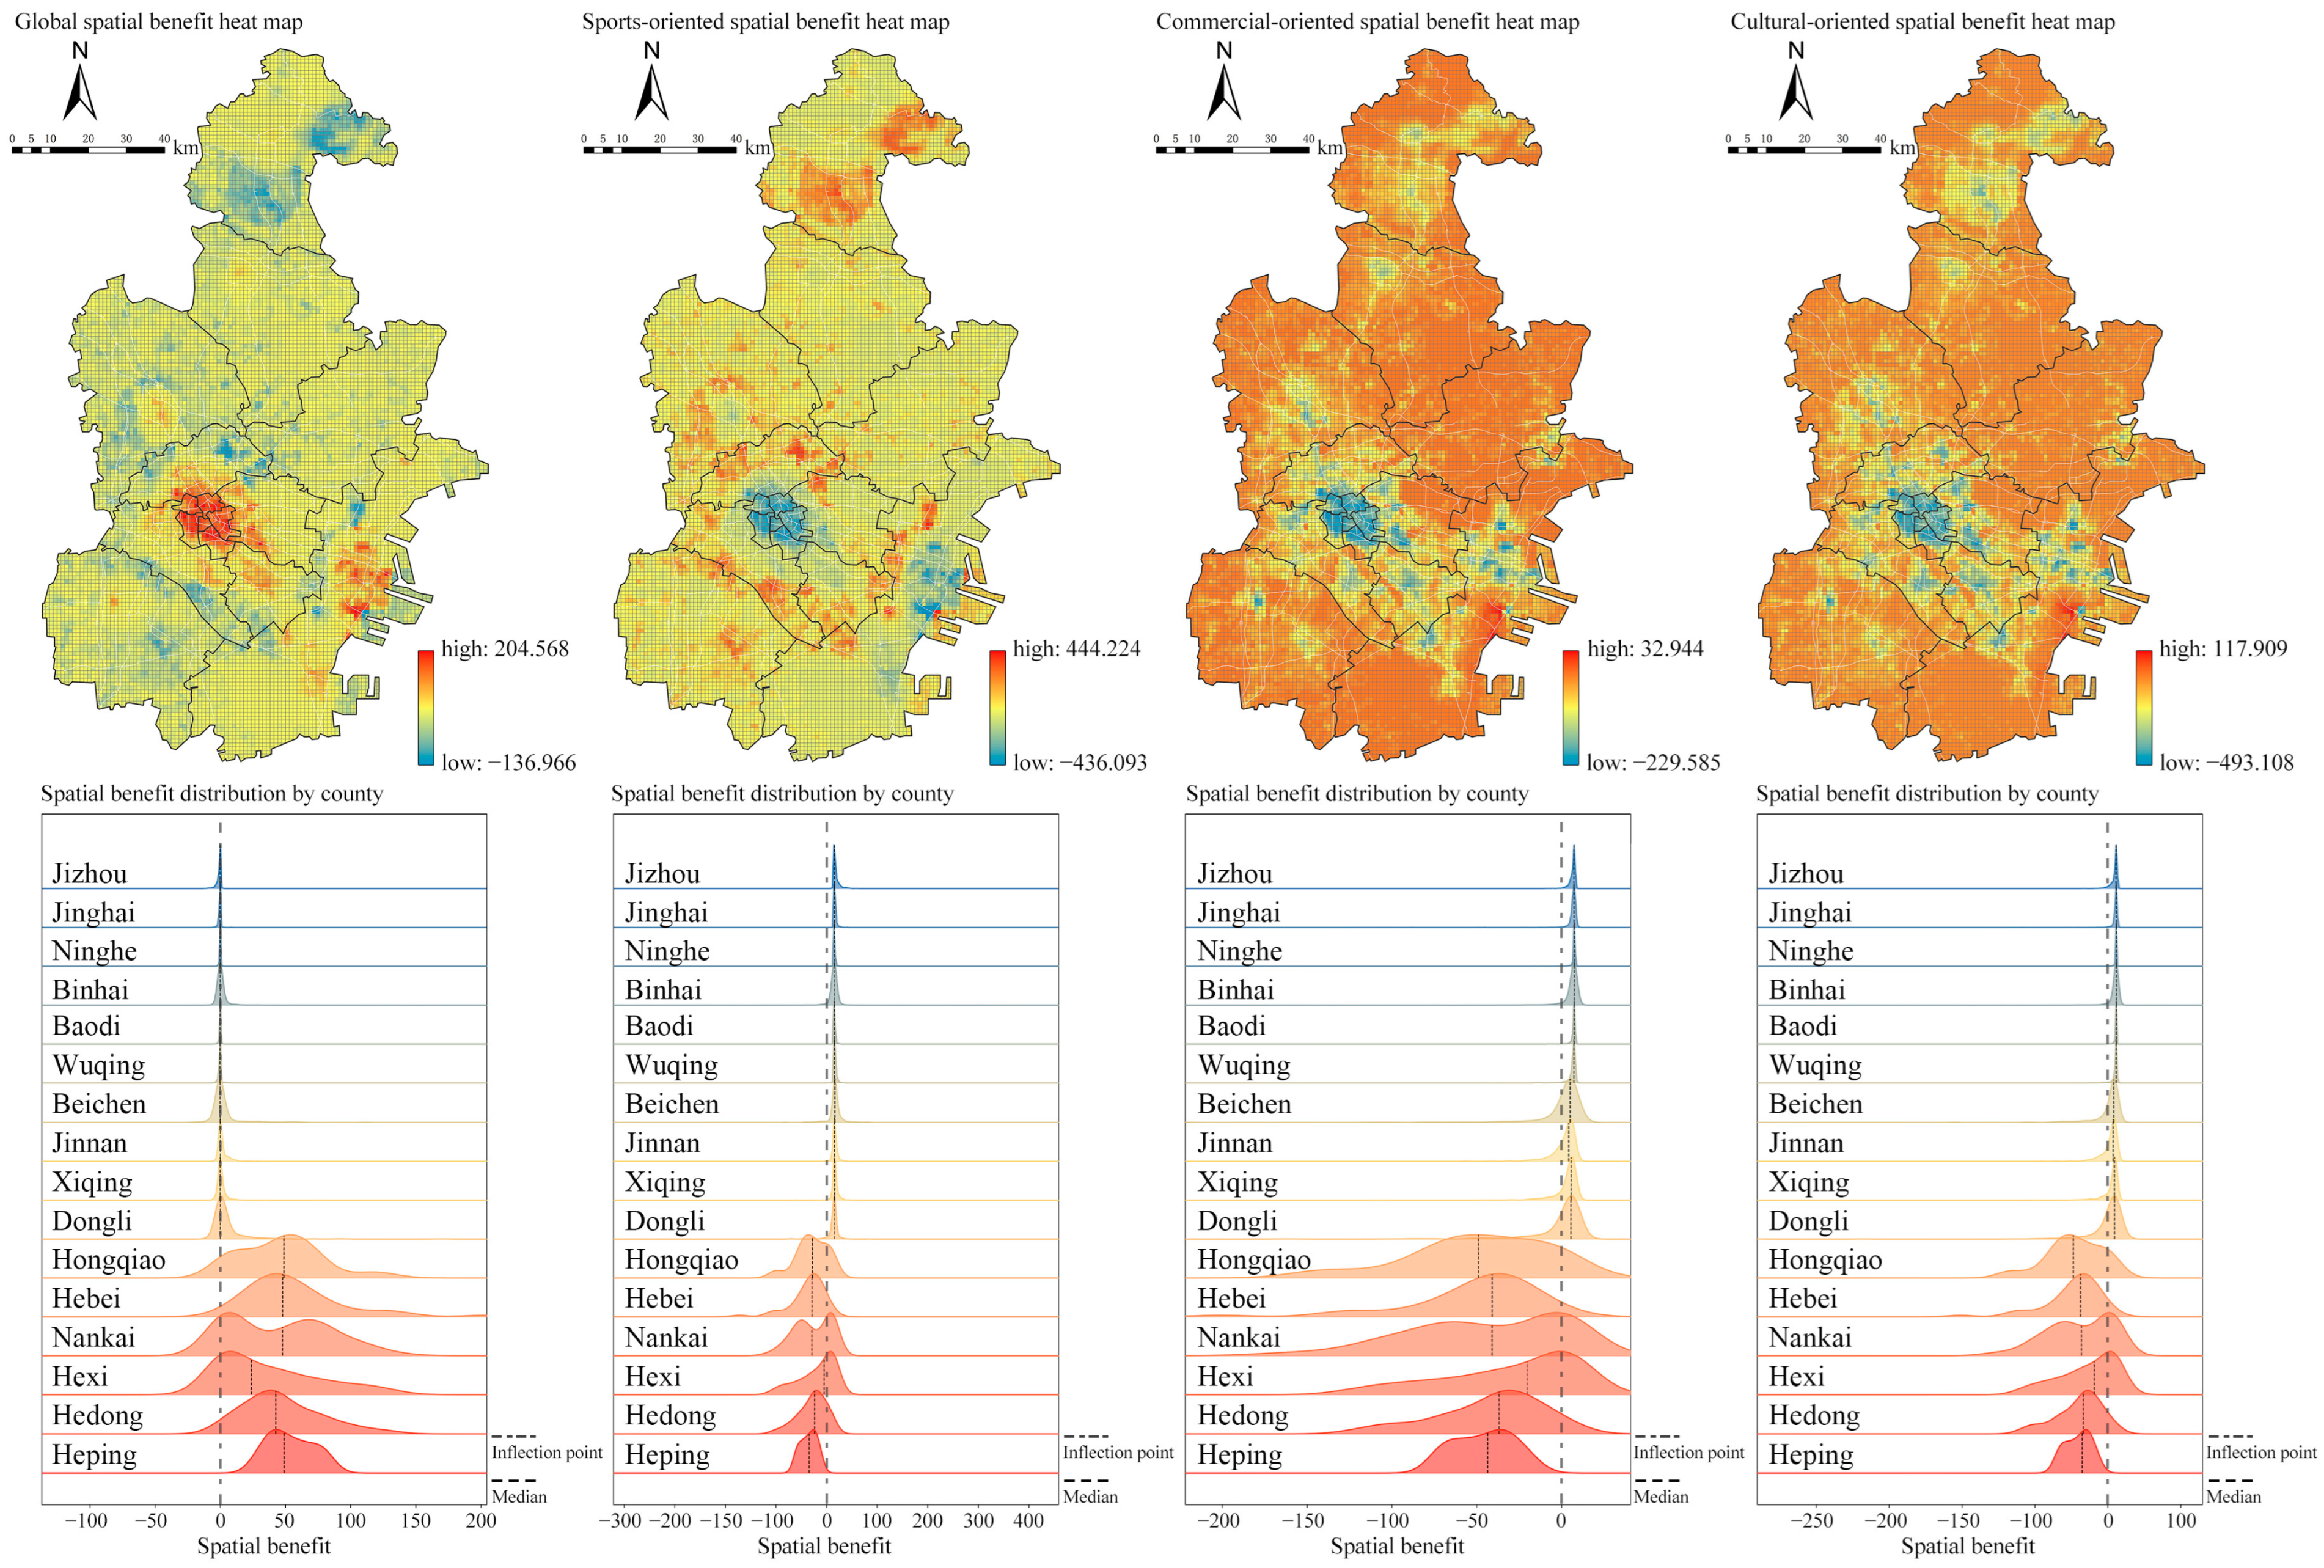
Based on the multidimensional spatial value distribution, we assessed Tianjin’s multidimensional benefits (Figure 11). In the central six districts, where functions were highly concentrated, spatial supply had generally reached or exceeded marginal saturation points; specific directional benefits tended to weaken or even generate negative spillovers. Nevertheless, investments targeting daily consumption in these central districts still produced positive spatial benefits. In peripheral districts, although marginal returns per unit investment were often higher, aggregated spatial-benefit levels remained relatively low because of constraints in population scale and market capacity, making substantial short-term returns difficult to achieve. Accordingly, for nearly saturated central districts, investment priorities should shift from quantitative expansion to enhancing perceived value in order to avoid further dilution of marginal returns. For peripheral districts and counties with high potential but lower current returns, a gradual, demand-driven strategy for supporting infrastructure and facilities was recommended.

5. Discussion

5.1. The Underlying Logic of Spatial Benefit Distribution

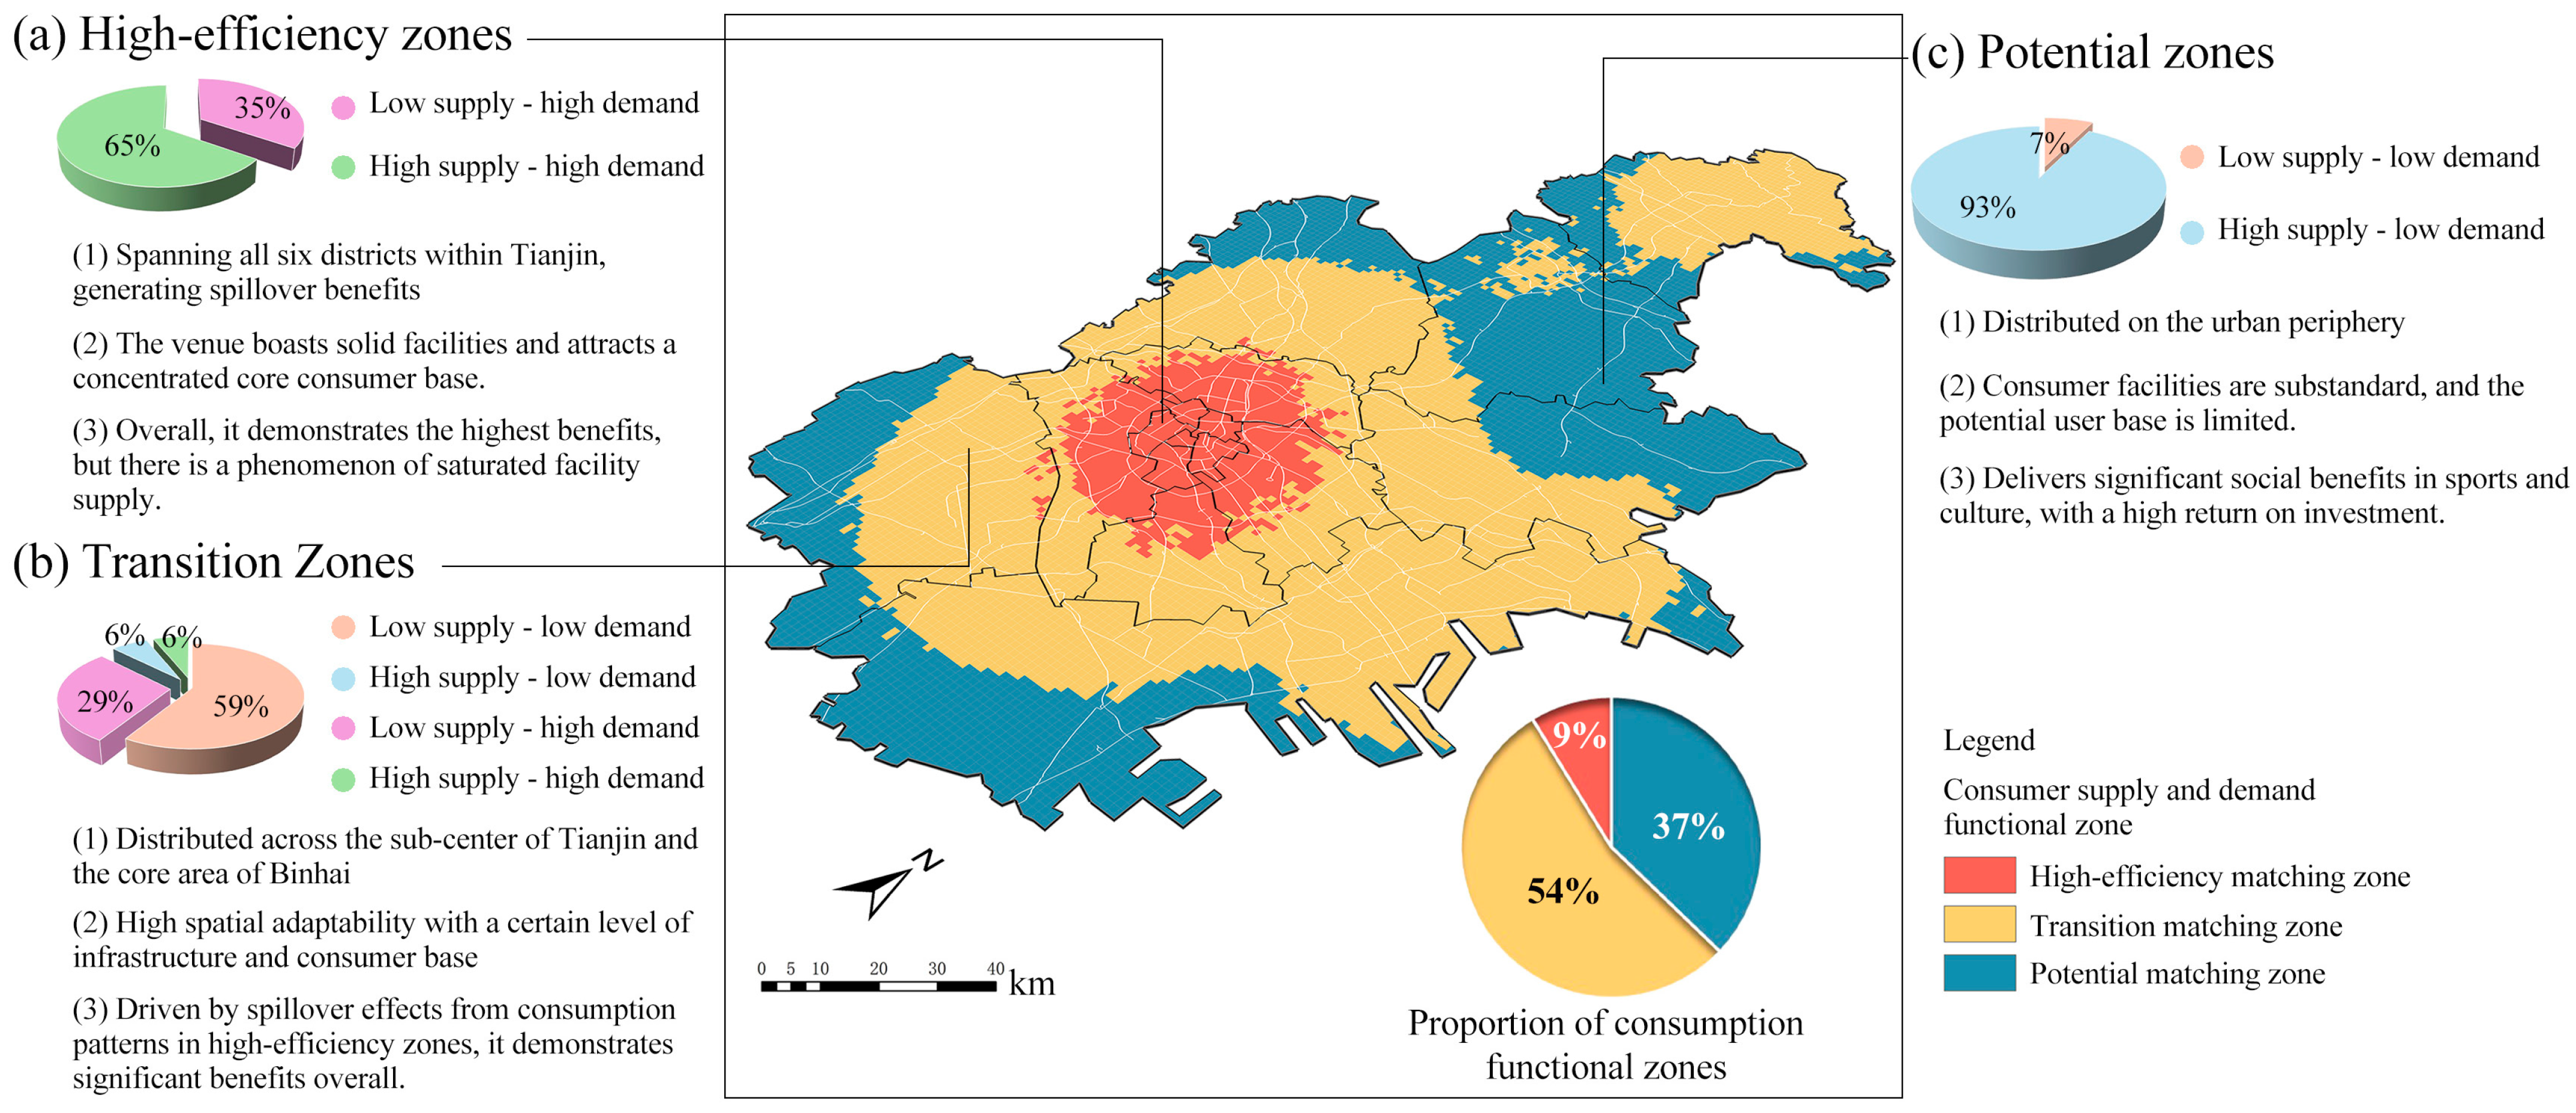
Tianjin’s urban development exhibited a pronounced concentration toward the central urban area, producing a dual-city pattern in which high-value spaces clustered within the Six Central Districts and the Binhai New Area. These areas were characterized by a robust consumption base, dense commercial and service provision, and concentrated economic output. Peripheral districts and counties, despite possessing rich ecological and cultural resources, struggled to convert these assets into stable revenue because of inadequate supporting infrastructure and consumption base. The coupling coordination degree-driven primarily by consumption supply and demand-was highest in the center and declined toward the periphery. Although the central districts achieved high spatial value across multiple consumption activities, they also experienced localized supply saturation and spillover effects. This pattern indicated oversupply in densely populated central areas and a disconnect between supply and demand in peripheral districts due to poor accessibility and insufficient supporting facilities, resulting in misaligned spatial-value distribution and uneven multidimensional benefits. To thoroughly analyze the spatial distribution characteristics and underlying logic of spatial benefits, this paper integrated coordination coupling with multidimensional spatial benefit overlay to classify Tianjin into high-efficiency zones, transition zones, and potential zones (Figure 12).
From the perspective of functional zones and the distribution of consumption environment factors, the three functional zones exhibited a continuous gradient differentiation in value-benefit conversion: (1) The high-efficiency zone presented a coexistence of high value and marginal saturation. Although this zone held the highest spatial value across all consumption categories, HPM results indicated that factors densely concentrated in the high-efficiency zone—such as public transportation and commercial diversity—exhibited negative implied values. This suggests that the oversupply of core environmental factors in this area has begun to suppress value conversion efficiency, leading to diminishing marginal returns in its multidimensional benefits. (2) In contrast, the transition zone exhibited the greatest potential for benefit enhancement. This area demonstrated high value and spatial efficiency in sports and cultural consumption, while its key environmental factors have not yet reached saturation thresholds. Therefore, targeted investments in this zone can yield higher marginal returns than in the core zone. (3) The gap between the high potential value conferred by ecological advantages and the low actual benefits resulting from inadequate supporting facilities constituted the defining contradiction distinguishing the potential zone from other functional areas. Interaction effect confirmed that when key consumption environment elements lacked supporting elements such as transportation and lighting, their effectiveness was suppressed, obstructing value realization pathways.
From the causal chain of consumption environment—consumer perception—consuming behavior, objective environmental factors acted as stimuli that, through individual cognitive and affective processing, generated subjective perceptions of comfort, satisfaction, and identification. These perceptions operated at specific thresholds and required interactions among multiple elements to produce observable benefits. Different consumer groups displayed varying sensitivities to the same environmental factors, which affected the translation of perception into consumption behavior and subsequently fed back into the supply structure and benefit assessment [66]. The Six Central Districts, long established as hubs for public and commercial services, had developed path dependencies and agglomeration effects for consumption investment. Consumers increasingly gravitated toward large commercial districts and recreational concentrations in search of greater choice, while governments favored cultivating distinctive neighborhoods and brand effects in these zones to mitigate investment risk [67,68]. This dynamic raised entry thresholds for peripheral counties to climb the consumption pyramid. Combined with limited population mobility and higher perceived risk premia in peripheral areas, these disadvantages made it difficult to sustain social investment, weakening local consumption opportunities and ultimately producing an imbalanced spatial-benefit distribution [69].

5.2. Recommendations for Enhancing Urban Spatial Benefit Based on Consumer Preferences

Addressing the structural characteristics of spatial efficiency distribution in Tianjin, this paper proposes a comprehensive optimization framework centered on three core concepts: enhancing the quality of high-efficiency zones, leveraging transitional zones to absorb spillover effects and connect peripheral areas, and activating potential zones through multi-point development. This framework aims to overcome the current isolated development of functional zones by integrating them into a decentralized, functionally complementary urban consumption network system that fosters collaborative development. First, it promotes a shift in high-efficiency zones from scale expansion to quality-driven leadership, strengthening their capabilities in high-end services and value innovation. Second, it treats transportation infrastructure as the backbone of urban development, utilizing TOD models to construct distinct “consumption corridors.” This expands the influence of resource-dense areas, facilitating the smooth flow and efficient allocation of consumption factors. Third, in potential zones, multiple pilot projects will establish dynamic nodes blending local characteristics with ecological services. These nodes will form a star cluster layout, creating a two-way empowerment dynamic with high-efficiency zones to achieve an overall enhancement of spatial benefits across the entire region.
The high-efficiency zones were concentrated within the six central districts and the adjacent four outer districts. While these areas boasted high overall spatial value and comprehensive supporting facilities, they exhibited supply saturation in terms of spatial efficiency for specific consumption behaviors. As the core engine of the urban consumption system, optimizing these zones hinges on enhancing supply quality and promoting value spillover. The key pathway lies in elevating residents’ subjective experience to radiate benefits outward to peripheral areas. Specifically, policymakers should implement experiential upgrades and branded operations for existing commercial and cultural facilities to reduce homogeneous competition and improve spatial efficiency [70]; introduce small-scale, high-quality sports facilities and flexible public spaces in neighborhoods with natural environment potential while preserving vegetation and sightlines to maintain green continuity and ecological integrity; and apply supply-control and functional-substitution strategies, favoring mixed-use commercial, cultural, recreational formats over merely adding similar facilities when existing configurations show diminishing returns. This approach can increase per-unit spatial value and investment returns without expanding total supply [71].
Transition zones, mainly located in the outskirts and northern parts of the four districts surrounding the center, showed malleable supply-demand relationships. In these areas, transport accessibility, commercial diversity, and nighttime vitality played critical roles in strengthening consumption willingness and spatial efficiency. As a key hub for capturing spillover value from high-efficiency zones and revitalizing peripheral areas, the transition zone needs to prioritize the creation of integrated cultural and sports venues. It should focus on developing low-to-medium cost facilities suitable for experiential consumption, thereby reducing the need for large-scale construction investments in everyday consumption environments. Measures include improving road-network connectivity and nightscape lighting, introducing commercial amenities in a measured way, and integrating historical and cultural facilities with low-density, high-quality designs that leverage regional cultural assets to enhance consumer perception and foster local consumption clusters. Policymakers should also leverage spillover effects from central districts, such as night markets, cultural and sports events, and creative activities, to activate consumption potential in transitional zones and use government subsidies and fiscal incentives to attract multi-sector investment that gradually builds regional service capacity and marginal returns.
Potential zones at the urban periphery were characterized by relatively weak infrastructure but high vegetation coverage and ecological carrying capacity, making them particularly attractive to sports consumers, yet rely on effective connectivity with the city’s overall consumption network. Given their limited consumer base and the difficulty of achieving rapid high returns, a staged investment strategy, “pilot low cost interventions-performance evaluation-scaled investment”, was recommended. This approach combines short-term investment incentives with medium-to-long-term spatial development. In master plans, these areas can be designated as suburban sports-activity zones that leverage existing ecological resources to establish backbone cycling loops and hiking corridors, with key nodes (large fitness parks, training grounds, and multi-purpose activity centers) located along these routes. Micro-circulation public transit should connect nodes to nearby residential, commercial, cultural, and tourism resources to expand service radii. Linking these peripheral networks to major transport loops in transitional zones and the urban core would progressively broaden the consumer base and market influence, fostering bidirectional flows of visitors.

5.3. Implications

Against the backdrop of overcapacity and market restructuring, the widespread decline in commodity prices and consumer willingness has prompted local governments and markets to shift their focus toward creating value by enhancing consumption quality and investment efficiency. Our empirical findings provide policymakers with clear guidelines. First, to achieve high-quality, sustainable development, the key threshold values and functional dependencies identified in this study—such as the greening ratio threshold for stimulating sports consumption or the critical interactive role of transportation and lighting—should be translated into mandatory standards or guiding indicators for spatial planning to prevent ineffective investments. Second, policymakers should establish a spatial performance evaluation system centered on the social return on investment (SROI). This system incorporates the contribution of public projects to activating consumption preferences and enhancing multidimensional spatial benefits, thereby directing capital flows toward areas that generate maximum comprehensive benefits. Finally, it is crucial to implement land and fiscal policies that are precisely tailored to the three categories of consumption functional zones. This involves strictly controlling new development in high-efficiency zones while encouraging business model upgrades and adopting flexible land use and phased subsidies for transitional and potential zones. Through these zoned interventions, a gradual transition in resource allocation can be achieved.

5.4. Limitations and Prospects

This study examined Tianjin residents’ consumption preferences and the value of spatial elements at the urban scale. By utilizing big data and combinatorial modeling, it revealed the distribution patterns of multidimensional spatial benefits. However, the following limitations should be noted: (1) The cross-sectional design limits the ability to rule out endogeneity and reverse causality, thereby constraining causal inference regarding the generation of spatial benefits. Future research could incorporate longitudinal or panel data to examine how temporal changes in the consumption environment affect preferences and benefits. (2) By focusing on the macro-level causal chain, the analysis may have overlooked micro-level place characteristics, such as street-front complexity and perceived safety. Future studies should integrate street-view imagery and perception surveys to analyze how street-level environmental quality influences consumption behavior. (3) The perception and behavior measures, drawn from open-platform data, may diverge from actual patterns and fail to capture specific group needs, introducing potential bias. Integrating targeted surveys and interviews would help to supplement behavioral details and improve representativeness. Overall, this study could not comprehensively depict consumption behavior due to constraints, and future work should aim to construct an analytical framework that links macro-micro levels and combines long-term trends with real-time dynamics.

6. Conclusions

This paper placed Tianjin’s findings within the comparative framework of global urban studies and confirmed that the commercial saturation and diminishing marginal returns in its central district align closely with Stadler’s [72] “Disk City” theory study. It revealed the universal pattern where excessive concentration of consumption resources triggers “agglomeration diseconomies,” while further explored the underlying mechanisms driving this phenomenon. This structural dilemma is corroborated in Shanghai, another river-based city, where the proposed “octopus-like” axial development strategy—relieving central functions through transportation corridors—offers valuable insights for Tianjin. Regarding countermeasures, Polish research indicates that commercial nodes in peripheral areas linked to transportation can drive service network restructuring, supporting development pathways in potential zones [73]. Meanwhile, a U.S. study emphasizes that spatial structural characteristics determine commercial “contact capacity” and consumption radius [74], confirming the close connection between consumer behavior and the environment. These international experiences collectively demonstrate that optimizing spatial resource allocation through differentiated investment, centered on consumption preferences, is an effective pathway to achieving sustainable urban development.
Based on the integrated model framework, this study yields three core conclusions: (1) Consumer preferences exhibit significant environmental thresholds and mediating pathways. Sports and cultural consumption rely more heavily on perceived environmental quality, with a clear minimum threshold for their promotional effects. The influence of consumption environments on behavior operates primarily through perceived dimensions such as satisfaction and identification, rather than through direct effects. (2) Spatial value and benefits exhibit a pronounced complementary distribution. High-value zones often yield lower marginal returns on investment, indicating diminishing returns, whereas low-value zones show high potential returns but face constraints due to inadequate facilities. (3) A precise zoning and classification strategy is essential. Dividing the city into high-efficiency, transition, and potential zones, and applying differentiated investment strategies—focusing on quality enhancement, scenario creation, and phased pilot programs, respectively—enhances overall spatial benefits.
The core innovation of this study lies in its integrated research perspective and methodological breakthrough. Single models struggle to simultaneously identify the causal pathways, spatial distribution, and nonlinear thresholds of multidimensional spatial benefits. The composite model system centered on SEM-HPM is designed to systematically address this complex challenge. This framework not only underpinned the empirical analysis for Tianjin but also provides a replicable technical toolkit for other cities rich in cultural, commercial, and tourism resources, thereby ensuring both the universality and precision of the research conclusions.

Author Contributions

Conceptualization, X.Z., L.C. and Y.Y.; methodology, L.C. and Y.Y.; software, Y.Y.; validation, X.Z. and L.C.; formal analysis, Y.Y. and L.C.; investigation, X.Z., L.C. and Y.Y.; resources, L.C.; data curation, Y.Y.; writing—original draft preparation, X.Z. and L.C.; writing—review and editing, X.Z. and Y.Y.; visualization, Y.Y.; supervision, X.Z. and L.C.; project administration, X.Z.; funding acquisition, X.Z. All authors have read and agreed to the published version of the manuscript.

Funding

This research was funded by the Provincial Demonstration Course Project for Graduate Students Establishment grant number (KCJSX2025021).

Institutional Review Board Statement

Not applicable.

Informed Consent Statement

Not applicable.

Data Availability Statement

The data used in this paper mainly came from the Ministry of Housing and Urban-Rural Development of the People’s Republic of China (https://www.mohurd.gov.cn/index.html, accessed on 22 July 2025), the EARTHDATA (https://www.earthdata.nasa.gov/, accessed on 3 May 2025), the Ctrip (https://www.ctrip.com/, accessed on 13 May 2023).

Acknowledgments

Thank you to Yi Yu and Lei Cao for their assistance in data collection and literature review. All the authors are grateful to the reviewers and editors.

Conflicts of Interest

The authors declare no conflicts of interest.

Abbreviations

The following abbreviations are used in this manuscript:
SORStimulus–Organism–Response
XGBoosteXtreme Gradient Boosting
SROISocial Return on Investment
CPICity Prosperity Index
SEMStructural Equation Modeling
HPMHedonic Pricing Model
CCDCoordination Coupling Degree
TODTransit-Oriented Development

Appendix A

Appendix A.1. Research Approach
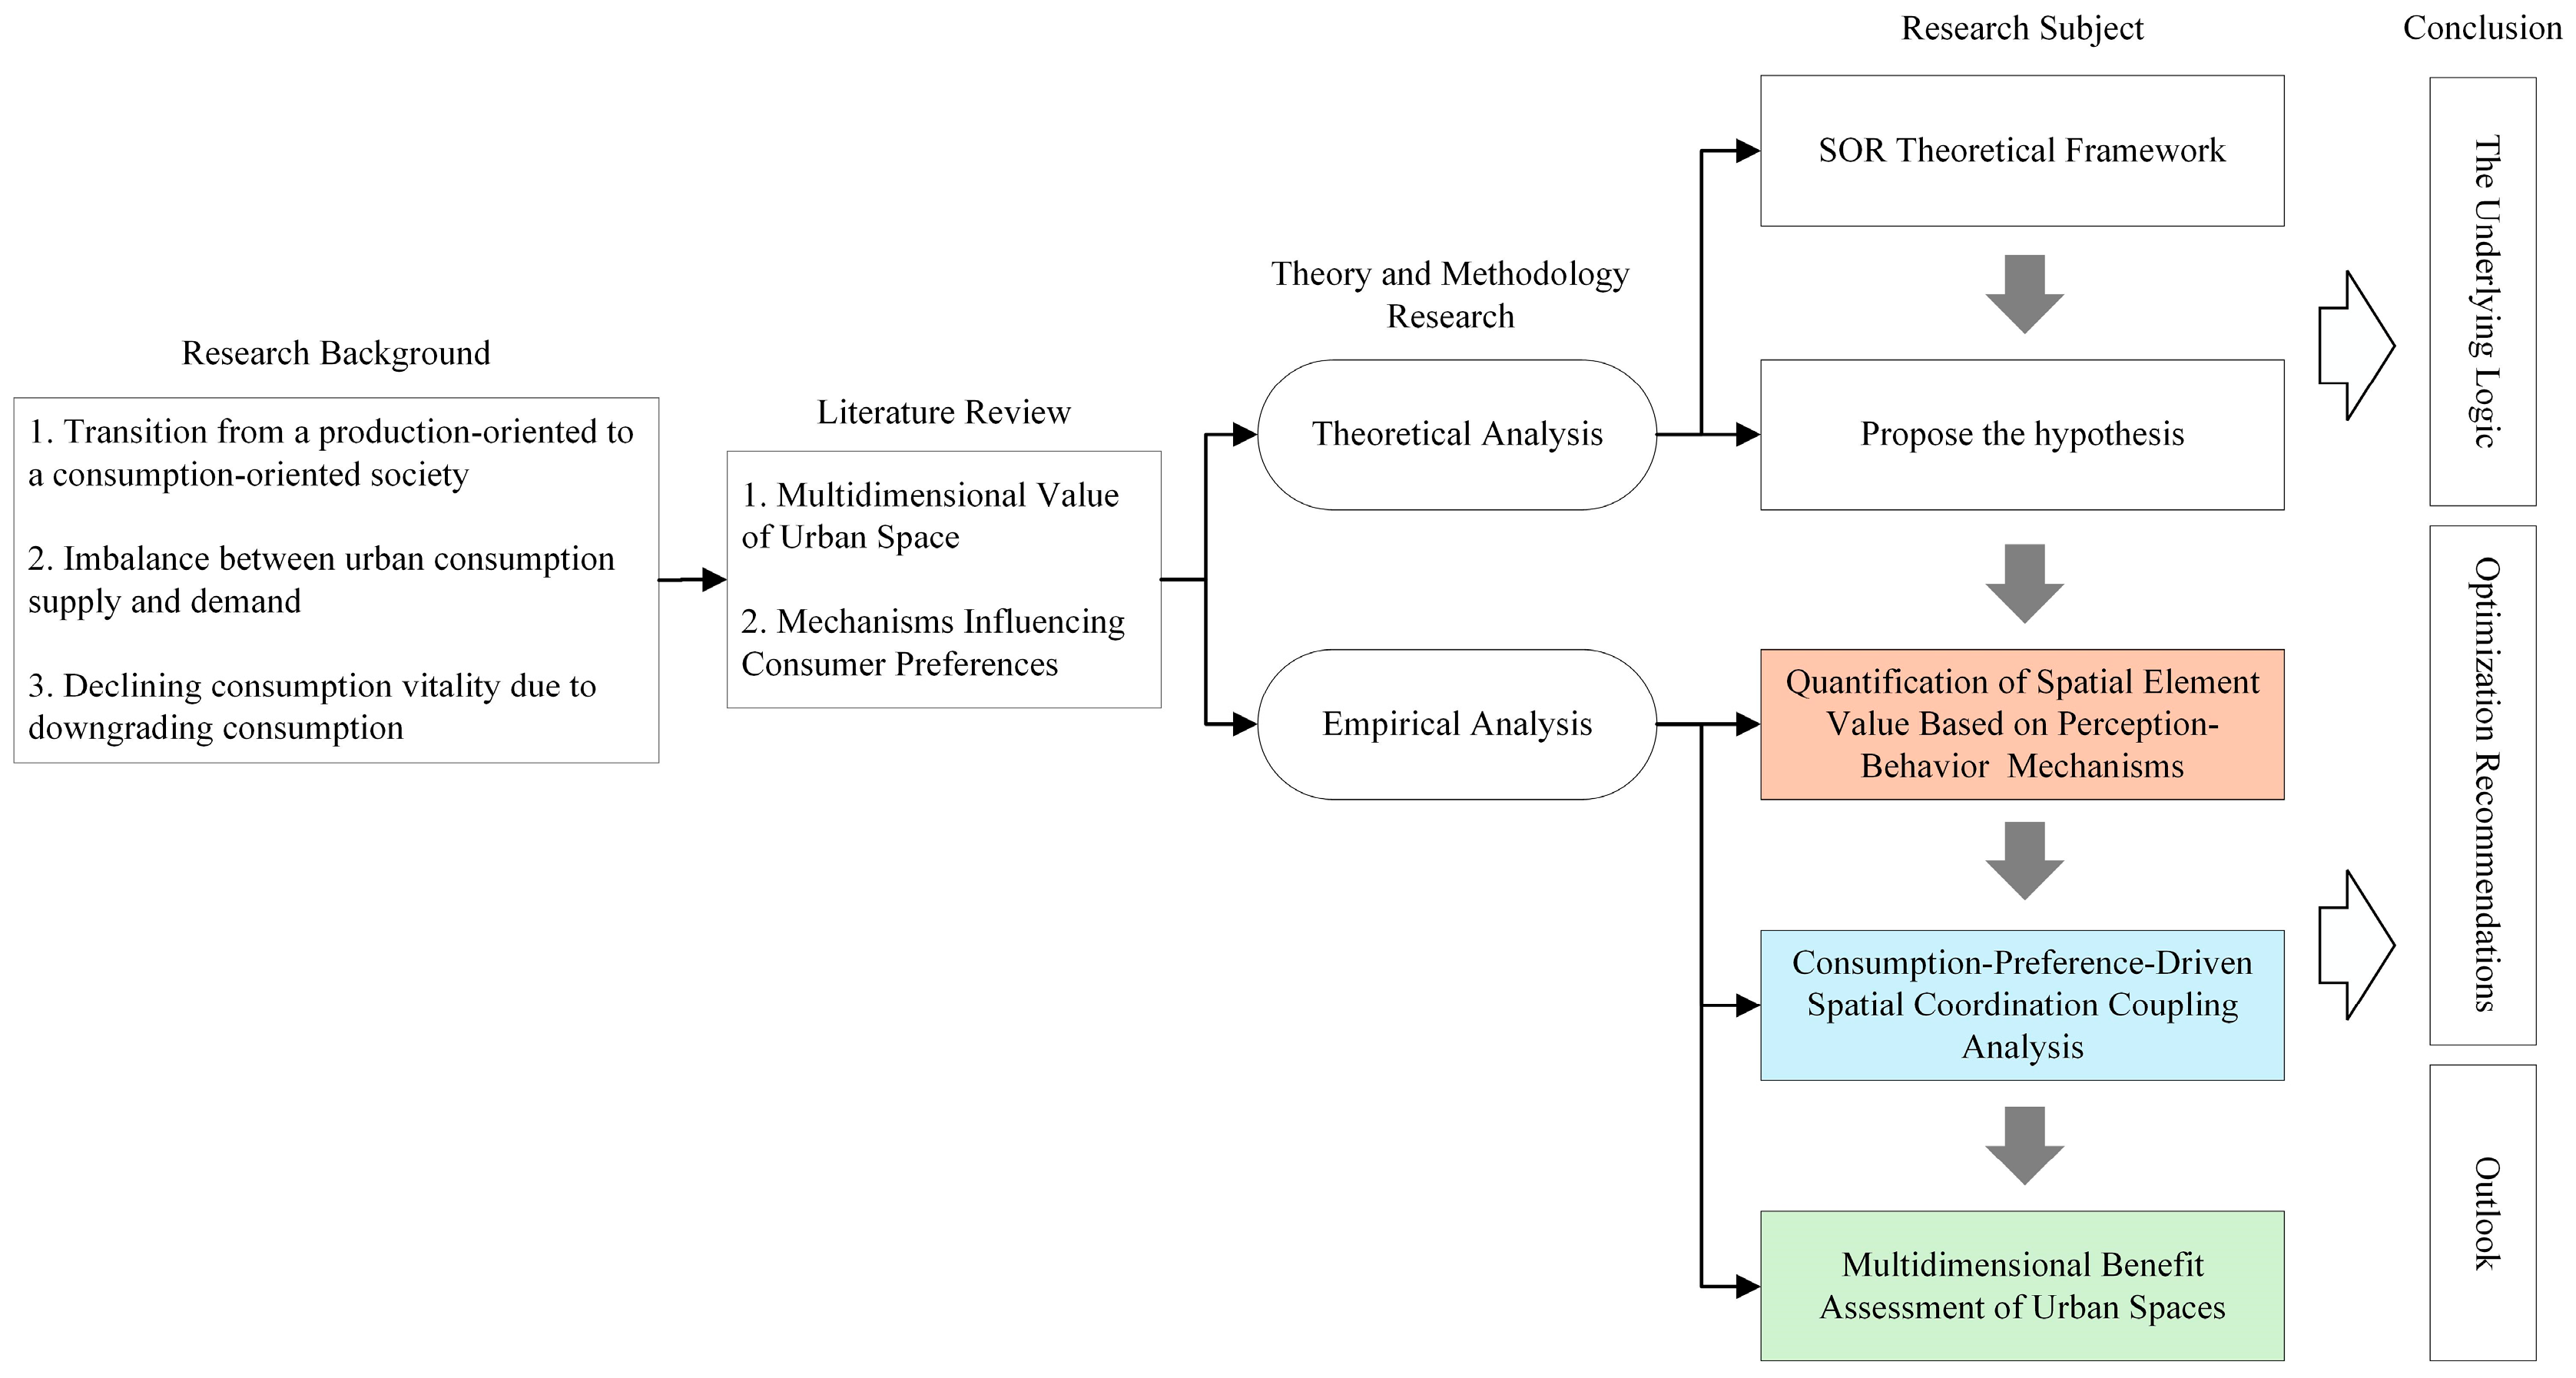
This image clearly illustrates the approach of this study.
Figure A1. Research Approach.
Land 14 02322 g0a1

Appendix A.2. Spatial Distribution of Implicit Value in Consumption Environment Variables
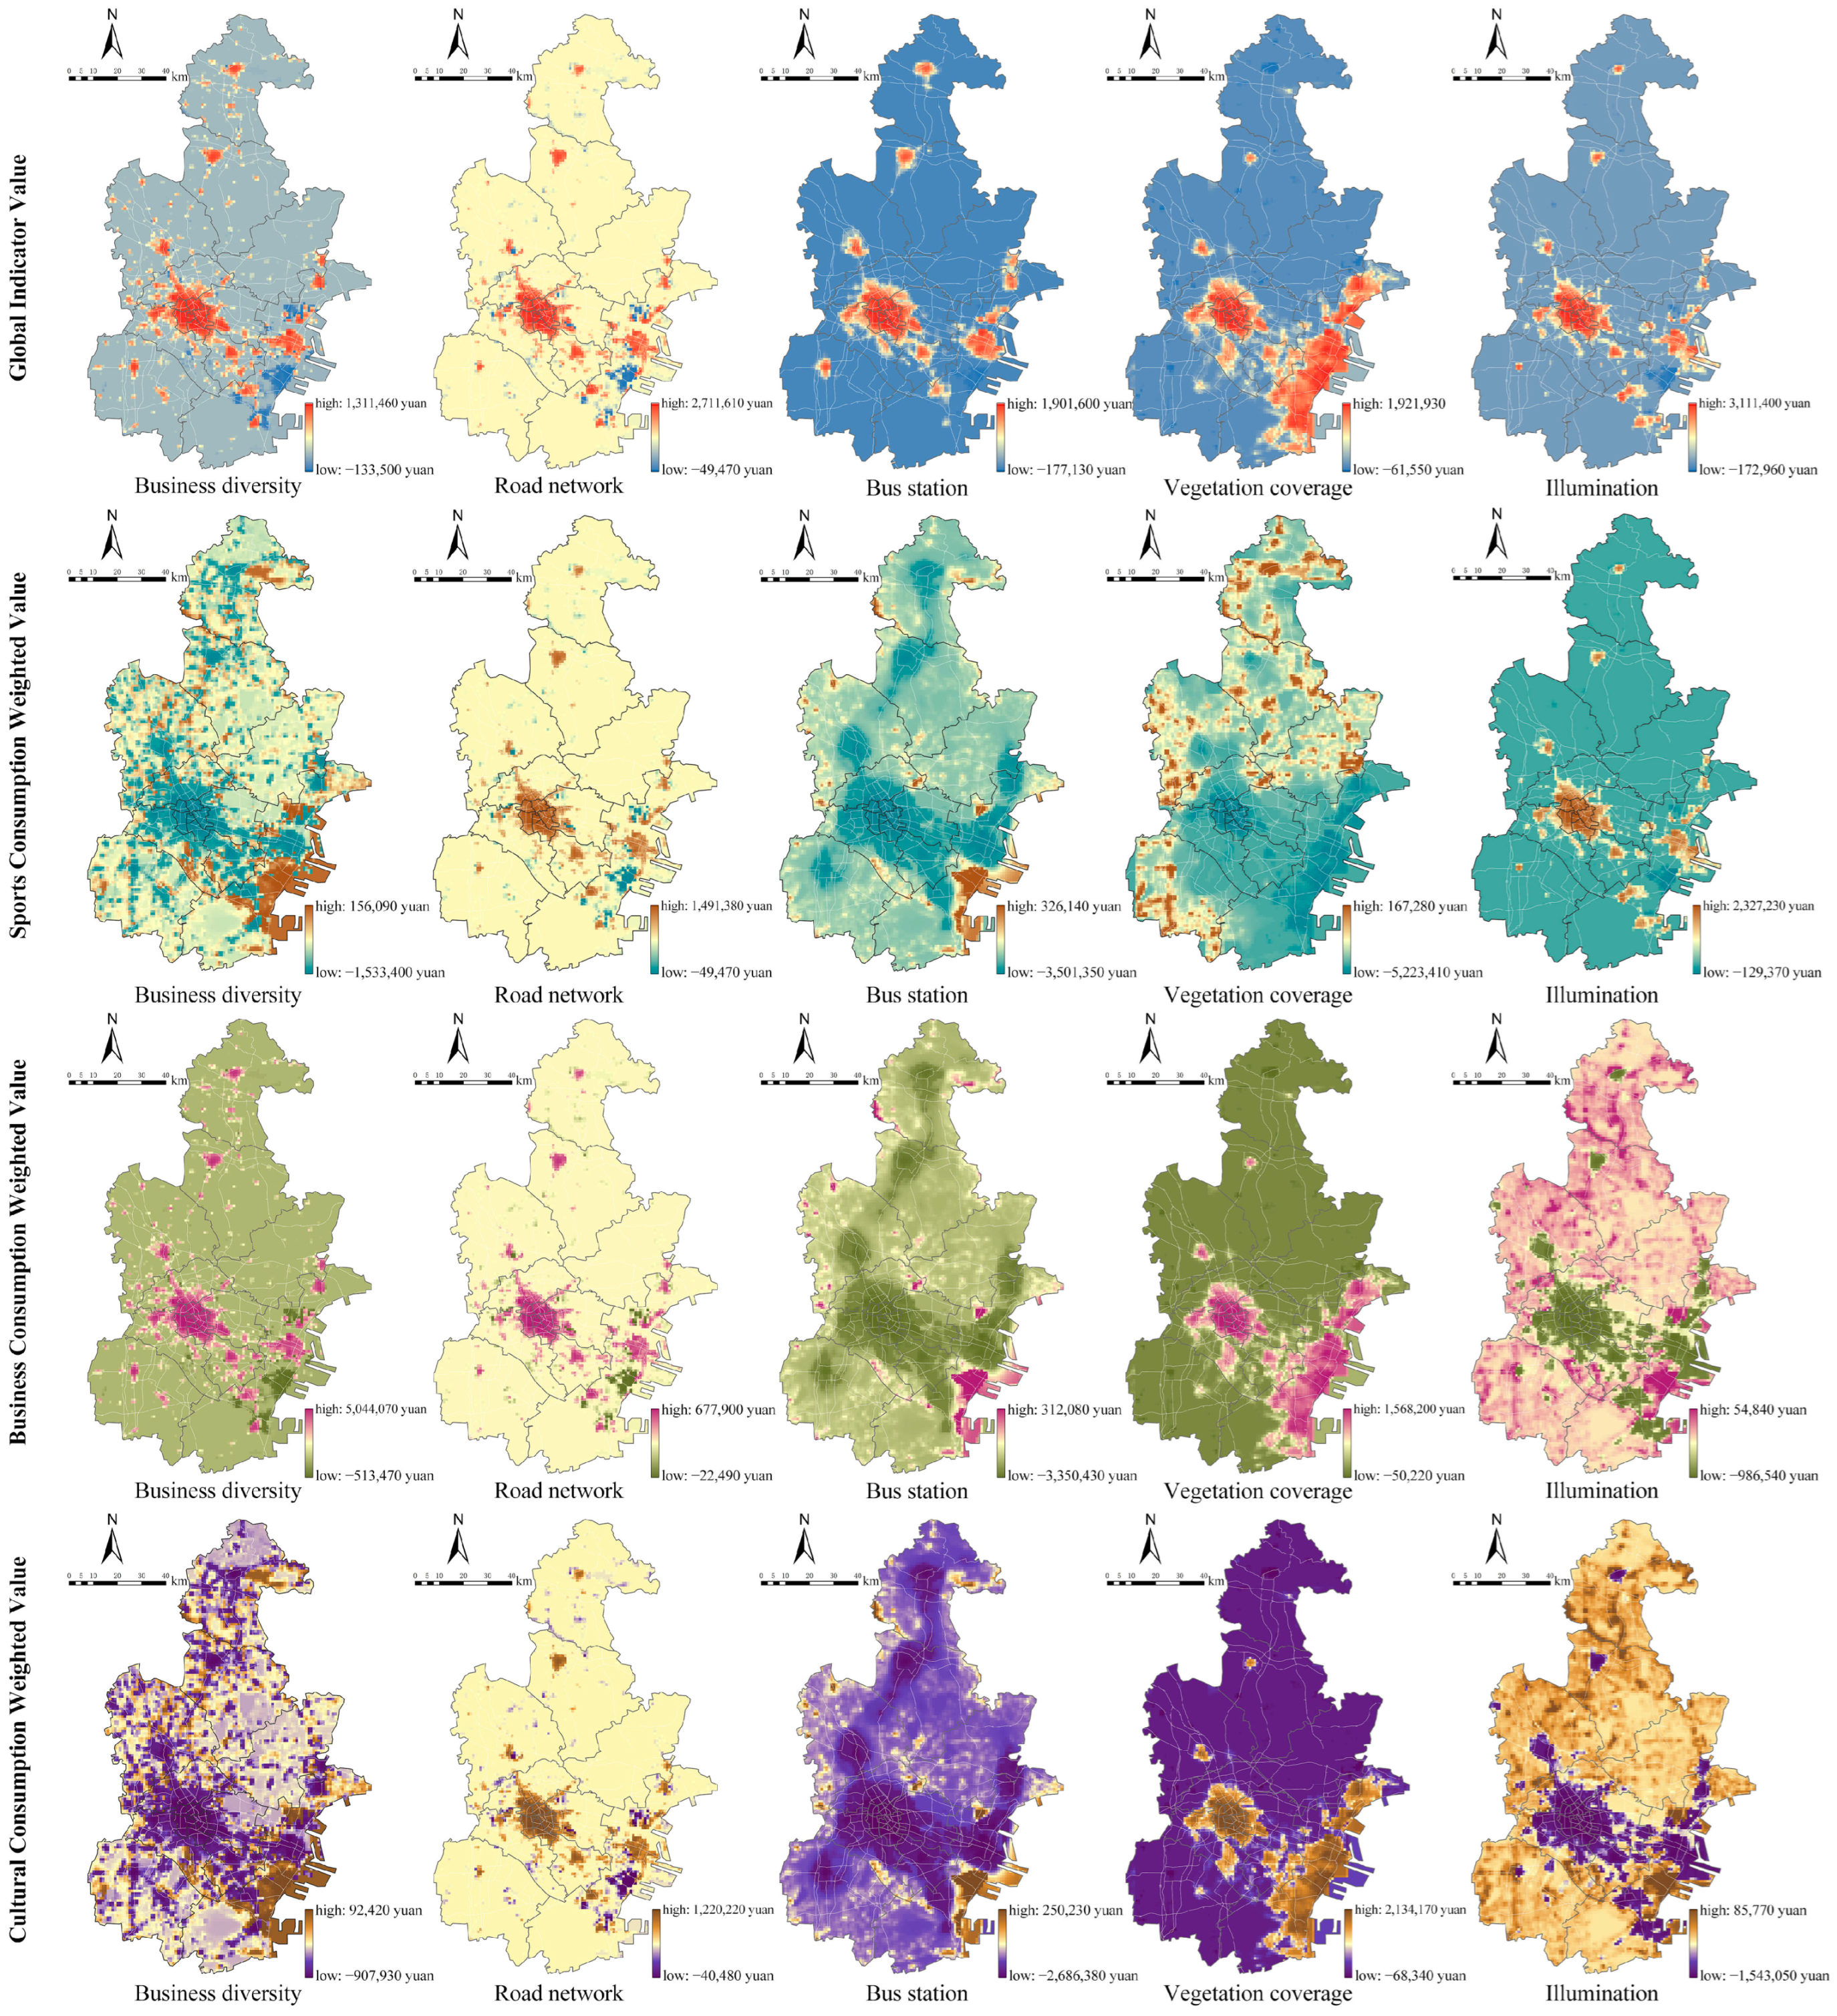
This appendix describes the spatial distribution of implicit values for consumption environment variables derived from the combined SEM and HPM model. The paper maps the five highly significant indicators from the HPM onto a map, comparing the distribution of implicit values for the same indicators across different consumption behavior preferences.
Figure A2. Distribution of Implied Values for Consumer Environment Variables.
Land 14 02322 g0a2

Appendix A.3. The Investment Balance Point of Cost, Consumption Environment, and Supply-Demand Dynamics in Consumer Behavior

This appendix demonstrates the equilibrium point between supply and demand for consumption environments and behaviors, measured by cost indices. It reveals the optimal investment points for environmental factors across three categories of consumption behaviors.
Figure A3. Investment Balance Point of Supply and Demand in the Consumption Environment and Consuming Behavior: (a) Sports consumption; (b) Business consumption; (c) Cultural consumption.
Land 14 02322 g0a3

References

  1. Chen, W.; Cheshmehzangi, A.; Mangi, E.; Heath, T. Implementations of China’s New-Type Urbanisation: A Comparative Analysis between Targets and Practices of Key Elements’ Policies. Sustainability 2022, 14, 6341. [Google Scholar] [CrossRef]
  2. Zhang, M.; Tan, S.; Zhang, Y.; He, J.; Ni, Q. Does land transfer promote the development of new-type urbanization? New evidence from urban agglomerations in the middle reaches of the Yangtze River. Ecol. Indic. 2022, 136, 108705. [Google Scholar] [CrossRef]
  3. Tong, N.; Frazier, A.E.; Tong, L.; Hu, S. Synergistic pathways between urbanization and low-carbon development: Evidence from the Yangtze River Economic Belt. J. Environ. Manag. 2025, 392, 126740. [Google Scholar] [CrossRef] [PubMed]
  4. Lloyd, R.; Clark, T.N. The City as Entertainment Machine; Elsever JAI Press: New York, NY, USA, 2003; pp. 224–302. [Google Scholar]
  5. Hao, S.; Zhonggen, M. The Evolution Mechanismand Measurement Analysis of Consumption-oriented Cities. J. Stat. Inf. 2025, 40, 17–31. [Google Scholar] [CrossRef]
  6. Zhou, L. The Analysis of The Consumption Transformation and Degradation in China. J. Educ. Humanit. Soc. Sci. 2024, 38, 8–12. [Google Scholar] [CrossRef]
  7. Paudel, S.; States, S.L. Urban green spaces and sustainability: Exploring the ecosystem services and disservices of grassy lawns versus floral meadows. Urban For. Urban Green. 2023, 84, 127932. [Google Scholar] [CrossRef]
  8. Ruijgrok, E.C.M. The three economic values of cultural heritage: A case study in the Netherlands. J. Cult. Herit. 2006, 7, 206–213. [Google Scholar] [CrossRef]
  9. Rosen, S. Hedonic prices and implicit markets: Product differentiation in pure competition. J. Political Econ. 1974, 82, 34–55. [Google Scholar] [CrossRef]
  10. Herath, S. Elevating the Value of Urban Location: A Consumer Preference-Based Approach to Valuing Local Amenity Provision. Land 2021, 10, 1226. [Google Scholar] [CrossRef]
  11. Huang, W.; Lin, G. Concept, Benefits and Influencing Factors of Social Health Based on Urban Green Space. Chin. Landsc. Archit. 2023, 39, 77–82. [Google Scholar] [CrossRef]
  12. Wu, R.; Gao, L.; Li, J.; Xie, A.; Zhang, X. Exploring Key Factors Influencing the Processual Experience of Visitors in Metaverse Museum Exhibitions: An Approach Based on the Experience Economy and the SOR Model. Electronics 2025, 14, 3045. [Google Scholar] [CrossRef]
  13. Mouratidis, K. Urban planning and quality of life: A review of pathways linking the built environment to subjective well-being. Cities 2021, 115, 103229. [Google Scholar] [CrossRef]
  14. Gao, Y.; Du, D.; Furuya, N. Assessment framework of walking satisfaction on sidewalks in commercial districts: Combining built environment and personal attributes (applied in Japan). Front. Archit. Res. 2025, 14, 1380–1397. [Google Scholar] [CrossRef]
  15. Jennings, V.; Rigolon, A.; Thompson, J.; Murray, A.; Henderson, A.; Gragg, R.S. The Dynamic Relationship between Social Cohesion and Urban Green Space in Diverse Communities: Opportunities and Challenges to Public Health. Int. J. Environ. Res. Public Health 2024, 21, 800. [Google Scholar] [CrossRef] [PubMed]
  16. Wong, C. A framework for ‘City Prosperity Index’: Linking indicators, analysis and policy. Habitat Int. 2015, 45, 3–9. [Google Scholar] [CrossRef]
  17. Mitchell, A.; Larson, K.L.; Pfeiffer, D.; Rosales Chavez, J.-B. Planning for Urban Sustainability through Residents’ Wellbeing: The Effects of Nature Interactions, Social Capital, and Socio-Demographic Factors. Sustainability 2024, 16, 4160. [Google Scholar] [CrossRef]
  18. Zhu, J.; Lu, C.; Song, A. Air Pollution Governance and Residents’ Happiness: Evidence of Blue Sky Defense in China. Sustainability 2023, 15, 15288. [Google Scholar] [CrossRef]
  19. Naheed, S.; Shooshtarian, S. The Role of Cultural Heritage in Promoting Urban Sustainability: A Brief Review. Land 2022, 11, 1508. [Google Scholar] [CrossRef]
  20. Su, Y.; Xu, H.; Zhang, X. How Can Public Spaces Contribute to Increased Incomes for Urban Residents—A Social Capital Perspective. Land 2024, 13, 945. [Google Scholar] [CrossRef]
  21. Kolimenakis, A.; Solomou, A.D.; Proutsos, N.; Avramidou, E.V.; Korakaki, E.; Karetsos, G.; Maroulis, G.; Papagiannis, E.; Tsagkari, K. The Socioeconomic Welfare of Urban Green Areas and Parks; A Literature Review of Available Evidence. Sustainability 2021, 13, 7863. [Google Scholar] [CrossRef]
  22. Gao, S.; Li, C.; Rong, Y.; Yan, Q.; Liu, W.; Ma, Z. The Places—People Exercise: Understanding Spatial Patterns and the Formation Mechanism for Urban Commercial Fitness Space in Changchun City, China. Sustainability 2022, 14, 1358. [Google Scholar] [CrossRef]
  23. Liu, R.; Xiao, J. Factors Affecting Users’ Satisfaction with Urban Parks through Online Comments Data: Evidence from Shenzhen, China. Int. J. Environ. Res. Public Health 2021, 18, 253. [Google Scholar] [CrossRef]
  24. Song, H.; Chen, J.; Li, P. Decoding the cultural heritage tourism landscape and visitor crowding behavior from the multidimensional embodied perspective: Insights from Chinese classical gardens. Tour. Manag. 2025, 110, 105180. [Google Scholar] [CrossRef]
  25. Zhou, Q.; Wang, Y. Research on the Variable Factors Influencing the Vitality of Commercial Districts Based on the SOR Theory Model. Buildings 2025, 15, 1868. [Google Scholar] [CrossRef]
  26. Li, Y.; Yao, M.; Shen, L. The Influencing Factors and Paths of the Social Benefits of Rural Micro-landscapes: Mediated by Perceived Quality and Activity Level. Chin. Landsc. Archit. 2024, 40, 87–92. [Google Scholar] [CrossRef]
  27. Tong, L.L.; Wei, X.Y.; Song, X.H.; Mao, X.F.; Jin, X.; Jin, Y.X.; Ji, H.; Ji, H.S.; Tang, W.J. A Hedonic-Price and Structural-Equation Model based value assessment and factors of ecosystem services of urban wetlands in the Xining City. Acta Ecol. Sin. 2022, 42, 4630–4639. [Google Scholar] [CrossRef]
  28. Łaszkiewicz, E.; Heyman, A.; Chen, X.; Cimburova, Z.; Nowell, M.; Barton, D.N. Valuing access to urban greenspace using non-linear distance decay in hedonic property pricing. Ecosyst. Serv. 2022, 53, 101394. [Google Scholar] [CrossRef]
  29. Lee, J.-W.; Lee, S.-W.; Kim, H.G.; Jo, H.-K.; Park, S.-R. Green Space and Apartment Prices: Exploring the Effects of the Green Space Ratio and Visual Greenery. Land 2023, 12, 2069. [Google Scholar] [CrossRef]
  30. Jiang, X.; Ji, L.; Chen, Y.; Zhou, C.; Ge, C.; Zhang, X. How to Improve the Well-Being of Youths: An Exploratory Study of the Relationships Among Coping Style, Emotion Regulation, and Subjective Well-Being Using the Random Forest Classification and Structural Equation Modeling. Front. Psychol. 2021, 12, 637712. [Google Scholar] [CrossRef]
  31. Spasojevic, M.; Grace, J.; Harrison, S.; Damschen, E. Functional diversity supports the physiological tolerance hypothesis for plant species richness along climatic gradients. J. Ecol. 2013, 102, 447–455. [Google Scholar] [CrossRef]
  32. Han, X.; Li, Z.; Chen, H.; Yu, M.; Shi, Y. Structural Equation Model in Landscape Performance Research: Dimensions, Methodologies, and Recommendations. Land 2025, 14, 646. [Google Scholar] [CrossRef]
  33. Ruiz de Gopegui, M.; Olazabal, M.; Castán Broto, V.; McPhearson, T. Climate justice in urban public space adaptation: Developing and testing a collective assessment tool in Hunters Point, New York City. Urban Clim. 2025, 62, 102505. [Google Scholar] [CrossRef]
  34. Xu, F.; Yan, Q.; Ding, Z. A study on perception of urban green space carbon sequestration based on biotope classification: A case study of the Urban Forest in Shanghai. Trees For. People 2025, 22, 101047. [Google Scholar] [CrossRef]
  35. Xu, Q.; Ma, X.; Ding, Z.; Wang, H. Unlocking urban green spaces: Retrofitting potential green roofs to enhance bird connectivity and comprehensive ecological benefits in high-density areas. Urban For. Urban Green. 2025, 107, 128817. [Google Scholar] [CrossRef]
  36. Alita, L.; Zhang, J. Does user-generated content increase the valuation of urban green space? Evidence from China. Urban For. Urban Green. 2025, 113, 129086. [Google Scholar] [CrossRef]
  37. Wang, Y.; Shen, J.; Xiang, W. The Framework of Landscape Space Performance Evaluation with the Orientation of Eco-system Service. Landsc. Archit. 2017, 24, 35–44. [Google Scholar] [CrossRef]
  38. Chen, Y.; Liu, G.; Zhuang, T. Evaluating the Comprehensive Benefit of Urban Renewal Projects on the Area Scale: An Integrated Method. Int. J. Environ. Res. Public Health 2022, 20, 606. [Google Scholar] [CrossRef] [PubMed]
  39. Xue, J.; Shuhan, M.; Nan, L. Review on Social Benefits of Urban Green Space. Archit. Cult. 2024, 2024, 254–256. [Google Scholar] [CrossRef]
  40. Peng, X.; Niu, Y.-y.; Meng, B.; Tao, Y.; Huang, Z. Big geo-data unveils influencing factors on customer flow dynamics within urban commercial districts. Int. J. Appl. Earth Obs. Geoinf. 2024, 134, 104231. [Google Scholar] [CrossRef]
  41. Lei, T.; Hu, H.; Feng, G.; Wang, L.; Chen, Y.; Chen, B.; Wang, J. Evaluation and application of public space in commercial buildings based on user behaviour needs. Alex. Eng. J. 2025, 125, 29–41. [Google Scholar] [CrossRef]
  42. Tinessa, F.; Pagliara, F.; Biggiero, L.; Delli Veneri, G. Walkability, accessibility to metro stations and retail location choice: Some evidence from the case study of Naples. Res. Transp. Bus. Manag. 2021, 40, 100549. [Google Scholar] [CrossRef]
  43. Higgins, C.D.; Arku, R.N.; Farber, S.; Miller, E.J. Modelling changes in accessibility and property values associated with the King Street Transit Priority Corridor project in Toronto. Transp. Res. Part A Policy Pract. 2024, 190, 104256. [Google Scholar] [CrossRef]
  44. Chan, S.H.G.; Lee, W.H.H.; Tang, B.M.; Chen, Z. Legacy of culture heritage building revitalization: Place attachment and culture identity. Front. Psychol. 2023, 14, 1314223. [Google Scholar] [CrossRef] [PubMed]
  45. Mäntymaa, E.; Jokinen, M.; Juutinen, A.; Lankia, T.; Louhi, P. Providing ecological, cultural and commercial services in an urban park: A travel cost-contingent behavior application in Finland. Landsc. Urban Plan. 2021, 209, 104042. [Google Scholar] [CrossRef]
  46. Shi, X.; Liu, D.; Gan, J. A Study on the Relationship between Road Network Centrality and the Spatial Distribution of Commercial Facilities—A Case of Changchun, China. Sustainability 2024, 16, 3920. [Google Scholar] [CrossRef]
  47. Li, Y. Common Sharing or Public Sharing: A Study on the Choice Behavior of Urban Citizens in Public Travel. Sustainability 2022, 14, 9459. [Google Scholar] [CrossRef]
  48. Meng, Q.Y.; Zhang, L.L.; Wang, X.M.; Hu, X.L.; Allam, M.; Wu, J.H.; Yan, M.; Qi, J.N.; Zhai, W.F. Travel preference: An indicator of the benefits of urban green space. Int. J. Digit. Earth 2024, 17, 2342978. [Google Scholar] [CrossRef]
  49. Hochreiter, V.; Benedetto, C.; Loesch, M. The Stimulus-Organism-Response (S-O-R) Paradigm as a Guiding Principle in Environmental Psychology: Comparison of its Usage in Consumer Behavior and Organizational Culture and Leadership Theory. J. Entrep. Bus. Dev. 2023, 3, 7–16. [Google Scholar] [CrossRef]
  50. Nigg, C.; Fiedler, J.; Burchartz, A.; Reichert, M.; Niessner, C.; Woll, A.; Schipperijn, J. Associations between green space availability and youth’s physical activity in urban and rural areas across Germany. Landsc. Urban Plan. 2024, 247, 105068. [Google Scholar] [CrossRef]
  51. Wang, P.; Zhou, B.; Ya, J.; Han, L.; Zhu, Y. The impact of perceived restorative destination environments on tourists’ willingness-To-Pay for environmental protection. Sci. Rep. 2025, 15, 19989. [Google Scholar] [CrossRef]
  52. Chen, C.-T. Atmospherics fosters customer loyalty: Exploring the mediating effects of memorable customer experience and customer satisfaction in factory outlet malls in Taiwan. J. Retail. Consum. Serv. 2024, 80, 103936. [Google Scholar] [CrossRef]
  53. Guo, X.; Yao, J.; Fu, P. Willingness effect of ecological consumption behavior choices on the perception of cultural service value in tourist ecosystem. J. Cent. China Norm. Univ. Nat. Sci. Ed. 2022, 56, 882–890. [Google Scholar] [CrossRef]
  54. Wei, Y.; Kim, Y. Intangible Cultural Heritage (ICH) Cultural Identity Perception and ICH Authenticity Perception impact on consumption intention of ICH products in China. Rev. Cult. Econ. 2024, 27, 73–106. [Google Scholar] [CrossRef]
  55. Fu, Y.; Dong, W. How perceived value, environmental awareness, and social identity shape public support for industrial heritage: The mediating role of place attachment. Front. Psychol. 2025, 16, 1645646. [Google Scholar] [CrossRef]
  56. Helinski, C.; Schewe, G. The Influence of Consumer Preferences and Perceived Benefits in the Context of B2C Fashion Renting Intentions of Young Women. Sustainability 2022, 14, 9407. [Google Scholar] [CrossRef]
  57. Ji, Y.; Wang, Z.; Zhu, D. Exploring the Impact of Urban Amenities on Business Circle Vitality Using Multi-Source Big Data. Land 2024, 13, 1616. [Google Scholar] [CrossRef]
  58. Wu, W.; Chen, W.Y.; Yun, Y.; Wang, F.; Gong, Z. Urban greenness, mixed land-use, and life satisfaction: Evidence from residential locations and workplace settings in Beijing. Landsc. Urban Plan. 2022, 224, 104428. [Google Scholar] [CrossRef]
  59. Liu, S.; Liu, W.; Zhou, Y.; Wang, S.; Wang, Z.; Wang, Z.; Wang, Y.; Wang, X.; Hao, L.; Wang, F. Analysis of Economic Vitality and Development Equilibrium of China’s Three Major Urban Agglomerations Based on Nighttime Light Data. Remote Sens. 2024, 16, 4571. [Google Scholar] [CrossRef]
  60. Peng, D.; Elahi, E.; Khalid, Z. Productive Service Agglomeration, Human Capital Level, and Urban Economic Performance. Sustainability 2023, 15, 7051. [Google Scholar] [CrossRef]
  61. Zhou, Q.; Lei, Y.; Tian, L.; Ai, S.; Yang, Y.; Zhu, Y. Perception and sentiment analysis of palliative care in Chinese social media: Qualitative studies based on machine learning. Soc. Sci. Med. 2025, 379, 118178. [Google Scholar] [CrossRef]
  62. Chen, T.Q.; Guestrin, C.; Assoc Comp, M. XGBoost: A Scalable Tree Boosting System. In Proceedings of the 22nd ACM SIGKDD International Conference on Knowledge Discovery and Data Mining (KDD), San Francisco, CA, USA, 13–17 August 2016; pp. 785–794. [Google Scholar]
  63. Helili, P.; Zan, M. Coupling Coordination Development of Urbanization and Ecological Environment in the Urban Agglomeration on the Northern Slope of the Tianshan Mountains, China. Sustainability 2023, 15, 4099. [Google Scholar] [CrossRef]
  64. Vasiliu, E.-E.; Torabi Moghadam, S.; Bisello, A.; Lombardi, P. Visionary Nature-Based Solutions Evaluated through Social Return on Investment: The Case Study of an Italian Urban Green Space. Smart Cities 2024, 7, 946–972. [Google Scholar] [CrossRef]
  65. Lv, D.; Qin, S.; Sun, R.; Jiang, X.; Cheng, R.; Sun, W. The Impact of Natural and Cultural Landscape Quality on Attachment to Place and the Intention to Recommend Tourism in a UNESCO World Heritage City. Land 2025, 14, 1405. [Google Scholar] [CrossRef]
  66. Vilnai-Yavetz, I.; Gilboa, S.; Mitchell, V. Experiencing atmospherics: The moderating effect of mall experiences on the impact of individual store atmospherics on spending behavior and mall loyalty. J. Retail. Consum. Serv. 2021, 63, 102704. [Google Scholar] [CrossRef]
  67. Zhang, E.; Zhou, Y.; Chen, G.; Wang, G. Classified Spatial Clustering and Influencing Factors of New Retail Stores: A Case Study of Freshippo in Shanghai. Sustainability 2024, 16, 6643. [Google Scholar] [CrossRef]
  68. Zhou, R.; Wang, C.; Bao, D.; Xu, X. Shopping Mall Site Selection Based on Consumer Behavior Changes in the New Retail Era. Land 2024, 13, 855. [Google Scholar] [CrossRef]
  69. Fang, H.; Li, R.; Li, W. Urban Shrinkage and Labor Investment Efficiency: Evidence from China. Sustainability 2023, 15, 10738. [Google Scholar] [CrossRef]
  70. Gao, J.; Lin, S.; Zhang, C. Authenticity, involvement, and nostalgia: Understanding visitor satisfaction with an adaptive reuse heritage site in urban China. J. Destin. Mark. Manag. 2020, 15, 100404. [Google Scholar] [CrossRef]
  71. Shi, H.; Zhao, M.; Simth, D.A.; Chi, B. Behind the Land Use Mix: Measuring the Functional Compatibility in Urban and Sub-Urban Areas of China. Land 2022, 11, 2. [Google Scholar] [CrossRef]
  72. Stadler, M. Location in a Disk City with Consumer Concentration Around the Center. Schmalenbach Bus. Rev. 2019, 71, 35–50. [Google Scholar] [CrossRef]
  73. Blazy, R.; Łabuz, R. Spatial Distribution and Land Development Parameters of Shopping Centers Based on GIS Analysis: A Case Study on Kraków, Poland. Sustainability 2022, 14, 7539. [Google Scholar] [CrossRef]
  74. Lima, L.; Maraschin, C.; Giaccom, B.; Giusti, C. Urban spatial configuration and interactions with retail activities: An approach based on contact. Cities 2024, 146, 104783. [Google Scholar] [CrossRef]
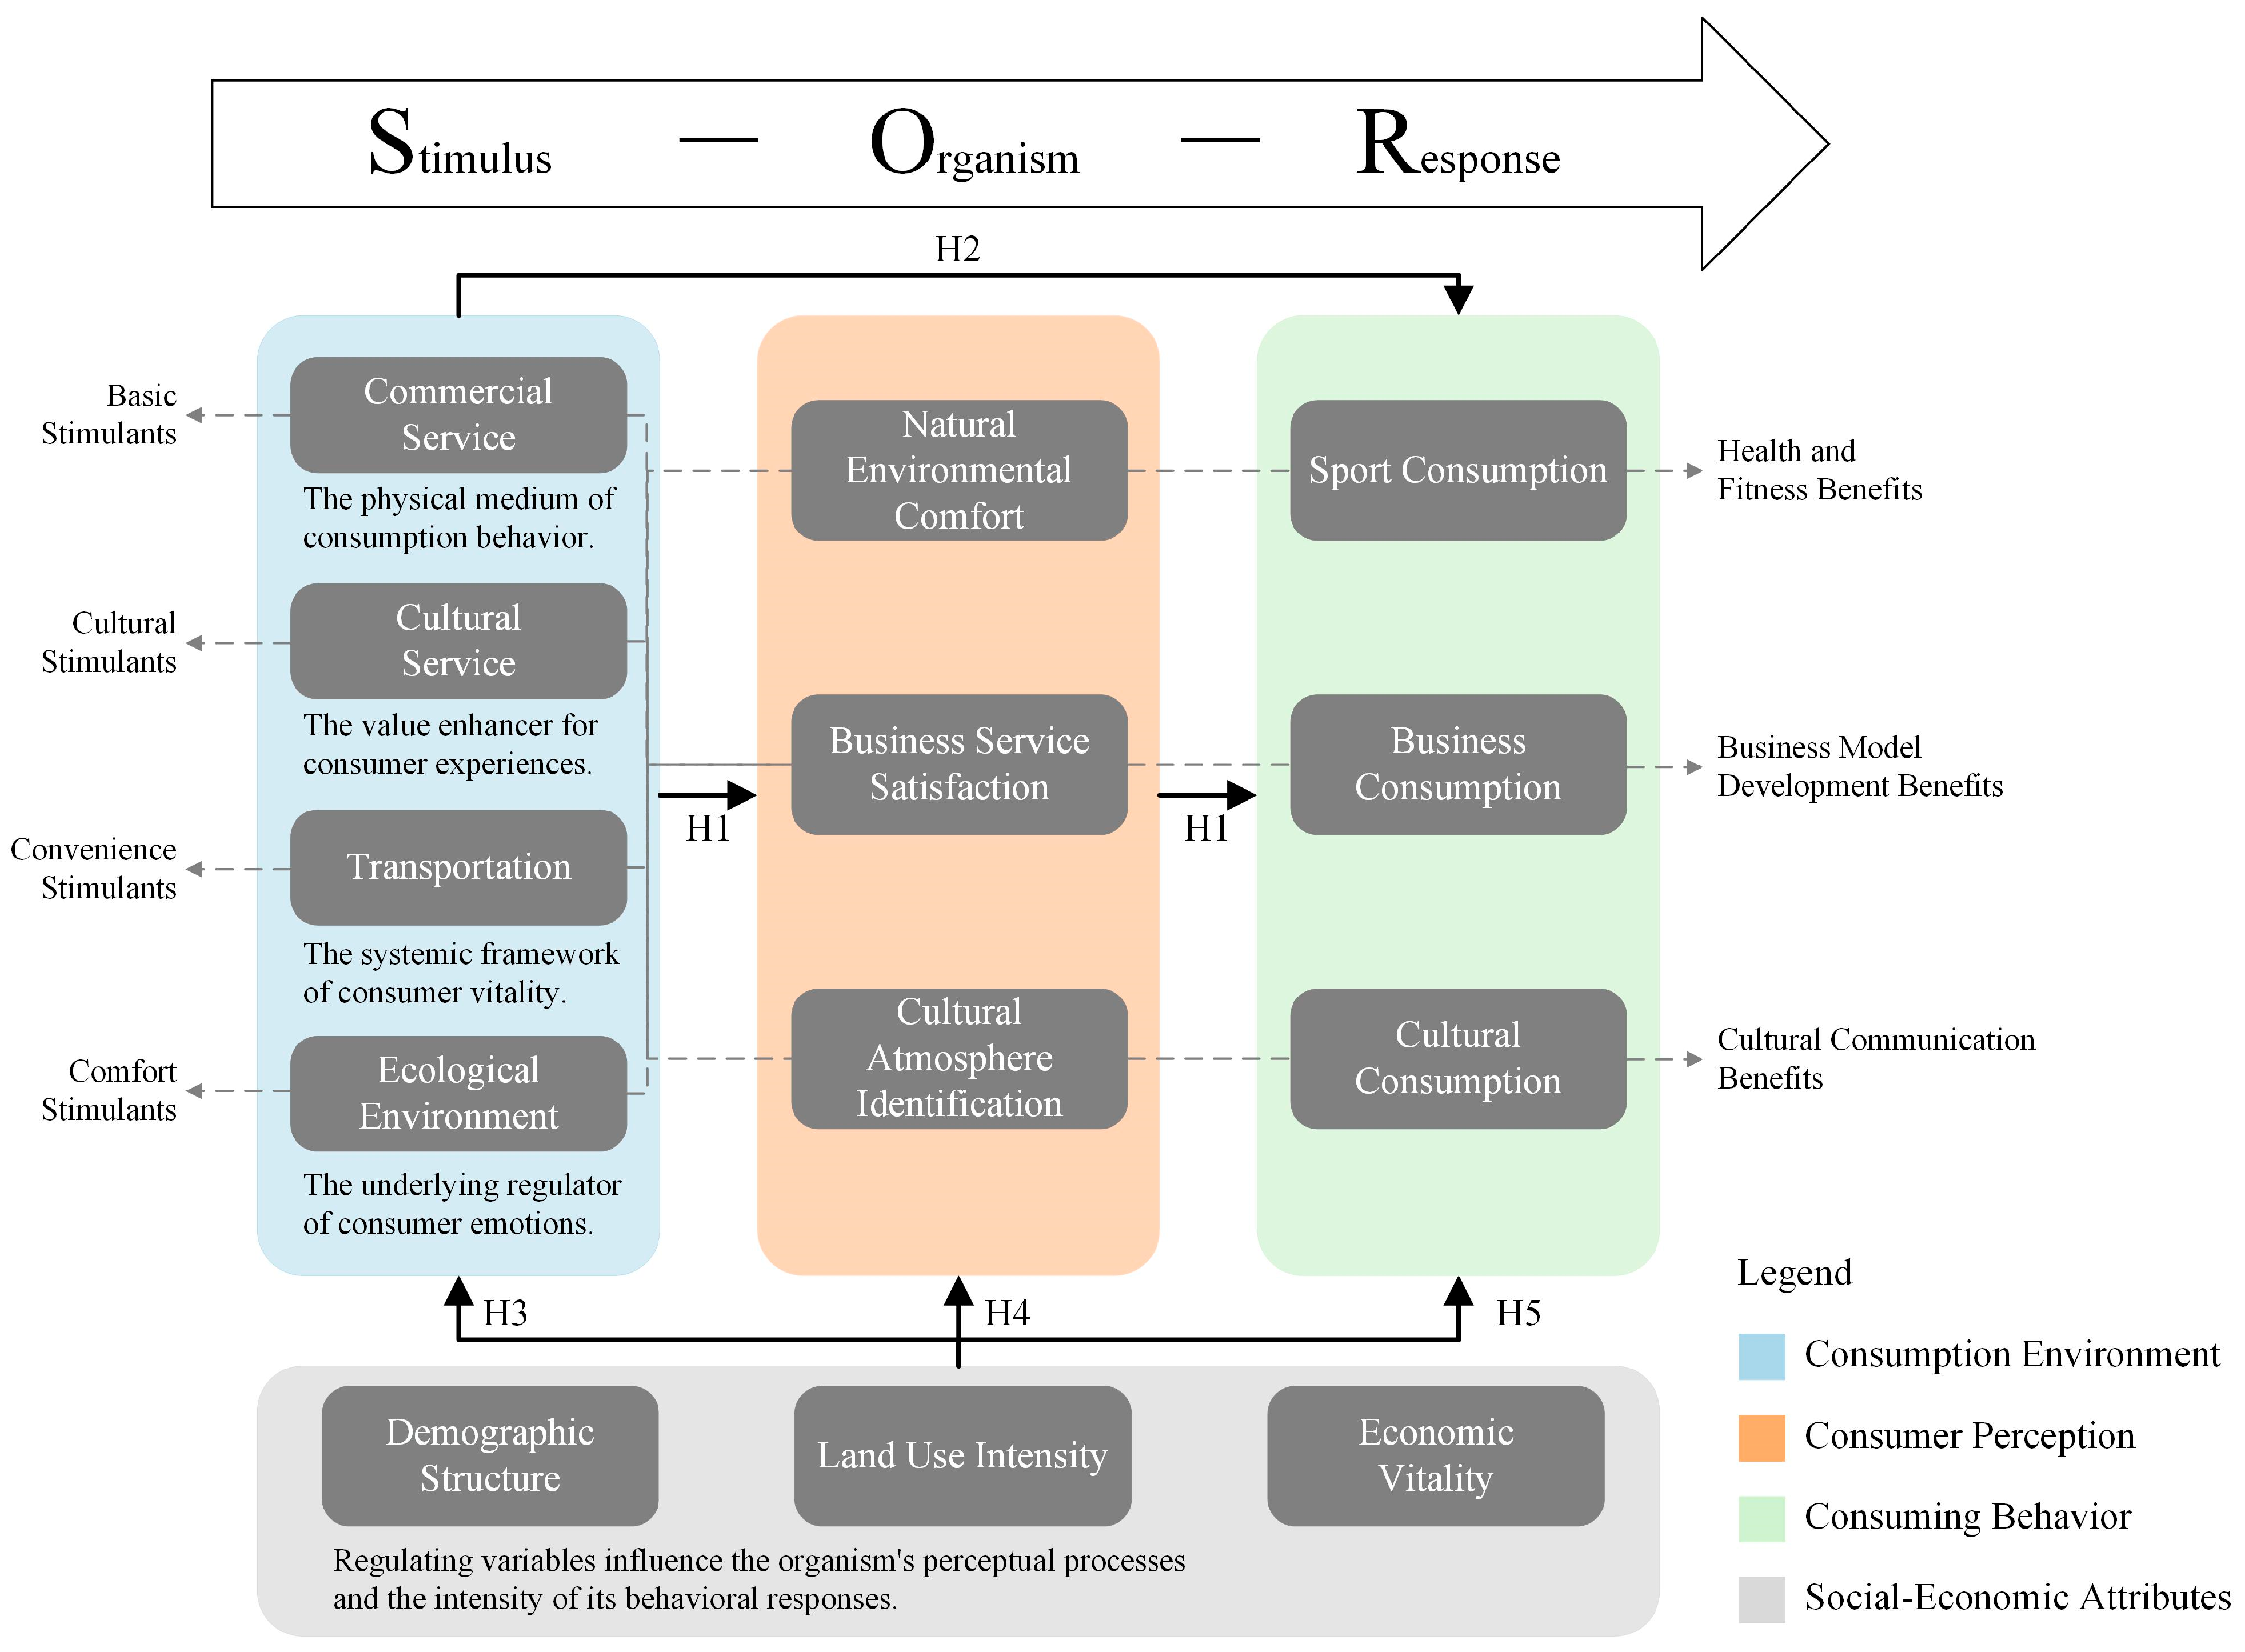
Figure 1. Theoretical Framework.
Land 14 02322 g001
Figure 2. Multidimensional Benefit Evaluation Index System for Urban Spaces.
Land 14 02322 g002
Figure 3. Study area, Including study districts and counties, water bodies and topography, population distribution and nighttime light intensity: (a) study districts and counties; (b) hydrographic and elevation; (c) population; (d) illumination.
Land 14 02322 g003
Figure 4. Technical Route.
Land 14 02322 g004
Figure 5. Consumption Perception–Behavioral Influence Pathway.
Land 14 02322 g005
Figure 6. Summary of Consumption Preferences, XGBoost Regression Results for Three Types of Consumer Behavior: (a) Sports consumption; (b) Business consumption; (c) Cultural consumption.
Land 14 02322 g006
Figure 7. Thresholds for the Effects of Consumption Environment and Perception. The blue dots represent each individual sample, and the red line represents the average trend of the samples: (a) Sports consumption; (b) Business consumption; (c) Cultural consumption.
Land 14 02322 g007
Figure 8. Interaction of Key Driving Factors: (a) Sports consumption; (b) Business consumption; (c) Cultural consumption.
Land 14 02322 g008
Figure 9. Coupling Coordination Degree Based on Consumption Preferences.
Land 14 02322 g009
Figure 10. Distribution of Urban Spatial Value.
Land 14 02322 g010
Figure 11. Multidimensional Benefit Distribution of Urban Space.
Land 14 02322 g011
Figure 12. Urban Spatial Functional Zoning Map Based on Consumption Preferences.
Land 14 02322 g012
Table 1. Regression Results for the Hedonic Price Model.
Global RegressionSports Consumption WeightedBusiness Consumption WeightedCultural Consumption Weighted
Bp > |t|Bp > |t|Bp > |t|Bp > |t|
Constant0.1191.0000.0140.281−0.120 ***0.0000.048 ***0.000
Dining facilities0.0140.5240.0070.6320.0010.9930.0030.818
Shopping facilities0.0170.4480.0030.8180.134 **0.0290.0020.844
Business diversity0.065 ***0.009−0.076 **0.0150.250 **0.032−0.045 *0.080
Historical blocks0.120 ***0.0000.050 ***0.0060.0070.6160.057 ***0.001
Road network0.080 ***0.0000.044 ***0.0020.020 *0.0940.036 ***0.004
Bus station0.063 ***0.001−0.116 ***0.000−0.111 ***0.000−0.089 ***0.000
Subway station0.120 ***0.000−0.058 ***0.0070.0010.934−0.066 ***0.001
Vegetation coverage−0.163 ***0.0000.443 ***0.000−0.133 ***0.000−0.181 ***0.000
Water density−0.021 **0.019−0.0200.1860.0020.9890.024 **0.014
Greening rate−0.019 **0.0240.049 ***0.000−0.0230.122−0.022 ***0.001
Blue−green space accessibility0.0070.482−0.0020.9880.024 *0.0540.0100.362
Business service satisfaction0.825 ***0.000−0.383 ***0.0000.0090.827−0.3660.109
Cultural atmosphere identification0.361 ***0.0000.021 ***0.0000.0390.4350.139 ***0.003
Natural environmental comfort−1.268 ***0.0000.683 ***0.000−0.1660.0660.622 ***0.000
Population−0.1520.199−0.0180.9240.312 *0.0880.1280.384
Age0.2910.1370.031 **0.0170.970 ***0.0100.018 *0.093
Gender0.1470.1370.002 **0.0110.280 *0.0900.143 *0.088
Land use mix0.059 **0.0190.074 **0.0350.0360.2680.0350.212
Illumination0.123 **0.0000.092 ***0.000−0.039 **0.032−0.061 ***0.000
Adjusted R20.75Adjusted R20.77Adjusted R20.68Adjusted R20.73
*** p < 0.01, ** p < 0.05, * p < 0.1.
Table 2. Training results of the XGBoost regression model.
ModelR2RMSEMAE
Sports consumption0.870.752.18
Business consumption0.852.875.77
Cultural consumption0.940.180.62
Disclaimer/Publisher’s Note: The statements, opinions and data contained in all publications are solely those of the individual author(s) and contributor(s) and not of MDPI and/or the editor(s). MDPI and/or the editor(s) disclaim responsibility for any injury to people or property resulting from any ideas, methods, instructions or products referred to in the content.