Differences in Tourism Ecological Resilience and Its Asymmetric Driving Mechanisms in the Chengdu-Chongqing Economic Circle, China
Abstract
1. Introduction
2. Study Area and Data
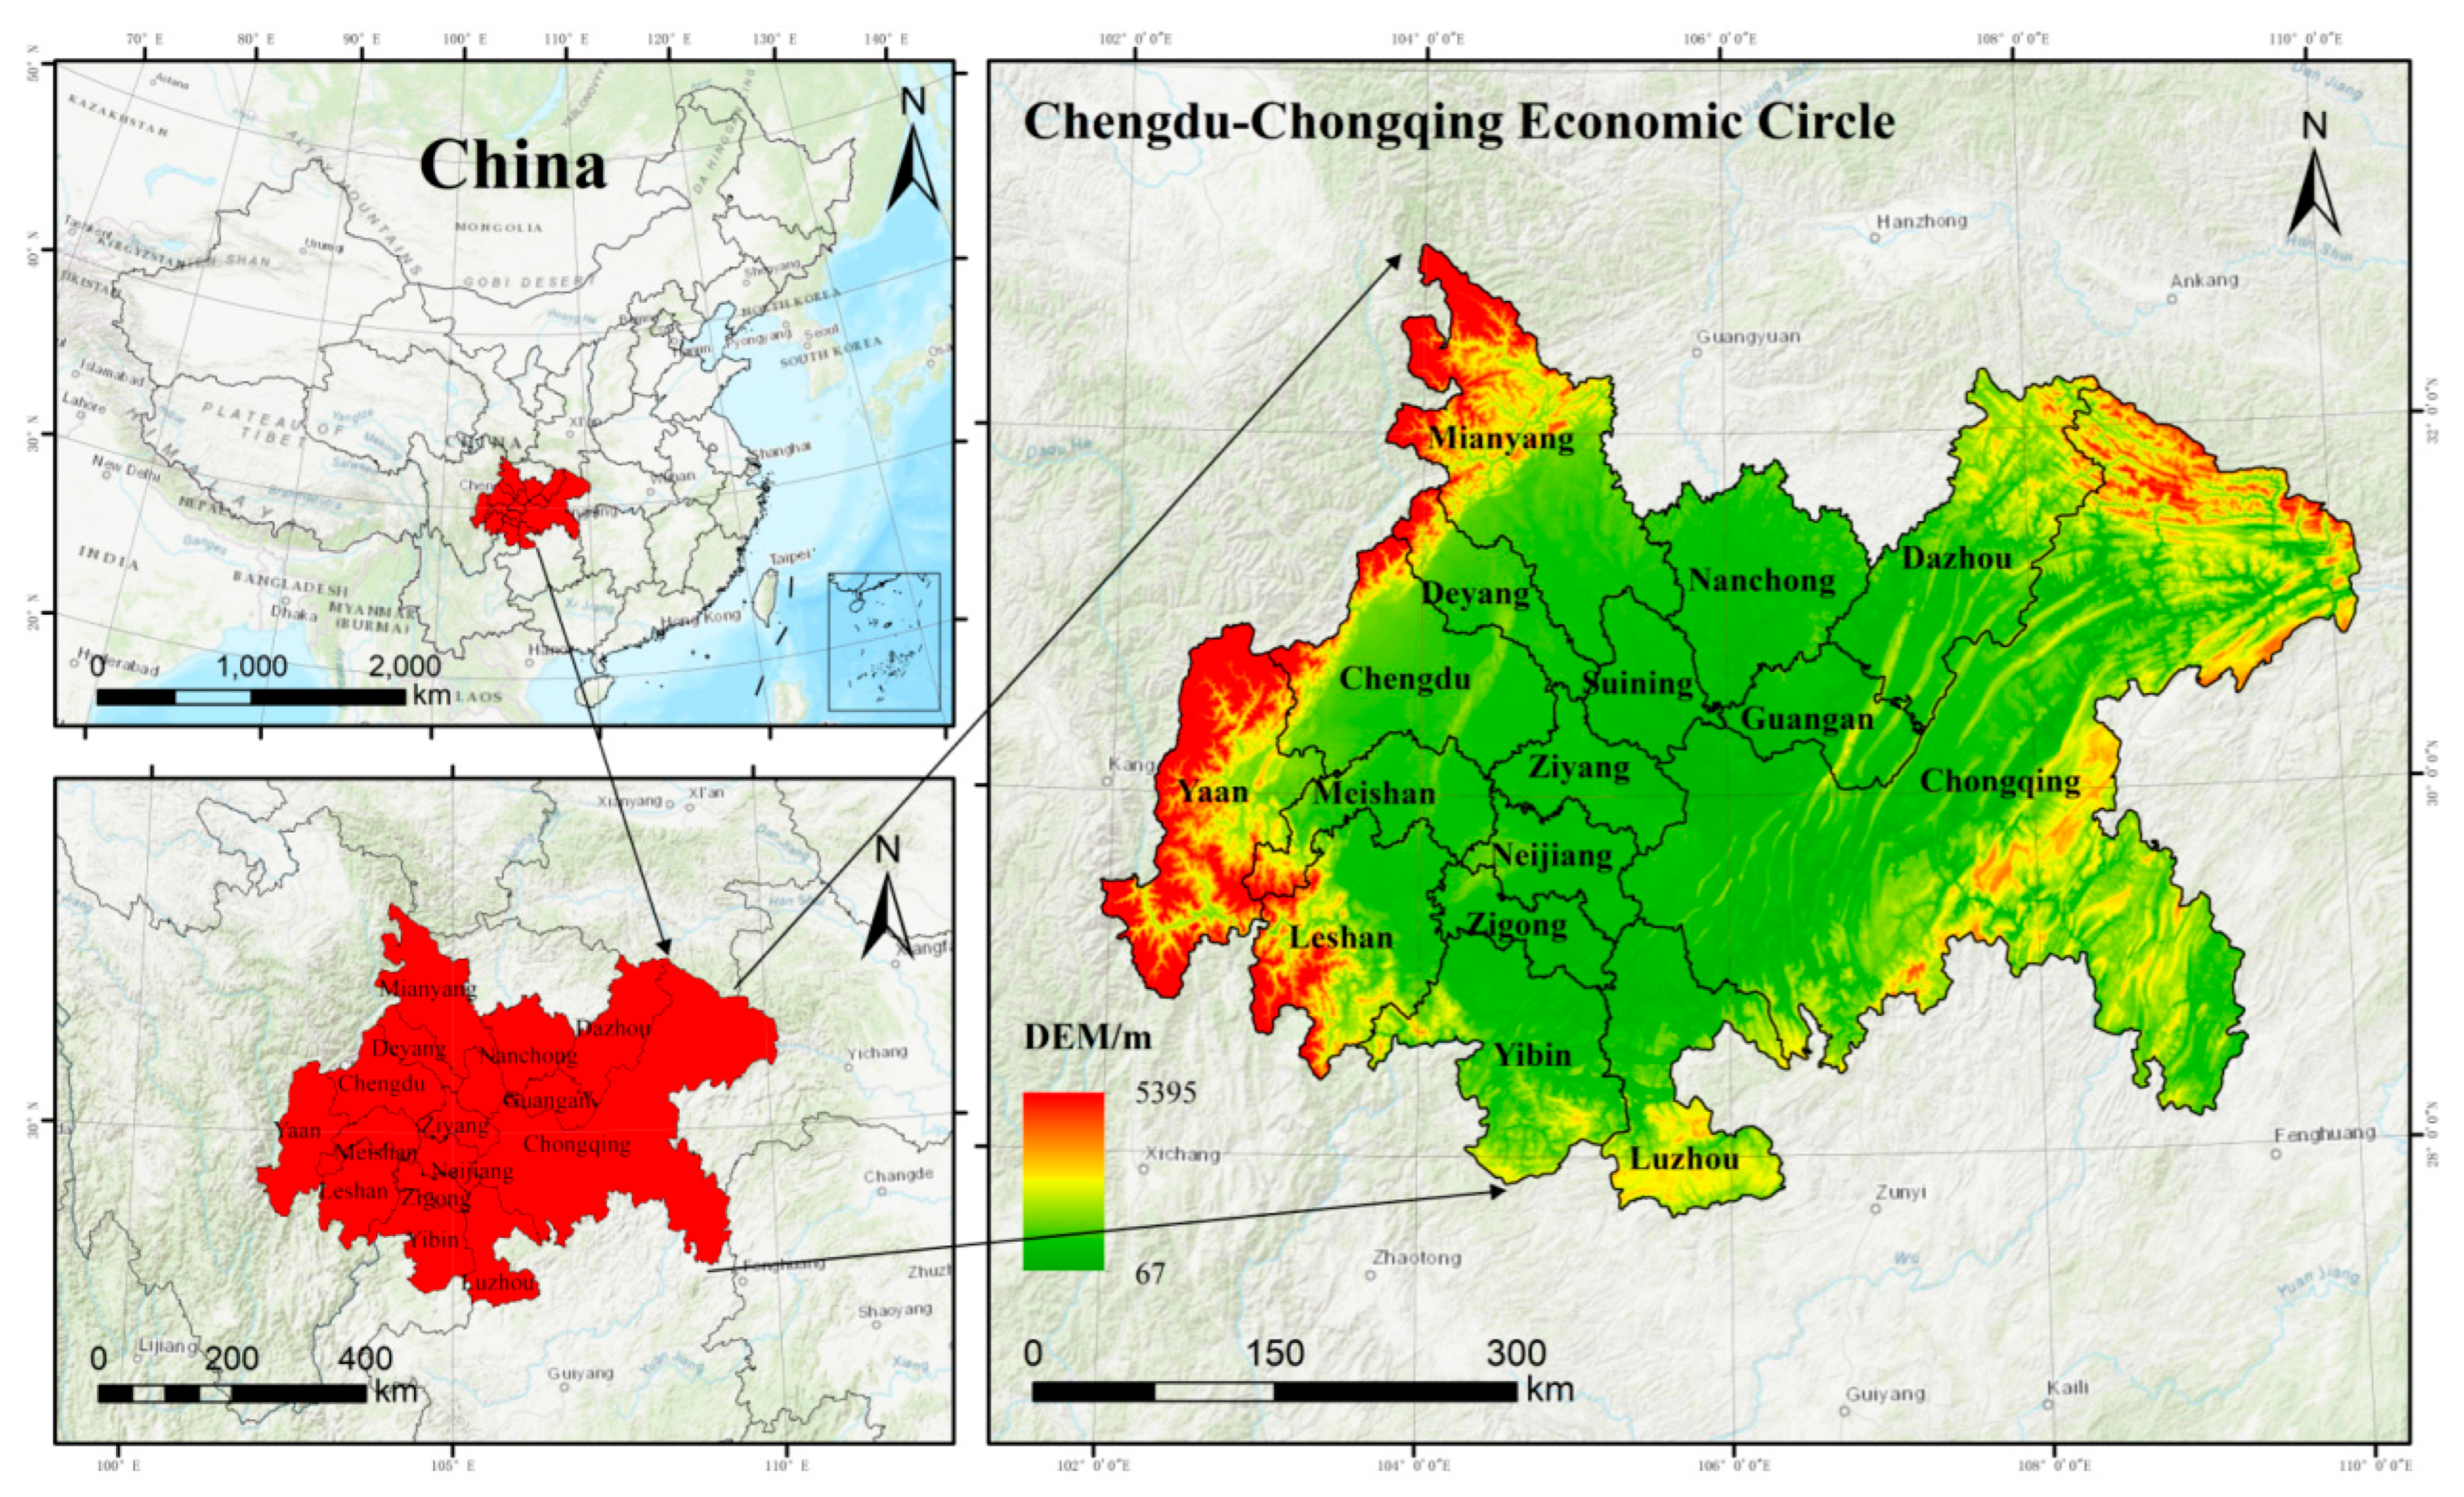
2.1. Study Area
2.2. Data Sources and Processing
3. Methodology
3.1. Indicator System Construction
3.2. Research Method
4. Results
4.1. Temporal Evolutionary Characteristics of TER
4.2. Spatial Differentiation Pattern of TER
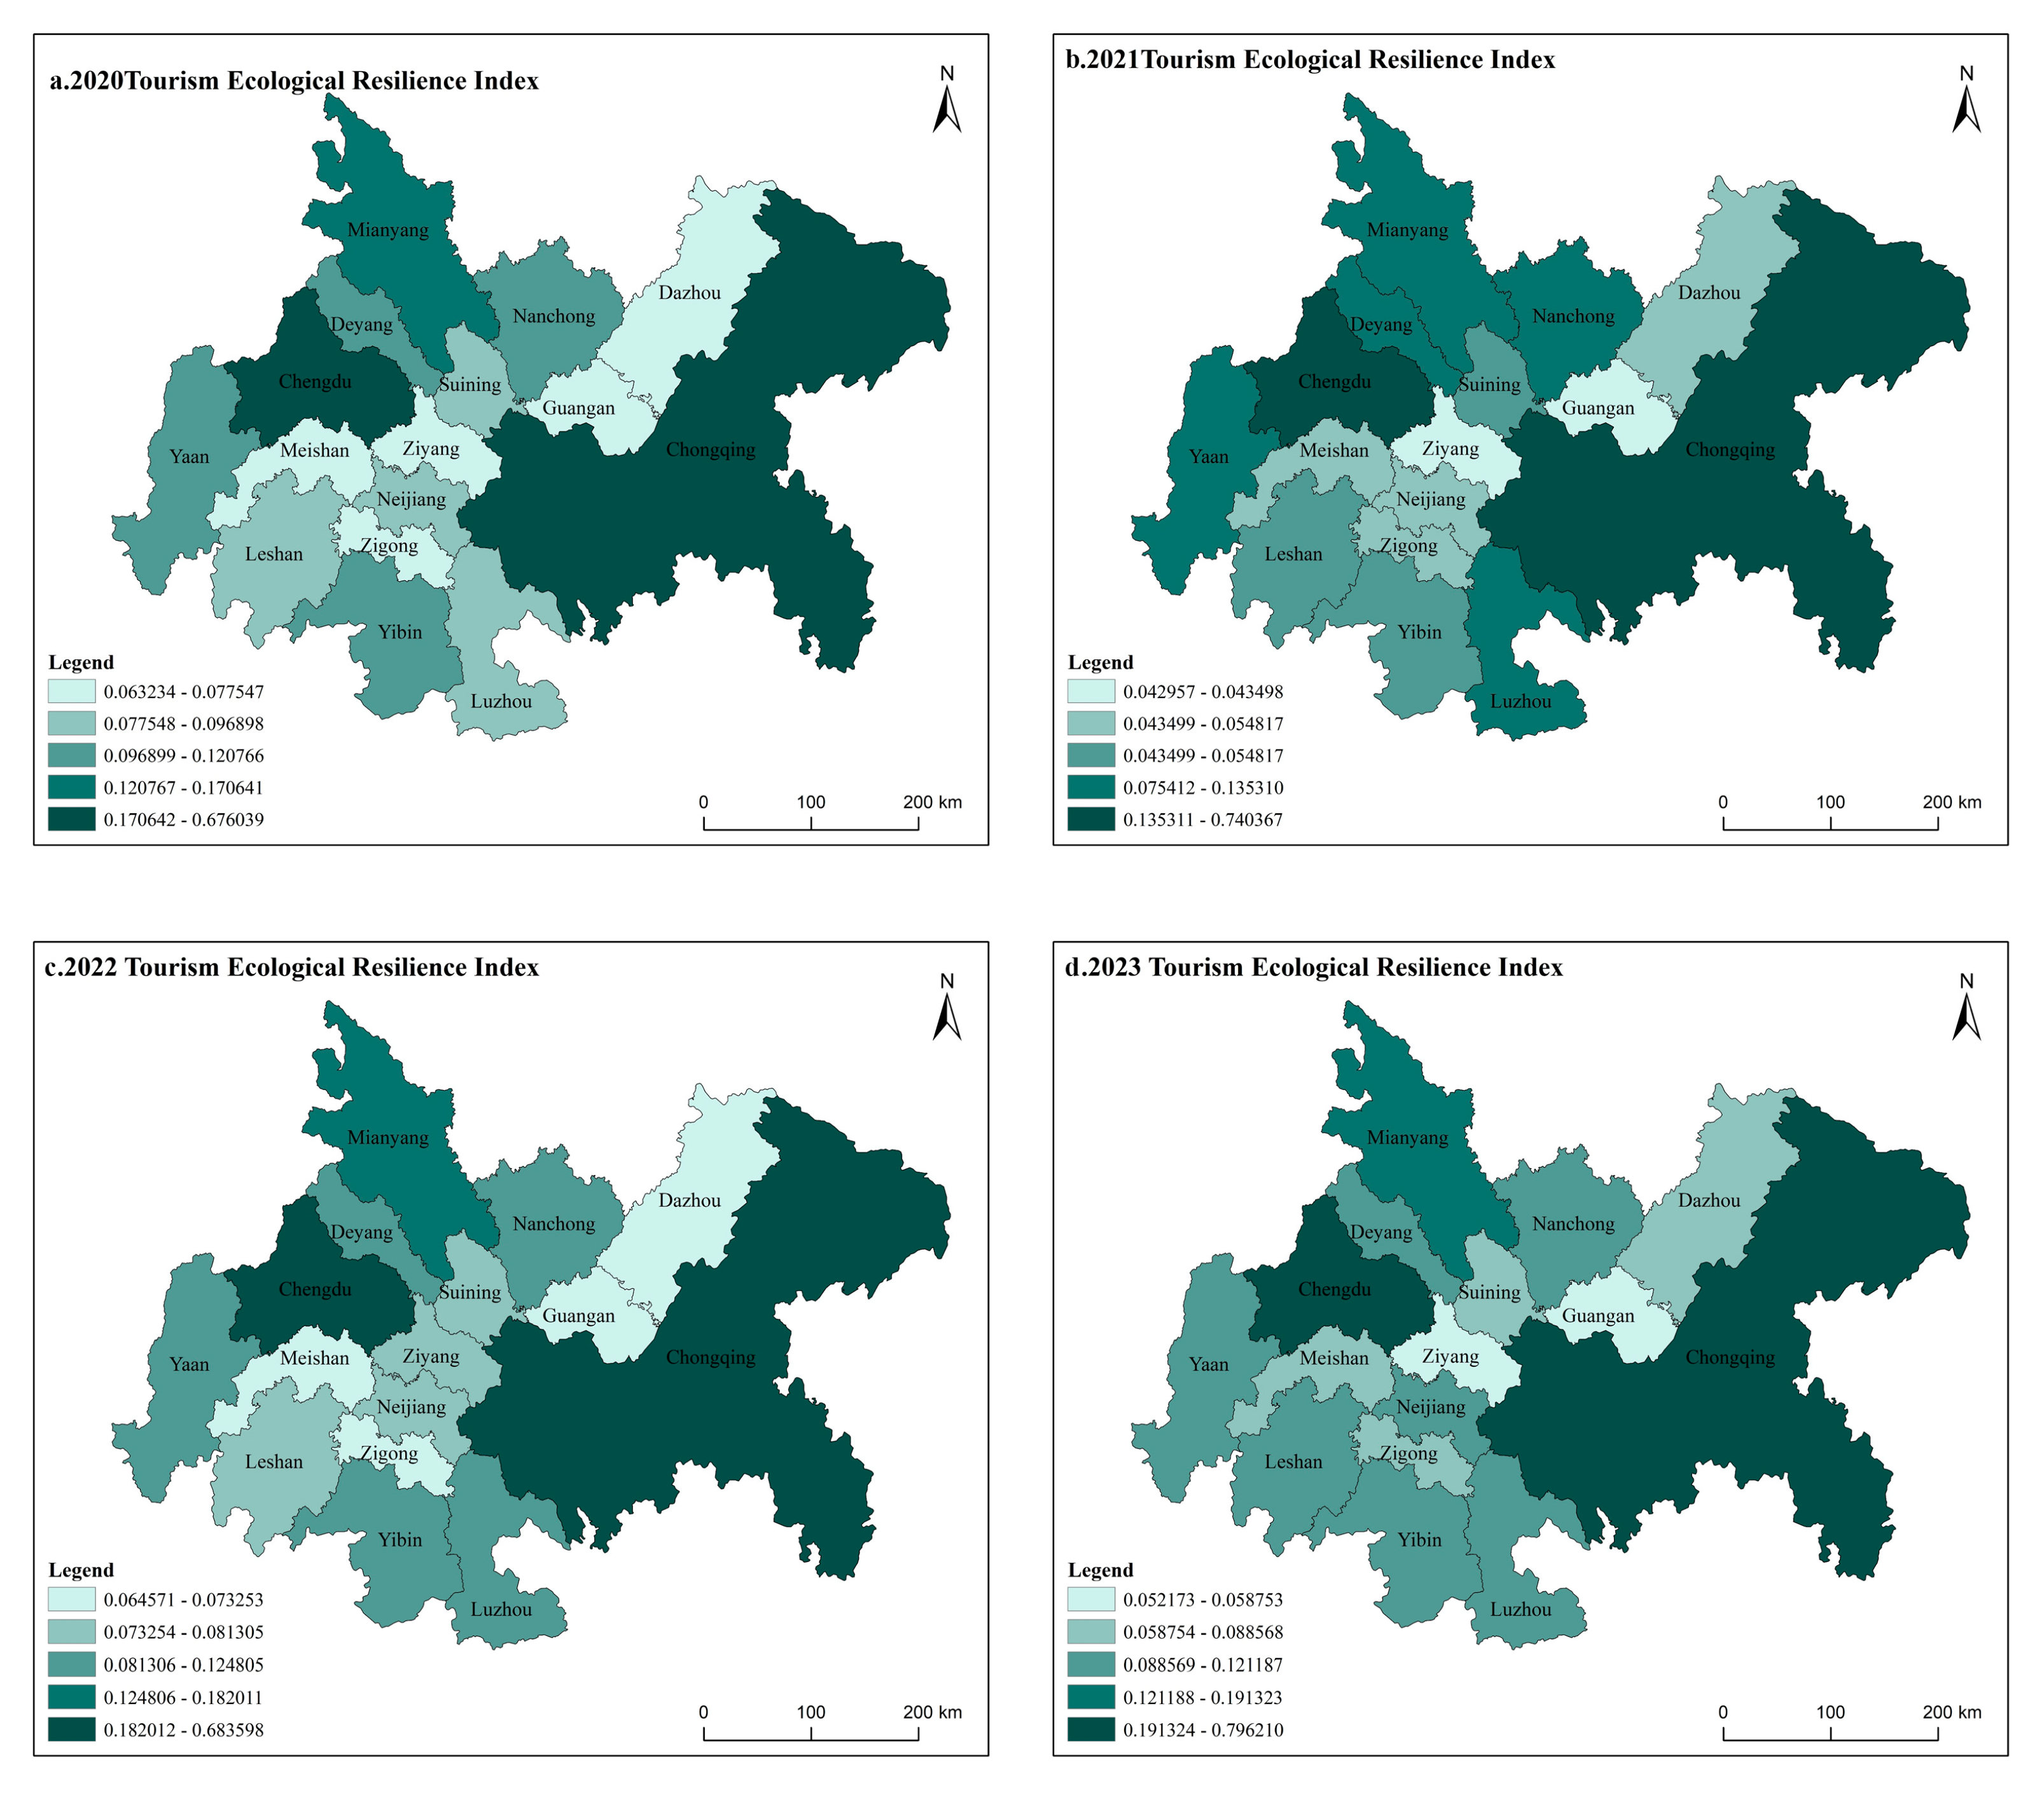
4.2.1. Spatial Differentiation Pattern of TER Before the Pandemic
4.2.2. Spatial Differentiation Pattern of TER After the Pandemic
4.3. Evaluation and Analysis of Subsystems of TER
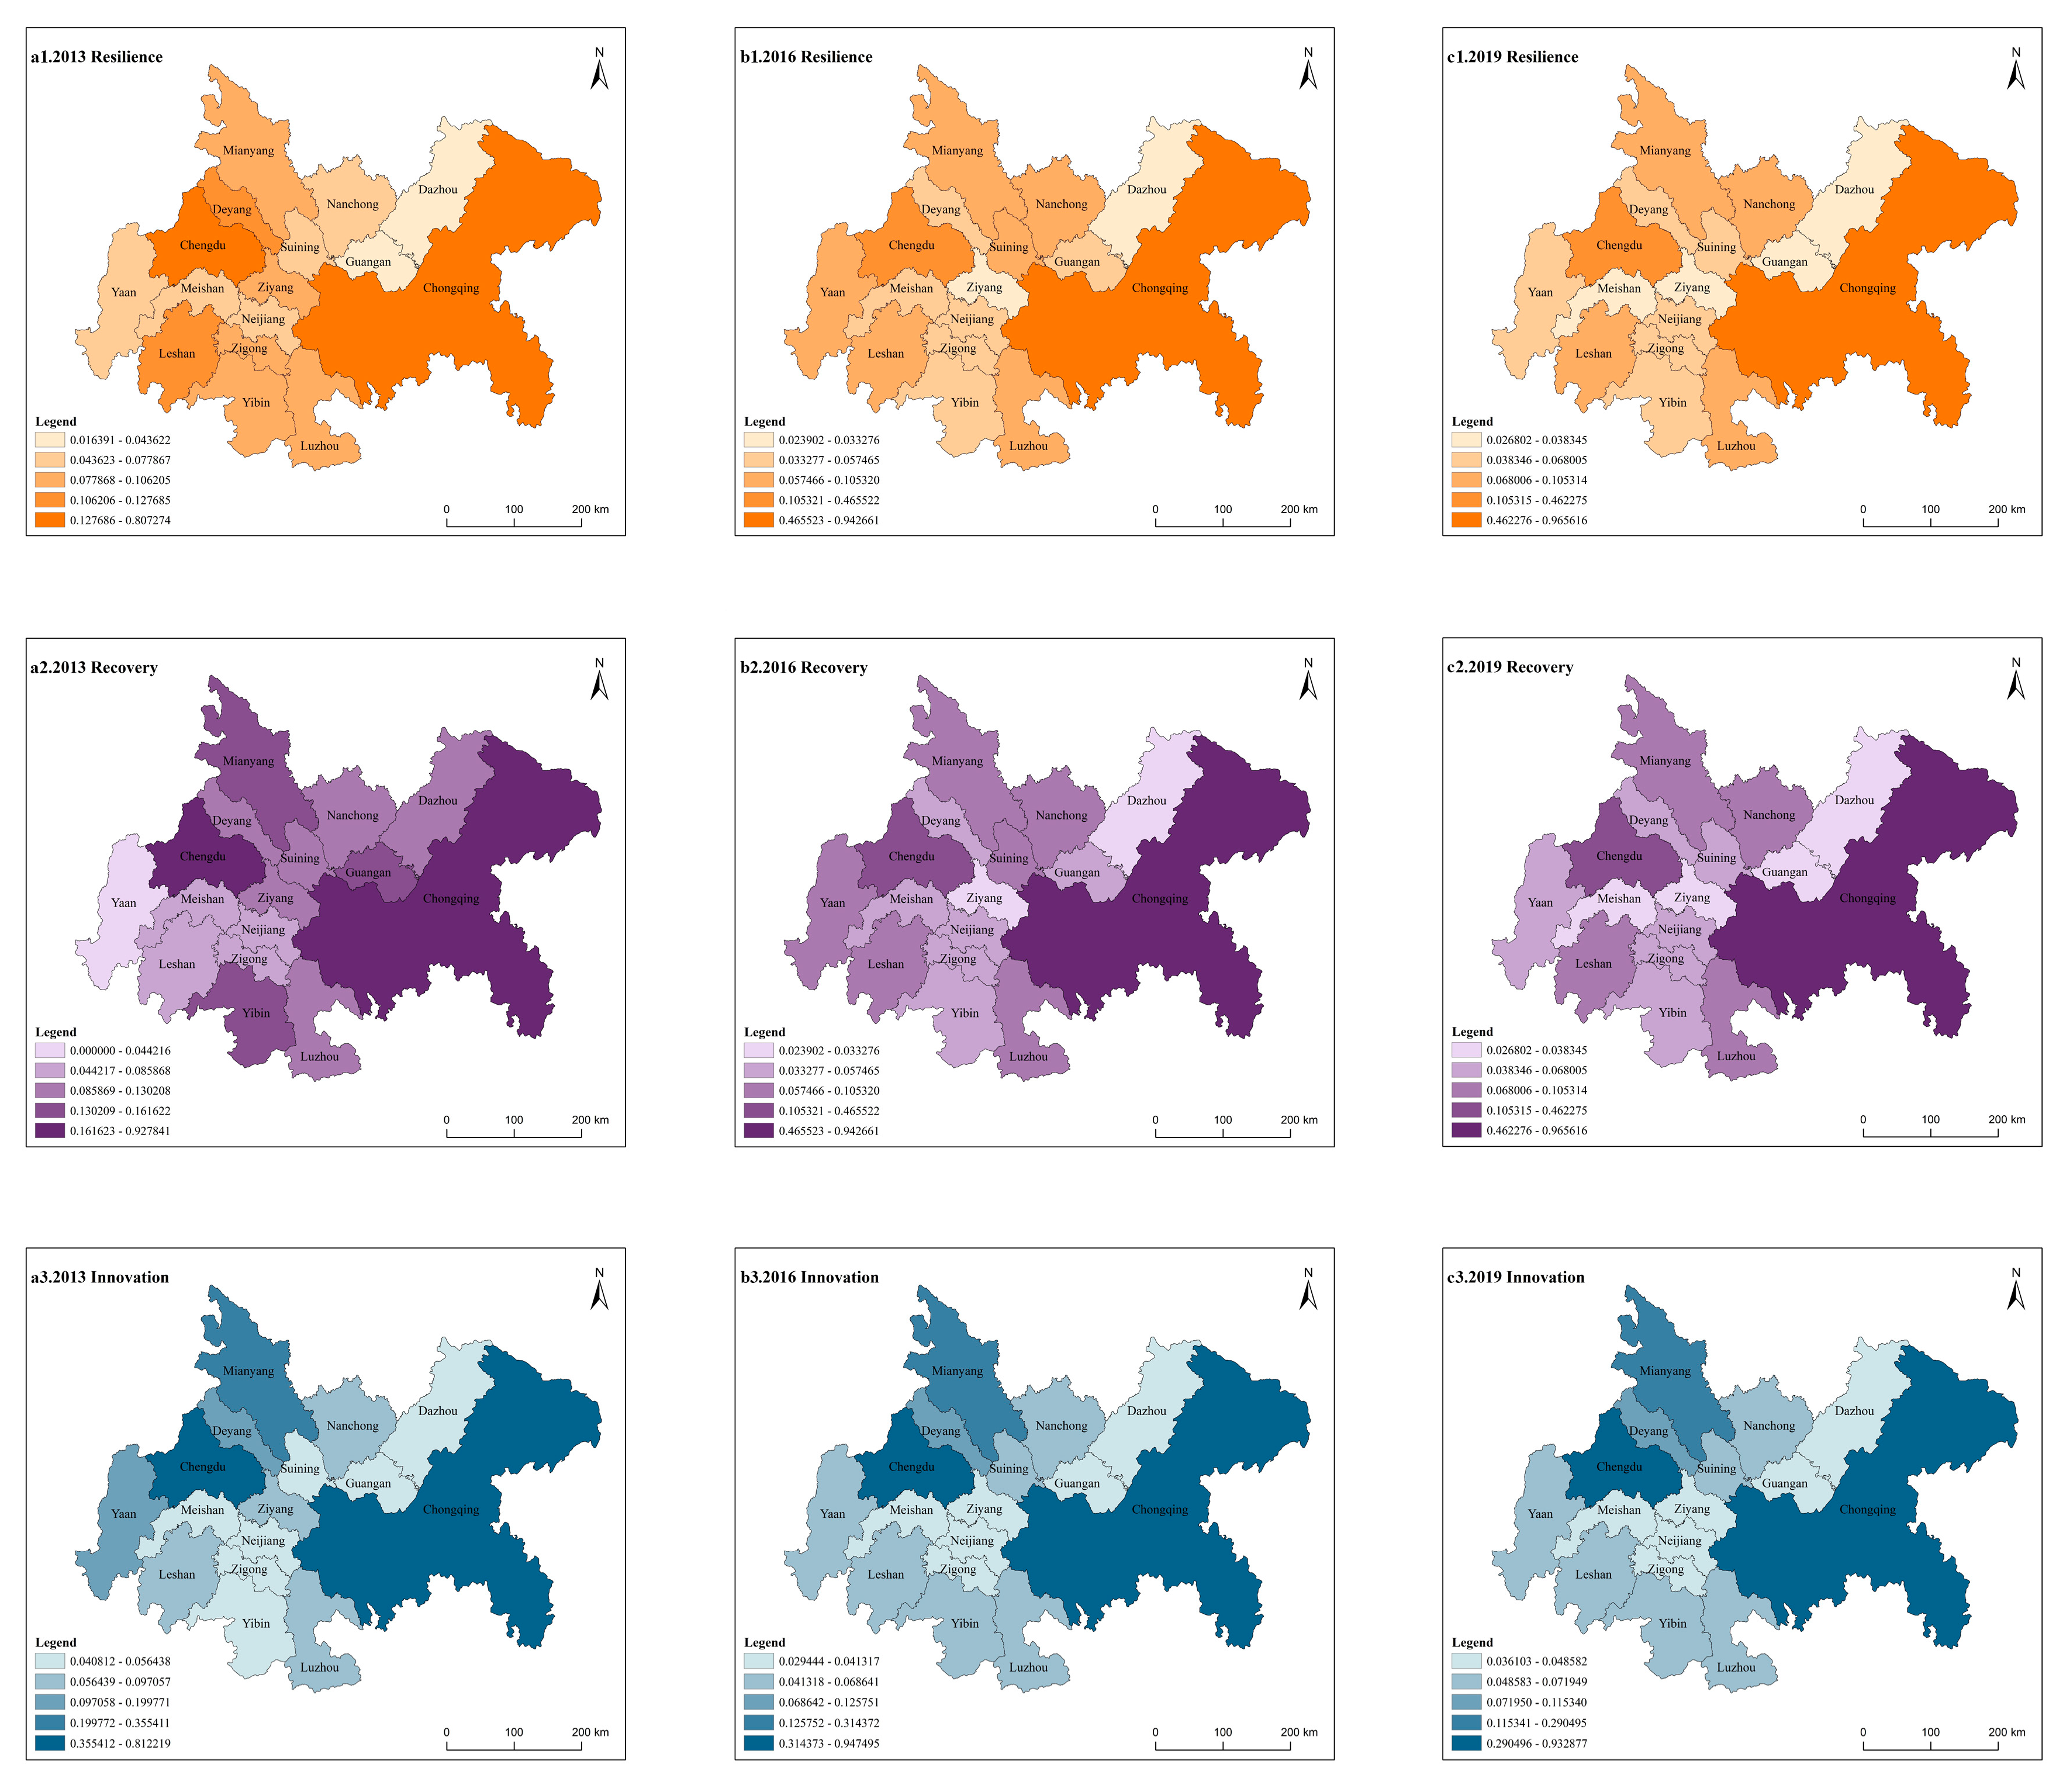
4.3.1. Evaluation of Subsystems of TER Before the Pandemic
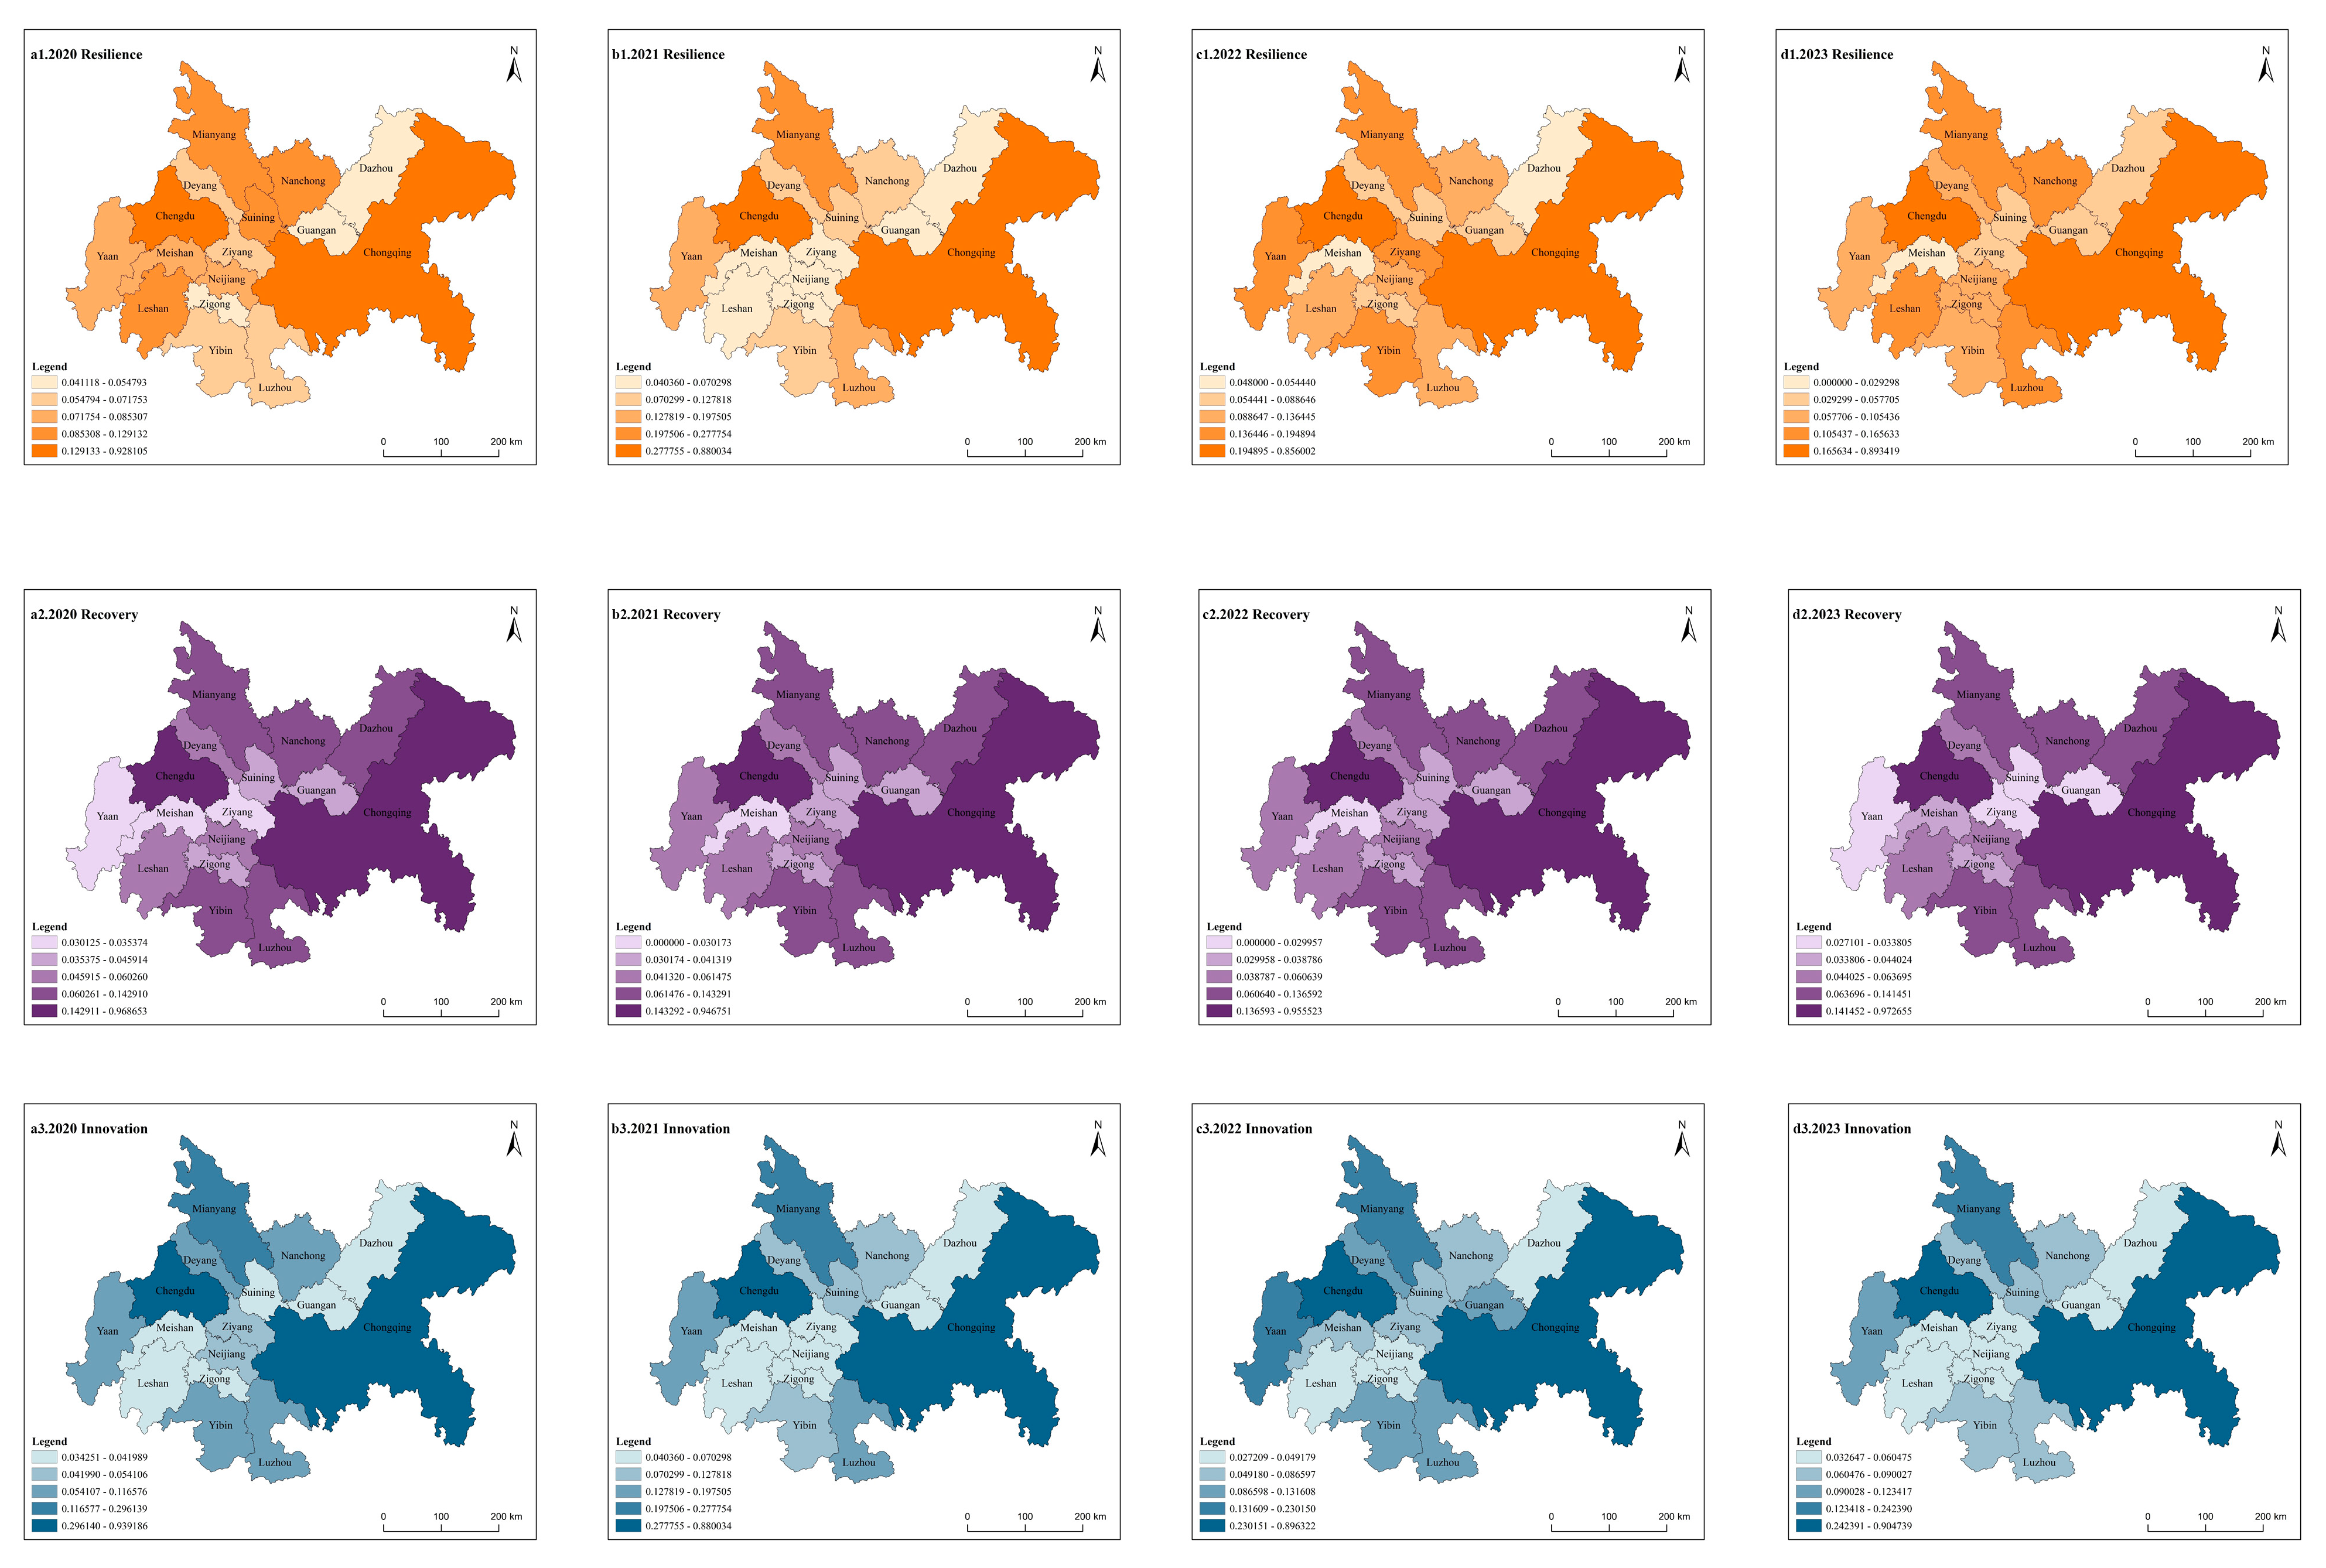
4.3.2. Evaluation of Subsystems of TER in the Post-Pandemic Era
4.4. Asymmetric Analysis of Influencing Factors of TER
4.4.1. Data Calibration and Truth Table Construction
4.4.2. Analysis of Necessary Conditions
4.4.3. fsQCA Results
4.4.4. Prediction Validity
5. Discussion
5.1. Spatiotemporal Differences in TER
5.2. Mechanisms Underlying Differences in TER
6. Conclusions
6.1. Conclusions
- (1)
- Temporal Evolution: TER demonstrated an overall upward trend, though significant internal regional disparities were observed. Chongqing and Chengdu consistently maintained leading positions, with average values of 0.634 and 0.491, respectively, while most other cities exhibited averages below 0.155, reflecting a development pattern characterized by “prominent dual cores and lagging peripheries.” Chongqing showed steady growth, reaching 0.796 in 2023, while Chengdu experienced fluctuations with an upward trend, achieving 0.659 in 2023. Most cities exhibited low resilience levels, indicating a need for enhanced regional coordination.
- (2)
- Spatial Pattern: A distinct “dual-core” structure was identified, with Chongqing and Chengdu consistently classified as high-resilience areas, demonstrating strong polarization and radiation effects. Cities such as Mianyang, Deyang, and Nanchong were categorized at medium levels, while Ziyang, Meishan, Neijiang, and Guang’an persistently exhibited low resilience, highlighting pronounced regional development imbalances. The spatial structure remained generally stable before and after the pandemic, though fluctuations were observed in subsystems of some cities.
- (3)
- Subsystem Comparison Pre- and Post-Pandemic: Resilience: A pattern of “one superior, multiple weak” was observed, with Chongqing averaging 0.915, Chengdu at 0.467, and most other cities below 0.15. Recovery: Chongqing maintained extremely high stability (average 0.961), while Chengdu steadily improved to 0.669. However, recovery capabilities in other cities were generally insufficient, mostly below 0.14. Innovation: A “dual-core dominance” pattern was evident, with Chongqing and Chengdu averaging 0.905 and 0.859, respectively, while other cities mostly averaged below 0.12, indicating severe inadequacy in innovation momentum.
- (4)
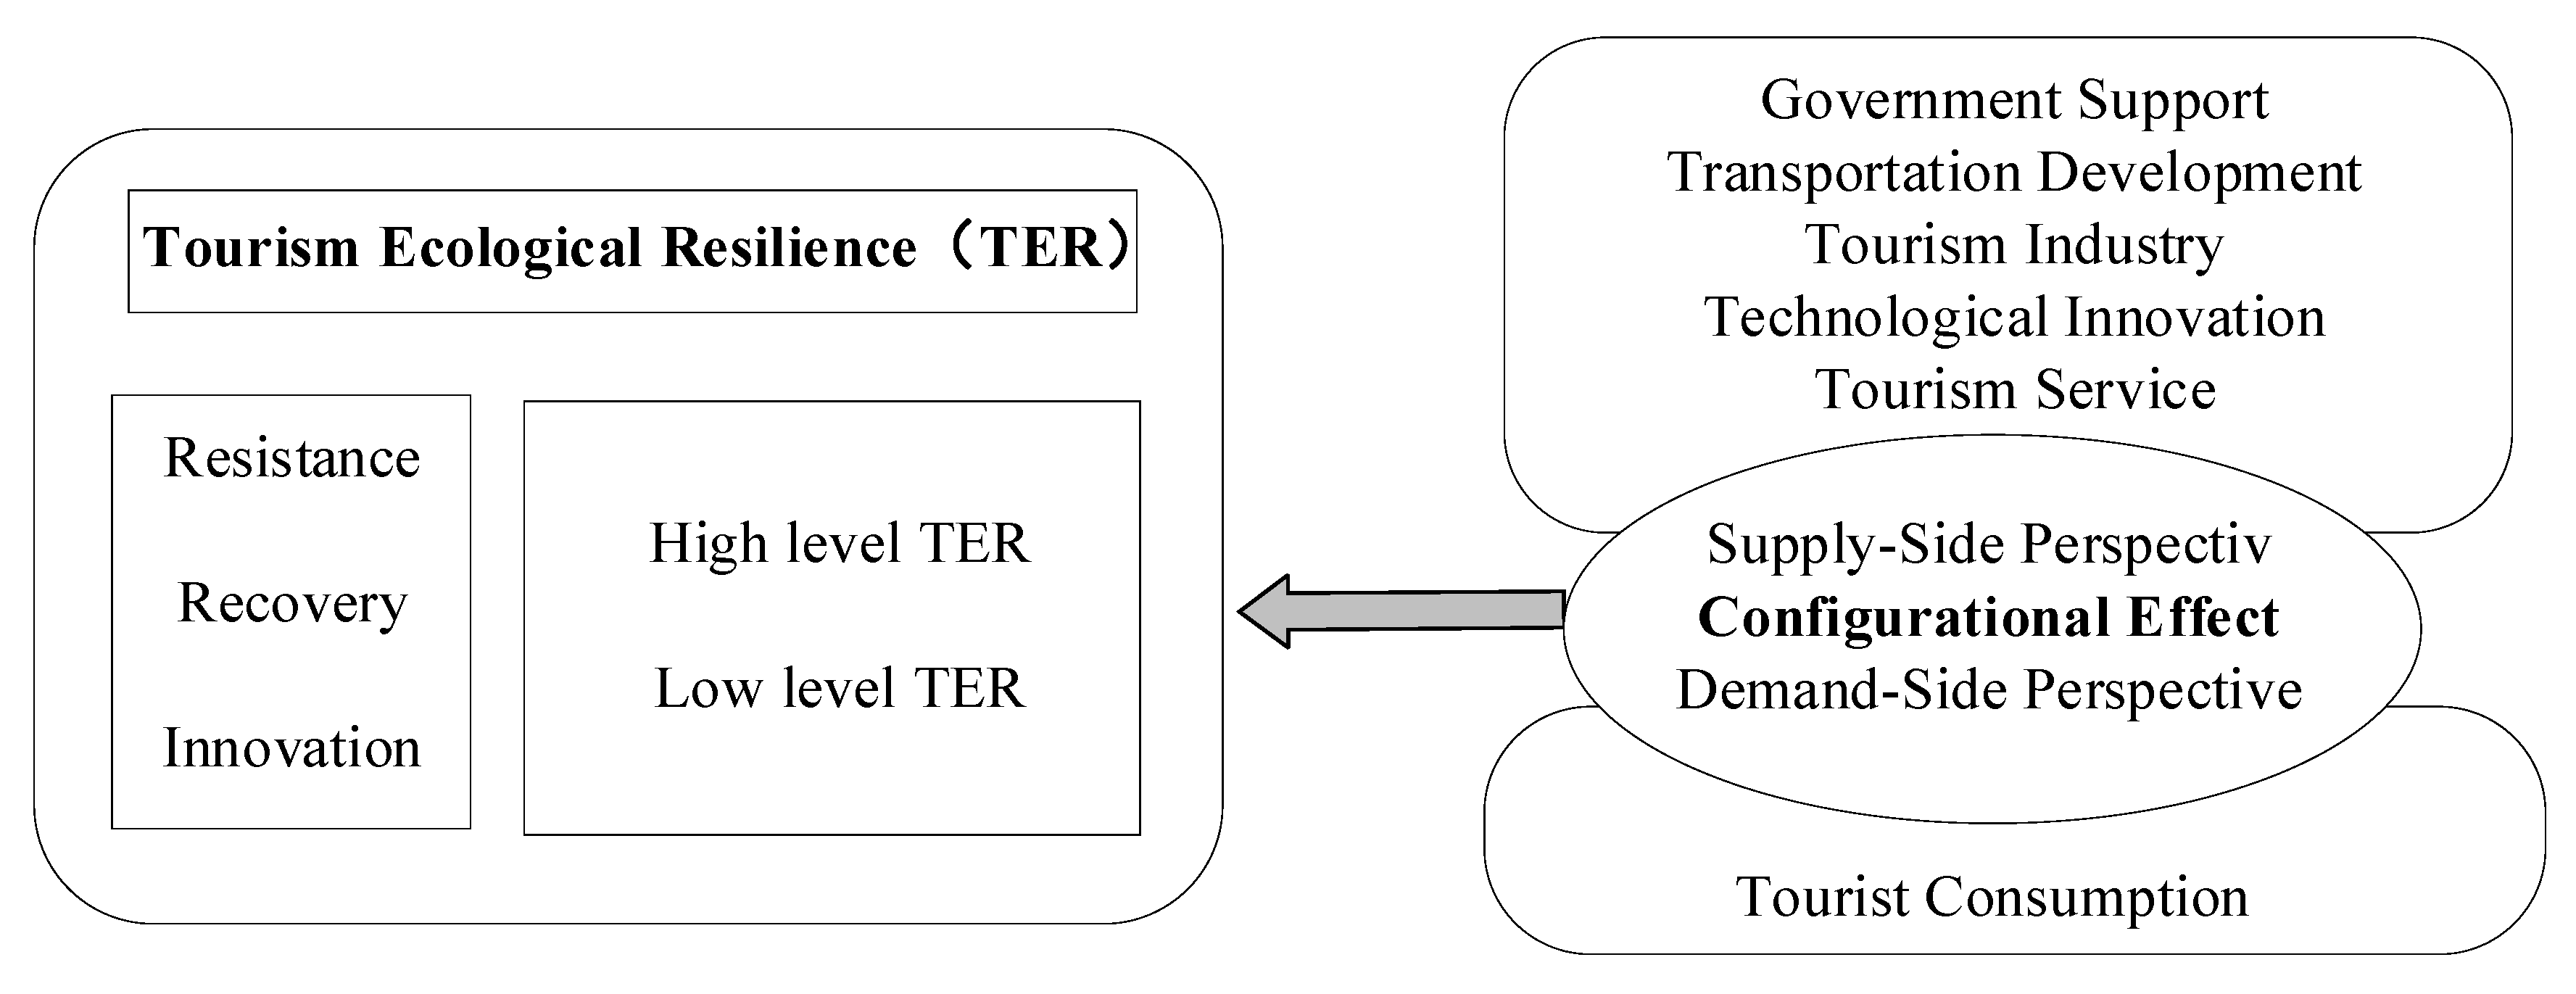
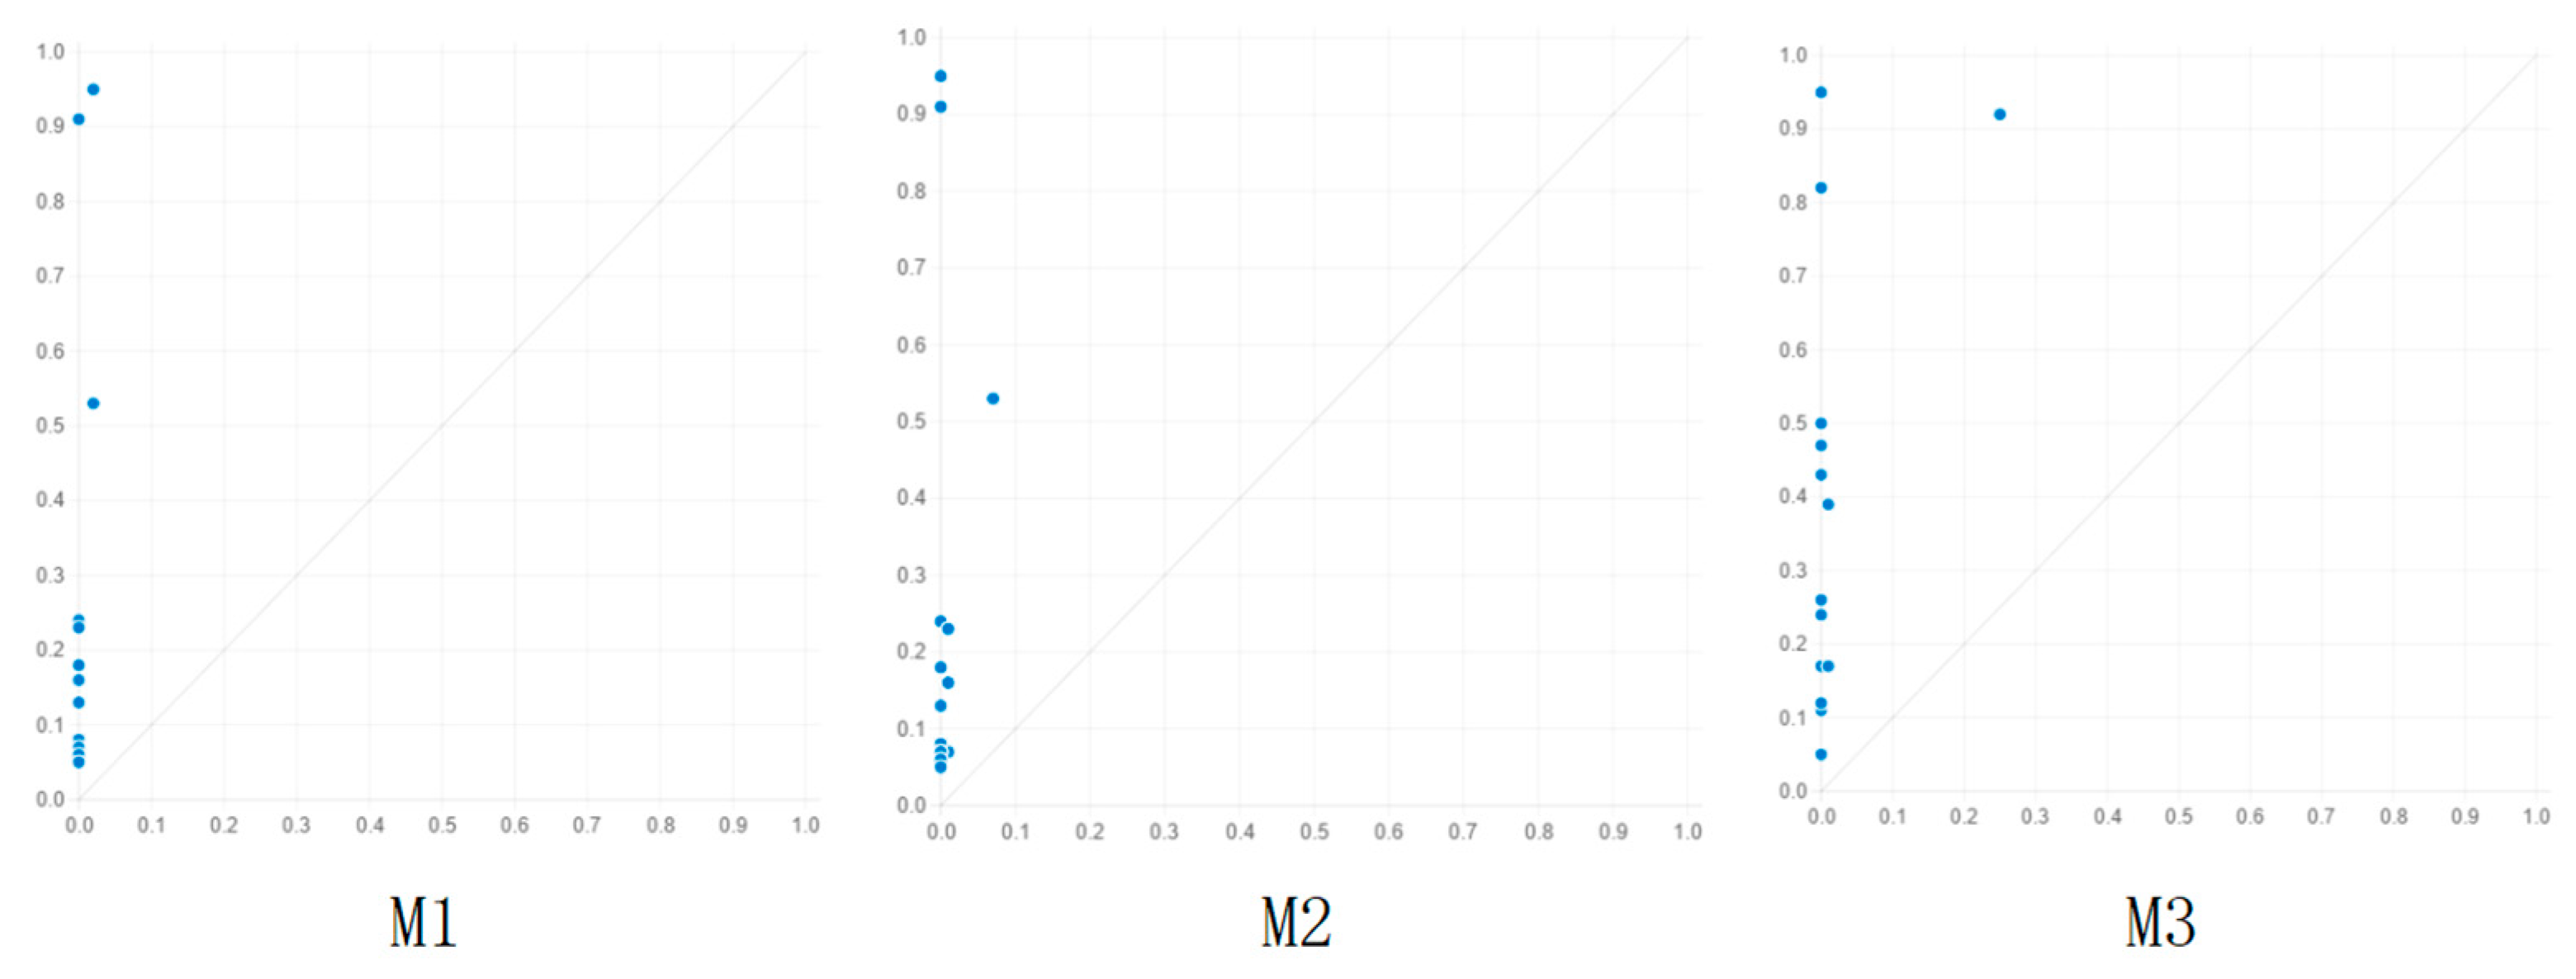
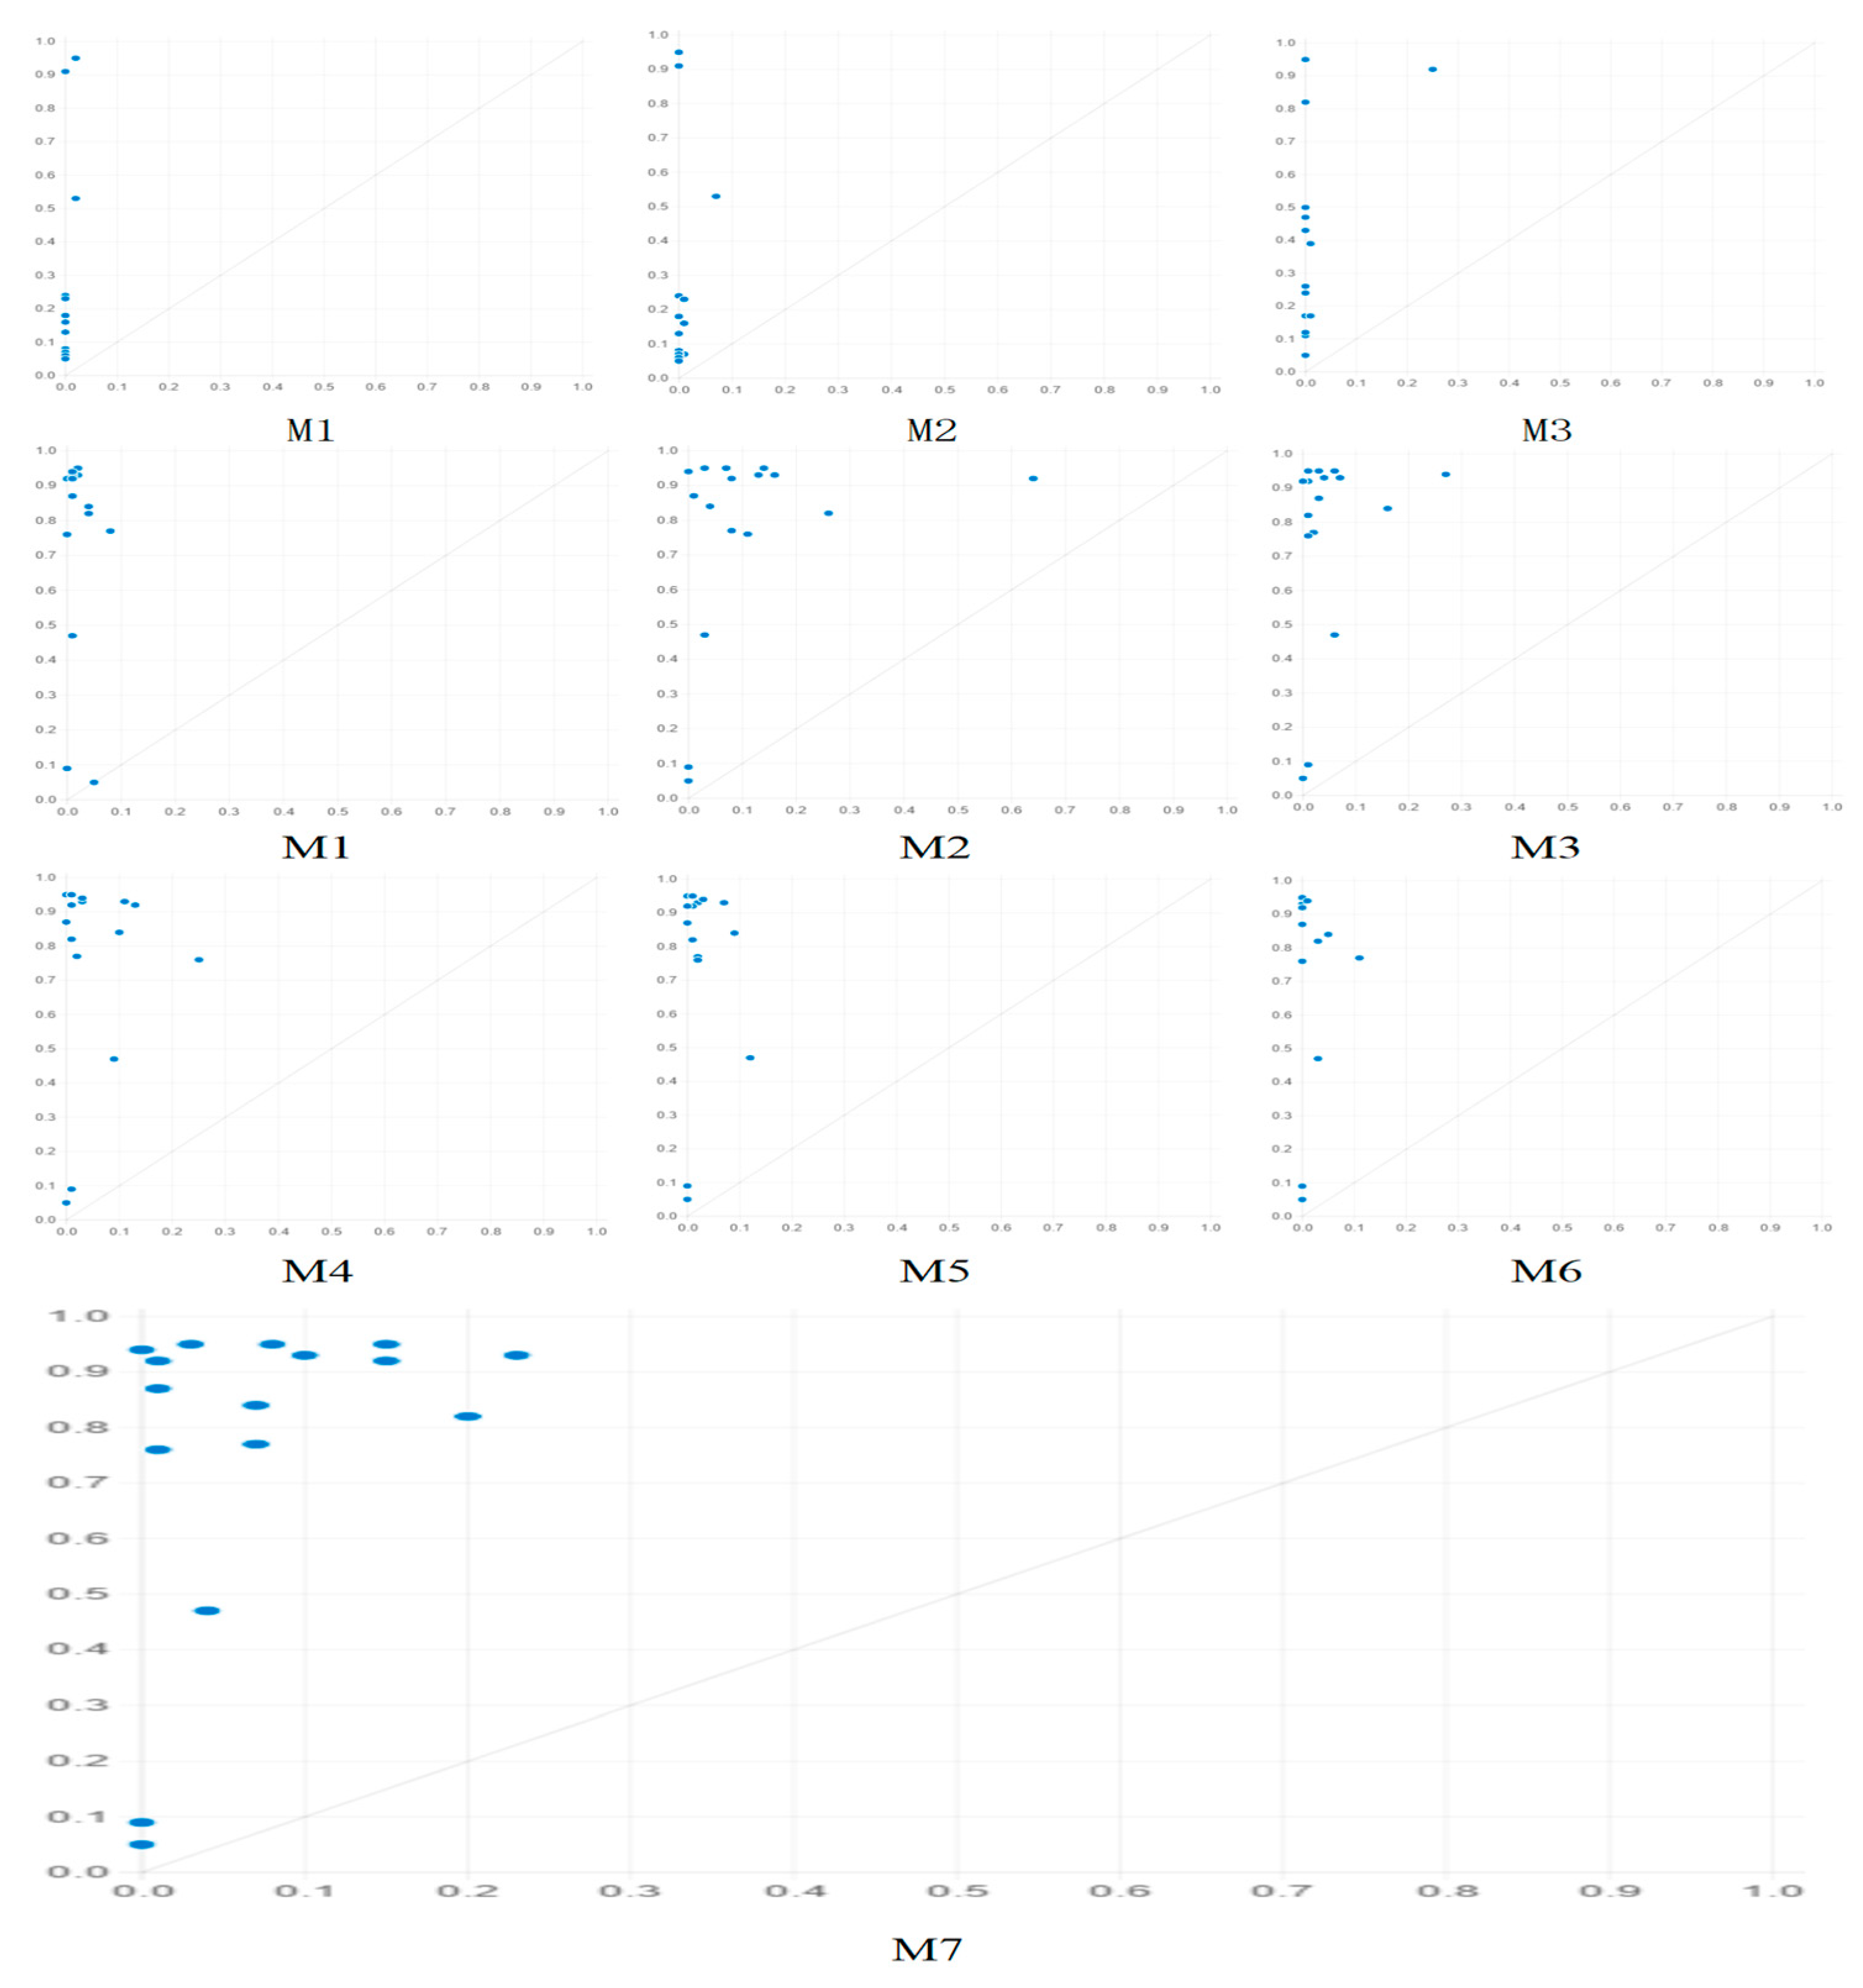
- Influencing Mechanisms: fsQCA analysis revealed that TER is influenced by configurational effects of multiple factors, with no single necessary condition identified. High-resilience pathways relied on the dual-core driving of “technology-service” (technological innovation and tourism services), combined with auxiliary conditions such as transportation, consumption, or government support. In contrast, low resilience stemmed from multiple systemic deficiencies, including lack of government support, underdeveloped transportation, and insufficient technological innovation. The causal mechanisms exhibited significant asymmetry, indicating that pathways to high and low resilience are not simply opposites.
6.2. Limitations and Suggestions
Author Contributions
Funding
Data Availability Statement
Conflicts of Interest
Abbreviations
| TER | Tourism ecological resilience |
| CCEC | Chengdu-Chongqing Economic Circle |
| GOV | Government support |
| TRAN | Transportation development |
| INDUS | Tourism industry |
| TECH | Technological innovation |
| SER | Tourism service |
| CONS | Tourist consumption |
References
- Andrades, L.; Dimanche, F. Destination competitiveness and tourism development in Russia: Issues and challenges. Tour. Manag. 2017, 62, 360–376. [Google Scholar] [CrossRef]
- Bampatsou, C.; Halkos, G. Economic growth, efficiency and environmental elasticity for the G7 countries. Energy Policy 2019, 130, 355–360. [Google Scholar] [CrossRef]
- Goodrich, J.N. September 11, 2001 attacks on America: A record of the immediate impacts and reactions in the USA travel and tourism industry. Tour. Manag. 2002, 23, 573–580. [Google Scholar] [CrossRef]
- Baker, B.A. Tourism and the Health Effects of Infectious Diseases: Are There Potential Risks for Tourists? IJSSTH 2015, 12, 3. [Google Scholar]
- World Tourism Organization (UNWTO). 2020: Worst Year in Tourism History with 1 Billion Fewer International Arrivals. UNWTO. 28 January 2021. Available online: https://www.unwto.org/news/2020-worst-year-in-tourism-history-with-1-billion-fewer-international-arrivals (accessed on 20 November 2024).
- Kytzia, S.; Walz, A.; Wegmann, M. How can tourism use land more efficiently? A model-based approach to land-use efficiency for tourist destinations. Tour. Manag. 2011, 32, 629–640. [Google Scholar] [CrossRef]
- Gössling, S.; Peeters, P.; Ceron, J.P.; Dubois, G.; Patterson, T.; Richardson, R.B. The eco-efficiency of tourism. Ecol. Econ. 2005, 54, 417–434. [Google Scholar] [CrossRef]
- Pásková, M.; Wall, G.; Zejda, D.; Zelenka, J. Tourism carrying capacity reconceptualization: Modelling and management of destinations. J. Destin. Mark. Manag. 2021, 21, 100638. [Google Scholar] [CrossRef]
- Leka, A.; Lagarias, A.; Panagiotopoulou, M.; Stratigea, A. Development of a Tourism Carrying Capacity Index (TCCI) for sustainable management of coastal areas in Mediterranean islands–Case study Naxos, Greece. Ocean Coast. Manag. 2022, 216, 105978. [Google Scholar] [CrossRef]
- Ruan, W.; Li, Y.; Zhang, S.; Liu, C.H. Evaluation and drive mechanism of tourism ecological security based on the DPSIR-DEA model. Tour. Manag. 2019, 75, 609–625. [Google Scholar] [CrossRef]
- Xiaobin, M.; Biao, S.; Guolin, H.; Xing, Z.; Li, L. Evaluation and spatial effects of tourism ecological security in the Yangtze River Delta. Ecol. Indic. 2021, 131, 108190. [Google Scholar] [CrossRef]
- Tang, Z. An integrated approach to evaluating the coupling coordination between tourism and the environment. Tour. Manag. 2015, 46, 11–19. [Google Scholar] [CrossRef]
- Fei, J.; Lin, Y.; Jiang, Q.; Jiang, K.; Li, P.; Ye, G. Spatiotemporal coupling coordination measurement on islands’ economy-environment-tourism system. Ocean Coast. Manag. 2021, 212, 105793. [Google Scholar]
- Yang, D.; Xie, S.; Sun, J.; Qiao, H.; Feng, J.; Xie, X. Evolution of Ecological Environment Quality in Metropolitan Suburbs and Its Interaction with Tourism Development: The Case of Huangpi District, Wuhan City. Land 2025, 14, 1032. [Google Scholar] [CrossRef]
- Shi, L.; Zhao, H.; Li, Y.; Ma, H.; Yang, S.; Wang, H. Evaluation of Shangri-La County’s tourism resources and ecotourism carrying capacity. Int. J. Sustain. Dev. World Ecol. 2015, 22, 103–109. [Google Scholar] [CrossRef]
- Hunt, L.M.; Sutton, S.G.; Arlinghaus, R. Illustrating the critical role of human dimensions research for understanding and managing recreational fisheries within a social-ecological system framework. Fish. Manag. Ecol. 2013, 20, 111–124. [Google Scholar]
- Wang, J.; Huang, X.; Gong, Z.; Cao, K. Dynamic assessment of tourism carrying capacity and its impacts on tourism economic growth in urban tourism destinations in China. J. Destin. Mark. Manag. 2020, 15, 100383. [Google Scholar] [CrossRef]
- Zhu, K.; Zhou, Q.; Cheng, Y.; Zhang, Y.; Li, T.; Yan, X.; Alimov, A.; Farmanov, E.; Dávid, L.D. Regional sustainability: Pressures and responses of tourism economy and ecological environment in the Yangtze River basin, China. Front. Ecol. Evol. 2023, 11, 1148868. [Google Scholar] [CrossRef]
- Tang, C.; Wu, X.; Zheng, Q.; Lyu, N. Ecological security evaluations of the tourism industry in ecological conservation development areas: A case study of Beijing’s ECDA. J. Clean. Prod. 2018, 197, 999–1010. [Google Scholar] [CrossRef]
- Liu, T.; Guo, W. Interaction Between Ecological Resilience and Tourism Efficiency: A Bidirectional Dynamic Analysis of the Beijing-Tianjin-Hebei Region. J. Qual. Assur. Hosp. Tour. 2025, 1–21. [Google Scholar] [CrossRef]
- Zhang, J.; Sui, Y. Theoretical research on sustainable ecological environment based on the concept of green tourism consumption. Int. J. Environ. Technol. Manag. 2020, 23, 83–90. [Google Scholar] [CrossRef]
- Fu, J.; Zhang, H. Study on the evolutionary characteristics of the spatial association network of tourism eco-efficiency and its formation effect in China. J. Environ. Manag. 2025, 379, 124706. [Google Scholar] [CrossRef]
- Yaoyu, Y.; Youyin, Z.; Lei, J.; Haibin, X. Assessing ecological efficiency, spatial spillovers, and configurational drivers of recreational fisheries in the United States. Ocean Coast. Manag. 2025, 269, 107803. [Google Scholar] [CrossRef]
- Li, Y.; Zhang, Y. Spatial-temporal evolution and influencing factors of tourism eco-efficiency in China’s Beijing-Tianjin-Hebei region. Front. Environ. Sci. 2022, 10, 1067835. [Google Scholar] [CrossRef]
- Ding, C.; Gao, X.; Xie, Z. Analysing the differential impact of the COVID-19 pandemic on the resilience of the tourism economy: A case study of the Chengdu-Chongqing urban agglomeration in China. Int. J. Disaster Risk Reduct. 2024, 102, 104255. [Google Scholar] [CrossRef]
- Fang, Y.; Huang, J.; Huang, Z.; Li, Y. Tourism economic resilience and its influence factors in China’s three major urban agglomerations based on threshold effect. Palgrave Communications 2025, 12, 1–10. [Google Scholar]
- Lu, X.; Zhu, J.; Zhou, M.; Zhang, Y. Is digital economy the driving force for improving the tourism economic resilience? Evidence from China. Environ. Dev. Sustain. 2024, 1–38. [Google Scholar] [CrossRef]
- Ling, H.; Qiu, X. Asymmetric modeling of regional tourism economic disparity in China. PLoS ONE 2024, 19, e0299459. [Google Scholar]
- Ragin, C.C. Fuzzy-Set Social Science; University of Chicago Press: Chicago, IL, USA, 2000. [Google Scholar]
- Holling, C.S. Resilience and Stability of Ecological Systems; International Institute for Applied Systems Analysis Laxenburg: Laxenburg, Austria, 1973. [Google Scholar]
- Pike, A.; Dawley, S.; Tomaney, J. Resilience, adaptation and adaptability. Camb. J. Reg. Econ. Soc. 2010, 3, 59–70. [Google Scholar] [CrossRef]
- Zhang, P.; Yu, H.; Xu, L.; Guo, W.; Shen, M. Synergistic relationship or not? Understanding the resilience and efficiency of the tourism economy: Evidence from Hainan Province, China. Environ. Dev. Sustain. 2024, 26, 3793–3817. [Google Scholar]
- Yang, Y.; Xie, A.; Cheng, K. Research on Spatio-Temporal Evolution Characteristics and Driving Factors of Tourism Destination Environmental System Resilience in Yangtze River Economic Belt. Pol. J. Environ. Stud. 2024, 33, 5429–5441. [Google Scholar] [CrossRef]
- Bui, T.T.B.; Ngo, T.P.Q. Factors impacting on tourism resilience during the COVID-19 pandemic: An empirical study from Vietnam. J. Asian Financ. Econ. Bus. 2022, 9, 213–218. [Google Scholar]
- Yang, X.; Zhang, D.; Liu, L.; Niu, J.; Zhang, X.; Wang, X. Development trajectory for the temporal and spatial evolution of the resilience of regional tourism environmental systems in 14 cities of Gansu Province, China. Environ. Sci. Pollut. Res. 2021, 28, 65094–65115. [Google Scholar] [CrossRef]
- Tóth, Z.; Henneberg, S.C.; Naudé, P. Addressing the ‘qualitative’ in fuzzy set qualitative comparative analysis: The generic membership evaluation template. Ind. Mark. Manag. 2017, 63, 192–204. [Google Scholar] [CrossRef]
- Fiss, P.C. Building better causal theories: A fuzzy set approach to typologies in organization research. Acad. Manag. J. 2011, 54, 393–420. [Google Scholar] [CrossRef]
- Ordanini, A.; Parasuraman, A.; Rubera, G. When the recipe is more important than the ingredients: A qualitative comparative analysis (QCA) of service innovation configurations. J. Serv. Res. 2014, 17, 134–149. [Google Scholar] [CrossRef]
- Pappas, I.O.; Woodside, A.G. Fuzzy-set Qualitative Comparative Analysis (fsQCA): Guidelines for research practice in Information Systems and marketing. Int. J. Inf. Manag. 2021, 58, 102310. [Google Scholar] [CrossRef]
- Olya, H.G.; Mehran, J. Modelling tourism expenditure using complexity theory. J. Bus. Res. 2017, 75, 147–158. [Google Scholar] [CrossRef]
- Zschoch, M.A. Configurational Comparative Methods: Qualitative Comparative Analysis (QCA) and Related Techniques. Can. J. Political Sci. 2011, 44, 743–746. [Google Scholar] [CrossRef]
- Odell, P.R. Book review: Regional development policy: A case study of Venezuela by J. Friedmann. Urban Studies 1967, 4, 309–311. [Google Scholar] [CrossRef]
- Krugman, P. Increasing returns and economic geography. J. Political Econ. 1991, 99, 483–499. [Google Scholar] [CrossRef]
- Brouder, P.; Eriksson, R.H. Tourism evolution: On the synergies of tourism studies and evolutionary economic geography. Ann. Tour. Res. 2013, 43, 370–389. [Google Scholar] [CrossRef]
- Sharma, G.D.; Thomas, A.; Paul, J. Reviving tourism industry post-COVID-19: A resilience-based framework. Tour. Manag. Perspect. 2021, 37, 100786. [Google Scholar] [CrossRef] [PubMed]
- Cheshmehzangi, A.; Dawodu, A.; Sharifi, A. Sustainable Urbanism in China; Routledge: Abingdon, UK, 2021. [Google Scholar]


| Criterion Layer | Indicator Layer | Weight |
|---|---|---|
| Resistance | GDP per capita (CNY) | 0.0240 (+) |
| Tourism revenue as % of GDP | 0.0259 (+) | |
| Urbanization rate (%) | 0.0217 (+) | |
| Number of star-rated hotels | 0.1408 (+) | |
| Domestic tourist arrivals (10,000 person-times) | 0.1229 (+) | |
| Tourism traffic pressure (%) | 0.0041 (−) | |
| Recovery | Per capita tourism expenditure (CNY) | 0.0071 (+) |
| Road area per capita (m2) | 0.0149 (+) | |
| Green space per capita (m2) | 0.0180 (+) | |
| Green coverage rate in built-up areas (%) | 0.0136 (+) | |
| Number of medical beds | 0.1256 (+) | |
| Innovation | Fiscal expenditure as % of GDP | 0.0334 (+) |
| Environmental investment as % of GDP | 0.0407 (+) | |
| Internal R&D expenditure (10,000 CNY) | 0.2091 (+) | |
| Number of college students enrolled | 0.1824 (+) | |
| Sewage treatment rate (%) | 0.0250 (+) |
| City | 2013 | 2014 | 2015 | 2016 | 2017 | 2018 | 2019 | 2020 | 2021 | 2022 | 2023 | MV |
|---|---|---|---|---|---|---|---|---|---|---|---|---|
| Chongqing | 0.479 | 0.499 | 0.507 | 0.576 | 0.665 | 0.684 | 0.697 | 0.676 | 0.740 | 0.684 | 0.796 | 0.637 |
| Chengdu | 0.367 | 0.393 | 0.396 | 0.440 | 0.410 | 0.452 | 0.550 | 0.550 | 0.507 | 0.568 | 0.659 | 0.481 |
| Zigong | 0.067 | 0.069 | 0.067 | 0.064 | 0.075 | 0.086 | 0.071 | 0.069 | 0.053 | 0.067 | 0.089 | 0.071 |
| Luzhou | 0.072 | 0.079 | 0.084 | 0.081 | 0.097 | 0.096 | 0.092 | 0.097 | 0.086 | 0.123 | 0.113 | 0.093 |
| Deyang | 0.077 | 0.076 | 0.075 | 0.081 | 0.095 | 0.105 | 0.100 | 0.103 | 0.085 | 0.101 | 0.112 | 0.092 |
| Mianyang | 0.142 | 0.126 | 0.169 | 0.130 | 0.140 | 0.146 | 0.163 | 0.171 | 0.135 | 0.182 | 0.191 | 0.154 |
| Suining | 0.068 | 0.081 | 0.079 | 0.083 | 0.105 | 0.088 | 0.084 | 0.091 | 0.066 | 0.079 | 0.070 | 0.081 |
| Neijiang | 0.056 | 0.061 | 0.058 | 0.055 | 0.060 | 0.069 | 0.067 | 0.082 | 0.055 | 0.079 | 0.095 | 0.067 |
| Leshan | 0.085 | 0.094 | 0.094 | 0.091 | 0.097 | 0.102 | 0.106 | 0.094 | 0.066 | 0.081 | 0.118 | 0.093 |
| Nanchong | 0.070 | 0.092 | 0.092 | 0.087 | 0.103 | 0.103 | 0.097 | 0.121 | 0.086 | 0.108 | 0.121 | 0.098 |
| Meishan | 0.062 | 0.072 | 0.073 | 0.065 | 0.079 | 0.075 | 0.067 | 0.078 | 0.055 | 0.065 | 0.071 | 0.069 |
| Yibin | 0.069 | 0.067 | 0.076 | 0.076 | 0.092 | 0.094 | 0.092 | 0.104 | 0.075 | 0.114 | 0.105 | 0.088 |
| Guang’an | 0.047 | 0.075 | 0.075 | 0.070 | 0.101 | 0.095 | 0.067 | 0.063 | 0.043 | 0.067 | 0.059 | 0.069 |
| Dazhou | 0.039 | 0.049 | 0.053 | 0.050 | 0.048 | 0.058 | 0.060 | 0.071 | 0.052 | 0.073 | 0.074 | 0.057 |
| Ya’an | 0.107 | 0.127 | 0.137 | 0.078 | 0.100 | 0.098 | 0.089 | 0.110 | 0.093 | 0.125 | 0.100 | 0.106 |
| Ziyang | 0.078 | 0.091 | 0.097 | 0.054 | 0.063 | 0.066 | 0.051 | 0.063 | 0.043 | 0.081 | 0.052 | 0.067 |
| GOV | TRAN | INDUS | TECH | SER | CONS | RESI | |
|---|---|---|---|---|---|---|---|
| 1 | 0.17 | 0.95 | 0.05 | 0.51 | 0.86 | 0.11 | 0.95 |
| 2 | 0.92 | 0.7 | 0.05 | 0.53 | 0.95 | 0.8 | 0.91 |
| 3 | 0.12 | 0.06 | 0.08 | 0.22 | 0.23 | 0.41 | 0.05 |
| 4 | 0.24 | 0.51 | 0.74 | 0.31 | 0.13 | 0.65 | 0.23 |
| 5 | 0.5 | 0.11 | 0.05 | 0.5 | 0.61 | 0.23 | 0.13 |
| 6 | 0.39 | 0.43 | 0.86 | 0.56 | 0.56 | 0.71 | 0.53 |
| 7 | 0.43 | 0.08 | 0.37 | 0.15 | 0.21 | 0.42 | 0.07 |
| 8 | 0.47 | 0.12 | 0.82 | 0.16 | 0.63 | 0.29 | 0.07 |
| 9 | 0.95 | 0.12 | 0.54 | 0.13 | 0.54 | 0.58 | 0.08 |
| 10 | 0.17 | 0.41 | 0.51 | 0.14 | 0.55 | 0.69 | 0.16 |
| 11 | 0.17 | 0.05 | 0.19 | 0.45 | 0.2 | 0.08 | 0.05 |
| 12 | 0.26 | 0.16 | 0.93 | 0.36 | 0.05 | 0.45 | 0.18 |
| 13 | 0.05 | 0.05 | 0.29 | 0.06 | 0.09 | 0.41 | 0.05 |
| 14 | 0.11 | 0.42 | 0.11 | 0.07 | 0.6 | 0.95 | 0.06 |
| 15 | 0.95 | 0.05 | 0.94 | 0.2 | 0.52 | 0.67 | 0.24 |
| 16 | 0.82 | 0.06 | 0.95 | 0.05 | 0.21 | 0.05 | 0.08 |
| Model: (TRAN, INDUS, TECH, SER, CONS) | ||||||||
|---|---|---|---|---|---|---|---|---|
| Conditional Variables | Number | RESI | Raw Consist. | PRI Consist. | ||||
| TRAN | INDUS | TECH | SER | CONS | ||||
| 0.00 | 0.00 | 0.00 | 0.00 | 0.00 | 4.00 | 0.00 | 0.31 | 0.00 |
| 0.00 | 1.00 | 0.00 | 1.00 | 1.00 | 3.00 | 0.00 | 0.51 | 0.00 |
| 0.00 | 1.00 | 0.00 | 0.00 | 0.00 | 2.00 | 0.00 | 0.39 | 0.00 |
| 0.00 | 1.00 | 0.00 | 1.00 | 0.00 | 1.00 | 0.00 | 0.48 | 0.00 |
| 1.00 | 0.00 | 1.00 | 1.00 | 0.00 | 1.00 | 1.00 | 0.94 | 0.84 |
| 1.00 | 1.00 | 0.00 | 0.00 | 1.00 | 1.00 | 0.00 | 0.71 | 0.00 |
| 0.00 | 0.00 | 0.00 | 1.00 | 1.00 | 1.00 | 0.00 | 0.45 | 0.10 |
| 1.00 | 0.00 | 1.00 | 1.00 | 1.00 | 1.00 | 1.00 | 0.94 | 0.81 |
| Conditional Variables | High Level TER | Low Level TER | |||
|---|---|---|---|---|---|
| Consistency | Coverage | Consistency | Coverage | ||
| Government Support | GOV | 0.760 | 0.435 | 0.456 | 0.826 |
| ~GOV | 0.695 | 0.288 | 0.688 | 0.901 | |
| Transportation Development | TRAN | 0.854 | 0.766 | 0.228 | 0.647 |
| ~TRAN | 0.607 | 0.199 | 0.918 | 0.952 | |
| Tourism Industry | INDUS | 0.521 | 0.267 | 0.557 | 0.905 |
| ~INDUS | 0.815 | 0.367 | 0.549 | 0.784 | |
| Technological Innovation | TECH | 0.763 | 0.666 | 0.280 | 0.775 |
| ~TECH | 0.742 | 0.246 | 0.879 | 0.922 | |
| Tourism Service | SER | 0.917 | 0.507 | 0.426 | 0.746 |
| ~SER | 0.542 | 0.230 | 0.719 | 0.965 | |
| Tourist Consumption | CONS | 0.745 | 0.381 | 0.533 | 0.864 |
| ~CONS | 0.734 | 0.332 | 0.618 | 0.885 | |
| Causal Model of High-Level TER | Raw Coverage | Unique Coverage | Consistency |
|---|---|---|---|
| Model: RESI = f (GOV, TRAN, INDUS, TECH, SER, CONS) | |||
| M1: ~GOV*TRAN*~INDUS*TECH*SER*~CONS | 0.430 | 0.104 | 0.959 |
| M2: ~GOV*~TRAN*INDUS*TECH*SER*CONS | 0.391 | 0.102 | 0.843 |
| M3:GOV*TRAN*~INDUS*TECH*SER*CONS | 0.453 | 0.125 | 0.935 |
| Solution coverage: 0.659 | |||
| Solution consistency: 0.888 | |||
| Causal Model of Low-Level TER | Raw Coverage | Unique Coverage | Consistency |
|---|---|---|---|
| Model: ~RESI = f (GOV, TRAN, INDUS, TECH, SER, CONS) | |||
| M1: ~GOV*~TRAN*~TECH*~SER*~CONS | 0.410 | 0.113 | 1.000 |
| M2: ~TRAN*INDUS*~TECH*~SER*~CONS | 0.373 | 0.050 | 1.000 |
| M3: ~GOV*~TRAN*~TECH*SER*CONS | 0.260 | 0.044 | 1.000 |
| M4: ~TRAN*INDUS*~TECH*SER*CONS | 0.267 | 0.025 | 1.000 |
| M5: ~GOV*~TRAN*INDUS*SER*CONS | 0.191 | 0.002 | 0.963 |
| M6:~GOV*TRAN*INDUS*~TECH*~SER*CONS | 0.188 | 0.013 | 1.000 |
| M7: ~GOV*~TRAN*INDUS*~TECH*~CONS | 0.283 | 0.013 | 1.000 |
| Solution frequency: 0.646; Solution consistency: 0.989 | |||
| Configuration | Raw Coverage | Unique Coverage | Consistency |
|---|---|---|---|
| High-Level TER | |||
| M1: ~GOV*TRAN*~INDUS*TECH*SER*~CONS | 0.502 | 0.502 | 0.983 |
| solution coverage: 0.502; solution consistency: 0.983 | |||
| Low-Level TER | |||
| M2: ~GOV*~TRAN*~TECH*SER*CONS | 0.345 | 0.077 | 1.000 |
| M3: ~TRAN*INDUS*~TECH*SER*CONS | 0.317 | 0.029 | 1.000 |
| M4: ~GOV*~TRAN*~INDUS*~TECH*~SER*~CONS | 0.312 | 0.084 | 1.000 |
| M5:GOV*~TRAN*INDUS*~TECH*~SER*~CONS | 0.357 | 0.112 | 1.000 |
| M6: ~GOV*TRAN*INDUS*~TECH*~SER*CONS | 0.264 | 0.038 | 1.000 |
| solution coverage: 0.694; solution consistency: 1 | |||
Disclaimer/Publisher’s Note: The statements, opinions and data contained in all publications are solely those of the individual author(s) and contributor(s) and not of MDPI and/or the editor(s). MDPI and/or the editor(s) disclaim responsibility for any injury to people or property resulting from any ideas, methods, instructions or products referred to in the content. |
© 2025 by the authors. Licensee MDPI, Basel, Switzerland. This article is an open access article distributed under the terms and conditions of the Creative Commons Attribution (CC BY) license (https://creativecommons.org/licenses/by/4.0/).
Share and Cite
Fang, X.; Cheng, L.; Kuang, Q.; Zeng, C. Differences in Tourism Ecological Resilience and Its Asymmetric Driving Mechanisms in the Chengdu-Chongqing Economic Circle, China. Land 2025, 14, 2188. https://doi.org/10.3390/land14112188
Fang X, Cheng L, Kuang Q, Zeng C. Differences in Tourism Ecological Resilience and Its Asymmetric Driving Mechanisms in the Chengdu-Chongqing Economic Circle, China. Land. 2025; 14(11):2188. https://doi.org/10.3390/land14112188
Chicago/Turabian StyleFang, Xinrui, Li Cheng, Qian Kuang, and Chuyi Zeng. 2025. "Differences in Tourism Ecological Resilience and Its Asymmetric Driving Mechanisms in the Chengdu-Chongqing Economic Circle, China" Land 14, no. 11: 2188. https://doi.org/10.3390/land14112188
APA StyleFang, X., Cheng, L., Kuang, Q., & Zeng, C. (2025). Differences in Tourism Ecological Resilience and Its Asymmetric Driving Mechanisms in the Chengdu-Chongqing Economic Circle, China. Land, 14(11), 2188. https://doi.org/10.3390/land14112188


