Effects of Households’ Fertilization Knowledge and Technologies on Over-Fertilization: A Case Study of Grape Growers in Shaanxi, China

1
College of Economics and Management, Northwest A&F University, Yangling 712100, China
2
School of Economics and Management, University of Science & Technology, Beijing 100083, China
*
Author to whom correspondence should be addressed.
Land 2020, 9(9), 321; https://doi.org/10.3390/land9090321
Submission received: 11 August 2020
/
Revised: 5 September 2020
/
Accepted: 9 September 2020
/
Published: 10 September 2020
Abstract
:Over-fertilization has caused serious environmental problems and high agricultural production costs at the household level in China. This study attempts to analyze the effects of grape growers’ fertilization knowledge and technologies on their over-fertilization behavior. Using survey data collected from 235 grape growers planting a particular grape (the “Hutai No. 8” grape) in Shaanxi, the marginal productivity of the chemical fertilizer (CF) as well as the effect of fertilizing knowledge and technologies on households’ over-fertilization behavior were examined, using the loss control production function and examining a two-part model, respectively. The results show that the average marginal productivity of the CF is 0.46 and that more than 75% of the participants were overusing CFs, with the probability and intensity of over-fertilization being lower when households have richer knowledge on how to determine the accurate fertilization time and match fertilizers with nutrient needs. The identification of nutrient deficiency symptoms has no significant effect on the over-fertilization behavior of households. In addition, the adoption of water and fertilizer integration technology (WFIT) can reduce both the probability and intensity of over-fertilization, while the adoption of the soil testing and formulated fertilization technique (STFFT) helps to reduce only the intensity of over-fertilization by households, but does not have a significant impact on the probability of over-fertilization. Therefore, policies aimed at reducing over-fertilization may focus on increasing households’ fertilization knowledge and adopting advanced technologies on fertilizer management.
1. Introduction
At present, China is the largest consumer of chemical fertilizers (CFs) in the world, accounting for about one-third of the world’s total CF consumption. The amount of CF application per sowing area in China far exceeds the optimal application amount and the global average [1,2]. The primary initial purpose of high-intensity CF use in China was to promote agricultural production [1,3]. However, such an activity has brought negative effects on the ecological environment, such as eutrophication and water pollution [4], biodiversity reduction [5], imbalance of soil nutrients and consolidation of soil [6]. There is an urgent need to improve fertilization methods and increase the utilization rate of CFs to promote sustainable agricultural development. As a result, the Ministry of Agriculture of China (MAC) decided to initially establish a scientific fertilization management and technology system by 2020, and gradually control the increased rate of CF use within 1% between 2015 and 2019, reaching zero by 2020 [7].
From 1978 to 2016, the annual application amount of CFs in China increased from 8.84 million tons to 59.84 million tons. The main reasons behind this include the increase in planting area, the adjustment of planting structure and changes in fertilization intensity [8,9]. During the same period, the sowing area of China’s grain crops was generally maintained at 11 × 107 ha, while its proportion to the total sowing area of crops fell from 80.34% to 67.83%. The planting area of horticultural crops increased from 6.04 × 10⁶ ha to 3.81 × 10⁷ ha, with an increase from 4.02% to 22.93% in its proportion to the total sowing area of crops [10,11]. Some studies have shown that the intensity of CF application for crops is roughly stable over the years, with that for the horticultural crops, such as fruits and vegetables, being the highest [2,12]. Although overuse of CFs is common, growers of fruit and vegetable excessively use CFs to a greater extent than growers of grain crops. For example, while the overuse amount of CFs by rice and corn growers are 73–81 kg/ha [13] and 156 kg/ha [14], respectively, apple growers overuse an average of 307.5 kg/ha [15].
Although many studies are concerned about over-fertilization among Chinese households; they are mainly concentrated on the households that grow grain crops, such as maize, wheat and rice [1,3,14,16,17]. Some scholars pay attention to the excessive fertilization behavior of horticultural crop growers, such as citrus [18], peach [19] and tea [20]. Some studies have found that the factors influencing households’ over-fertilization include gender, education, risk aversion of the householder [14,21], the use of organic fertilizer, participation in training [17,22,23,24], fertilizer prices [16], technologies and knowledge of fertilization [1], non-farm employment and the tendency to accept suggestions from fertilizer sellers [25]. Schultz [26] proposed in Transforming Traditional Agriculture that raising smallholder farmers’ skills and knowledge level is one of the main ways to transform traditional agriculture.
Indeed, some scholars have found that the lack of scientific fertilization knowledge and technologies is one of the main reasons leading to over-fertilization from a household’s perspective [1,22,27]. Households lacking agricultural knowledge could hardly distinguish different kinds of CFs, leading to the application of the CFs without knowing the details of the formulas and their specific advantages [16]. Instead, households tend to rely on their own experience and habits when fertilizing [15], which include the notions that higher-priced CFs are of better quality [16] and that the more CFs are applied the higher the yield [22]. However, it should be noted that the effect of an increase in fertilization has “diminishing marginal benefits” [28].
In order to guide households to conduct scientific fertilization, the Chinese government has promoted soil testing and formulated fertilization techniques (STFFT), as well as water and fertilizer integration technology (WFIT). Applying STFFT helps households understand the risks of over-fertilization [29] and guides them to follow an appropriate structure and reasonable intensity of CF application [3]. Compared to STFFT, WFIT is a relatively new agricultural technology that integrates irrigation and fertilization to meet the crop’s needs for water and nutrients in a timely and appropriate manner. The adoption of WFIT by households is found to have significantly improved the utilization efficiency of CFs [17,30].
The Huyi District (formerly known as Hu County) belongs to Xi’an, Shaanxi Province, which is located in the northwestern region of China. It borders with the Qinling Mountains to the south and the Weihe River to the north. This region is rich in light, heat and water resources, which makes grape growing one of the most distinctive and advantageous industries. The Huyi District has a long history of grape planting, with a reputation of being the “Hometown of China’s Hutai Grapes”, as it mainly grows a particular variety, which is Hutai grapes, including Hutai No. 8, Xiahei, Xinghuawang, Sunshine Rose, etc., among which “Hutai No. 8” is the most outstanding and renowned throughout the country. “Hutai No. 8” generally becomes mature in three years and enters the full fruit period in the fourth year, with production of over 30,000 kg per ha. This study chose the growers of “Hutai No. 8” grape in the full fruit period to investigate the effect of fertilization knowledge and technologies on the over-fertilization behavior for two reasons. First, the Huyi District is the original and main planting region of “Hutai No. 8”, which has been cultivated in this region since 1996. The planting area of “Hutai No. 8” reached 64,500 mu (4300 ha, 1 mu = 1/15 ha) by the end of 2015, accounting for more than 90% of the total grape area and about 12% of the total cultivated area in the region [31]. In addition, there are more than 5000 households whose main sources of income are growing “Hutai No. 8”. Second, “Hu County Grape” was approved as the protection certification of geographical indication products (GIP) by the General Administration of Quality Supervision, Inspection and Quarantine of China in 2012. “Hu County Grape” refers to the grapes grown in the Huyi District. Although there are many varieties, Hutai No. 8 has the largest planting area. As the quality of GIP must comply with certain regulations, the local government guides and standardizes households’ behavior of fertilization through experts giving lectures, field guidance and knowledge training. Therefore, some of these households have a certain knowledge about fertilization and its related technologies, making them appropriate for investigating the issue of interest to this study.
2. Theoretical Foundation of Households’ Fertilization Behavior
2.1. Perspectives of Optimal Fertilization
“Over-fertilization” refers to when the amount of CF applied exceeds the optimal level, which could be measured from the perspectives of agronomy, eco-environment and economics. The agronomy perspective emphasizes the maximization of agricultural output [16]. For crop production, if the CF is the only variable input, the yield curve is shown in Figure 1. Point A in Figure 1 depicts the input level for maximizing output, which suggests the optimal level of CF input from an agronomy perspective. The optimal application of CFs in agronomy may not be adopted by households due to the high incidental costs required, such as the needs for extra multiple fertilization and labor input [16].
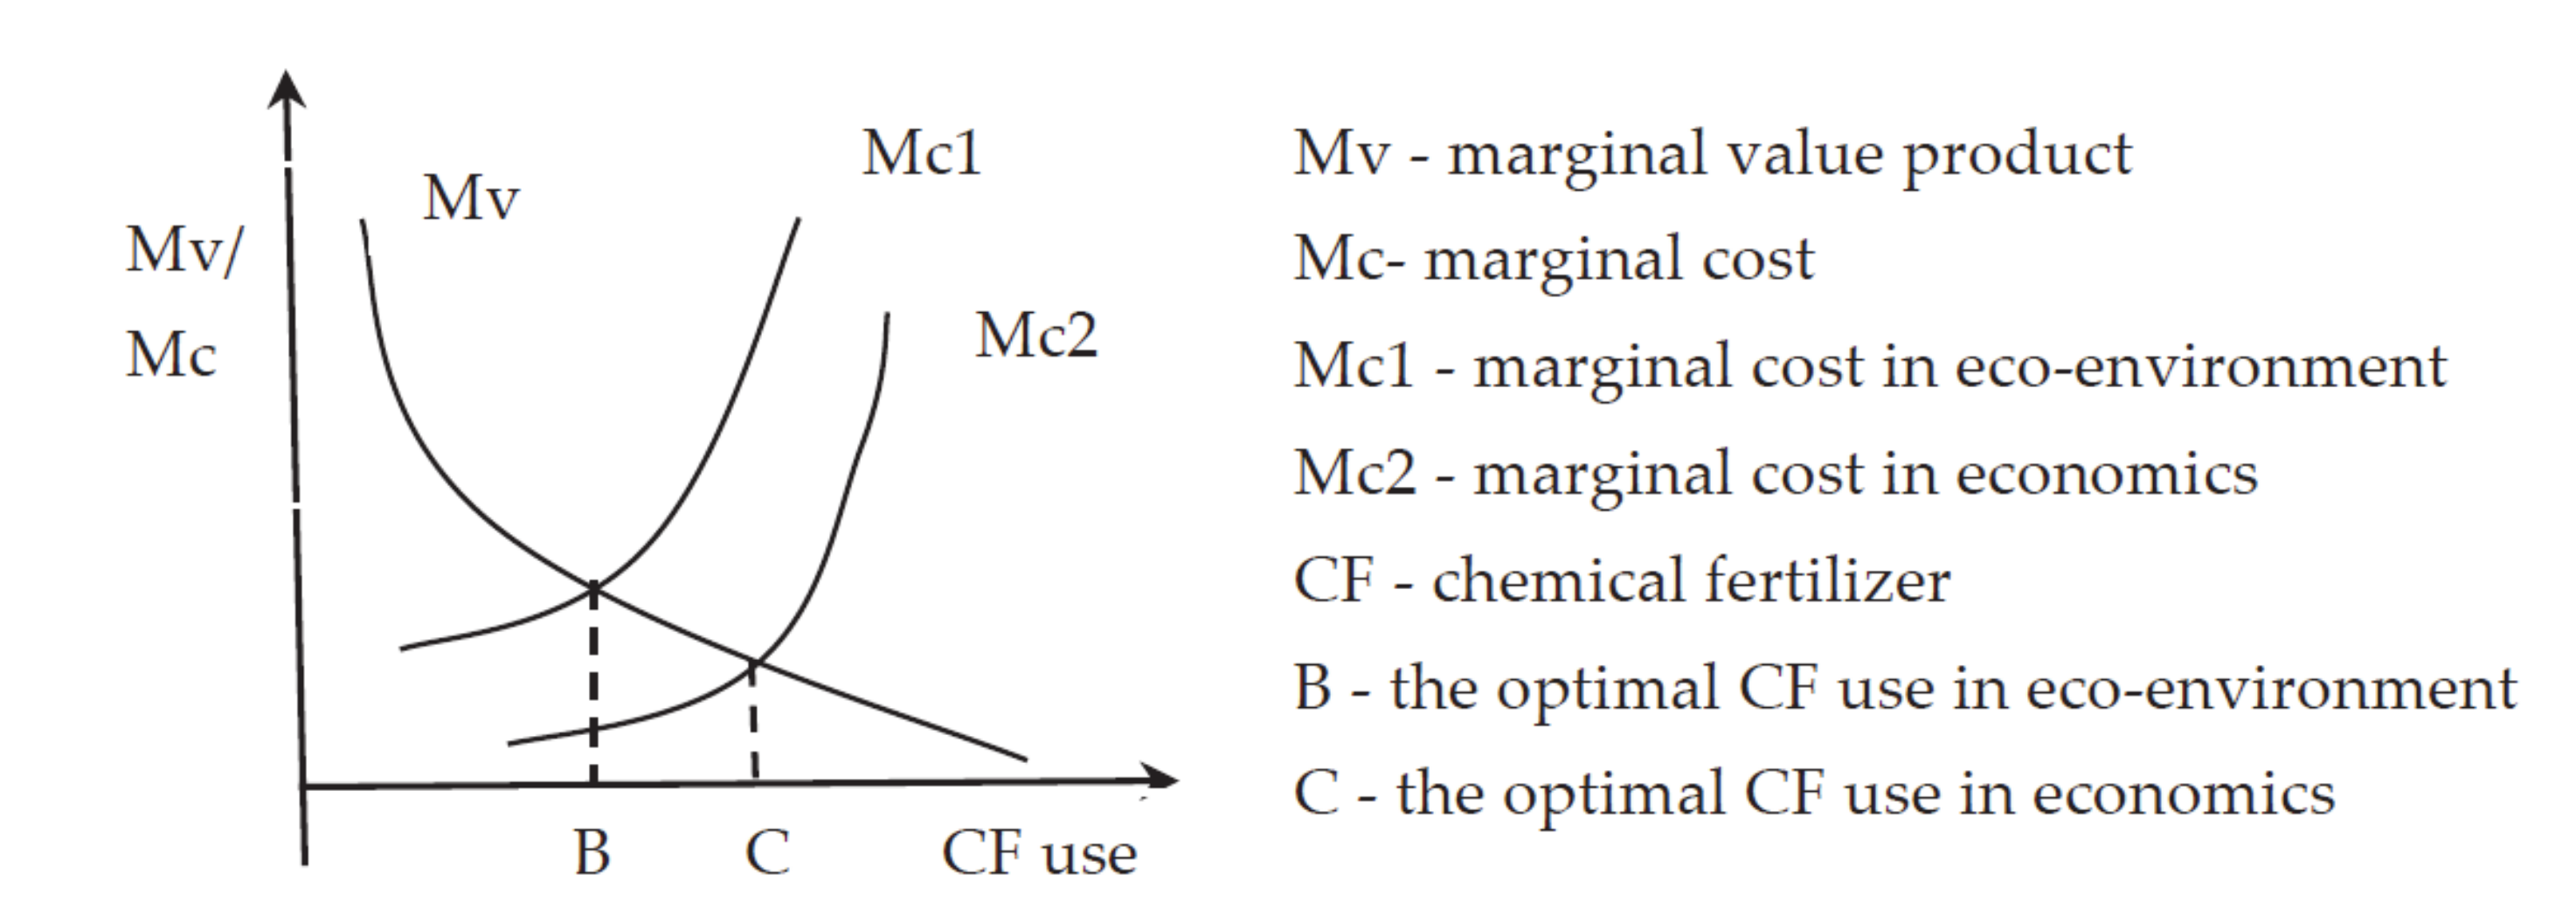
The eco-environment perspective focuses on the maximization of profit, taking consideration of the production cost and the environmental cost caused by the use of CFs [32]. The optimum CF use occurs at the point where the marginal value product (Mv) equals the marginal cost (Mc1), which is noted as Point B in Figure 2 and usually called the social optimal point. The eco-environment fertilization standard implies that the ecological environment consideration has absolute priority, which is not negotiable [16]. Even though the households’ over-fertilization can cause point-source pollution and destroy the ecological environment, they take little responsibility for ecological destruction in China [21]. In this case, the households are unlikely to adopt the optimal fertilization from the eco-environment perspective.
The economics perspective emphasizes the maximization of profits, merely taking into consideration the production cost [14]. When the produce value is high, it is suggested that some environmental value can be abandoned appropriately [16]. Because the negative externality caused by the CF application on the environment is not taken into consideration, the marginal cost line (Mc2) moves down. The optimal CF use is denoted as Point C in Figure 2, which is also known as the private optimal point [33]. Since households are “rational smallholder farmers” [26], whose goal is to pursue maximized profit, it is reasonable to measure the optimal amount of CF application by households from the perspective of economics. In addition, such a perspective is considered appropriate for examining households’ optimal fertilization application by prior studies, such as [14,16,33]. Therefore, this study takes an economics perspective.
2.2. Optimal Fertilization-Related Considerations
Fertilizer management has a marked effect on crop production (agriculture production), exhibiting a yield advantage of with less CF use [27]. Following the principle of “applying appropriate fertilizers at appropriate times with appropriate methods” [27], this study analyzes the effect of fertilizing knowledge and technologies on over-fertilization by households with three considerations, including the timing of fertilization, the consistency between the fertilizer types and nutrient requirements as well as the technologies used for fertilization.
The timing of fertilization. The various nutrients released by the soil organic matter cannot fully meet the normal needs of crop growth. Therefore, it is necessary to continuously supplement nutrients through artificial fertilization to ensure the healthy growth of the crop [34]. When applied according to the growth cycle of a crop and its nutrient requirements at each stage, artificial fertilization could play an important role in improving the crop yield during the critical periods of crop nutrient demand [35,36]. The appropriate timing of top-dressing, for example, is found to contribute to an increase in crop yield [27], because fertilizing at appropriate times is helpful for the growth of the crop and its competition with weeds for nutrients [37], yet delaying or advancing the fertilization time would reduce crop yield [16,38,39].
The consistency between the types of fertilizers applied and the nutrient requirements of crop. At different stages of growth, crops vary in the quantity and type of nutrients needed. Households need to apply fertilizers in accordance with the nutrient requirements of crops, the soil environment and climatic conditions to increase the efficiency of their fertilizer use. In order to reduce the frequency of fertilization and improve fertilizer utilization efficiency, slow-release fertilizers and inhibitors can be applied. Slow-release fertilizers and inhibitors can slow down the release rate and conversion rate of fertilizer nutrients, respectively, but they have not yet been widely applied in China. Fertilization application should consider a combination of organic fertilizers and CFs in practice, as an over-reliance on CFs is likely to cause over-fertilization [17]. If households fail to apply an appropriate type of fertilizer at an appropriate time, it may lead to the nutrient deficiency of crops. In this circumstance, the accurate identification of a deficiency in nutrients is the premise for households to “prescribe the right medicine”. If the households cannot correctly identify the “disease”, they may mistakenly use “prescription”, missing the opportunity for appropriate treatment. As a remedy, households tend to apply CF for recovering some losses, possibly leading to over-fertilization.
The technologies used for fertilization. The fertilizer effect depends largely on the technologies of fertilization [40]. Advanced fertilization technologies can increase the fertilizer-use efficiency and reduce costs [17]. The fertilization technologies include the technologies for determining the fertilizer type to be applied and helping the crop absorb nutrients. While the STFFT functions as the former, the WFIT represents the latter. STFFT is a fertilization technology that simultaneously considers the fertilizers demanded by the crop and supplied by the soil [41]. Its purpose is to increase crop yield and protect ecosystems, by means of balancing the supply of various nutrients, increasing the fertilizer-use efficiency and reducing CF application. The field trial results and households survey results have both proved that using STFFT can achieve these goals [3,42]. The WFIT is a technology that integrates fertilization with irrigation. It enhances effectiveness, mobility and solubility of nutrients in the soil by means of “small amount, fractionated, dripped”, which helps promote the efficiency of the absorption of nutrients by the crop [43]. In addition, WFIT has the advantages of reducing the CF amount, increasing crop yields and improving the quality of crops [44]. The adoption of WFIT, therefore, is expected to help reduce over-fertilization.
3. Materials and Methods
3.1. Data Collection
Data used in this study were collected using face-to-face surveys in the Huyi District of the Shaanxi province in July 2017. The type of information about fertilizers included in the survey questionnaire was obtained prior to the survey. The fertilizers sold in shops of the sample towns were photographed, together with the collection of their nutrient content registrations and prices. The photographs of these fertilizers were printed in color, which were used as an attachment with the questionnaire. In addition, the prices of these fertilizers were obtained from the sellers. In the questionnaire, respondents were asked to select the types and quantities of the fertilizers that they had used. They were also asked to report the prices of the fertilizers used. If the respondent were able to recall the prices, the reported prices were noted down, which was the case for most respondents. In cases where the respondent did not remember the prices, the prices provided by the sellers were used.
The sampling procedure was as follows: first, the nine main towns (Caotang town, Jiangcun town, Pangguang town, Qindu town, Shijing town, Tian qiao town, Yuchan town, Yuxia town and Zu’an town) for planting grapes in the Huyi District were chosen; secondly, 2 to 4 villages in each town were selected if the village has planted “Hutai No. 8” for more than 5 years with the planting area being more than 30% of the total cultivated area; and thirdly, 8 to 10 households in each village were randomly recruited to participate in the survey. In total, 235 valid responses were obtained. The distribution of the sampled households is shown in Table 1.
3.2. Sample Description
3.2.1. Characteristics of the Sampled Households
Among all the respondents, males accounted for 95%. The respondents were mainly middle-aged, with 71% between 41 and 60 and 20% above 60 years old. The respondents generally were balancers, with 29% of them being risk lovers and 13% of them risk averters. Only 28% of the respondents selected fertilizer by themselves, and only 10% of them were aware of the greater negative impact on the environment of over-fertilization. The planting scale was generally small, with 77.02% of households growing grapes below 5 mu (0.33 ha). For all respondents, an average of 76% of their income was from grape growing. Descriptive statistics of the sampled households are shown in Table 2.
3.2.2. Production Output and Input of Sample Households
In this study, households’ input includes CF, organic fertilizer, land, labor, pesticide, fixed assets (i.e., concrete pole, irrigation facilities, iron wires, agricultural machinery, etc.) and others (i.e., grape bagging, irrigation costs, clips, nets, etc.) for grape growing, while the households’ output is represented by revenue. On average, the revenue from grape growing was more than 12,000 yuan per mu (about $25,974 per ha). In term of the input, in descending order by cost, the investment in grape growing are fixed assets, CFs, pesticides, organic fertilizers, labor and others, with fixed assets and CFs accounting for about 60% of the total costs, as shown in Table 3.
3.2.3. Familiarity with Fertilization Knowledge and Technologies of the Sampled Households
During the growth period of the grapes, various nutrient elements are needed. The replenishment of nutrients needs to comply with the demand for the nutrients of grapes. In accordance with the local natural conditions and the growth characteristics of Hutai No. 8, the Professional Association of Huyi District Grapes recommends four timings for applying fertilizer to households, namely, fertilizing during budding, swelling fruit, coloring and after-harvest. The main nutrient supply of each fertilization timing is shown in Table 4. Such a fertilization scheme is consistent with the rules of grapes’ nutrient absorption discovered by Conradie [45,46], Schreiner et al. [47] and Ma [48], as well as the outcomes of the formulated fertilization based on field trials conducted by Schreiner et al. [49]. Thus, the aforementioned fertilization scheme can be considered as a scientific fertilization scheme.
Based on the aforementioned analysis, this study measured households’ fertilization knowledge and technologies using their understanding of the fertilization timing, fertilizer and nutrient matching and identification of nutrient deficiency symptoms, as well as their technology status. The specific measurement indicators are shown in Table 5.
3.3. Model Specification
3.3.1. Model for Measuring Over-Fertilization
Households need to invest in production factors such as CFs, organic fertilizers, land, labor and pesticides for grape growing. In general, the increase in CFs, organic fertilizers, land and labor can help to increase the crop yield. However, pesticides have different ways of affecting crop yield as it does not directly increase the crop yields. Pesticides are found to help maintain yield by preventing and reducing the negative impact of pests and diseases on crops in situations where other inputs are fixed [50]. Therefore, factors such as CF are considered as productive inputs, while pesticides are considered as the loss control input [50].
Based on the theory of profit maximization, the optimal CF input for households is the “point” at which the marginal revenue is equal to the marginal cost, only including the production cost. Therefore, the premise of determining whether households are over-fertilizing is to determine the marginal productivity of the CF. It is assumed that a household is a “rational economic man” whose production goal is to maximize net profit:
In Formula (1), A denotes the CF input; B denotes pesticide input; Z denotes other factors of production input (including labor, organic fertilizer, fixed assets, etc.) other than CFs and pesticides; , , and represent prices of the grapes, CF, pesticides and other production factors, respectively; and refers to the production function. When households maximize their net profit, their optimal CF application meets Formula (2):
In Formula (2), denotes the value of the marginal product (VMP) when the CF is used by the household. In other words, when , the amount of CF used is optimal; when , the CF use is excessive; otherwise, the CF use is not enough.
Lichtenberg and Zilberman [50] introduced pesticide as a loss control input into the production function and established the following loss control production model:
In Formula (3), Y denotes crop output, meets the form of C-D production function and is a loss control distribution function with four distribution patterns: The Pareto distribution, exponential distribution, logistic distribution and Weibull distribution. The exponential distribution is believed to not only perform better in model fitting, be simpler to calculate and easier to understand [51], but also more robust in its results compared to the other three distribution patterns [52]. Therefore, G(B) with an exponential distribution is adopted in this study. Then, the loss control production function is revised as follows:
In Formula (4), , , and represent the parameters to be estimated; and is a random disturbance term. There are two ways to estimate Formula (4). While one is to examine the relationship between the output quantity and input quantity, the other is to examine the relationship between revenue and cost. Households use various types of CF with different nutrients and forms (i.e., CF can be liquid or solid), which makes it difficult to add up the amount of CF used. Therefore, this study uses cost and revenue to estimate Formula (4). In order to take into account the households’ experience and ability to apply technologies to grape growing, this study adds age and education of the household head to Formula (4) as the control variables, as suggested by Qiu et al. [14] and Asfaw and Admassie [53]. The maximum likelihood estimation (MLE) was run using STATA 14.0 to estimate Formula (4).
Calculating the first-order partial derivative of the CF input in Formula (4) results in Formula (5):
Since revenue and cost are used to estimate Formula (4), the purchase price of the CF is already included in variable A. Thus, when the marginal value is equal to unity, the amount of CF is the optimal CF input for the households. Substituting the parameter estimates of Formula (4) into Formula (5), the marginal productivity of the CF for each household is calculated to determine whether they are over-fertilizing.
3.3.2. Model for Examining Factors Affecting Households’ Over-Fertilization Behavior
The two-part model proposed by Cragg [54] was used to analyze the factors influencing the households’ over-fertilization behavior. If the household is over-fertilizing, ; otherwise, . When the household is over-fertilizing, the intensity of the over-fertilization is observed (); otherwise, the intensity of the over-fertilization is 0 (). The two-part model is
In Formula (6), represents the intensity of over-fertilization by a household, where the intensity of over-fertilization is expressed in , as suggested by Ji et al. [16]. For the first part of the model, the Probit estimation was performed using the full sample. For the second part of the model, sub-samples of the over-fertilized households were used for the ordinary least squares (OLS) estimation [45]. STATA 14.0 was used to estimate Formula (6).
4. Results
4.1. Estimated Results of the Households’ Over-Fertilization Behavior
The estimation results of Formula (4) are shown in Table 6. In statistics, p < 0.10 indicates that it is significant at least at the 10% level [23], so p < 0.10 was considered as significant. The CF, organic fertilizer and pesticide inputs have significant positive effects on the households’ revenue from growing grape. The impact of labor is not statistically significant, which is in align with Qiu et al. [14]. In China, grape growing is labor-intensive. Households usually do most work on their own and hire workers for flower thinning and fruit thinning. The cost of hired labor is easy to measure, because of the cash expenditure, yet there is neither cash expenditure on a household’s own labor nor the records of time spent. Thus, it is difficult for households to estimate the total labor costs, resulting in an insignificant impact of labor costs on revenue. Similarly, the impacts of fixed assets and other inputs on revenue are not statistically significant. As for the variables of the household head’s characteristics, education has a significantly positive impact on revenue, while the influence of age is not significant.
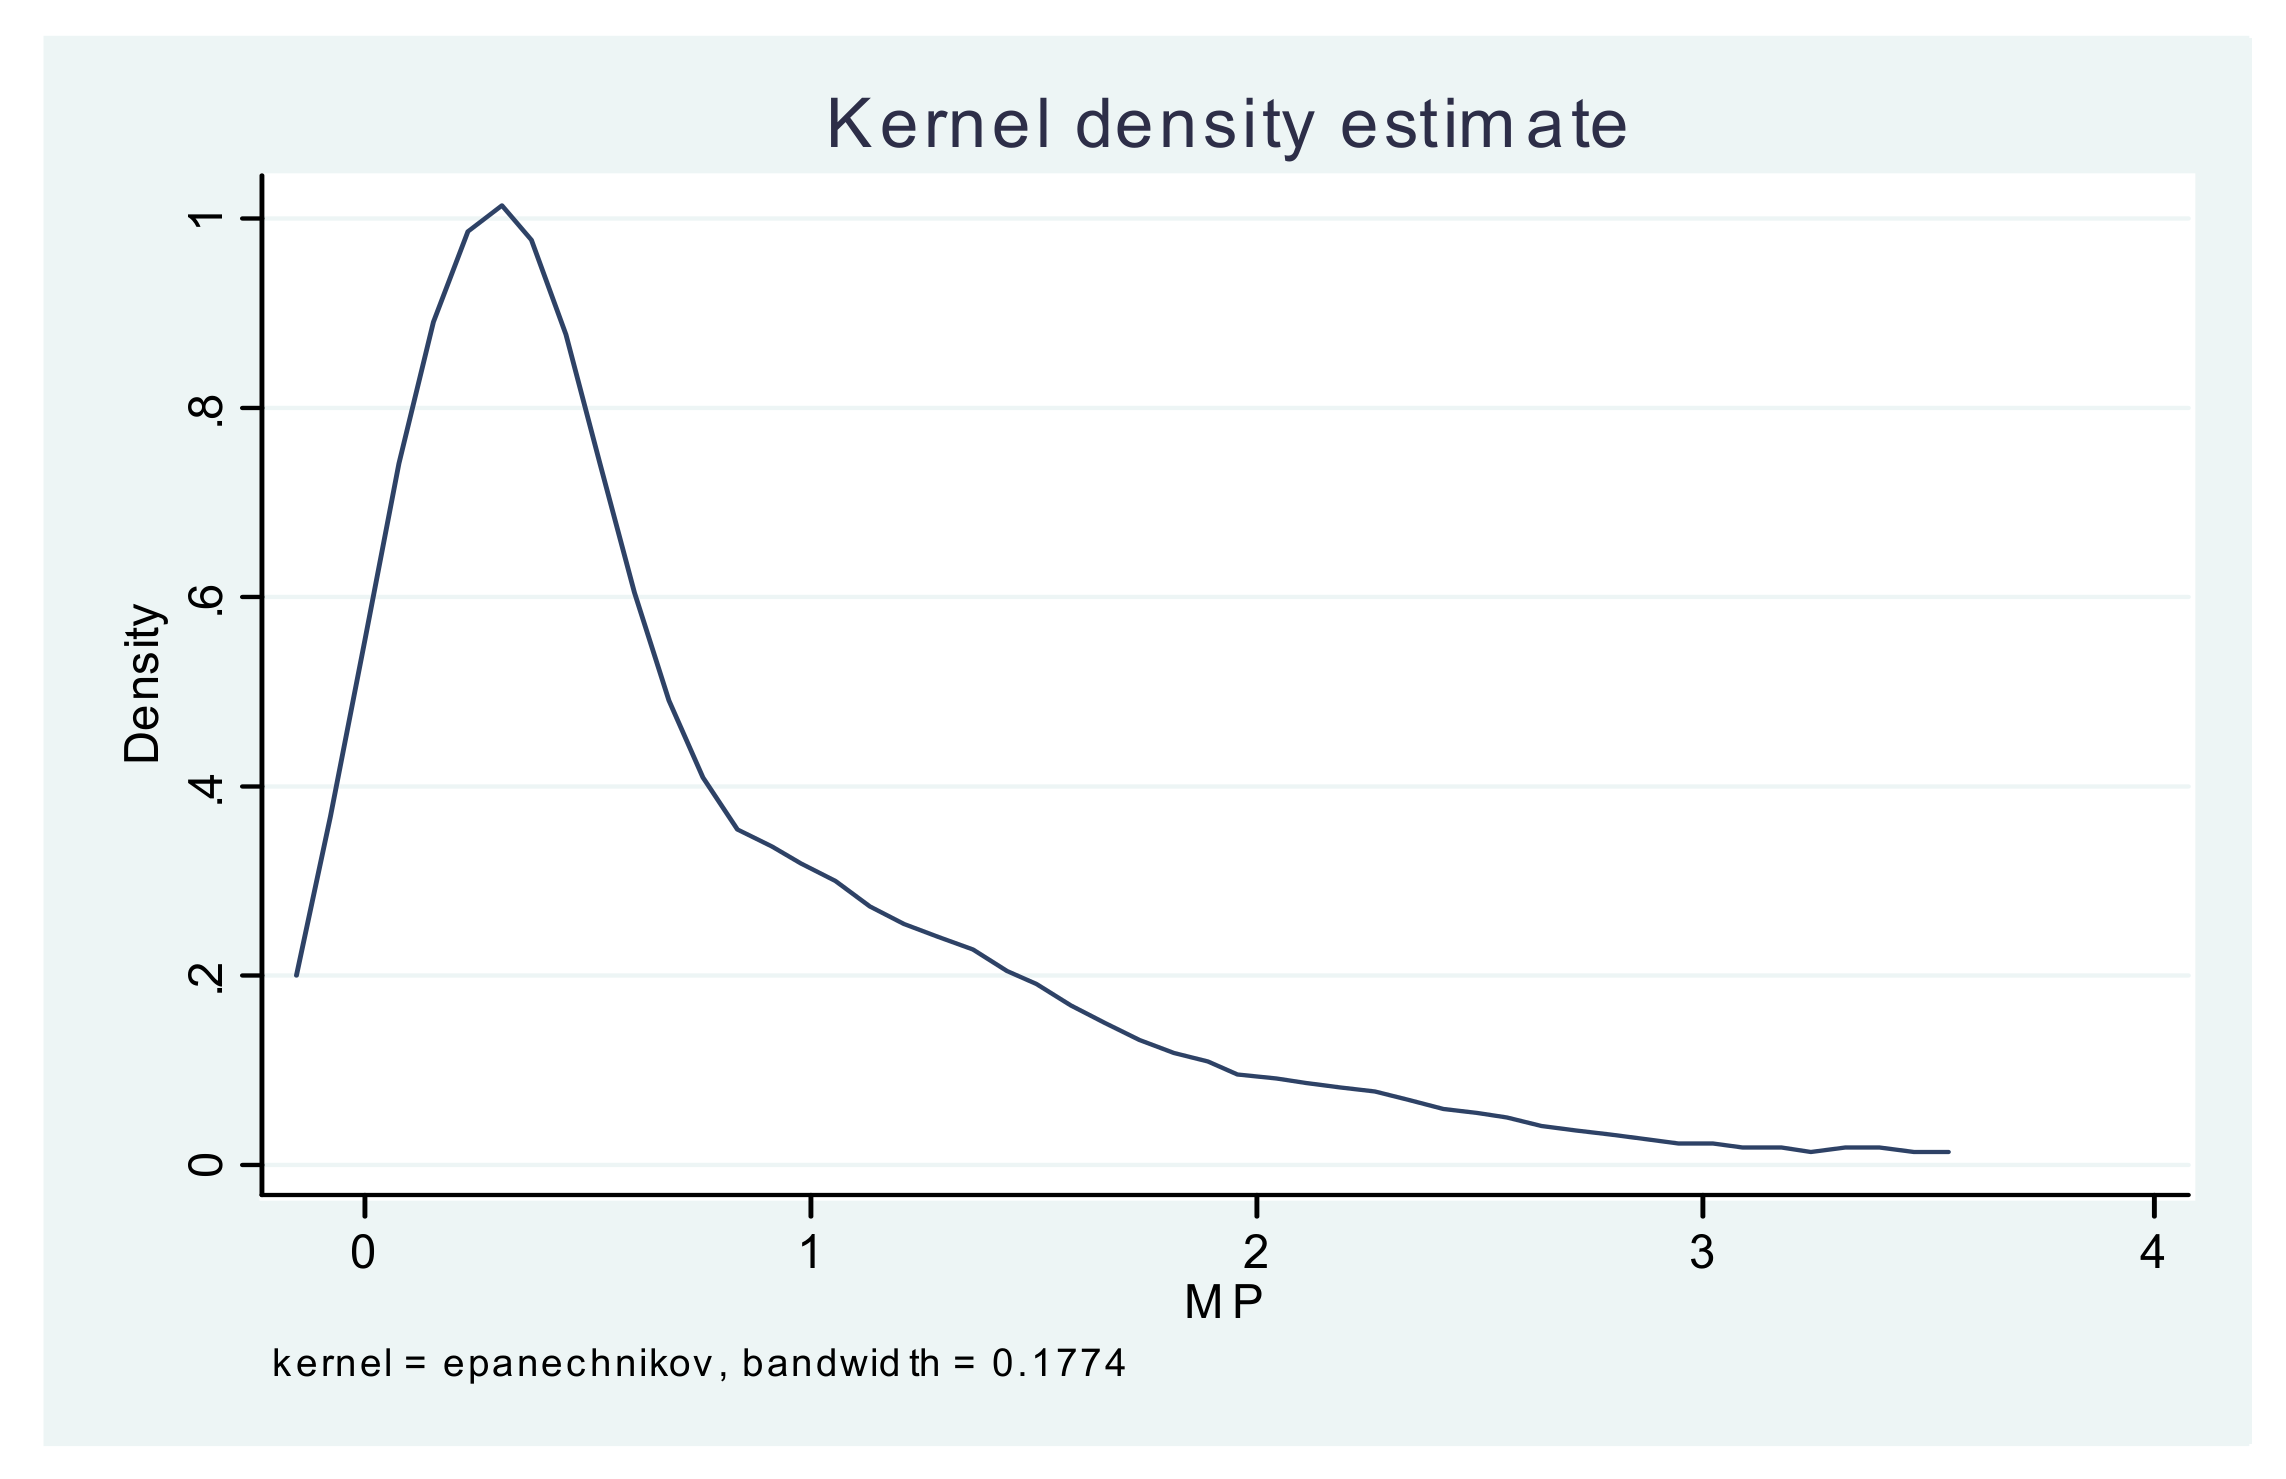
The parameter estimation results shown in Table 5 and the variables Y and A of each household are brought into Formula (5) to obtain the marginal productivity of the CF for every household. The Kerner density distribution of the CF marginal productivity of the sample households is shown in Figure 3. There are 181 households whose marginal productivity is less than 1 (over-fertilization), accounting for 77.02% of the total sample. The remaining 54 households’ marginal productivity of CF is greater than or equal to 1 (not over-fertilization), accounting for 22.98%. In particular, about 50% of the households have a marginal productivity of CF ranging from 0.2 to 0.8. The percentage of households with over-fertilization is found to be higher than that of households planting grain crops, as estimated by [13,16].
The parameter estimation results presented in Table 5 and the average values of the household variables are brought into Formula (5). The result shows that the marginal productivity of the CF is 0.46. In other words, the households’ revenue from grape growing is increased by 0.46 yuan for every additional CF input worth 1 yuan. Such a marginal productivity is below the “economic optimal point” where the marginal revenue equals the marginal cost. It should be noted that, the marginal productivity of the CF was calculated without taking into consideration the negative impact of CFs on the environment and human health. If a negative externality is considered, its marginal productivity would be even lower [52].
4.2. Estimated Results of Factors Influencing Households’ Over-Fertilization Behavior
The estimated results of the factors influencing households’ over-fertilization behavior are shown in Table 7. There are two noteworthy findings. First, the identification of nutrient deficiency symptoms has no significant effect on the over-fertilization behavior of households. The reason could be that if a certain nutrient is lacking during a period of crop growth, which is considered a critical stage for nutrients, the growth of the crop is affected. Even if it is possible to have a timely supply of this nutrient for remedy, it is difficult to make up for the loss that has already happened [55]. It may also be caused by the respondents’ low identification ability of the nutrient deficiency symptoms.
Secondly, STFFT does not have a significant impact on the over-fertilization behavior of households. One possible explanation is that the providers of STFFT in the survey area include both professional cooperatives and fertilizer distributors. While the former usually recommends “fertilizer formula” to households based on the result of “testing soil” to maximize the public welfare, the latter often does not recommend fertilizers to households according to the appropriate nutrient management as the formulated fertilization cannot meet their pursuit of profit [3]. In addition, STFFT is found to negatively affect over-fertilization intensity, similar to the findings of studies on apple growing [15]. The prior studies found that STFFT results in an increase in the output value of crops [56] and in the application amount of P-fertilizer and K-fertilizer, but a decrease in the N-fertilizer use by households [15]. Therefore, it can be argued that STFFT guides households to improve the structure of their CF application, reducing the intensity of over-fertilization.
The timing of fertilization, the matching of fertilizer types and crop nutrient requirements, as well as WFIT, were found to have significantly negative effects on households’ over-fertilization behavior and over-fertilization intensity. It means that the application of CFs that are consistent with crop nutrient requirements at the appropriate times and the adoption of WFIT are likely to help reduce the possibility and intensity of over-fertilization by grape growers.
The risk-loving attitude demonstrates no significant impact on over-fertilization by households. The reason might be that because risk-lovers are more inclined to use new fertilizer to increase crop yield than other types of households [3], they have to pay higher price for newer fertilizers [16]. The impact of a risk-aversion attitude on over-fertilization of households turns out to be positive, which means that risk-aversion households apply more CF. This is consistent with the result of [14]. As the livelihood of households in developing countries is highly uncertain, households in these countries lack reliable approaches for the transfer and decentralization of risks [57,58]. Given that the overuse of CFs can be considered as an insurance against potential yield loss [27], households tend to use more CFs than needed, resulting in over-fertilization.
The variable of whether households choose fertilizer by themselves has no significant effect on over-fertilization. Traditionally, households rely on their experience for fertilizer application, which is that the more fertilizer used the higher the crop yield [14,22]. Due to the inefficiency of the agricultural technology extension system in China, households have limited access to scientific knowledge on CF application.
Households’ awareness of CF pollution has no significant effect on their over-fertilization behavior. This finding is similar to Wang and Gu [59] who found that households’ environmental cognition does not necessarily lead to environmentally friendly behavior. In China, households take little responsibility for ecological destruction caused by their farming behavior. Thus, households seldom consider the impact of over-fertilization on the ecological environment [21].
The grape income ratio has a significantly negative effect on the over-fertilization behavior, which means that households with a lower grape income ratio have a higher probability and intensity of over-fertilization. Households with relatively low grape income have a larger portion of their income from off-farming jobs, which means that they have a high opportunity cost for growing grape. In order to save labor for off-farming jobs, households tend to use a large amount of fertilizer at one time instead of using the appropriate fertilizers multiple times [12,60], which is likely to cause excessive use of CFs.
The planting scale does not have a statistically significant impact on households’ over-fertilization behavior. On the one hand, CF application in grape planting is mainly completed by human labor, which means that the CF requires the assistance of labor input. On the other hand, as an input factor to promote crop growth, CF application can, to a certain extent, replace labor input in field management [60]. Since a larger planting area usually means a greater possibility of labor shortage, households with a larger planting scale are more likely to increase the use of capital-intensive inputs, such as CFs. However, such an effect is not found in this study.
5. Discussion
Our findings support the beliefs that households’ over-fertilization is common in grape production in China. This is similar to findings from research in the Zhengjiang province [61] and Hunan province [62], but the marginal productivity in this study is much lower than the fertilizer expenditure for grape in these other studies [61,62]. The main reason for this is that the climate in the north is drier with less rain than in the south of China, which effects the absorption of nutrients from the CF by crops.
Households’ non-optimal fertilization strategy is a result of the lack of related knowledge and irresponsible fertilizer marketing [27]. China’s agricultural public service system allows limited household access to accurate fertilization knowledge [63], which makes it possible for households to be misled by commercial organizations, such as the CF manufacturers and distributors. Technical training organized by fertilizer suppliers are usually focused on promoting CF sales without considering households’ economic benefits or social and environmental costs [17]. The households’ decisions on CF purchases could be influenced by price and marketing schemes, which can be confusing sometimes as the information about most CF is shown in neither simple nor user-friendly ways [27]. The diversity of CFs and the market shortcomings make it difficult for households to acquire accurate knowledge on fertilization, leading households to choose rational ignorance [16]. Especially, local fertilizer distributors usually allow households to purchase fertilizer on credit and pay back after they have sold grapes, which further exacerbates the households’ over-fertilization behavior.
Through field experiments in China, it was proved that advanced crop and nutrient management practices can increase yields with improved CF-use efficiency [32]. However, the lack of knowledge is one of the main reasons for households’ CF management deficiencies [27]. The fertilization technique training may enable households to access to knowledge and technologies on scientific fertilization, such as new technology, the amount of fertilizer used, the time for top-dressing, etc. [21]. The Agricultural Extension Department of China provides a short-term training program on scientific fertilization, which is found to hardly effectively improve the efficiency of fertilizer use [3] because households’ knowledge gained from a one-time training could slowly wane over time, especially without practicing [1]. Instead, changing the households’ over-fertilization behavior requires intensive and long-term training [3] and field guidance [17,22], as households need to internalize knowledge and know both how and why [1]. It is suggested to enable households to achieve the relevant knowledge and technologies by using the Science and Technology Backyard (STB) platform [27]. STB is an organization whose staff are professors and graduate students from China Agricultural University who live in villages together with peasants for promoting technology transfer to help them increase the return from agricultural production in an environmentally friendly manner.
This study contributes to the literature on households’ over-fertilization behavior. Prior studies focus on the impact of the households’ understanding of the CF’s characteristics [16] and on training concerning households’ fertilization behavior [1,22,25]. Following the principle of “applying appropriate fertilizers at appropriate times with appropriate methods”, this study examines the effect of fertilizing knowledge and technologies on households’ over-fertilization behavior by measuring the households’ fertilization knowledge and technologies using their experience and knowledge on the timing of the fertilization, the consistency between the fertilizer types and nutrient requirements and the technologies used for fertilization. The results of this study can be used to identify the entry points for reducing the possibility and intensity of excessive use of CFs by households in horticultural crop production, because more training will encourage households to change their fertilization management and protect the local environment [3]. It is suggested that the Chinese government should promote the establishment of a systematic training program on horticultural crop fertilization and put it into force nationwide. In addition, the government could build a public service platform for information sharing between agricultural experts and households [61,64,65]. On this type of platform, knowledge on crop nutrient management, different types of fertilizers and fertilization technologies can be distributed and on-site advice and reminders can be sent automatically at proper times [27] to households in an easy–to-understand way based on the farming season and the growth period of the crops. By doing so, one would improve the households’ fertilization knowledge and technologies, which is a win-win measure that could increase households’ income and ensure enhanced environmental sustainability.
6. Conclusions
Chemical fertilizer plays an important role in horticultural crop production in China, but households’ over-fertilization behavior has caused serious environmental problems and has affected sustainable land use [66]. This study analyzes whether improving households’ fertilization knowledge and technologies can reduce their over-fertilization behavior. Using survey data collected from 235 grape growers, this study estimates the marginal productivity of CFs using the loss control production function and examines the effect of fertilizing knowledge and technologies on households’ over-fertilization behavior using a two-part model. Our empirical results show that more than 75% of households report over-fertilizing in grape production. The appropriate timing of fertilization and matching between the type of fertilizer to be used and the nutrients needed by the crop can help reduce the probability and intensity of excessive fertilization. The adoption of WFIT was also found to be helpful. However, the adoption of STFFT was found to only reduce the intensity of the over-fertilization.
The findings of this study should be carefully applied to grape growers in other districts of China, given the widely varying planting conditions and endowments of rural households throughout the country. In addition, the model used in this study did not take into account the negative effects of fertilization on the environment. However, considering the negative effects of fertilization on the environment, future research may consider studying over-fertilization from an eco-environment perspective.
Author Contributions
Conceptualization, C.X.; methodology, C.X. and T.Z.; software, Y.G.; validation, T.Z.; formal analysis, C.X. and Y.G.; investigation, C.X.; resources, C.X. and S.Y.; data curation, C.X. and Y.G.; writing—original draft preparation, C.X. and S.Y.; writing—review and editing, C.X. and T.Z.; visualization, Y.G.; supervision, S.Y.; project administration, C.X.; funding acquisition, C.X. and T.Z. All authors have read and agree to the published version of the manuscript.
Funding
This research was funded by the China National Natural Science Foundation, grant number 71873102, the Humanities and Social Sciences Planning Project of the Ministry of Education of China, grant number 18YJA630124, and the Shaanxi Social Science Foundation, grant number 2017S026.
Acknowledgments
We thank to all the participants involved in the projects for their contribution in our research data.
Conflicts of Interest
The authors declare no conflict of interest. The funders had no role in the design of the study; in the collection, analyses, or interpretation of data; in the writing of the manuscript, or in the decision to publish the results.
References
- Huang, J.; Huang, Z.; Jia, X.; Hu, R.; Xiang, C. Long-term reduction of nitrogen fertilizer use through knowledge training in rice production in China. Agric. Syst. 2015, 135, 105–111. [Google Scholar] [CrossRef]
- Chen, X.; Ma, L.; Ma, W.; Wu, Z.; Cui, Z.; Hou, Y.; Zhang, F. What has caused the use of fertilizers to skyrocket in China? Nutr. Cycl. Agroecosyst. 2018, 110, 241–255. [Google Scholar] [CrossRef]
- Ma, L.; Feng, S.; Reidsma, P.; Qu, F.; Heerink, N. Identifying entry points to improve fertilizer use efficiency in Taihu Basin, China. Land Use Policy 2014, 37, 52–59. [Google Scholar] [CrossRef]
- Uri, N.D. Incorporating the environmental consequences in the fertilizer use decision. Sci. Total Environ. 1997, 201, 99–111. [Google Scholar] [CrossRef]
- Asai, M.; Reidsma, P.; Feng, S. Impacts of agricultural land-use changes on biodiversity in Taihu Lake Basin, China: A multi-scale cause–effect approach considering multiple land-use functions. Int. J. Biodivers. Sci. Ecosyst. Serv. Manag. 2010, 6, 119–130. [Google Scholar] [CrossRef]
- Yan, Y.; Tian, J.; Fan, M.; Zhang, F.; Li, X.; Christie, P.; Chen, H.; Lee, J.; Kuzyakov, Y.; Six, J. Soil organic carbon and total nitrogen in intensively managed arable soils. Agric. Ecosyst. Environ. 2012, 150, 102–110. [Google Scholar] [CrossRef]
- MAC. Action Plan for Zero Growth of Fertilizer Consumption by 2020. Available online: http://www.moa.gov.cn/govpublic/ZZYGLS/201503/t20150318_4444765.htm (accessed on 8 August 2019).
- Xin, L.; Li, X.; Tan, M. Temporal and regional variations of China’s fertilizer consumption by crops during 1998–2008. J. Geogr. Sci. 2012, 22, 643–652. [Google Scholar] [CrossRef]
- Wang, X.; Cai, D.; Grant, C.; Hoogmoed, W.B.; Oenema, O. Changes in regional grain yield responses to chemical fertilizer use in China over the last 20 years. J. Soil Sci. Plant Nutr. 2018, 18, 312–328. [Google Scholar] [CrossRef] [Green Version]
- National Bureau of Statistics of China. China Statistical Yearbook; China Statistics Press: Beijing, China, 1999. [Google Scholar]
- National Bureau of Statistics of China. China Statistical Yearbook; China Statistics Press: Beijing, China, 2017. [Google Scholar]
- Wu, Y. Chemical fertilizer use efficiency and its determinants in China’s farming sector: Implications for environmental protection. China Agric. Econ. Rev. 2011, 3, 117–130. [Google Scholar] [CrossRef]
- Ma, L.; Zhang, Y.; Sui, B.; Wang, P.; Gu, S.; Shen, Q.; Xu, M.; Guo, S. The impact factor of excessive fertilization of Jiangsu Province. J. Yangzhou Univ. (Agric. Life Sci. Ed.) 2011, 3, 48–52. [Google Scholar]
- Qiu, H.; Luan, H.; Li, J.; Wang, Y. Effects of risk aversion on households’ excessive use of chemical fertilizers. Chin. Rural Econ. 2014, 3, 85–96. [Google Scholar]
- Zhang, J.; Manske, G.; Zhou, P.Q.; Tischbein, B.; Becker, M.; Li, Z.H. Factors influenng farmers’ desions on nitrogen fertilizer application in the Liangzihu Lake basin, Central China. Environ. Dev. Sustain. 2017, 19, 791–805. [Google Scholar] [CrossRef]
- Ji, Y.; Zhang, H.; Lu, W.; Liu, H. Differentiation, incomplete information, and overuse of fertilizers for households. J. Agrotech. Econ. 2016, 2, 14–22. [Google Scholar]
- Pan, D.; Kong, F.; Zhang, N.; Ying, R. Knowledge training and the change of fertilizer use intensity: Evidence from wheat farmers in China. J. Environ. Manag. 2017, 197, 130–139. [Google Scholar] [CrossRef]
- Li, Y.J.; Yang, M.; Zhang, Z.Z.; Li, W.L.; Zhang, X.D. An ecological research on potential for zero-growth of chemical fertilizer use in citrus production in China. Ekoloji 2019, 28, 1049–1059. [Google Scholar]
- Chen, C.; Wang, Y.; Zhai, Q. Risk preference, perception and fertilizers, pesticides application. J. Agro-For. Econ. Manag. 2019, 18, 472–480. [Google Scholar]
- Xie, S.; Feng, H.; Yang, F.; Zhao, Z.; Hu, X.; Wei, C.; Liang, T.; Li, H.; Geng, Y. Does dual reduction in chemical fertilizer and pesticides improve nutrient loss and tea yield and quality? A pilot study in a green tea garden in Shaoxing, Zhejiang Province, China. Environ. Sci. Pollut. Res. 2019, 26, 2464–2476. [Google Scholar] [CrossRef]
- Gong, Q.; Mu, X.; Tian, Z. Analysis of factors influencing households’ cognition of over-fertilization risk and evasion ability - Based on questionnaire survey of 284 households in Jianghan plain. Chin. Rural Econ. 2010, 10, 66–76. [Google Scholar]
- Huang, J.; Hu, R.; Cao, J.; Rozelle, S. Training programs and in-the-field guidance to reduce China’s overuse of fertilizer without hurting profitability. J. Soil Water Conserv. 2008, 63, 165A–167A. [Google Scholar] [CrossRef]
- Wooldridge, J. Introductory Econometrics: A Modern Approach, 6th ed.; Cengage Learning: Singapore, 2015. [Google Scholar]
- Wang, P.; Zhang, W.; Li, M.; Han, Y. Does fertilizer education program increase the technical efficiency of chemical fertilizer use? Evidence from wheat production in China. Sustainability 2019, 11, 543. [Google Scholar] [CrossRef] [Green Version]
- Hu, R.; Cao, J.; Huang, J.; Peng, S.; Huang, J.; Zhong, X.; Zou, Y.; Yang, J.; Buresh, R.J. Farmer participatory testing of standard and modified site-specific nitrogen management for irrigated rice in China. Agric. Syst. 2007, 94, 331–340. [Google Scholar] [CrossRef]
- Schultz, T.W. Transforming Traditional Agriculture; Yale University Press: New Haven, CT, USA, 1964. [Google Scholar]
- Zhang, W.; Cao, G.; Li, X.; Zhang, H.; Wang, C.; Liu, Q.; Chen, X.; Cui, Z.; Shen, J.; Jiang, R. Closing yield gaps in China by empowering smallholder farmers. Nature 2016, 537, 671. [Google Scholar] [CrossRef]
- Kormawa, P.; Munyemana, A.; Soule, B. Fertilizer market reforms and factors influencing fertilizer use by small-scale farmers in Bénin. Agric. Ecosyst. Environ. 2003, 100, 129–136. [Google Scholar] [CrossRef]
- Faruque-As-Sunny; Huang, Z.; Karimanzira, T.T.P. Investigating key factors influencing farming decisions based on soil testing and fertilizer recommendation facilities (STFRF)—A case study on rural Bangladesh. Sustainability 2018, 10, 4331. [Google Scholar] [CrossRef] [Green Version]
- Ricart, S.; Gandolfi, C. Balancing irrigation multifunctionality based on key stakeholders’ attitudes: Lessons learned from the Muzza system, Italy. Land Use Policy 2017, 69, 461–473. [Google Scholar] [CrossRef]
- Lv, H. Grape Industry Development Present Situation, Existing Problems and Countermeasures of Hu County “Hutai NO.8”; Northwest A&F University: Shaanxi, China, 2016. [Google Scholar]
- Chen, X.; Cui, Z.; Fan, M.; Vitousek, P.; Zhao, M.; Ma, W.; Wang, Z.; Zhang, W.; Yan, X.; Yang, J. Producing more grain with lower environmental costs. Nature 2014, 514, 486. [Google Scholar] [CrossRef]
- Lin, Y.; Ma, J. Economic level calculation of chemical fertilizer in households’ grain production: A case study of wheat planters in the North China plain. J. Agrotech. 2013, 1, 25–31. [Google Scholar]
- Cai, G.; Chen, D.; Ding, H.; Pacholski, A.; Fan, X.; Zhu, Z. Nitrogen losses from fertilizers applied to maize, wheat and rice in the North China Plain. Nutr. Cycl. Agroecosyst. 2002, 63, 187–195. [Google Scholar] [CrossRef]
- Grahmann, K.; Govaerts, B.; Fonteyne, S.; Guzmán, C.; Soto, A.P.G.; Buerkert, A.; Verhulst, N. Nitrogen fertilizer placement and timing affects bread wheat (Triticum aestivum) quality and yield in an irrigated bed planting system. Nutr. Cycl. Agroecosyst. 2016, 106, 185–199. [Google Scholar] [CrossRef]
- Melaku, N.D.; Bayu, W.; Ziadat, F.; Strohmeier, S.; Zucca, C.; Tefera, M.L.; Ayalew, B.; Klik, A. Effect of nitrogen fertilizer rate and timing on sorghum productivity in Ethiopian highland Vertisols. Arch. Agron. Soil Sci. 2018, 64, 480–491. [Google Scholar] [CrossRef]
- Blackshaw, R.E.; Molnar, L.J.; Janzen, H.H. Nitrogen fertilizer timing and application method affect weed growth and competition with spring wheat. Weed Sci. 2004, 52, 614–622. [Google Scholar] [CrossRef]
- Fischer, R. Irrigated spring wheat and timing and amount of nitrogen fertilizer. II. Physiology of grain yield response. Field Crop. Res. 1993, 33, 57–80. [Google Scholar] [CrossRef]
- Scharf, P.C.; Wiebold, W.J.; Lory, J.A. Corn yield response to nitrogen fertilizer timing and deficiency level. Agron. J. 2002, 94, 435–441. [Google Scholar] [CrossRef]
- Adams, C.B.; Thapa, S.B.; Fan, Y.; Park, S. Agronomic and economic effects of two enhanced-efficiency urea fertilizer technologies on southern great plains winter wheat. Agron. J. 2018, 110, 1097–1102. [Google Scholar] [CrossRef]
- Marenya, P.P.; Barrett, C.B. Soil quality and fertilizer use rates among smallholder farmers in western Kenya. Agric. Econ. 2009, 40, 561–572. [Google Scholar] [CrossRef]
- Xu, X.; He, P.; Qiu, S.; Pampolino, M.F.; Zhao, S.; Johnston, A.M.; Zhou, W. Estimating a new approach of fertilizer recommendation across small-holder farms in China. Field Crop. Res. 2014, 163, 10–17. [Google Scholar] [CrossRef]
- McBeath, T.; McLaughlin, M.J.; Armstrong, R.; Bell, M.; Bolland, M.; Conyers, M.; Holloway, R.; Mason, S. Predicting the response of wheat (Triticum aestivum L.) to liquid and granular phosphorus fertilisers in Australian soils. Soil Res. 2007, 45, 448–458. [Google Scholar] [CrossRef] [Green Version]
- Bhat, R.; Sujatha, S.; Balasimha, D. Impact of drip fertigation on productivity of arecanut (Areca catechu L.). Agric. Water Manag. 2007, 90, 101–111. [Google Scholar] [CrossRef]
- Conradie, W. Seasonal uptake of nutrients by Chenin blanc in sand culture: I. Nitrogen. South Afr. J. Enol. Vitic. 1980, 1, 59–65. [Google Scholar] [CrossRef]
- Conradie, W. Seasonal uptake of nutrients by Chenin blanc in sand culture: II. phosphorus, potassium, calcium and magnesium. South Afr. J. Enol. Vitic. 1981, 2, 7–13. [Google Scholar] [CrossRef] [Green Version]
- Schreiner, R.P.; Scagel, C.F.; Baham, J. Nutrient uptake and distribution in a mature ‘pinot noir’ vineyard. HortScience 2006, 41, 336–345. [Google Scholar] [CrossRef] [Green Version]
- Ma, W. Research on Nutrients Uptake and Accumulation in Different Cash Crops; Northwest A&F University: Shaanxi, China, 2010. [Google Scholar]
- Schreiner, R.P.; Lee, J.; Skinkis, P.A. N, P, and K supply to Pinot noir grapevines: Impact on vine nutrient status, growth, physiology, and yield. Am. J. Enol. Vitic. 2013, 64, 26–38. [Google Scholar] [CrossRef]
- Lichtenberg, E.; Zilberman, D. The econometrics of damage control: Why specification matters. Am. J. Agric. Econ. 1986, 68, 261–273. [Google Scholar] [CrossRef]
- Babcock, B.A.; Lichtenberg, E.; Zilberman, D. Impact of damage control and quality of output: Estimating pest control effectiveness. Am. J. Agric. Econ. 1992, 74, 163–172. [Google Scholar] [CrossRef]
- Grovermann, C.; Schreinemachers, P.; Berger, T. Quantifying pesticide overuse from farmer and societal points of view: An application to Thailand. Crop Prot. 2013, 53, 161–168. [Google Scholar] [CrossRef]
- Asfaw, A.; Admassie, A. The role of education on the adoption of chemical fertiliser under different socioeconomic environments in Ethiopia. Agric. Econ. 2004, 30, 215–228. [Google Scholar] [CrossRef]
- Cragg, J.G. Some statistical models for limited dependent variables with application to the demand for durable goods. Econom. J. Econom. Soc. 1971, 39, 829–844. [Google Scholar] [CrossRef]
- Beijing Agricultural University. Agricultural Chemistry (General); Agricultural Press: Beijing, China, 1996. [Google Scholar]
- Byju, G.; Nedunchezhiyan, M.; Hridya, A.; Soman, S. Site-specific nutrient management for cassava in southern India. Agron. J. 2016, 108, 830–840. [Google Scholar] [CrossRef]
- Cardenas, J.C.; Carpenter, J.P. Three themes on field experiments and economic development. In Field Experiments in Economics (Research in Experimental Economics, Volume 10); Harrison, G.W., Carpenter, J., List, J.A., Eds.; Emerald Group Publishing Limited: Bradford, UK, 2005; pp. 71–123. [Google Scholar]
- Gong, Y.; Baylis, K.; Kozak, R.; Bull, G. Farmers’ risk preferences and pesticide use decisions: Evidence from field experiments in China. Agric. Econ. 2016, 47, 411–421. [Google Scholar] [CrossRef]
- Wang, C.; Gu, H. Households’ perception of environment, behavior decision and the check of consistency between them—An empirical analysis based on the survey of households in Jiangsu Province. Resour. Environ. Yangtze Basin 2012, 21, 1204–1208. [Google Scholar]
- Lamb, R.L. Fertilizer use, risk, and off-farm labor markets in the semi-arid tropics of India. Am. J. Agric. Econ. 2003, 85, 359–371. [Google Scholar] [CrossRef] [Green Version]
- Chen, F. The Analysis on Technical Efficiency of Households Grape Production in Wenling; Nanjing Agricultural University: Nanjing, China, 2009. [Google Scholar]
- Peng, X.; Deng, X. The influence of farmer specialized cooperatives on farmers’ production efficiency—Based on the investigation of vineyard farmers in Hunan province. Sci. Technol. Ind. 2018, 18, 1–4. [Google Scholar]
- Hu, R.; Yang, Z.; Kelly, P.; Huang, J. Agricultural extension system reform and agent time allocation in China. China Econ. Rev. 2009, 20, 303–315. [Google Scholar] [CrossRef]
- Yin, R.; Yin, G. China’s primary programs of terrestrial ecosystem restoration: Initiation, implementation, and challenges. Environ. Manag. 2010, 45, 429–441. [Google Scholar] [CrossRef] [PubMed]
- Yin, R.; Liu, C.; Zhao, M.; Yao, S.; Liu, H. The implementation and impacts of China’s largest payment for ecosystem services program as revealed by longitudinal household data. Land Use Policy 2014, 40, 45–55. [Google Scholar] [CrossRef]
- Yin, R.; Yin, G.; Li, L. Assessing China’s ecological restoration programs: What’s been done and what remains to be done? Environ. Manag. 2010, 45, 442–453. [Google Scholar] [CrossRef] [PubMed]
Figure 1.
Optimal application of chemical fertilizer (CF) in agronomy.
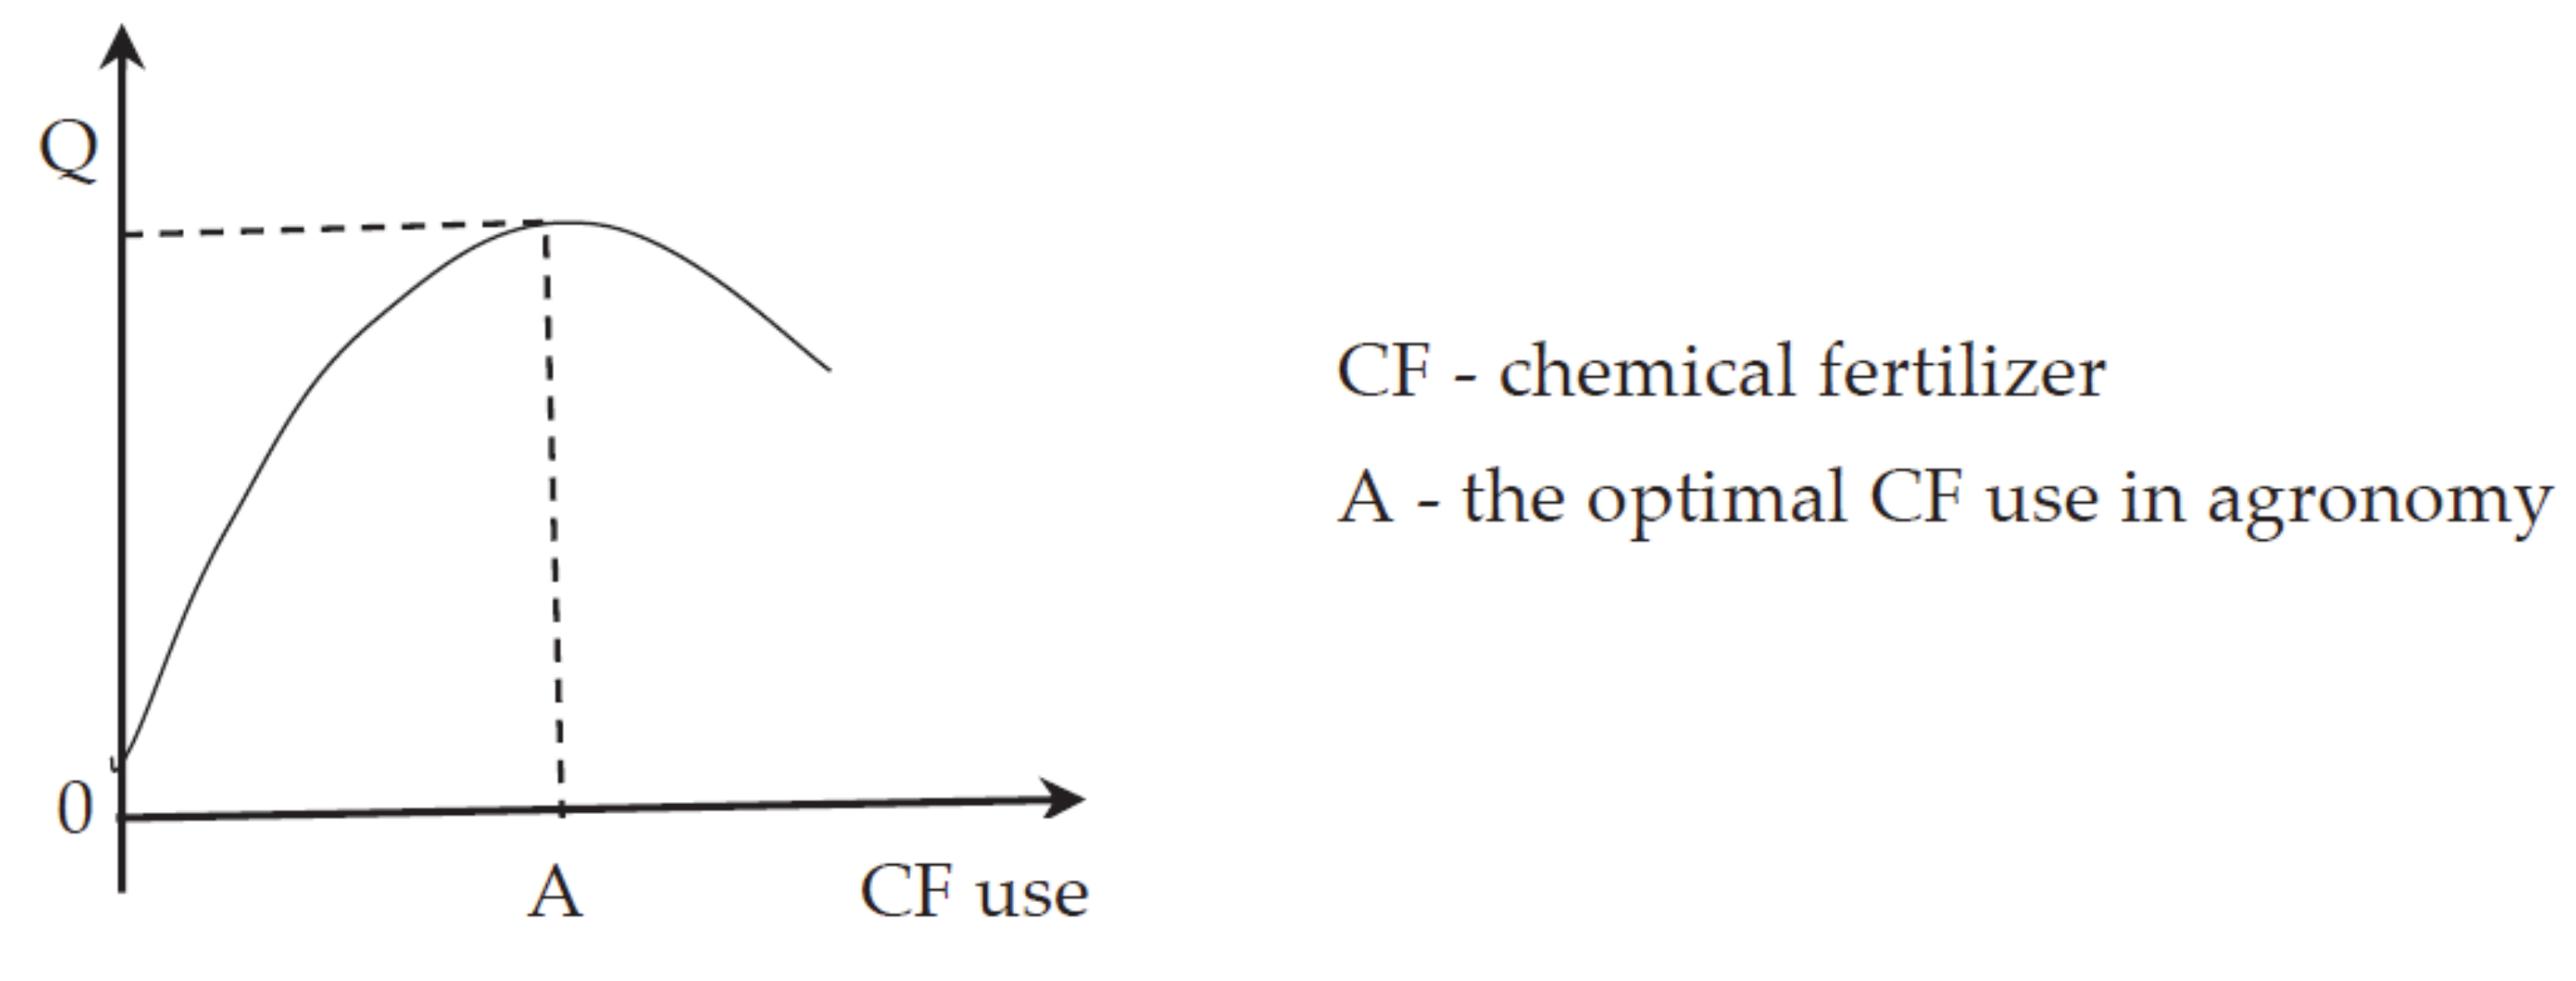
Figure 2.
Optimal applications of CFs in economics and the eco-environment.

Figure 3.
Kernel density distribution of the marginal productivity of the CF.

Table 1.
Distribution of the sampled households growing grape.
| Planting Grape Years of the Town | Planting Grape Area/Total Cultivated | Town Name | Number of Households | Percentage (%) |
|---|---|---|---|---|
| (10, 20) | (45%, 60%) | Caotang | 33 | 14.04 |
| Jiangcun | 23 | 9.79 | ||
| Qindu | 28 | 11.91 | ||
| (10, 20) | (30%, 45%) | Pangguang | 18 | 7.66 |
| Shijing | 31 | 13.19 | ||
| Tianqiao | 27 | 11.49 | ||
| (5, 10) | (45%, 60%) | Zu’an | 20 | 8.51 |
| Yuxia | 24 | 10.21 | ||
| Yuchan | 31 | 31.91 | ||
| Total | 235 | 100.00 |
Table 2.
Descriptive statistics of the characteristics of the sample households.
| Variable | Variable Definition | Mean | Std. dev. |
|---|---|---|---|
| Gender of HH head | 1 = male, 0 = female | 0.95 | 0.22 |
| Age of HH head | Year | 52.93 | 8.94 |
| Risk-loving a | 1 = yes, 0 = no | 0.29 | 0.45 |
| Risk aversion b | 1 = yes, 0 = no | 0.13 | 0.34 |
| Fertilizer selection | 1 = myself, 0 = others | 0.28 | 0.45 |
| Awareness of CF pollution | Whether the overuse of CF have a greater negative impact on the environment or not? 1 = yes, 0 = no | 0.10 | 0.30 |
| Grape income ratio | Grape income/ total income in 2016 | 0.76 | 0.29 |
| Planting scale | Planting area/mu(ha) | 4.18 (0.28) | 2.31(0.15) |
Note: a b In the survey, the following questions were set: “If there is a new type of CF, your attitude is: (a) I would feel that the effect is good and immediately adopt it; (b) I would observe the effect of others’ adoption and then decide whether to use it. (c) I would decide to adopt it after almost everyone around use it”. The answers (a), (b) and (c) indicate that the head of the household is a risk lover, risk balancer or risk averter, respectively.
Table 3.
Descriptive statistics of the input and output per mu (1/15 ha) of households growing grapes.
Table 3.
Descriptive statistics of the input and output per mu (1/15 ha) of households growing grapes.
| Variables a | Mean | Std. dev. | Max | Min | |
|---|---|---|---|---|---|
| Output | Revenue b | 12,759.49 | 7758.11 | 24,570.00 | 780.00 |
| Input | CF | 1297.32 | 831.95 | 3180.50 | 320.00 |
| Pesticides | 474.79 | 302.48 | 737.68 | 54.55 | |
| Organic fertilizer | 422.25 | 470.61 | 5600.00 | 56.00 | |
| Labor c | 433.72 | 209.05 | 610.00 | 135.00 | |
| Fixed assets d | 1346.86 | 719.78 | 4480.00 | 360.00 | |
| Others e | 286.52 | 102.49 | 1075.00 | 46.00 |
Note: a The unit of variables is yuan (1 yuan = $0.14). b Normally, a higher production is related to a lower grape quality, and a lower production is associated with a higher grape quality in China. Revenue is the cash inflow of households planting grapes in a year. In theory, revenue equals production multiplied by price. Price is a reflection of quality, so revenue is a comprehensive index of production and quality. In practice, the households’ grapes are usually sold in multiple batches, and the revenue is the sum of the households’ revenue from multiple sales of grapes. c There are two types of labor for growing grapes: family laborers and hired laborers. If the household has hired workers, the labor cost of the family labor will be calculated according to the price of the hired worker. If there is no hired worker, the family labor price will be calculated according to the average price. d It includes capital inputs, such as concrete poles, iron wires, irrigation facilities and agricultural machinery, and is depreciated according to 10 years. e It includes the inputs of grape bagging, irrigation fees, clips, nets, etc.
Table 4.
Recommended fertilization time and main nutrient supply.
| Type | Budding Fertilizer | Swelling Fruit Fertilizer | Coloring Fertilizer | After-Harvest Fertilizer |
|---|---|---|---|---|
| Fertilization time | Mid-April | Mid-May | Late June to Early July | Early to Middle October |
| Main nutrient supply | Organic fertilizer +NPK balanced compound fertilizer | High N High K compound fertilizer +P-fertilizer | High K compound fertilizer +Organic fertilizer | Organic fertilizer +NPK balanced compound fertilizer |
Table 5.
Measurements and descriptions of households’ fertilization knowledge and technologies.
| Indicator | Definition | Mean | Std. dev. |
|---|---|---|---|
| Grasp of fertilization time | The assignment is taken based on the matching times of households’ fertilization time and the optimal fertilization time, and the specific value is 0 for 2 times or less, indicating that households have a poor grasp of fertilization time; and 1 for 3 to 4 times, indicating that households have good grasp fertilization time. | 0.57 | 0.50 |
| Fertilizer and nutrient matching | The degree of matching between the types of fertilizer applied by the households and the recommended main nutrient supply plan is based on for judgment. For each fertilization, the total matching is 2 points, part matching is 1 point and no matching is 0 point. The total score of the 4 times fertilization of the households is added up and re-assigned. Specifically, 0 to 4 points is assigned the value of 0, indicating that the matching degree between the households’ fertilization type and crop nutrient demand is relatively low; the value of 5 to 8 points is 1, indicating that the matching degree between households’ fertilization type and crop nutrient demand is relatively high. | 0.42 | 0.49 |
| Identification of nutrient deficiency symptom | In the investigation, the eight typical grape leaf symptoms of Taitai No. 8, namely, nitrogen deficiency, phosphorus deficiency, potassium deficiency, zinc deficiency, iron deficiency, magnesium deficiency, boron deficiency and manganese deficiency are made into a color map. Ask the households the causes of the symptoms. According to the households’ answer, 0 is for 0 to 4 right answers, indicating that the households’ ability to identify the deficiency is low; and 1 is for 5 to 8 right answers, indicating that the households have a high ability to identify the nutrient deficiency. | 0.06 | 0.23 |
| WFIT | 0 = yes, 1 = no | 0.31 | 0.46 |
| STFFT | 0 = yes, 1 = no | 0.17 | 0.37 |
Table 6.
Results of the loss control production function.
| Variables | Coefficients | T-Value | p-Value |
|---|---|---|---|
| Constant | 9.8751 | 6.52 | 0.000 |
| CF | 0.0470 | 2.14 | 0.033 |
| Organic fertilizer | 0.2797 | 5.80 | 0.000 |
| Labor | 0.1583 | 0.26 | 0.764 |
| Fixed assets | 0.0212 | 1.25 | 0.193 |
| Other | 0.0398 | 1.35 | 0.188 |
| Pesticide | 0.1026 | 1.78 | 0.076 |
| Age of HH head | 0.0521 | 0.19 | 0.851 |
| Education of HH head | 0.0957 | 0.32 | 0.697 |
| R2 = 51.81 |
Table 7.
Results of the influencing factors of households’ over-fertilization.
| Variables. | Over-Fertilization | Over-Fertilization Intensity | ||||
|---|---|---|---|---|---|---|
| Coefficients | Z-Value | p-Value | Coefficients | T-Value | p-Value | |
| Grasp of fertilization time | −0.5041 | −1.77 | 0.084 | −0.1232 | −1.78 | 0.082 |
| Fertilizer and nutrient matching | −1.8770 | −5.35 | 0.000 | −0.1290 | −2.08 | 0.045 |
| Identification of nutrient deficiency symptom | 0.1076 | 0.82 | 0.490 | −0.0847 | −0.89 | 0.421 |
| WFIT | −1.1797 | −4.15 | 0.000 | −0.1887 | −2.87 | 0.007 |
| STFFT | −0.0567 | −0.19 | 0.913 | −0.1164 | −1.77 | 0.084 |
| Risk lover | −0.2098 | −0.89 | 0.416 | 0.0457 | 0.68 | 0.489 |
| Risk averse | 1.1936 | 2.11 | 0.039 | 0.2982 | 2.23 | 0.027 |
| Fertilizer selection | 0.0745 | 0.28 | 0.805 | 0.1308 | 1.33 | 0.188 |
| Awareness of CF pollution | −0.0474 | −0.12 | 0.933 | 0.0511 | −0.73 | 0.534 |
| Grape income ratio | −1.3162 | −2.96 | 0.006 | −0.2915 | −2.48 | 0.016 |
| Planting scale | 0.0614 | 1.05 | 0.202 | −0.0599 | 0.22 | 0.850 |
| Constant | 3.1737 | 4.96 | 0.000 | 0.5630 | 6.16 | 0.000 |
| Sample size | 235 | 181 | ||||
| Log likelihood = −63.01 | F = 13.23 | |||||
© 2020 by the authors. Licensee MDPI, Basel, Switzerland. This article is an open access article distributed under the terms and conditions of the Creative Commons Attribution (CC BY) license (http://creativecommons.org/licenses/by/4.0/).
Share and Cite
MDPI and ACS Style
Xue, C.; Zhang, T.; Yao, S.; Guo, Y. Effects of Households’ Fertilization Knowledge and Technologies on Over-Fertilization: A Case Study of Grape Growers in Shaanxi, China. Land 2020, 9, 321. https://doi.org/10.3390/land9090321
AMA Style
Xue C, Zhang T, Yao S, Guo Y. Effects of Households’ Fertilization Knowledge and Technologies on Over-Fertilization: A Case Study of Grape Growers in Shaanxi, China. Land. 2020; 9(9):321. https://doi.org/10.3390/land9090321
Chicago/Turabian StyleXue, Caixia, Tingting Zhang, Shunbo Yao, and Yajun Guo. 2020. "Effects of Households’ Fertilization Knowledge and Technologies on Over-Fertilization: A Case Study of Grape Growers in Shaanxi, China" Land 9, no. 9: 321. https://doi.org/10.3390/land9090321
Note that from the first issue of 2016, this journal uses article numbers instead of page numbers. See further details here.