Article

Land Use Transition and Its Eco-Environmental Effects in the Beijing–Tianjin–Hebei Urban Agglomeration: A Production–Living–Ecological Perspective

1
Institute of Geographic Sciences and Natural Resources Research, Chinese Academy of Sciences, Beijing 100101, China
2
Faculty of Geographical Science, Beijing Normal University, Beijing 100875, China
3
College of Resource and Environment, University of Chinese Academy of Sciences, Beijing 100049, China
*
Author to whom correspondence should be addressed.
Land 2020, 9(9), 285; https://doi.org/10.3390/land9090285
Submission received: 24 July 2020 / Revised: 16 August 2020 / Accepted: 19 August 2020 / Published: 21 August 2020
(This article belongs to the Section Land Systems and Global Change)

Abstract

:
With the rapid development of urbanization and industrialization, China’s metropolitan areas have experienced dramatic transitions of land use, which has had a profound impact on the eco-environment. Accordingly, the contradictions of regional production, living, and ecological spaces have intensified. In this context, analysis of the dynamics of regional production–living–ecological (PLE) spaces has become an important entry point for studying land use transition and its eco-environmental effects, by constructing a classification system of PLE land functions. Using remote sensing data from four periods from 1985 to 2018, this paper explores the spatiotemporal evolution characteristics of PLE spaces and their eco-environmental effects in the Beijing–Tianjin–Hebei (BTH) urban agglomeration, based on GIS and the InVEST model. The results revealed that from 1985 to 2018, the living space of the BTH region expanded rapidly, the production space gradually shrank, and the ecological land remained relatively stable. The eco-environmental quality index within the study area shows obvious regional differences, demonstrating the spatial distribution of “high in the northwest and low in the southeast”, and an overall deteriorating trend in the past 33 years. Moreover, the carbon density decreased gradually from northwest to southeast, and the transformations from production land into living land and from ecological land into production land were the major types of eco-environment deterioration. Our findings will provide guidelines for land use management, and offer references for the functional division of PLE spaces and ecological civilization construction, especially in terms of the coordinated development of the BTH region.

1. Introduction

The land system is an essential part of the earth’s terrestrial system, and is also the main carrier of urban–rural spaces [1,2]. Hence, land use transition mirrors natural environment changes [3] and the process of social and economic development [4]. This is a double-edged sword for the sustainable development of the eco-environment. Disordered transitions and unreasonable use may lead to a series of problems related to the deterioration of ecological environments and the decline of ecosystem service function [5,6,7]. For example, from 1900 to 1990, the global cultivated area increased by 56% in response to rapid population growth, which led to a tremendous decrease in forests, especially tropical rainforests [8], and other problems such as biodiversity decline and soil erosion [9,10]. Furthermore, land use transition has a significant influence on the global carbon cycle. It is estimated that since 1850, land use/cover change has caused a 145 PgC loss in global terrestrial ecosystems [11]. On the other hand, the optimal allocation and effective management of land resources are conducive to the improvement of the eco-environment and the promotion of sustainable land utilization [12,13]. For example, studies have revealed that the large-scale greening in China and India that has been occurring since the 21st century can mainly be attributed to agricultural intensification, eco-environmental protection, and afforestation policies, which reflects the importance of land use management for ecological improvement [14]. Under the global background of achieving the Sustainable Development Goals (SDGs) related to life on land [15,16], understanding the regional land use transition process and its eco-environmental effects not only provides important guidelines for resolving the contradictions between humans and land and between urban and rural areas [17,18], but contributes to the realization of regional sustainable development [19,20]. In recent years, research topics related to land use transition have gradually shifted from theory, mechanisms, and spatiotemporal patterns [21,22,23,24] to functional transformation [25,26], socioeconomic effects [27,28], ecological effects [29,30,31,32], and environmental effects [33,34,35,36] of land use, as well as its interactive mechanism with land resource management, rural transformation, and urban–rural integrated development [17,37,38].
Since the reform and opening up in 1978, rapid economic and social development in China, along with industrialization and urbanization, have fueled huge consumption of forest, agricultural products, and many other resources [39]. As a consequence, extreme land degradation ensued throughout the 1970s, 1980s, and 1990s, such as the nationwide natural forest decline, farmland overexploitation in rural areas, soil erosion and flooding problems in the Loess Plateau, and rangeland degradation and desertification in northern China, which are widely believed to be caused by unsustainable land management [40]. Since entering the new century, the ecological and environmental problems caused by rapid urbanization have become increasingly prominent in China. The expansion of construction land has led to landscape fragmentation, environmental degradation, and ecosystem services destruction [18], along with the loss of agricultural livelihoods and poverty in suburban areas, which are very common consequences during the urbanization process of developing countries [34]. In the face of these problems and challenges, since 2012, China has proposed that the national spatial development pattern should be shifted from the production-space-oriented mode to the coordinated production–living–ecological (PLE) space mode, so as to optimize the spatial distribution of land and alleviate the contradiction between urban and rural development. Production space provides products and services for human survival and livelihoods; living space, dominated by living functions, is a space for human beings to carry out various activities in order to meet their needs of living, consumption, entertainment, medical treatment, and education; ecological space provides ecological products and services needed for the formation of the ecological system and ecological processes, maintaining natural conditions [41,42] (Figure 1).
With the popularity of the “three pillars” theory of sustainable development, many scholars have carried out a lot of research related to PLE spaces, including around its concept and connotations [43,44], land classification system [42,45,46], spatial identification [47,48], and coupling coordination of the PLE functions [49,50]. Existing research provides a theoretical and empirical basis for regional sustainable development, but there are few studies on resource and environment effects from the perspective of production–living–ecological spaces. In this context, an in-depth analysis of the mutual transformation and eco-environmental effects of regional PLE spaces has become an important entry point for the study of land use transition, which is of great significance to the role of land resource management in ecological improvement and the spatial optimization of the urban–rural structure. In addition, the classification of the PLE space is the foundation of territory spatial planning [47]. The spatial functions of the PLE space are often interwoven and overlapping, forming a single or composite functional type. Therefore, the PLE space is defined by the dominant function type [41,51], aiming to form a pattern of multifunctional coordination belonging to one of the multifunctional zoning types [52]. Yet, there is currently no unified method and standard for the quantitative identification and measurement of the PLE space. Generally, there are two main methods for identifying and classifying the PLE space. One is the evaluation system method, based on the PLE function; that is, the function evaluation and classification of the PLE space by establishing a comprehensive evaluation index system [49,50,51]. Due to the availability of data, this method mostly conducts research at the medium- and macroscales, such as cities, counties (districts), or towns. The other is the spatial classification method, based on land use types; that is, the merging and reclassification of land use types according to the leading function of the land, which is based on the spatial division of microscales such as grids or patches [42]. Considering that the latter method can quickly identify the spatial distribution of the PLE space and reflect the land function in terms of the land use structure, this paper studies the land use transition and its eco-environmental effects from the perspective of the PLE space by constructing the reclassification system of PLE land.
The Beijing–Tianjin–Hebei (BTH) metropolitan region is not only the national capital region of China but is also, by far, the biggest urbanized region in eastern Asia [53]. Over the past decades, this region has undergone rapid urbanization, population growth, and intensive land use transition, characterized by a remarkable degree of built-up land expansion [54,55]. Accordingly, it has become ecologically fragile and faces serious eco-systemic functional degradation and eco-environmental problems [56]. Based on the studies of three major urban agglomerations in China, it has been found that urban expansion in the Beijing–Tianjin–Hebei region, Yangtze River Delta, and Pearl River Delta has resulted in the loss of ecosystem service value of 9.05 billion yuan, 8.35 billion yuan, and 1.24 billion yuan, respectively, and the degradation of ecosystem services in the BTH urban agglomeration is the most significant [57]. Moreover, carbon emission reduction is considered a considerable burden for regional sustainable development [58,59]. In this context, this research looks at the BTH metropolitan region as the research area. Specifically, our objectives were to (1) quantify the spatiotemporal changes of land use categories from the perspective of production-living-ecology land use functions in the BTH region between 1985 and 2018; (2) analyze the dynamics of eco-environmental quality by constructing an evaluation index, and then study the ecological contribution of land use transition; and (3) examine carbon dynamics and their relationship to land use transition through estimating carbon stocks using the InVEST model.

2. Materials and Methods
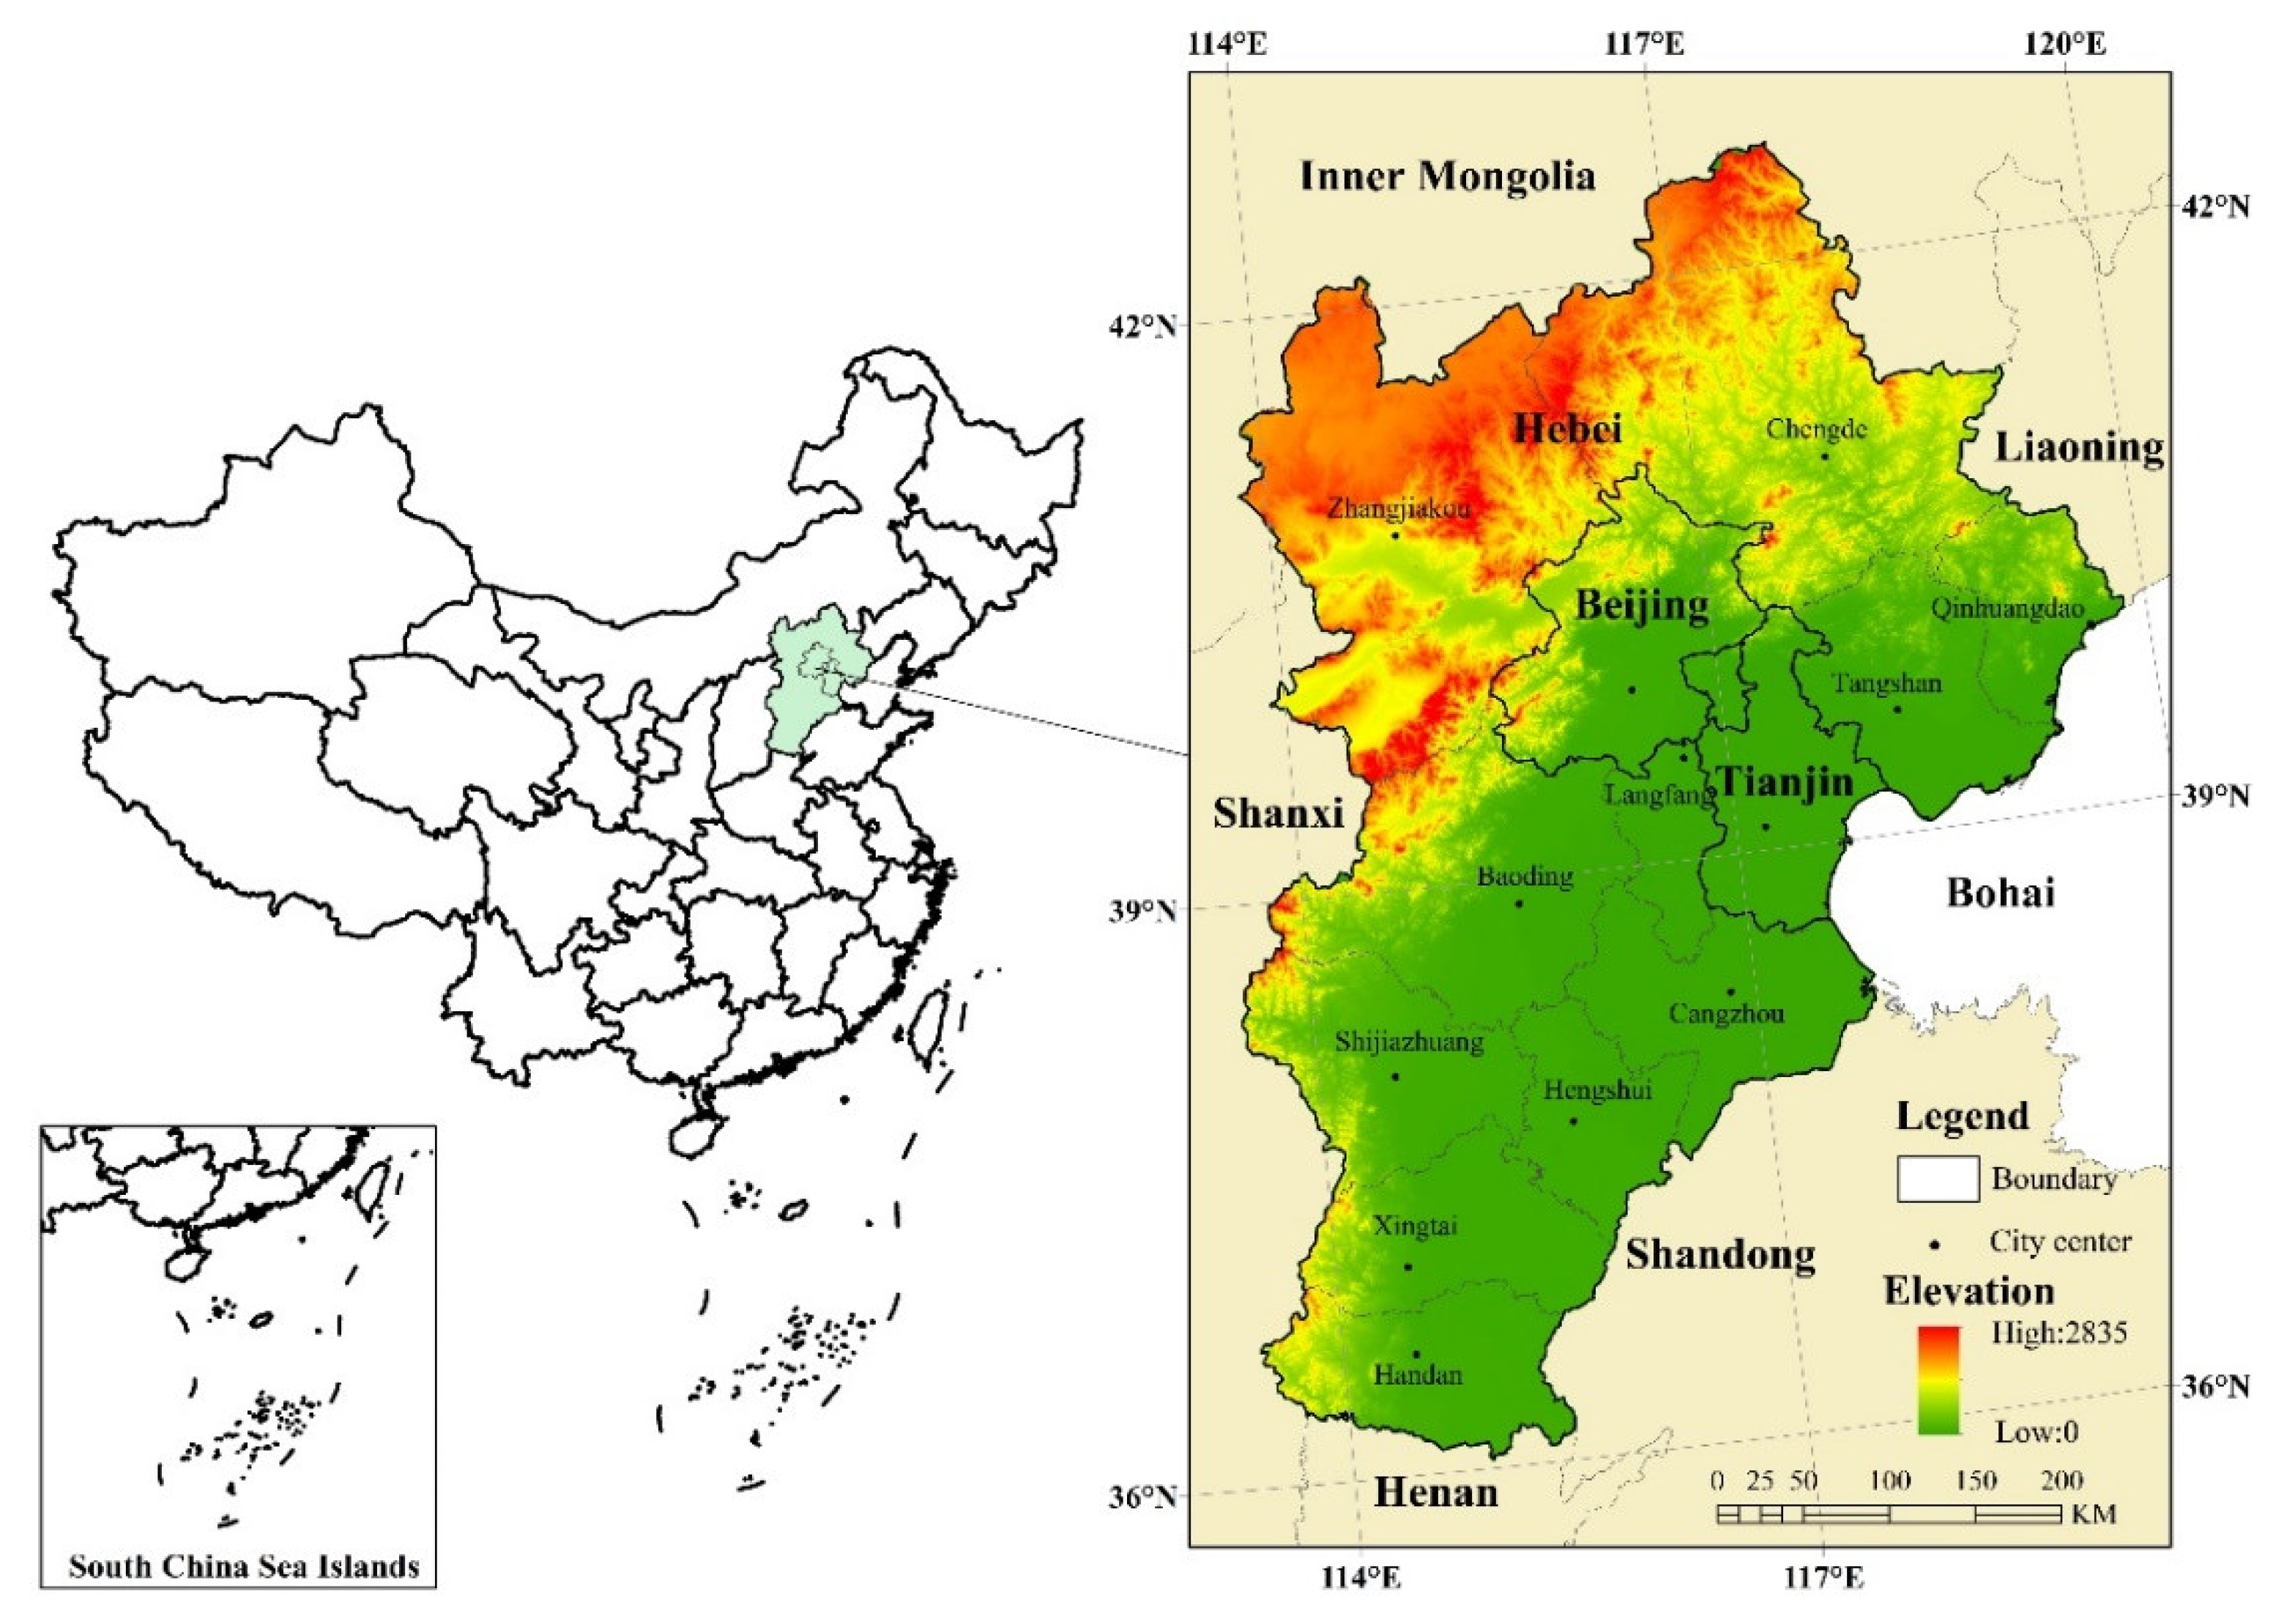
2.1. Study Area

The Beijing–Tianjin–Hebei (BTH) region is one of the most developed word-class urban agglomerations in China [60,61]. It is located between 113°04′–119°53′ E and 36°01′–42°37′ N, with a total area of approximately 216,000 km2. This region includes two municipalities (Beijing and Tianjin) and 11 prefectural cities (Shijiazhuang, Tangshan, Qinhuangdao, Baoding, Zhangjiakou, Chengde, Langfang, Cangzhou, Handan, Hengshui, and Xingtai) in Hebei province (Figure 2). The BTH region is characterized by a typical warm-temperate semihumid and semiarid continental monsoon climate, with a mean annual temperature ranging from 11.5 to 12.5 °C and annual precipitation ranging from 531 mm to 644 mm. The terrain of the whole area slopes from northwest to southeast, which connects with Yanshan Mountain in the north, Taihang Mountain in the west, and Bohai Bay in the east, so there are mountainous, hilly, and plateau areas in the northwest, with basins and valleys distributed among them, while vast plains dominate the central and southeast. The distribution of vegetation in this area shows vegetation zonality and a vertical distribution [62].
The BTH region is an urban-dense area and an economically developed area in North China, which bears 8.1% of the country’s population with 2.3% of the country’s land. In the past 30 years, urbanization has developed rapidly, and the average size of the city has expanded by 3.7 times [63]. By the end of 2019, the BTH region had a resident population of 113 million people, with a population urbanization rate of 66.7% and a regional GDP of 8.46 trillion yuan. However, with the continuous advancement of urbanization and industrialization, the contradiction between production, living, and ecological spaces has become increasingly prominent, mainly reflected in: (1) the rapid nonagricultural process of rural production factors, and the contradiction between urban and rural land use, have become more and more prominent. About 80% of the incremental urban land in Beijing from 1985 to 2010 came about at the expense of rural residential land (23.42%) and cultivated land (57.14%) [64]; (2) the problems of environmental pollution and ecological destruction have not been effectively solved. At present, the decline in the carrying capacity of the ecological environment, the unreasonable consumption of resources, and the destruction of living space have increased the difficulty of ecological construction in the BTH region.

2.2. Data Sources

Raster land use/cover maps in 1985, 1995, 2005, and 2018 at 100 m × 100 m spatial resolution in the BTH region were downloaded from the Resource and Environmental Science Data Center of the Chinese Academy of Sciences (http://www.resdc.cn). The dataset was obtained through artificial visual interpretation based on remote sensing image data, which is the most accurate land use remote sensing monitoring data in China. The digital grids were classified into six first-level land types, including cultivated land, forestland, grassland, water, residential land, and unused land, and 25 s-level land types. The comprehensive accuracy of the first-level land category is above 94.3%, and the comprehensive accuracy of the second-level land category is above 91.2% [65].

2.3. Methods

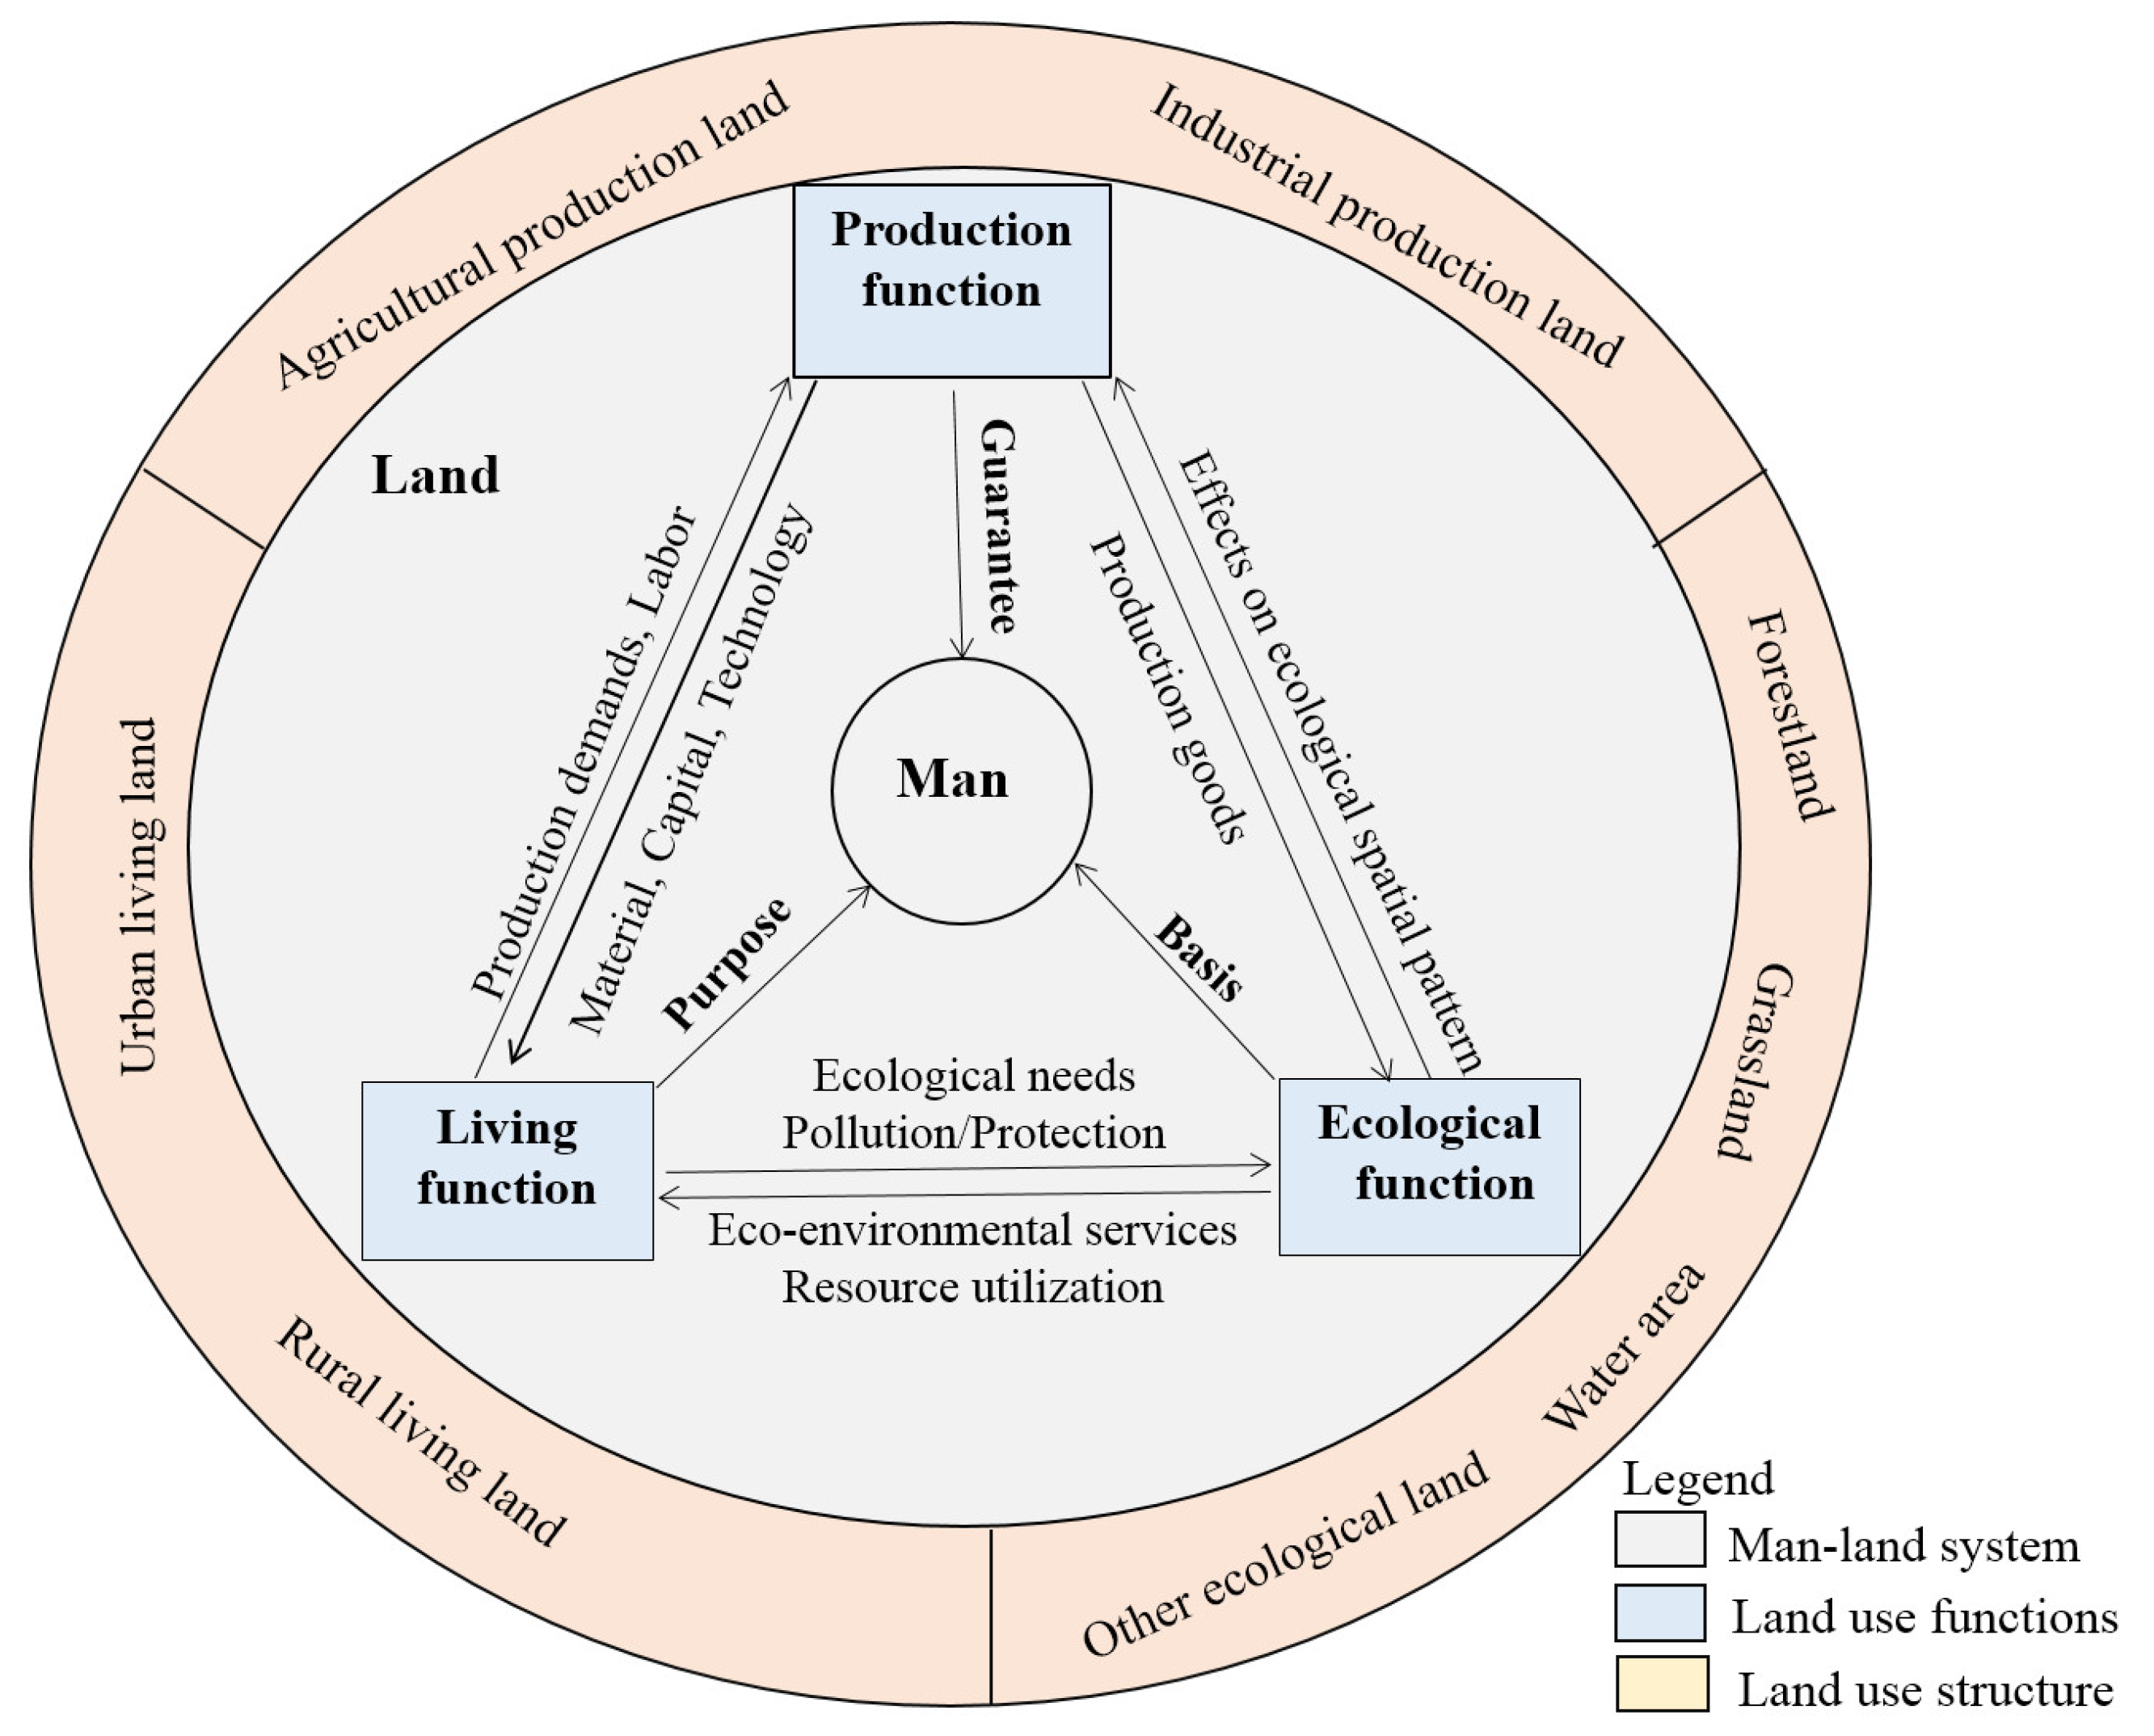
2.3.1. Classification of Production–Living–Ecological Land

Production land refers to land for agricultural, industrial, and commercial activities, used for obtaining products and supplying functions, whereas living land refers to that which carries and protects human settlements, and ecology land is that which regulates, maintains, and protects the function of ecological security [51]. One land use type often has a leading function, despite its multiple functions. According to the principles of scientificity, practicability, and leading functionality, the dominant function of land use is determined based on the subjective land use intention of the behavior subject [45]. For example, cultivated land not only has the function of food production, but also has an ecological function of regulating the local climate and conserving water and soil. However, the subjective intention of human beings using cultivated land is mainly to produce grain. Therefore, it is classified as production land. According to this classification principle, the classification system of production–living–ecological (PLE) land has been established.
Meanwhile, extant studies have evaluated the eco-environmental quality index of different land use types by establishing the relationship between land use types and the corresponding ecological environment qualities. For example, Li et al. [66] explored the expert-assessment method to calculate the eco-environmental quality index of each second-level land use type in the Hexi region of China. Specifically, several experts in the fields of land use science and eco-environmental sustainability were selected; the eco-environmental quality of each land use was scored according to the experts’ knowledge and experience, and the arithmetic mean of these scores of each land use was computed and the data were normalized into the range of [0, 1], which was taken as the final value. In view of the wide application of this index system in China, it reflects China’s actual situation of ecosystem services well [67,68,69,70,71], and this article hence directly adopted it without adjustment as the environmental quality index of each secondary type of basic land use classification. Then, the eco-environment quality index of the PLE land was calculated by taking the average proportions at four time points of each secondary type from the basic land use classification in corresponding subclasses from PLE land classification, using the area weighting method (Table 1).

2.3.2. Land Use Transfer Matrix

A land use transfer matrix is used to analyze the transformation of the PLE land structure. This method can be used to calculate the quantity and direction of land use transfer among different types of land use. It is usually used to study the transfer characteristics of land use types from the beginning to the end of a study period. The mathematical expression is as follows:
S i j = [ S 11 S 1 n S n 1 S n n ]
where S is the land area; N is the number of land types; i is the land type at the beginning of the time period; and j is the land type at the end of the time period. When ij, Sij represents the area transferred from type i to type j; when i = j, Sij represents the area of the land type that remains unchanged.

2.3.3. Measure of Eco-Environmental Effects of Land Use Transition

(1)
Eco-environmental quality index. The eco-environmental quality index (E) is a quantitative description of the overall eco-environmental quality of each region (unit), found by evaluating the different ecological quality levels of PLE land. It aims to calculate the change of area of the PLE land in different periods. Grid sampling of the land use was used to spatialize the eco-environmental quality index, and the E value of each unit was calculated as the regional eco-environmental quality index of the sampling center. The calculation in Equation (2) is as follows:
E i = j = 1 n S i j S i M j
where Ei is the eco-environmental quality index of the i unit; Mj is the eco-environmental quality index of the j type of land use (Table 1); Sij is the area of land type j in the i unit; Si is the total land area of the i unit; and n is the number of land use types in the study area.
Due to the strong scale dependence of geospatial data, different conclusions might be reached by selecting different research scales. Hence, in order to obtain the optimal scale, this study selected a grid size of 2 km × 2 km to carry out equidistant sampling.
(2)
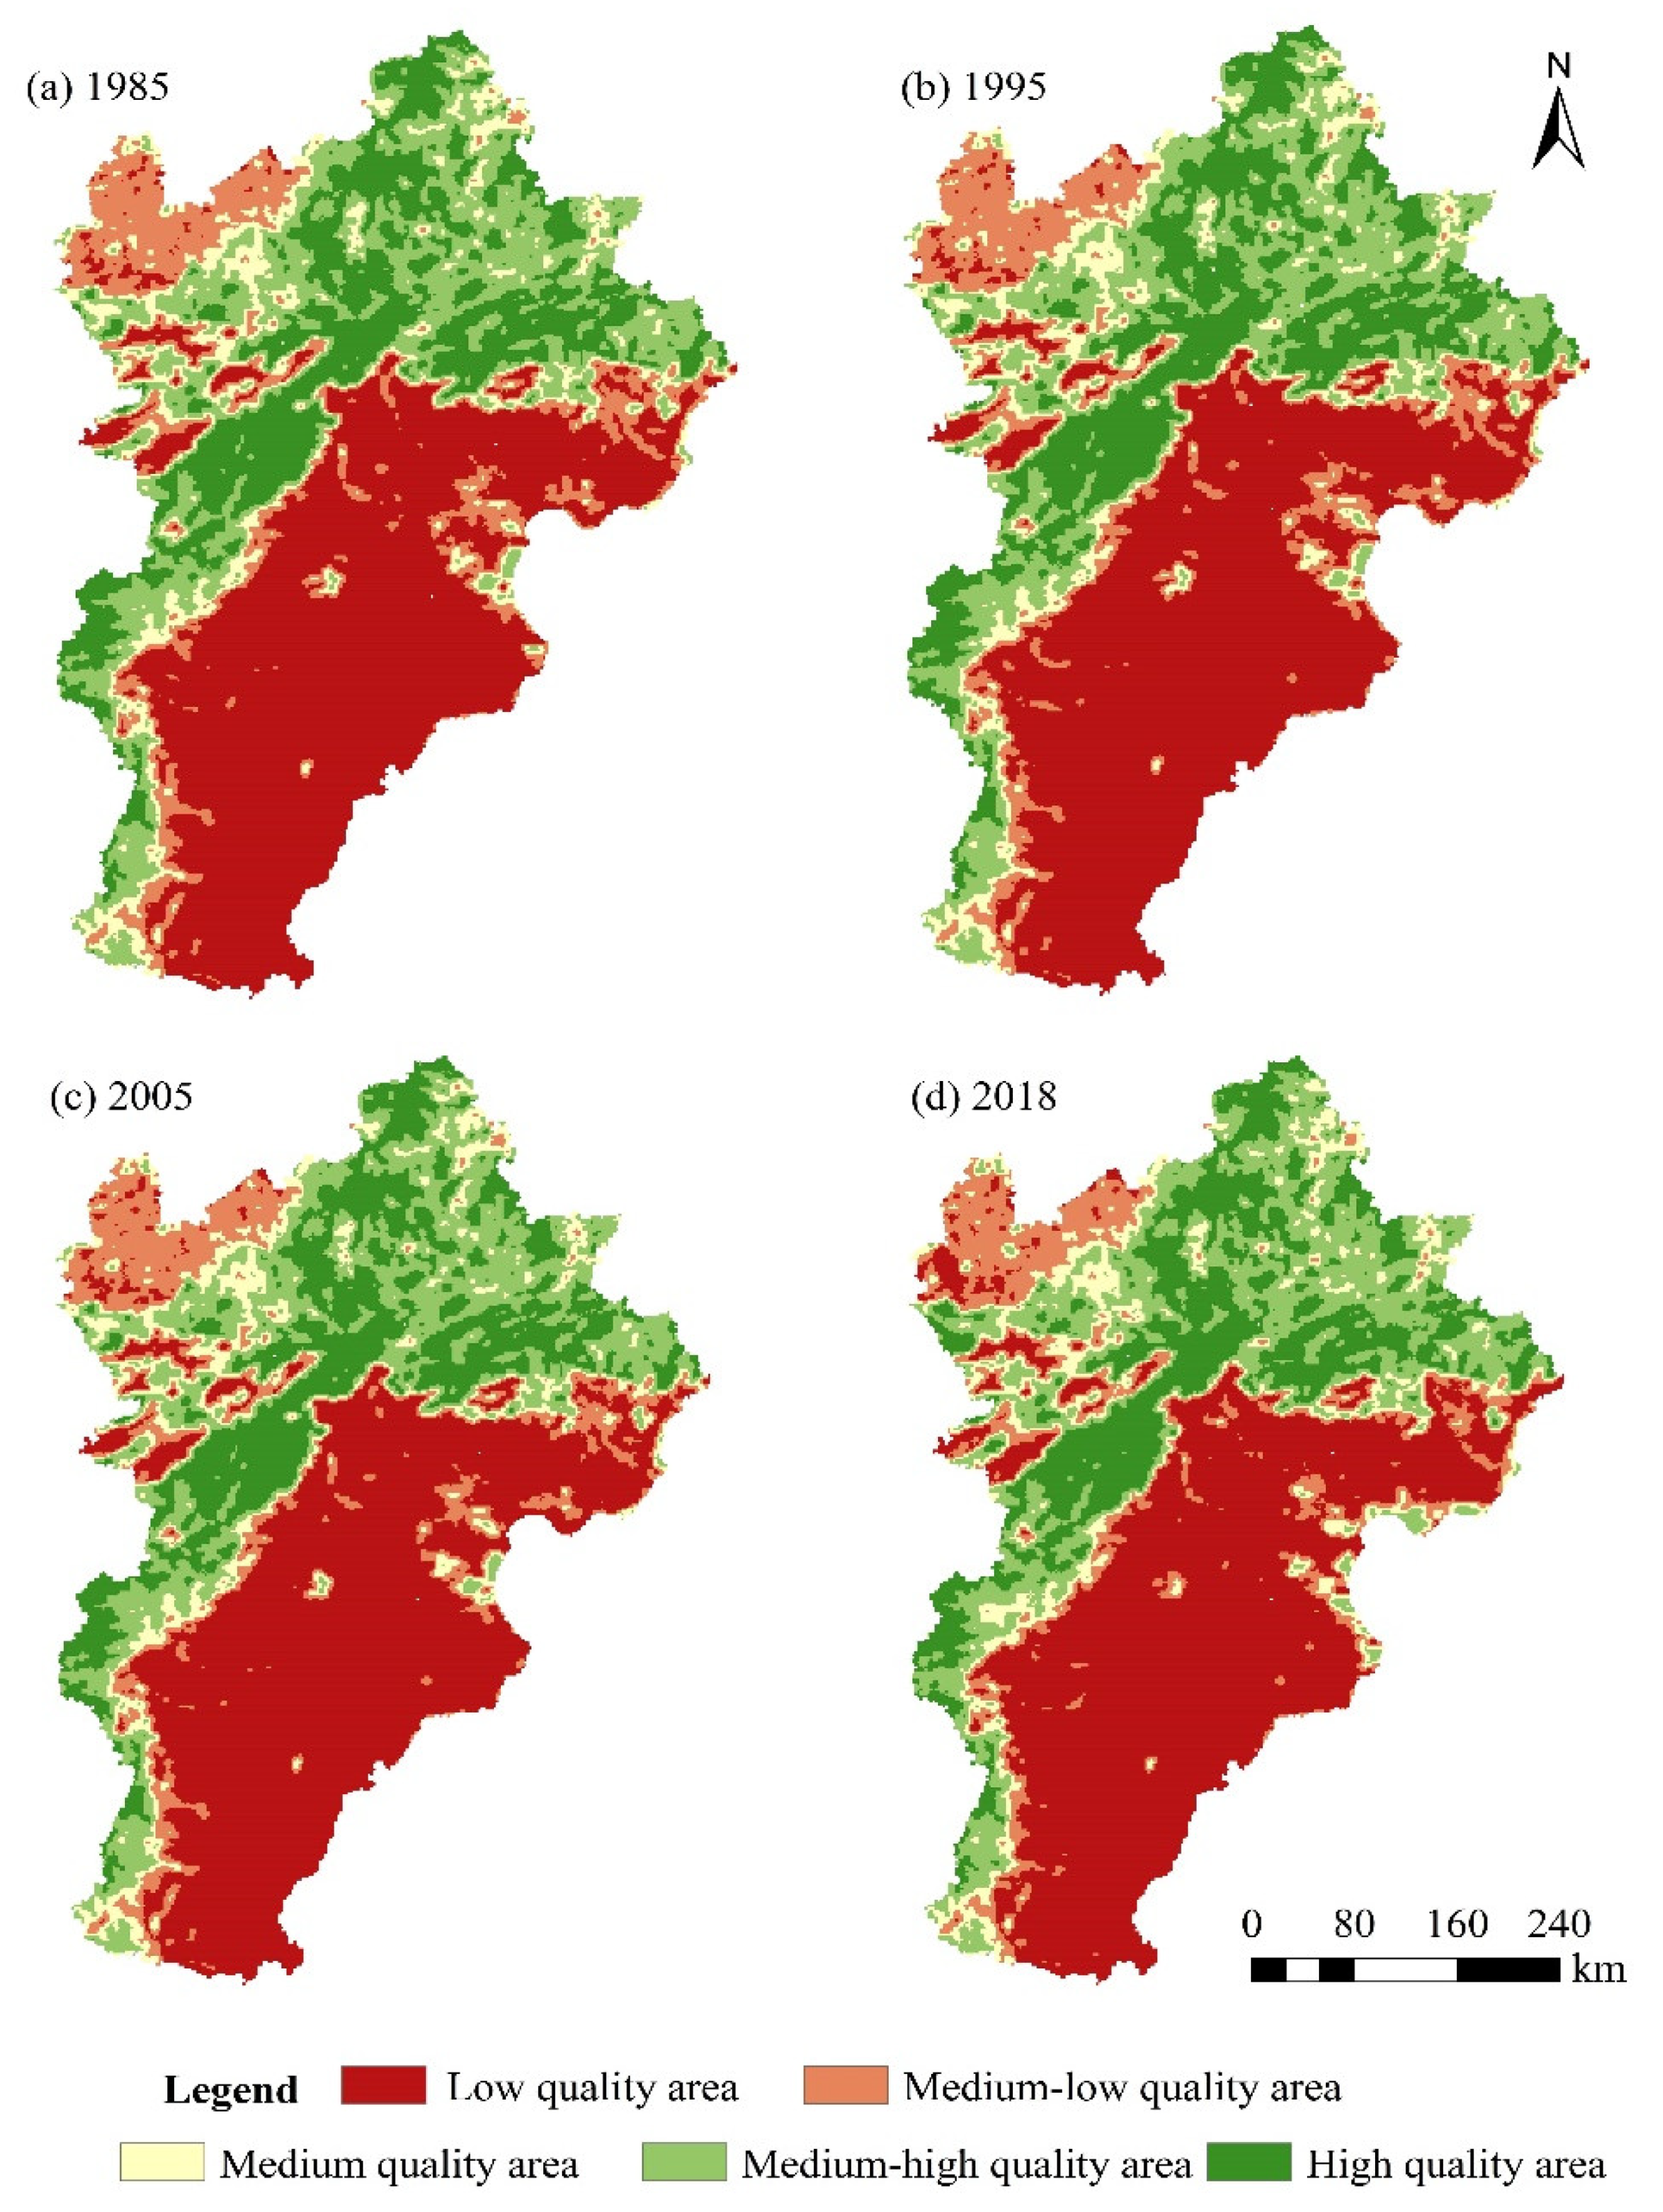
Geostatistical analysis. The spatial analysis of regional eco-environmental quality was realized by the geostatistical analysis method. The semivariance analysis method was used to interpolate the regional eco-environmental quality index of the sampling center, so as to obtain the spatial distribution of the eco-environmental quality in the whole study area. The mathematical expression is in the following formula (Equation (3)):
r ( h ) = 1 2 n i = 1 n [ M ( x i ) M ( x i + h ) ] 2
where r(h) is the variation function; h is the spatial distance of the samples; n is the total number of samples with spacing h; and M(xi) and M(xi + h) are the values of the eco-environmental quality index at xi and xi + h.
The Geostatistics Analyst tool in ArcGIS 10.2 was used to perform the statistical analysis on the E values at four time nodes in the BTH region. The results show that the E values follow a normal distribution and have a spatial correlation, so this research employed the ordinary Kriging method for spatial interpolation and the semivariation exponential function. Then, the results were divided into five levels using the natural breakpoint method: low-quality area (E ≤ 0.3), medium-low-quality area (0.3 < E ≤ 0.4), medium-quality area (0.4 < E ≤ 0.5), medium-high-quality area (0.5 < E ≤ 0.65), and high-quality area (E > 0.65).
(3)
Ecological contribution rate of land use transition. The ecological contribution rate of land use transition refers to the change of regional ecological quality caused by the change of land use type. This index quantifies the impact of land use transition on the regional ecological environment, which is conducive to the research on the main factors that induce changes to the regional ecological environment. Its calculation formula is as follows:
L = ( M t + 1 M t ) S c / S
where L is the ecological contribution rate of land use transition; Mt and Mt + 1 are the eco-environmental quality indexes of a certain land type at the beginning and end of the study, respectively; Sc is the area of the changed land use type; and S is the total study area.

2.3.4. Carbon Sequestration Module of the InVEST Model

The carbon sequestration module of the InVEST model, which takes land use data as the main data source, provides a fast and intuitive method for carbon storage estimation, and is widely used in regional carbon storage assessment [72]. Regional carbon storage is composed of four elements: aboveground carbon storage (AGC), belowground carbon storage (BGC), soil organic carbon storage (SOC), and dead organic matter carbon storage (DOC) [73]. The InVEST carbon storage module is combined with land use/cover data to calculate ecosystem carbon storage. Its mathematical expression is shown in Equations (5) and (6).
C i = C i _ a b o v e + C i _ b e l o w + C i _ s o i l + C i _ d e a d
C t o t a l = i = 1 n C i × S i
where i represents the land use type; Ci is the total carbon density of land type i; Ci_above refers to the carbon density of the aboveground biomass of land type i; Ci_below refers to the carbon density of the belowground biomass of land type i; Ci_soil refers to the carbon density of the soil organic matter of land type i; Ci_dead refers to the carbon density of the dead organic matter of land type i; Ctotal is the total carbon storage; Si represents the total area of land type i; and n represents the total number of land use types.
The accuracy of the simulation is determined by the input data and parameters. Therefore, it is necessary to reasonably define the carbon density. The larger the scale, the greater the uncertainty of the results, especially for the choice of carbon density. In this study, we adopted the average value of the carbon density of each land use type based on the published literature in recent years, whose study areas were located in the BTH region [74,75,76,77,78], and built a carbon density database of different land use types for this research (Table 2).

3. Results

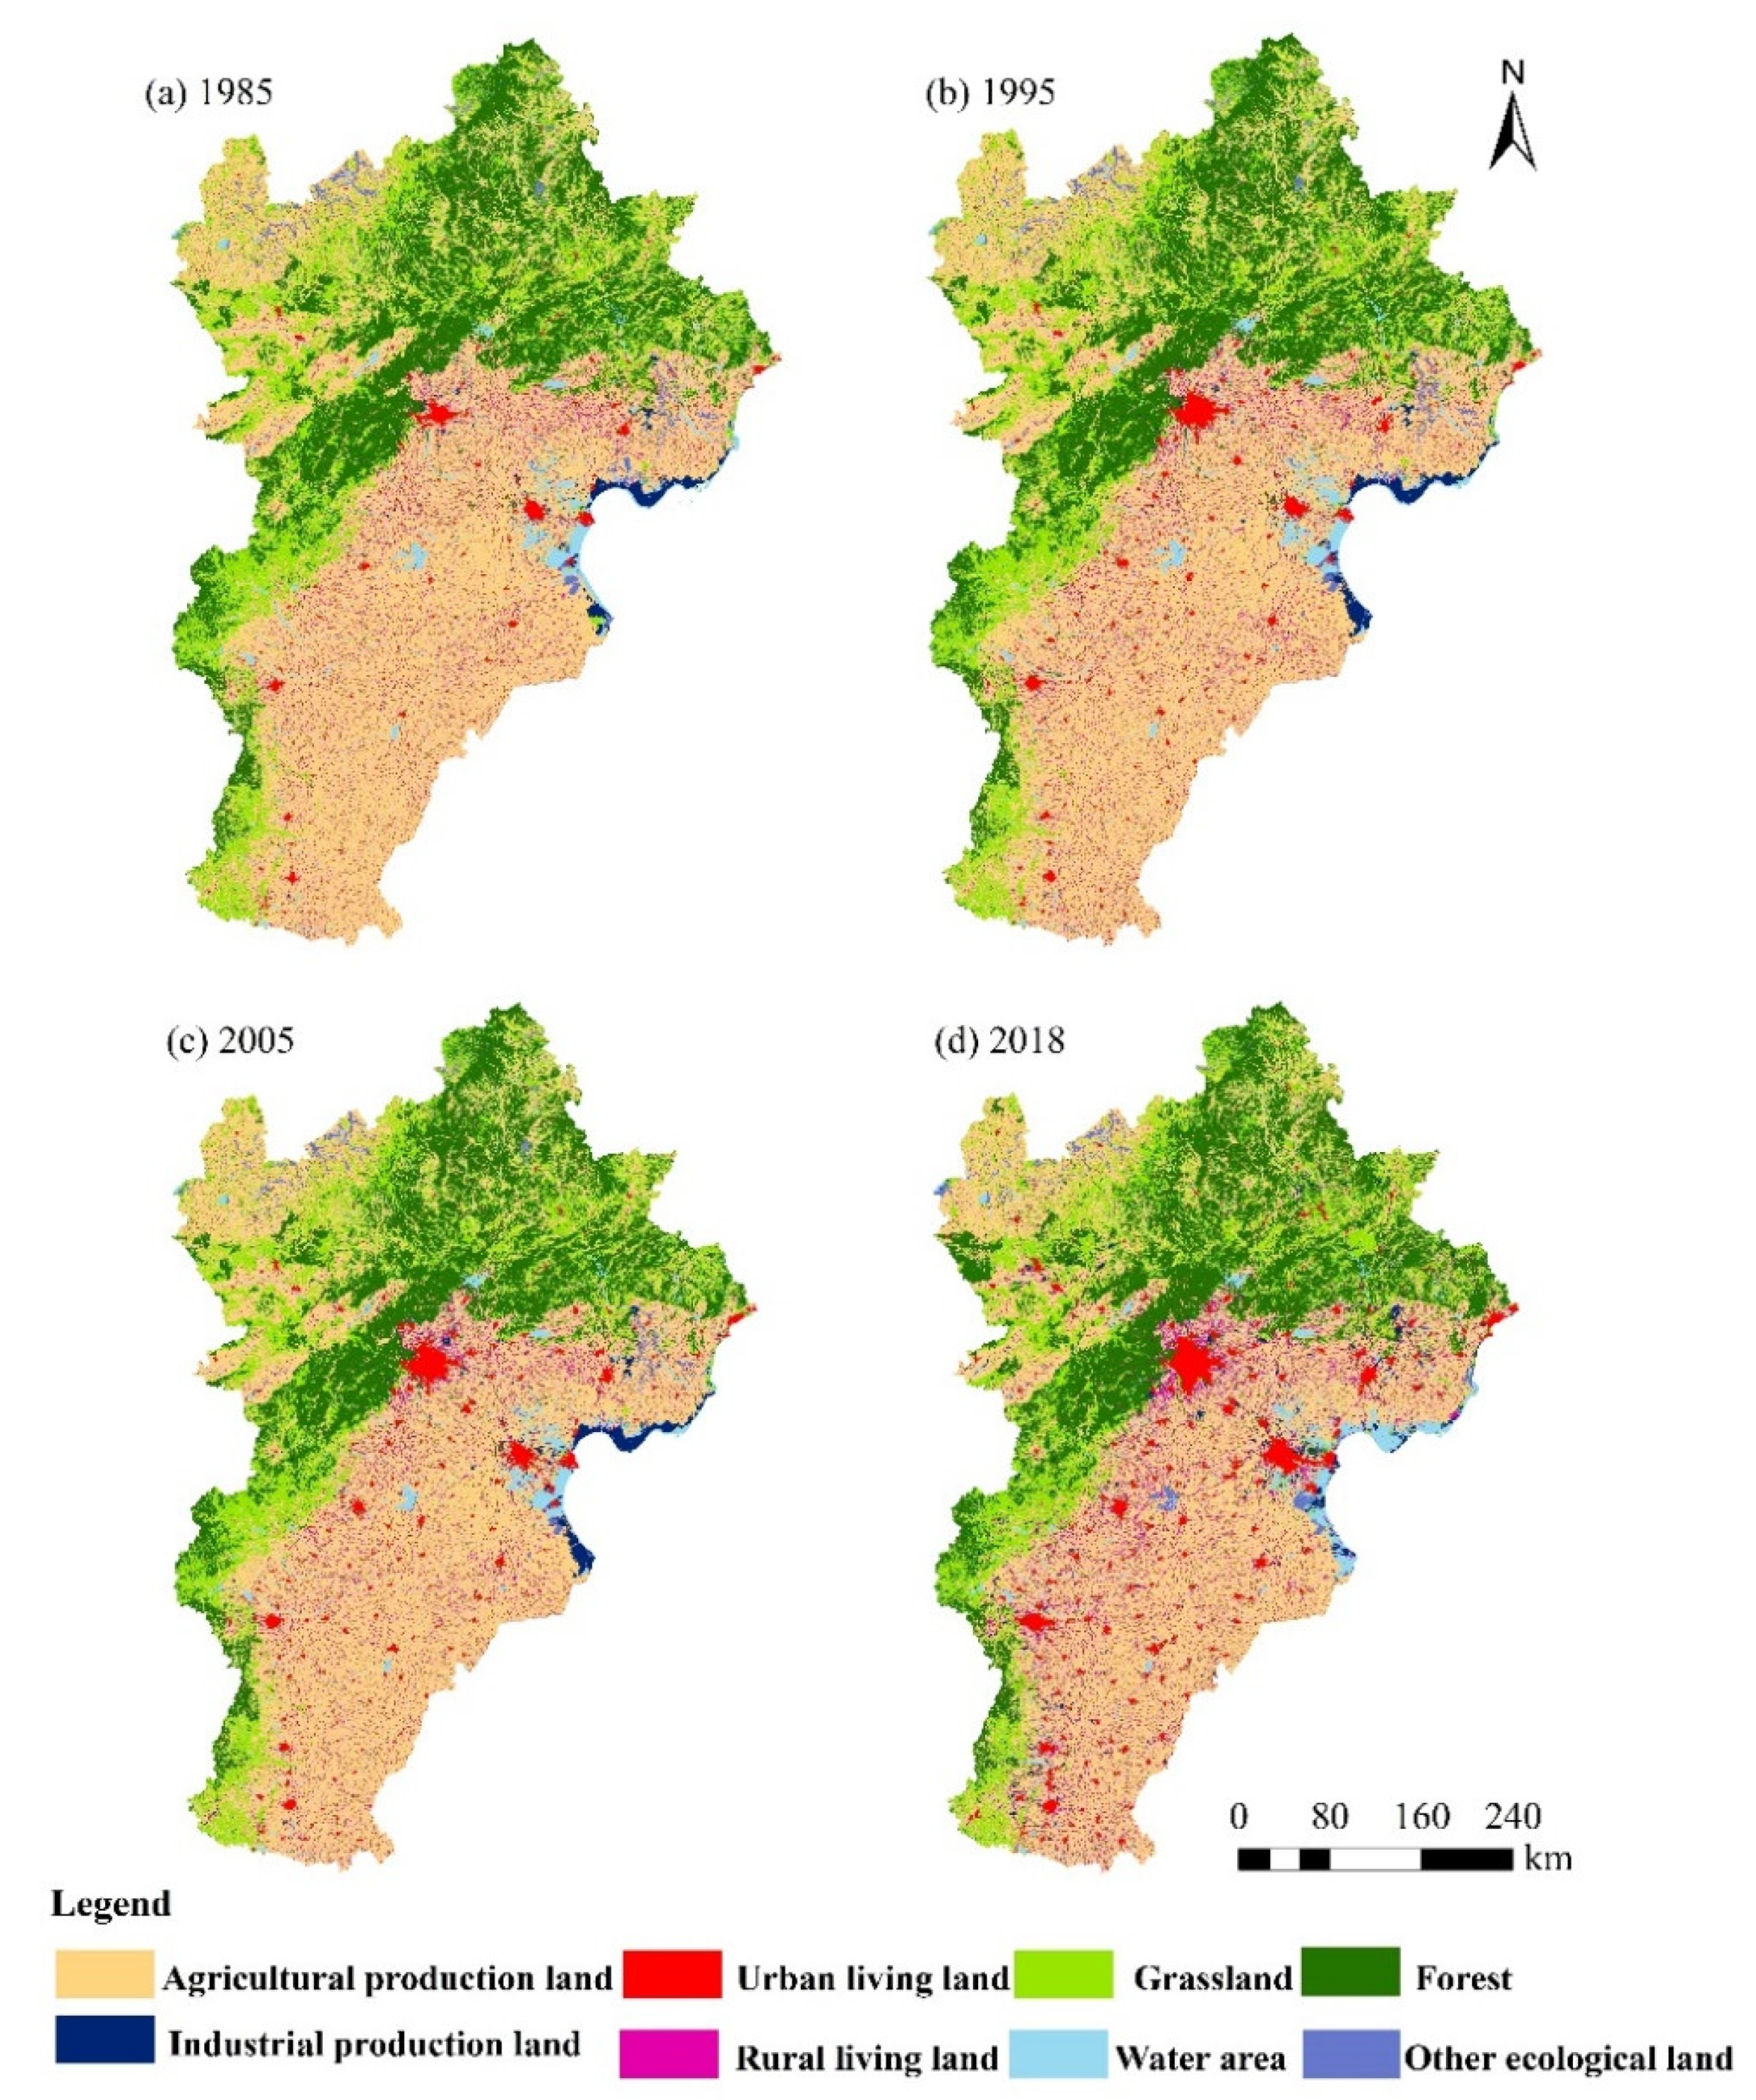
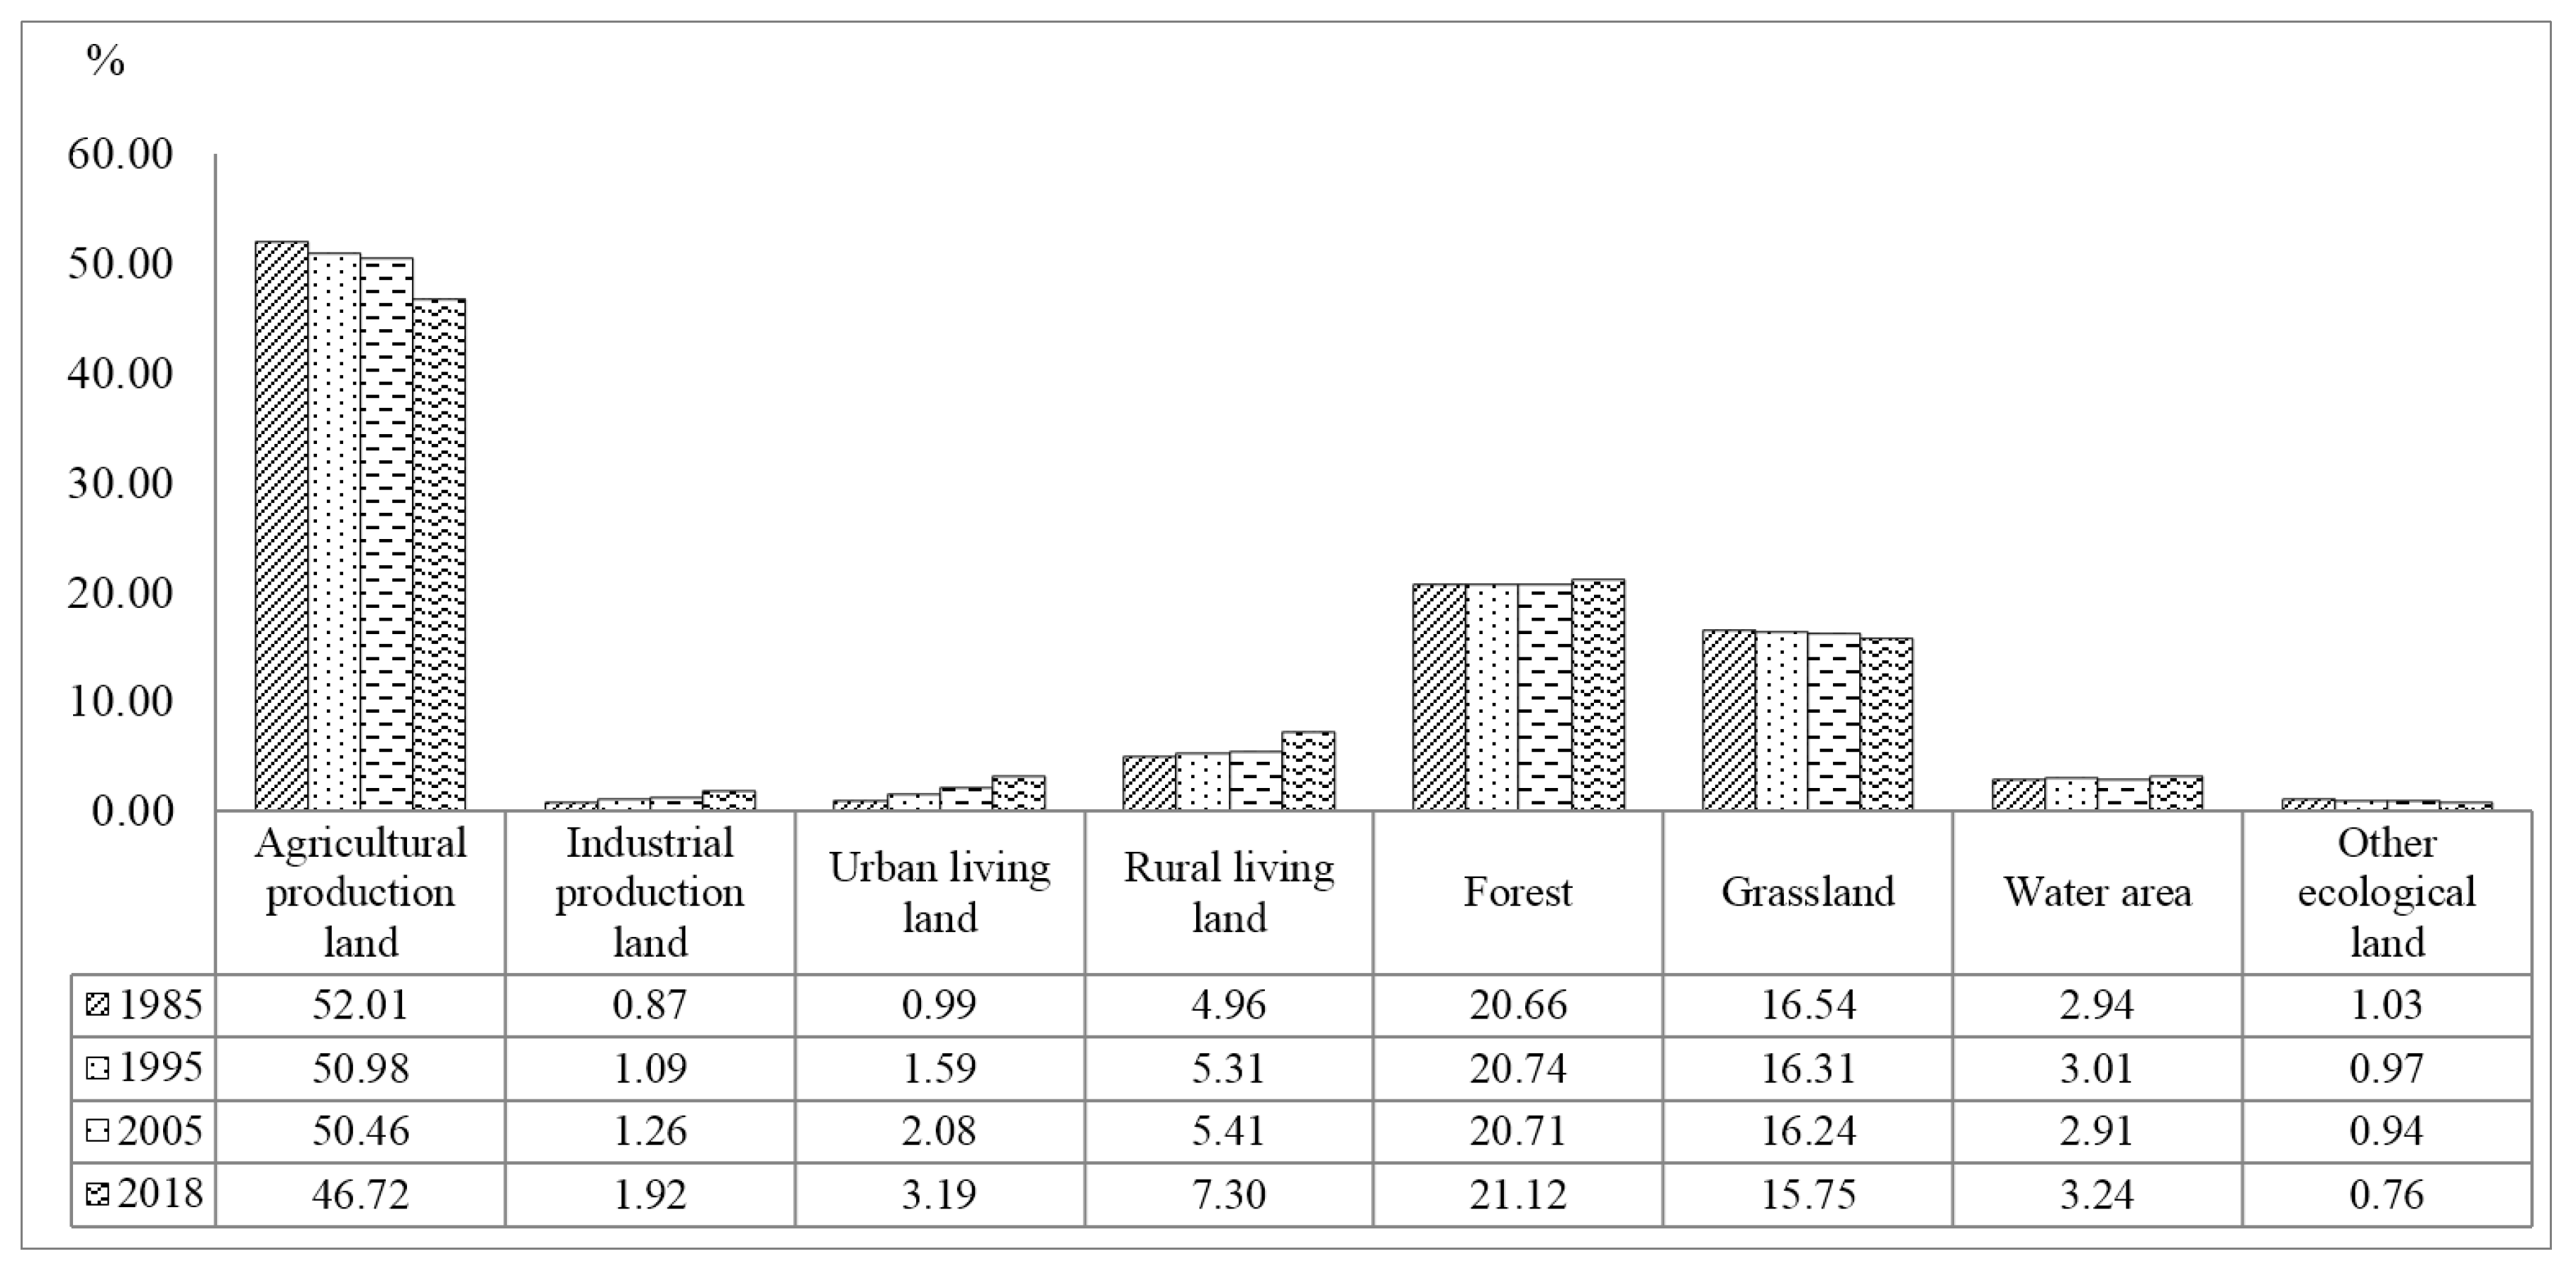
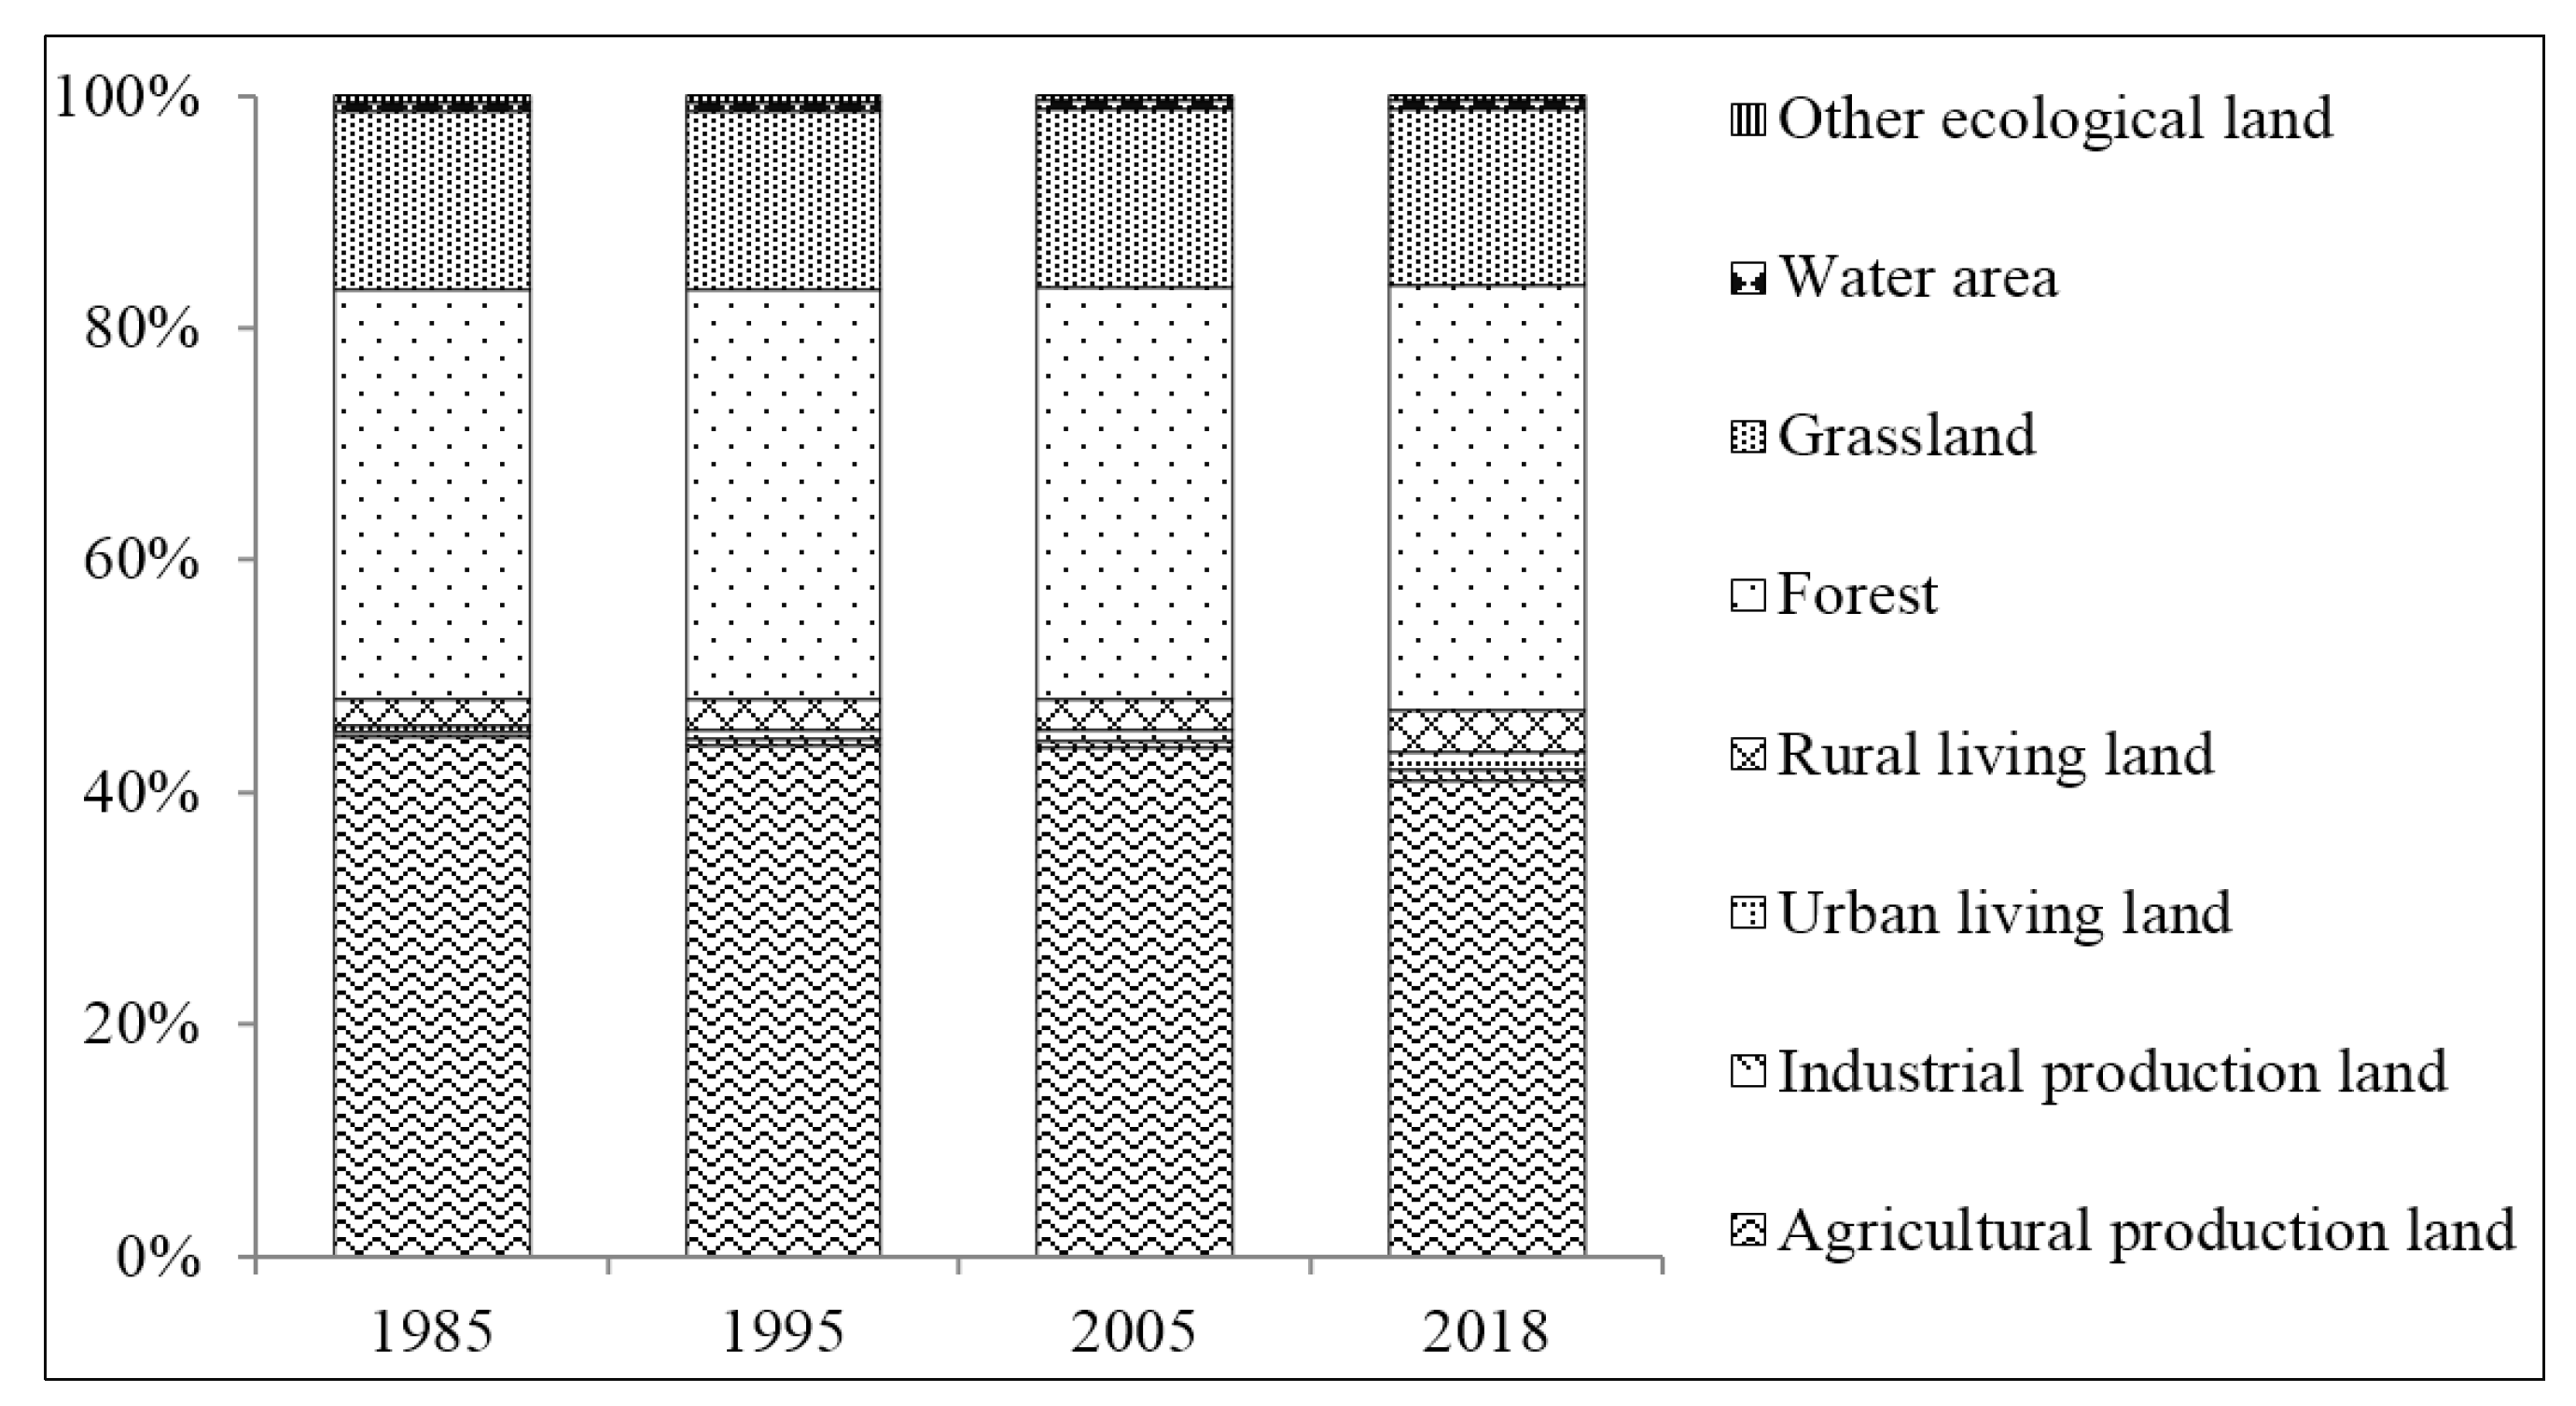
3.1. Land Use Structure

From 1985 to 2018, the BTH region was dominated by production land and ecological land. The average proportions of production land, ecological land and living land at four time points were 51.32%, 40.97%, and 7.71%, respectively. According to the first-level classification of the PLE land, living land changed most intensely; its area increased by 9798.99 km2 during the study period, with an average annual rate of 2.31%. In contrast, production land decreased by 9164.02 km2, while ecological land remained relatively stable. According to the second-level PLE land types, agricultural production land, forestland, and grassland were the most widely distributed, with average proportions of 50.04%, 20.81%, and 16.21% of the total land area, respectively, and the total proportion of the three was as high as 87.06%. Agricultural production land was concentrated in the southeastern plain area, while forestland and grassland were concentrated in the mountainous areas and the upper plateau area in the north and northwest (Figure 3). Within the research period, the land use structure of the BTH region underwent significant changes. Specifically, the agricultural production land and grassland decreased significantly, with the proportions of area dropping by 5.30% and 0.79%, respectively. Meanwhile, the proportions of urban and rural living land and industrial production land increased by 2.20%, 2.34%, and 1.05%, respectively (Figure 4). Urban living land showed the largest increase, with an average annual growth rate of 6.76%. On the whole, the BTH metropolitan area experienced the rapid expansion of living space and the shrinking of production space over the past 33 years.

3.2. Transition of PLE Land Use

The transition matrix was used to analyze the direction and quantity of changes among different land types (Table 3), and the characteristics of the PLE land use transitions in the BTH region from 1985 to 2018 were as follows:
(1)
Production land: agricultural production land continuously decreased from 1985 to 2018. From 1985 to 1995, it mainly transferred to rural and urban living land, grassland and forestland, with transfer rates of 32.63%, 21.91%, 14.63%, and 14.49%, respectively; between 1995 and 2005, it mainly converted to urban and rural living land and industrial production land, with transfer rates of 45.30%, 22.66%, and 17.85%, respectively; from 2005 to 2018, agricultural production land decreased the most, mainly to rural living land and urban production land, with transfer rates of 39.91% and 13.22%, respectively. Industrial production land showed a continuous increasing trend in the study period, and was mainly converted from agricultural production land, with contribution rates as high as 49.32%, 62.10%, and 56.26% in the three time intervals, respectively.
(2)
Living land: urban and rural living land increased significantly, mainly from agricultural production land from 1985 to 2018. At three time intervals, the contribution rates of agricultural production land to new urban living land were 75.47%, 69.47%, and 70.00%, respectively, while its contribution rates to new rural living land were 96.14%, 88.55%, and 84.65%, respectively.
(3)
Ecological land: grassland decreased continuously, and was mainly converted to agricultural production land and forestland. The largest transition of grassland occurred between 2005 and 2018, related to the human activities of land reclamation and afforestation to establish the BTH ecological barrier. The area of forestland decreased slightly from 1995 to 2005, but showed increasing trends during other periods. In particular, forestland experienced the largest increase from 2005 to 2018, which was mainly derived from grassland and agricultural production land. Water and other ecological land remained relatively stable during the study period.

3.3. Eco-Environmental Effects of Land Use Transition

3.3.1. Characteristics of Eco-Environmental Quality

Based on Equation (2), the E values of the BTH region in 1985, 1995, 2005, and 2018 were 0.4306, 0.4295, 0.4282, and 0.4267, respectively, which represents a downward trend and reveals that the general quality of the regional eco-environment has deteriorated during the study period. From 1985 to 2018, the area of low-quality areas remained at around 41% (Table 4), which is the largest type. The ratio of medium-high-quality areas and high-quality areas fluctuated during the time period. Specifically, the area ratio of medium-high-quality areas showed a “decrease→increase→decrease” route at three time periods. Yet, the fluctuation characteristics of high-quality areas were the opposite of those of medium-high-quality areas. Their proportion of area increased from 1985 to 1995, and fell sharply to 17.22% by 2005, and then increased to 17.81% by 2018. The area proportion of the medium-low-quality areas continuously decreased from 1985 to 2005, and the area had slightly expanded by 2018. The area proportion of the medium-quality areas remained relatively stable. On the whole, an expanding area of low-level eco-environmental quality led to regional environmental deterioration over the past three decades in the BTH region.
From 1985 to 2018, the E values of the BTH region exhibited the spatial distribution of “high in the northwest and low in the southeast”, with obvious regional differences and small time-series changes in the overall spatial pattern (Figure 5). High-quality areas were mainly located at the foot of the Taihang Mountain and Yanshan Mountain in the west, with the main land use types of forestland and grassland. Due to the local topography and landform, the development of industry and urban expansion were restricted, leaving the local eco-environment less damaged. The medium-low-quality areas were mainly distributed in Bashang Plateau in the north, with agricultural production land as the leading land use type. The low-quality areas were mainly concentrated in the southeast plain areas, which expanded by 2353.66 km2 during the study period. The dominant land use types were agricultural production land, and urban and rural living land.

3.3.2. Contribution of Land Use Transition to Eco-Environmental Quality
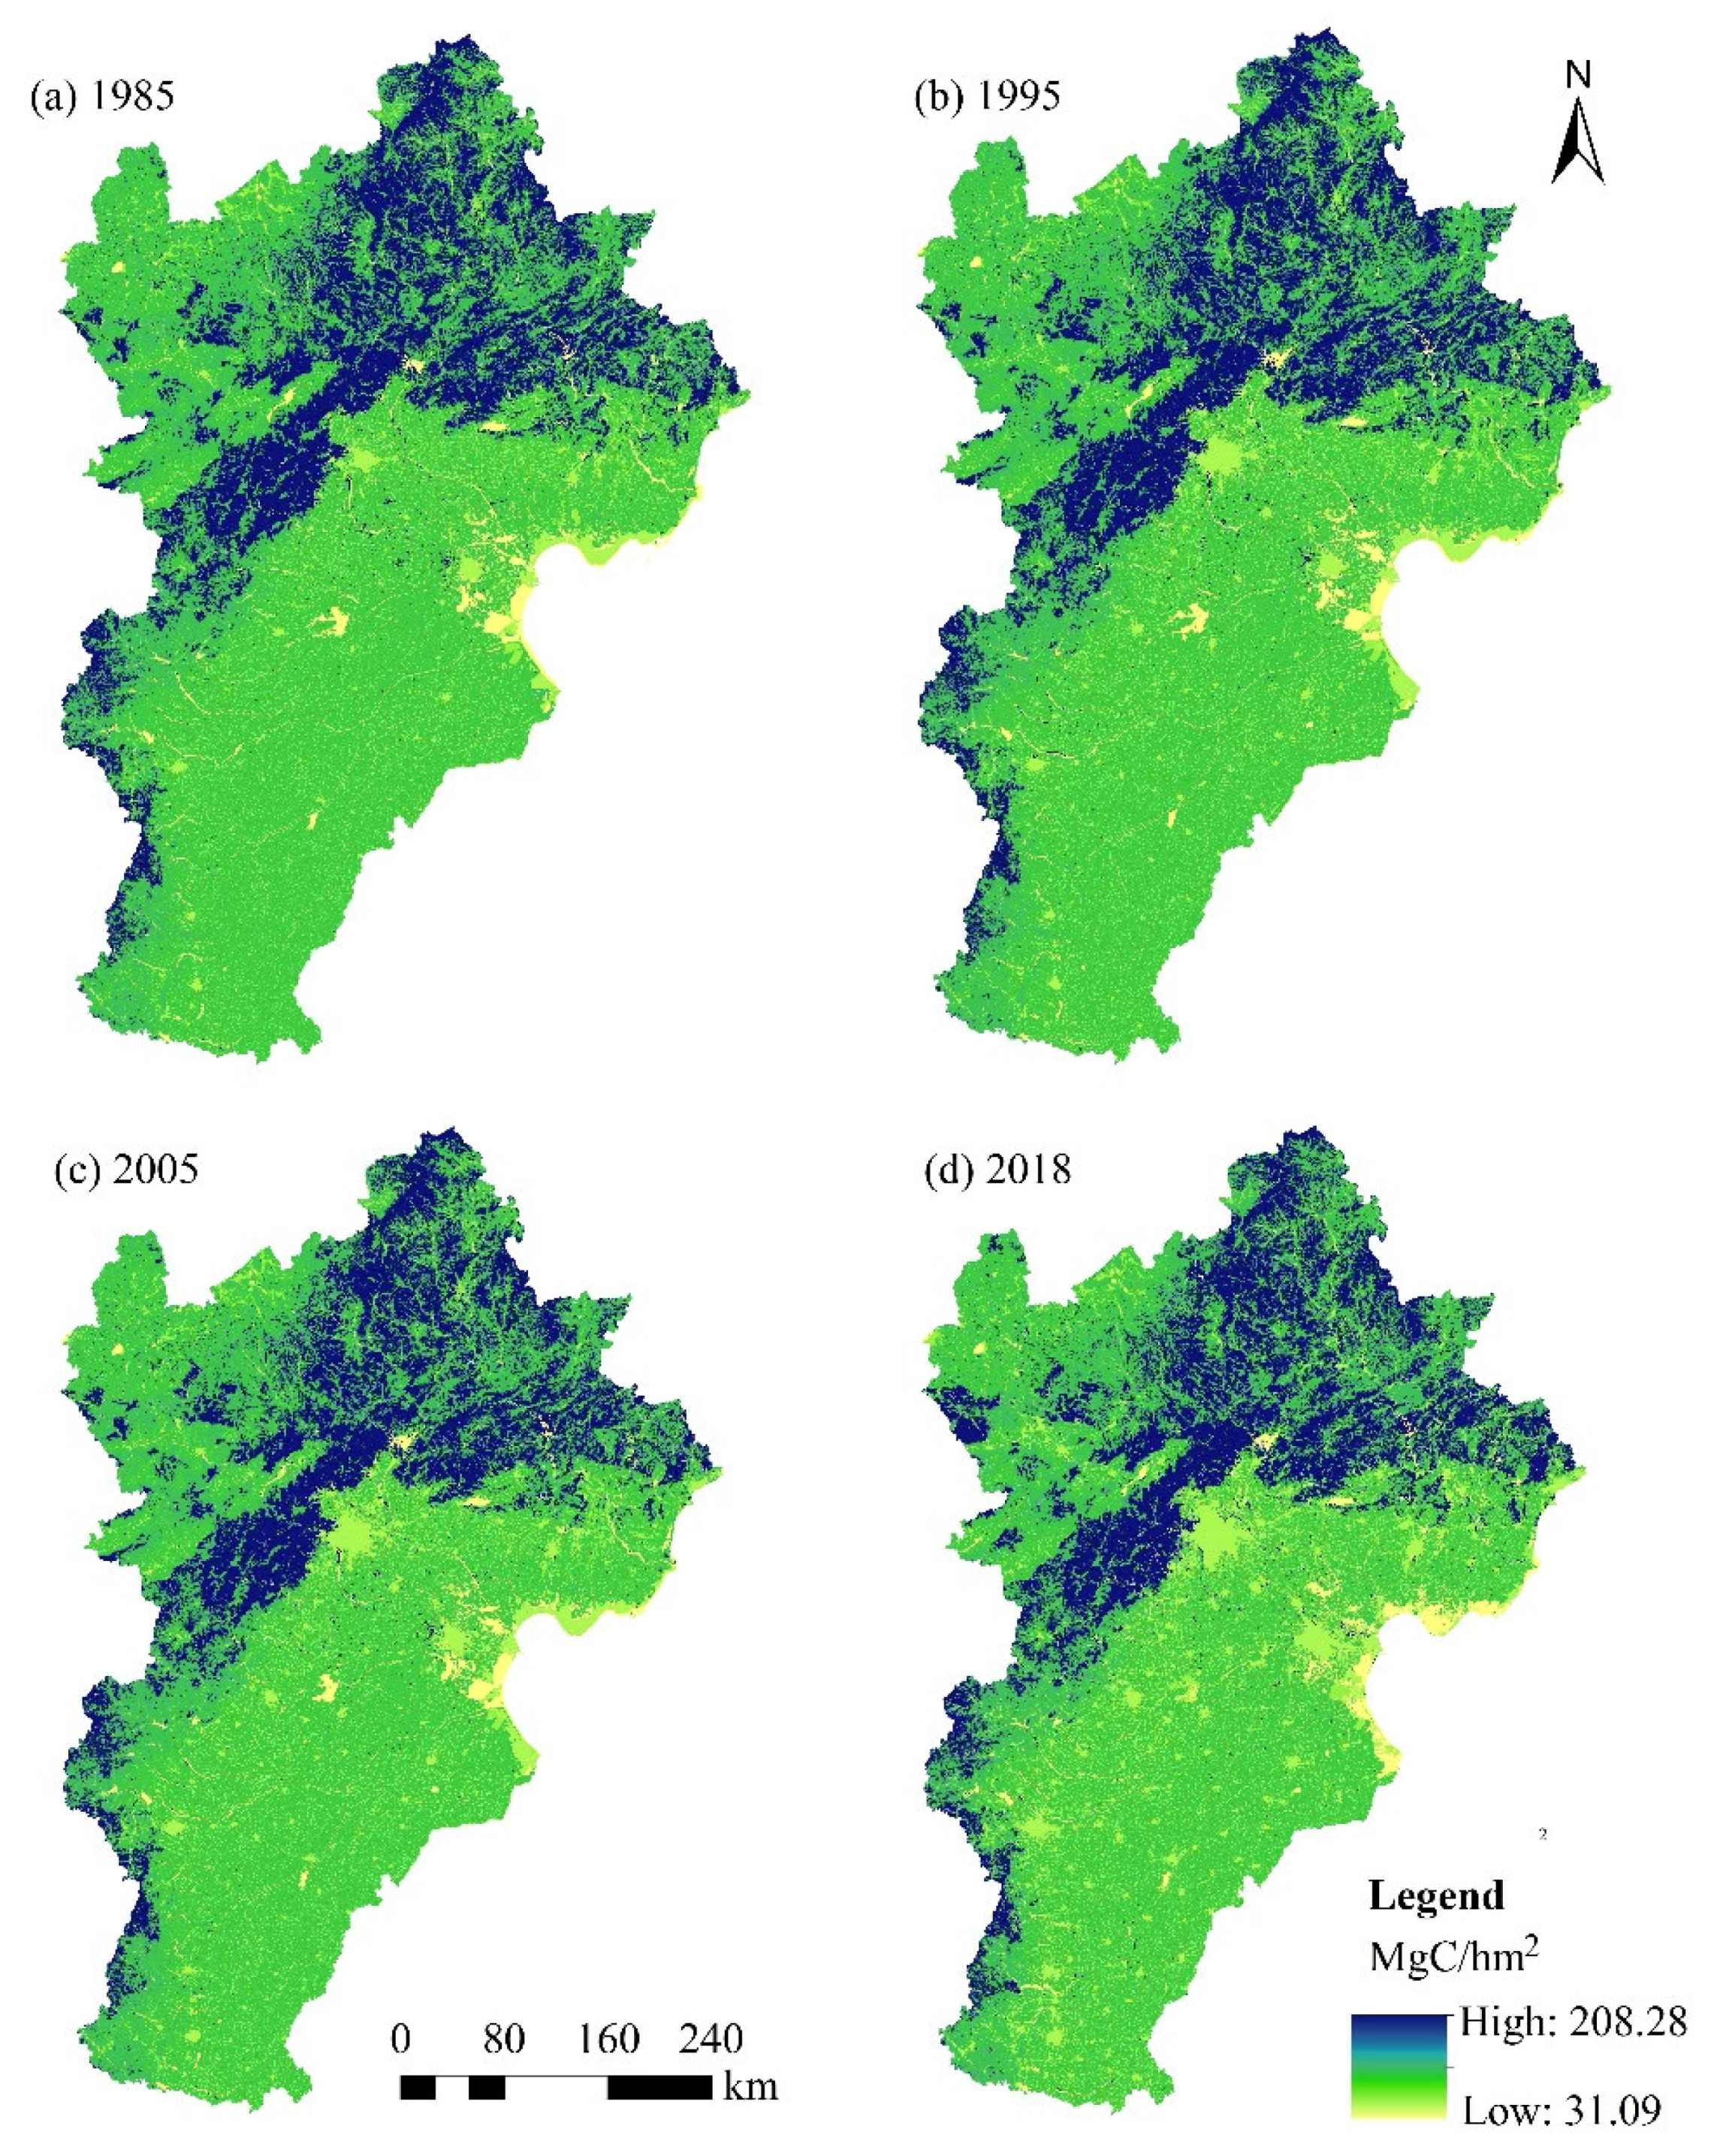
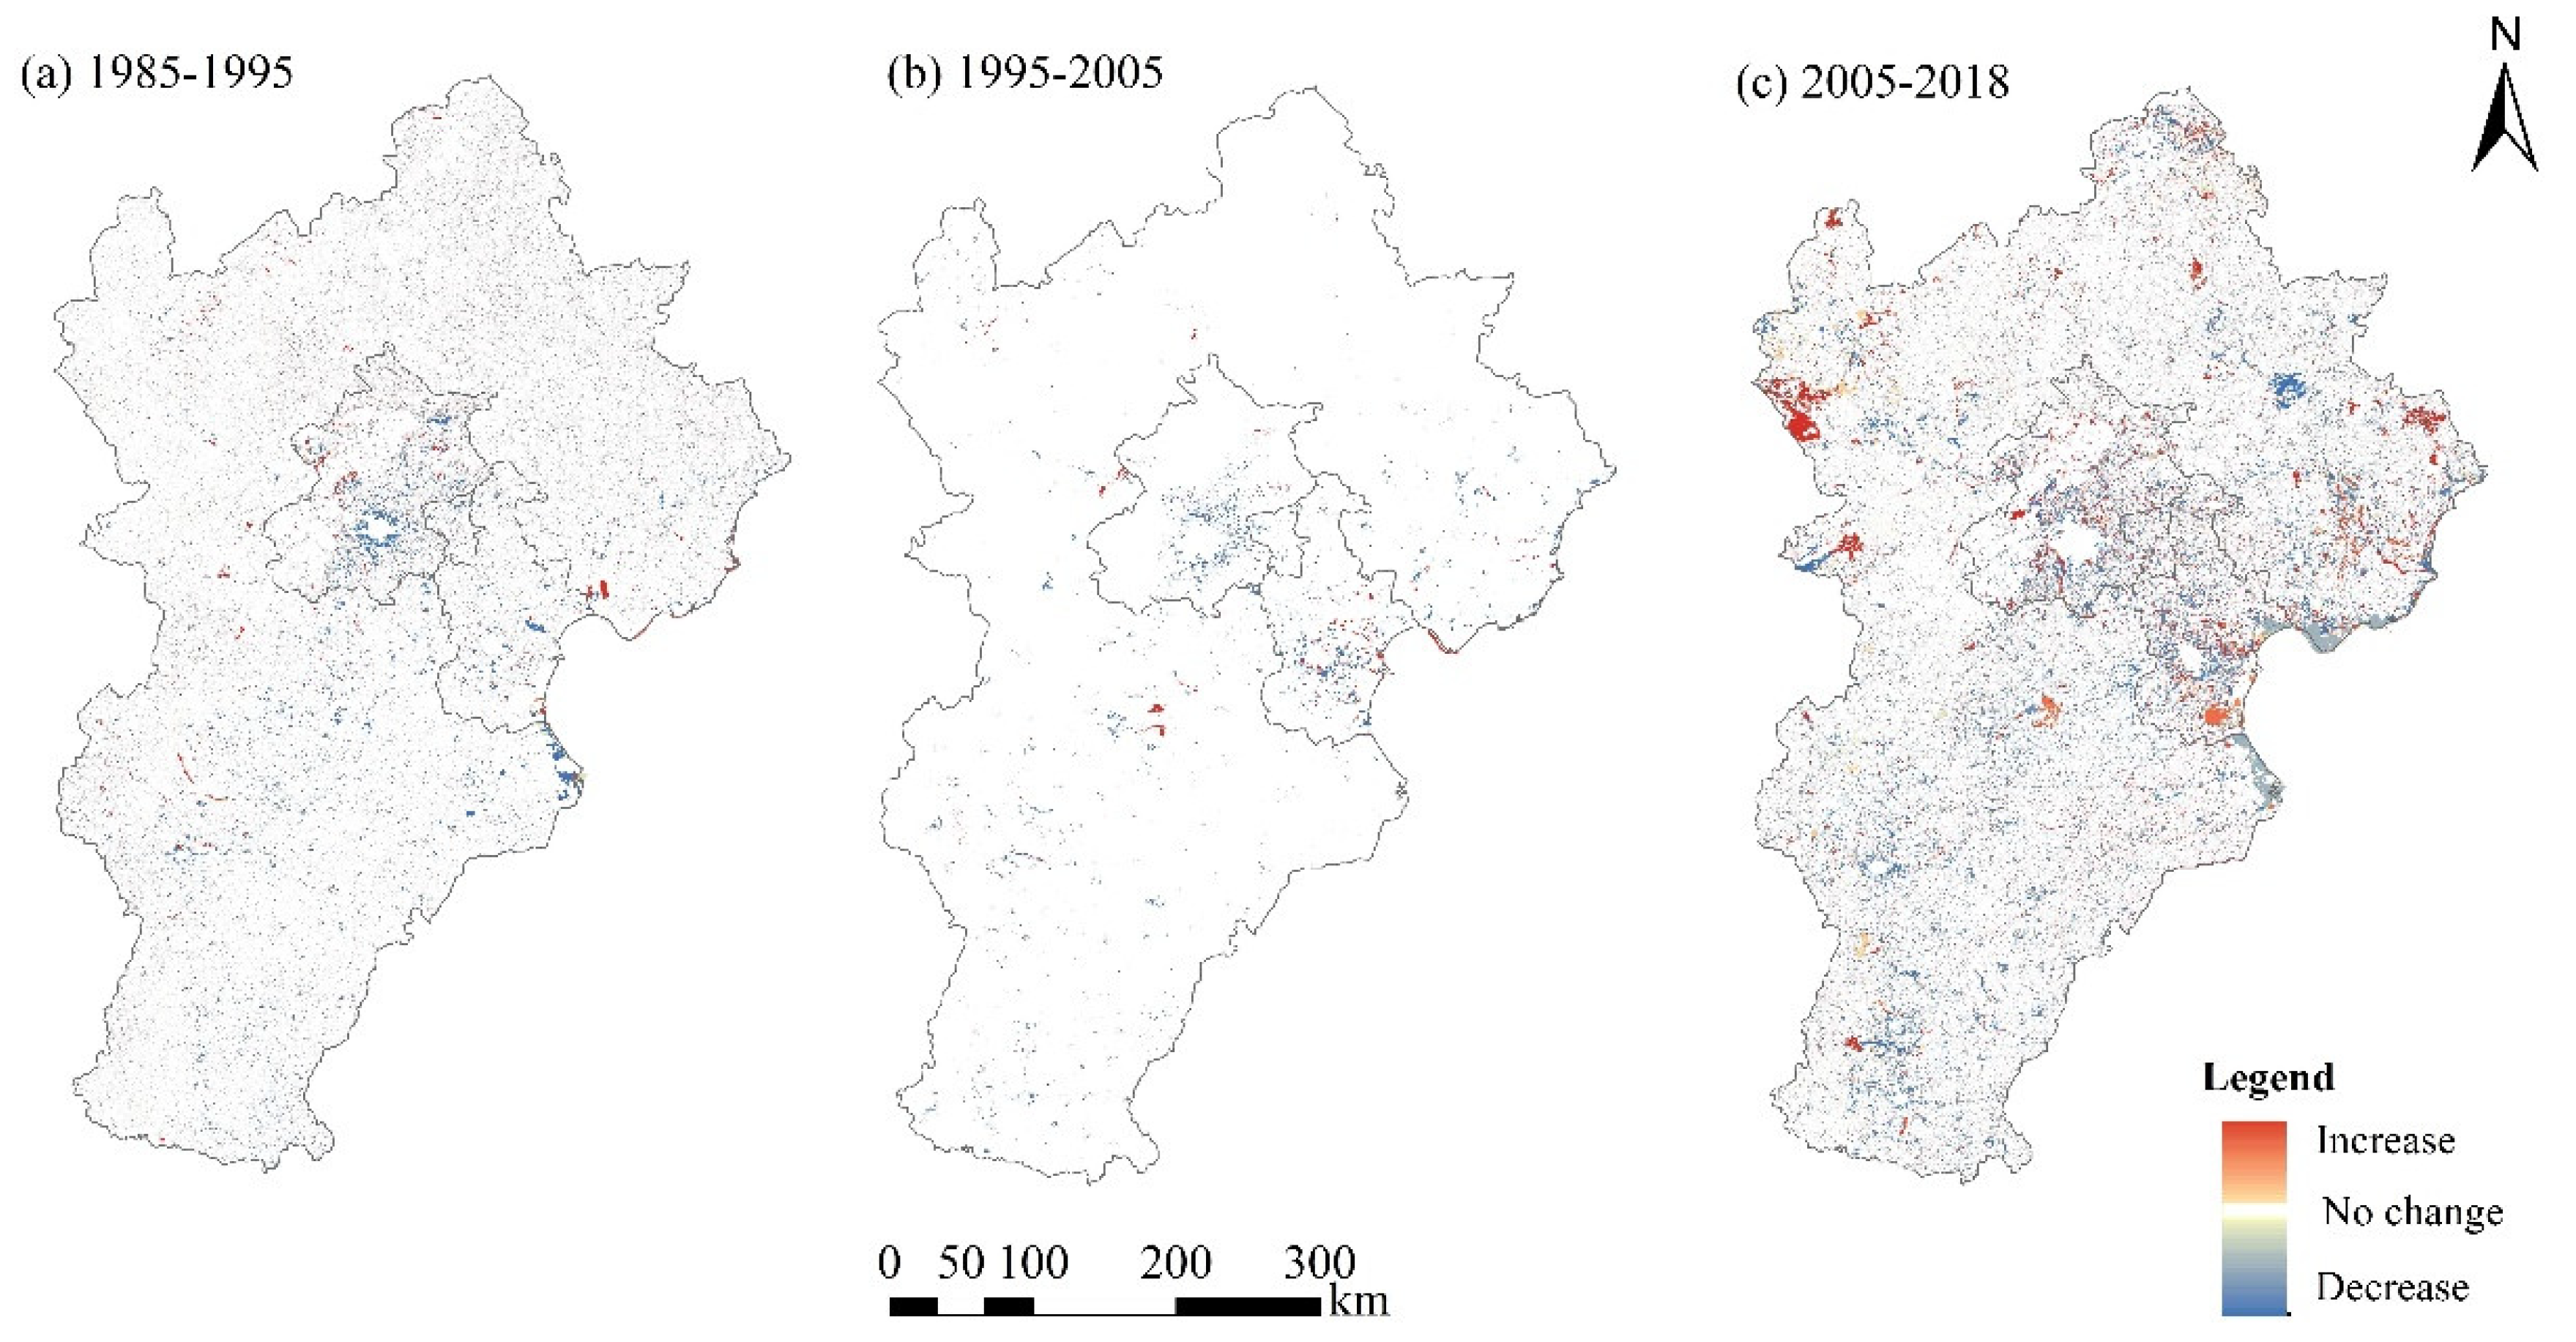
The contribution rate of land use transition to the eco-environmental quality index was calculated based on Equation (4). As shown in Table 5, from 1985 to 1995, the transitions from agricultural production land to forestland, grassland, and water area, and the transitions from grassland to forestland, were the main types of land transition that contributed to the improvement of the eco-environment quality in the BTH region; the total proportion of these four transition types reached 88.01%. At the same time, the transitions from agricultural production land to urban and rural living land, from forestland to agricultural production land, from grassland to agricultural and industrial production land, and from water area to agricultural production land accounted for 77.30% of the overall eco-environment deterioration. From 1995 to 2005, the transformation from agricultural production land to forestland and water area, from industrial production land to grassland, and from grassland to forestland were the predominant types of transition improving the eco-environment quality in the study area, and their contribution rate reached 74.33%. Meanwhile, the transformation from agricultural production land to industrial production land, urban and rural living land, from forestland to agricultural production land, from grassland to agricultural and industrial production land, and from water area to agricultural and industrial production land were the major types of eco-environment deterioration, with a total contribution rate of 73.78%. From 2005 to 2018, the conversion from agricultural production land into forestland, grassland, and water area, from industrial production land into water area, and from grassland into forestland were the five major transitions leading to the improvement of eco-environment quality, which accounted for 83.53% of the contribution rate. On the contrary, the conversion from agricultural production land into industrial production land, from forestland into agricultural and industrial production land and grassland land, and from grassland and water area into agricultural and industrial production land evoked eco-environment deterioration, and the 10 types accounted for 82.90% of the total contribution rate.
To sum up, the types of land use transition that affect the eco-environment quality were similar within the three time intervals, and tended to become more complicated over time in the BTH region. The conversion from production land into ecological land was the main type of eco-environment improvement, while the conversions from production land to living land and from ecological land to production land were the major types of eco-environment deterioration. There were two coexisting trends of eco-environmental improvement and deterioration in the BTH region. However, the degree of eco-environment improvement was less than that of deterioration, causing an overall deteriorating eco-environment in this region.

3.4. Carbon Storage

The carbon density data and land use data were input into the InVEST model to obtain the spatial distribution of carbon storage at different time points in the study area (Figure 6). In the past 33 years, the spatial distribution of carbon storage in the BTH region demonstrated a slowly decreasing trend with time. The difference between the land use structure and topography had a strong impact on carbon storage between regions in the study area. Therefore, the distribution of carbon storage in the BTH region showed significant spatial variation, and had a similar pattern as the topography. The carbon storage presented a high-value zone of “northeast-southwest”, which was higher in the north and southwest, and lower in the northwest and southeast. Specifically, the high carbon sequestration areas were concentrated in the mountainous forest areas at a relatively high altitude, including Chengde, Zhangjiakou, the northern and western mountainous areas of Beijing, and the western marginal areas within Baoding, Shijiazhuang, and Xingtai. The majority of low-carbon sequestration areas were distributed in the densely populated urban areas and agricultural areas in the low-lying southern plain, where construction land and cultivated land dominate. This is consistent with the spatial distribution of forestland and grassland in the BTH region. A similar result of decreasing carbon storage in the region was reported by Cui et al. [61].
Over the past three decades, land use transition has resulted in a significant change of regional carbon storage, most of which occurred in the soil. Our results show that the total carbon storages in 1985, 1995, 2005, and 2018 were 2640.53 Tg C, 2629.52 Tg C, 2622.65 Tg C, and 2589.90 Tg C, respectively. Overall, the terrestrial ecological carbon storage in the BTH region has been declining over the last 33 years. The carbon storage decreased by 11.01 Tg C, 6.87 Tg C, and 32.75 Tg C at the three time intervals, a total loss of 53.36 Tg C during the whole study period, with an average annual loss of 1.53 Tg C and an average annual loss rate of 0.06%. Of the four carbon pools, SOC experienced the largest loss, which decreased by 24.20 Tg C, accounting for 48.20% of the total carbon storage loss across the whole region. BGC, AGC, and DOC decreased by 24.35 Tg C, 19.06 Tg C, and 8.40 Tg C, accounting for 24.35%, 19.06%, and 8.40% of the total carbon storage loss, respectively.
Given different natural processes and anthropogenic activities, each land use type has different carbon storage potential. The average carbon density of the forestland in the study area is the highest (208.28 Mg C/hm2), followed by the grassland. The average carbon density of agricultural production land is higher, while that of the urban and rural living land is lower. In addition, the water area has the lowest average carbon density (31.09 Mg C/hm2). Agricultural production land had the highest average proportion of carbon storage (43.42%) in the BTH region from 1985 to 2018, followed by forestland (35.68%; Figure 7). In addition, from 1985 to 2018, the carbon storage of agricultural production land, grassland, and other ecological land decreased by 120.48 Mg C, 19.52 Mg C, and 3.74 Mg C, respectively, which was closely related to the area loss of various land types. Nevertheless, urban and rural living land expanded by 2398.61 km2 and 4081.68 km2, respectively, and the areas of industrial production land and forestland increased by 1418.62 km2 and 897.83 km2. Accordingly, the carbon storage of urban and rural living land and industrial production land continuously increased, with a total increase of 70.18 Mg C. Meanwhile, the carbon storage of forestland increased by 20.96 Mg C. The carbon storage reduction caused by urban and rural land expansion was 16.43 Tg C, 5.67 Tg C, and 43.60 Tg C at the three time intervals, accounting for 43.07%, 57.59% and 49.12% of the total carbon storage reduction in the corresponding period. The reduction of carbon storage caused by the expansion of industrial production land was 2.48 Tg C, 1.97 Tg C, and 16.90 Tg C, respectively, accounting for 6.50%, 20.03% and 19.05% of the total carbon storage reduction in the corresponding periods. As shown in Figure 8, the decrease of carbon storage was mainly distributed in the periphery of Beijing and Tianjin from 1985 to 1995 and 1995 to 2005, in line with the direction of urban expansion of the two cities. From 2005 to 2018, the increase of carbon storage was much more significant due to the internal conversions of ecological land, such as the transformation from grassland to forestland. In conclusion, the expansion of construction land, such as urban and rural living land and industrial production land, is the primary driver of carbon storage change.

4. Discussion

Different interactions between humans and the environment shape different regional functions and functional spaces [50]. Land use is an intuitive reflection of the relationship between humans and the environment. The products and services provided by different land use types are quite different, which forms the spatial differences in land use functions. Land use functions refer to the attribute and state in which various products and services are directly or indirectly provided to human beings by different land use types [79], including production function (economic function), living function (social function), and ecological function [52]. The production–living–ecological (PLE) space is an effective means to realize the optimization of China’s spatial development pattern under the strategic background of ecological civilization construction, and is also a more comprehensive zoning mode [80]. In this study, the PLE spaces are classified based on the dominant land use functions, which are defined from land use multifunctions.
The BTH region has a clear spatial distribution pattern of PLE space. The production space is mainly distributed in the southeast plain area; the living space is primarily located in metropolitan areas including Beijing, Tianjin, Shijiazhuang, Tangshan, and Langfang; and the ecological space is concentrated in the Yanshan-Taihang Mountain areas. With the continuous advancement of urbanization and industrialization, the BTH urban agglomeration has undergone a dramatic transformation of land use in the past 33 years, which has mainly manifested in the decrease of agricultural production land and the increase of living land. The overall regional quality of the eco-environment is deteriorating, which is mainly being caused by the transformation of agricultural production land into urban and rural living land, and is consistent with the current research conclusions in the economically developed urbanization areas such as the Yangtze River Delta and the eastern coast [81,82]. With the rapid advancement of the urbanization level, the demand for urban living land in the BTH region is increasing, and the contradiction between land supply and demand is being further intensified. Due to the influence of regional natural conditions, traffic, economic policies, development strategies, and other factors, the change degree of construction land varies significantly in different regions [63]. Meanwhile, attention should also be paid to the increasing scale of rural residential land, with an increase of 5043.24 km2 from 1985 to 2018, which is 1.06 times the increased area of urban living land, reflecting the serious vacancy of rural residential land in the region. In recent years, the decline of rural areas has caused widespread concern among scholars. The nonagriculturalization of the rural population has caused the phenomenon that “people leave uninhabited houses”, as well as “building new but not demolishing the old” in homesteads. Rural hollowing is essentially an undesirable evolutionary process that leads to the “external expansion and internal hollowing” of a village during the process of urban–rural transformation and development, which is a special form of rural territorial system evolution [83]. There is an urgent need to solve rural problems, such as the increasing vacancy of rural houses, waste of construction land, and the rapid loss of agricultural production factors, to promote rural revitalization [84,85]. During the study period, it can be seen that the urbanization process was relatively slow from 1985 to 2005; however, from 2005 to 2018, agricultural production land dramatically decreased by 8064.89 km2, which reflects large-scale occupation of cultivated land due to the rapid development of urbanization and industrialization.
An unbalanced economic development and industrial structure have led to significant differences in the transformation direction of regional land use, which has had a significant effect on eco-environment quality and terrestrial carbon sequestration. In this study, by constructing the eco-environmental quality index and adopting the InVEST model, we found that the overall quality of the eco-environment in the BTH urban agglomeration has deteriorated, and the carbon sequestration, as a regulation function for ecosystem services, decreased during this period because of the unprecedented land use transitions from 1985 to 2018 in this region. Figure 9 reveals the driving mechanism of the major eco-environment effects of land use transitions in the BTH region. The expansion of construction land, such as urban and rural living land and industrial production land, caused the reduction of carbon storage. Relevant studies show that there is a significant negative correlation between county urbanization level and carbon storage in the BTH region, and the land use transition caused by urbanization resulted in the reduction of carbon storage in this region [76], which is consistent with the conclusion of this study.
During the study period, the area experiencing the greatest loss of carbon storage was mainly distributed in the center of each economic circle. It can be seen from Figure 8 that carbon stock reduction appears in the periphery of the city centers of Beijing and Tianjin, which is closely related to the urban sprawl. Current research shows that the loss of cultivated land and the expansion of construction land in Beijing are concentrated in the area between the Fourth Ring Road and the Fifth Ring Road [64]. Around the highly urbanized core, the urban–rural interface has experienced many residential and industrial activities, with a profound impact on carbon storage. This result confirmed that the BTH region is currently under the rapid development of industrialization and urbanization, which has transformed a large area of agricultural production land, such as cultivated land, into urban built-up area. Moreover, it should be noted that there was a significant reduction of carbon storage in an area in the northeast of the region from 2005 to 2018, which was mainly caused by the conversion from forestland to grassland.
Commonly, the disorder of the land use structure leads to an unsustainable land use pattern and conflict among landscape functions [86]. Land use planning is crucial to successfully reconcile land use conflicts in the context of approving policies and plans, and in individual planning decisions [87,88]. On the whole, during the process of rapid economic development and urbanization, the BTH region has also suffered from the huge pressure brought about by the deterioration of the eco-environment, resulting in regional environmental problems such as ecological imbalances and environmental pollution. To solve the spatial contradiction of the PLE space, the BTH metropolitan area should utilize coordinated development that can balance economic construction and eco-environment protection, and optimize the layout of the PLE space under the idea of “global optimization”, as follows: (1) For the production space, we should establish an industrial space layout system suitable for world-class urban agglomeration, and build an intensive and efficient production space according to the concept of a centralized layout, intensive land use, and eco-friendly development. Specifically, we should strictly control the population and the amount of incremental urban land, delimit the bottom line of cultivated land, adjust the agricultural production structure in plain areas, develop water-saving agriculture and forestry, and strengthen farmland protection. (2) For the living space, we should adhere to the principles of green, low-carbon, and multifunctional. First, we should vigorously promote the construction of public green space and open space in urban built-up areas; second, we should improve the living environment in rural areas and build a livable and moderate living space [89]. In addition, in the process of Beijing–Tianjin–Hebei regional integration, we should narrow the gap between urban and rural areas, coordinate urban and rural construction land, highlight the goal of eco-environment protection, and lay a solid foundation for urban–rural integration. (3) For the ecological space, we must strictly delimit the ecological bottom line and implement the strictest ecological protection policies. In addition, we should further expand ecological space through land reclamation and afforestation, in order to provide a solid ecological barrier for the urban development of Beijing and Tianjin. Currently, the BTH region proposes to build a production–living–ecological spatial pattern of “one pole, two wings, three screens” [90]. “One pole” refers to the construction of the core production and living area of the international urban agglomeration of Beijing, Tianjin, and Northern Hebei, with Beijing and Tianjin as the core. “Two wings” means that Baoding, Langfang, and Shijiazhuang are taken as the left wing to construct the auxiliary production and living areas of the national urban agglomeration in central and southern Hebei; and Tangshan, Qinhuangdao and Chengde are taken as the right wing, to construct the auxiliary production and living areas of the BTH urban agglomeration in east and northeast Hebei. “Three screens” refers to the ecological barrier for water conservation of Yanshan Mountain in Zhangjiakou and Chengde, the ecological barrier for soil and water conservation of the Taihang Mountains in Shijiazhuang and Handan, and the coastal ecological barrier along the Bohai Sea in Tianjin and Qinhuangdao. This will provide a scientific reference for the further spatial optimization of PLE space in the BTH region.

5. Conclusions

This paper adopted the land use transfer matrix to analyze the dynamic changes of land use, and then constructed an eco-environmental quality index and used InVEST-based carbon storage analysis to quantitatively study the related eco-environmental effects in the BTH region from the perspective of the production–living–ecological space. The results show that: (1) From 1985 to 2018, the land use pattern of the study area has changed significantly, presenting characteristics of rapid expansion of living spaces, shrinking production space, and relatively stable ecological land, and the living land is mainly being converted from agricultural production land. (2) Overall, the eco-environmental quality index is “high in the northwest and low in the southeast”, with obvious regional differences. There are two simultaneous trends of ecological improvement and deterioration, but the overall eco-environmental quality of the BTH region demonstrated a deteriorating trend over the past 33 years. Moreover, the main types of eco-environment deterioration are the conversion from production land to living land, and from ecological land to production land. (3) The distribution of the carbon density demonstrates a decreasing trend from the northwest to southeast. Furthermore, the expansion of construction land, such as urban and rural living land and industrial production land, is the main process causing carbon storage changes. We suggest that the BTH metropolitan area should take the path of coordinated development of economic construction and eco-environment protection. At this critical stage of BTH regional integration, guided by the idea of “global optimization”, the region should optimize the layout of the production–living–ecological space and promote land multifunctional transformation, in order to realize the goal of high-quality and efficiency of the production space, moderate livability of the living space, and beautiful scenery of the ecological space.

Author Contributions

Conceptualization, Y.Y.; methodology, Y.W. and Z.C.; software, Z.C.; data curation, W.B.; writing—original draft preparation, Y.Y. and W.B.; writing—review and editing, Y.L. and Y.W.; funding acquisition, Y.Y. and Y.L. All authors have read and agreed to the published version of the manuscript.

Funding

This research was funded by the National Natural Science Foundations of China (41731286; 41601173; 41771191) and the Postdoctoral Science Foundation of China (2016M600954).

Conflicts of Interest

The authors declare no conflict of interest.

References

  1. Newbold, T.; Hudson, L.N.; Arnell, A.P.; Contu, S.; De Palma, A.; Ferrier, S.; Hill, S.L.L.; Hoskins, A.J.; Lysenko, I.; Phillips, H.R.P.; et al. Has land use pushed terrestrial biodiversity beyond the planetary boundary? A global assessment. Science 2016, 353, 288–291. [Google Scholar] [CrossRef]
  2. Seto, K.C.; Reenberg, A.; Boone, C.G.; Fragkias, M.; Haase, D.; Langanke, T.; Marcotullio, P.; Munroe, D.K.; Olah, B.; Simon, D. Urban land teleconnections and sustainability. Proc. Natl. Acad. Sci. USA 2012, 109, 7687–7692. [Google Scholar] [CrossRef] [Green Version]
  3. Turner, B.L.; Lambin, E.F.; Reenberg, A. The emergence of land change science for global environmental change and sustainability. Proc. Natl. Acad. Sci. USA 2007, 104, 20666–20671. [Google Scholar] [CrossRef] [Green Version]
  4. Lambin, E.F.; Meyfroidt, P. Global land use change, economic globalization, and the looming land scarcity. Proc. Natl. Acad. Sci. USA 2011, 108, 3465–3472. [Google Scholar] [CrossRef] [Green Version]
  5. Hanaček, K.; Rodríguez-Labajos, B. Impacts of land-use and management changes on cultural agroecosystem services and environmental conflicts—A global review. Glob. Environ. Chang. 2018, 50, 41–59. [Google Scholar] [CrossRef]
  6. Quintas-Soriano, C.; Castro, A.J.; Castro, H.; García-Llorente, M. Impacts of land use change on ecosystem services and implications for human well-being in Spanish drylands. Land Use Policy 2016, 54, 534–548. [Google Scholar] [CrossRef]
  7. Lawler, J.J.; Lewis, D.J.; Nelson, E.J.; Plantinga, A.J.; Polasky, S.; Withey, J.C.; Helmers, D.P.; Martinuzzi, S.; Pennington, D.; Radeloff, V.C. Projected land-use change impacts on ecosystem services in the United States. Proc. Natl. Acad. Sci. USA 2014, 111, 7492–7497. [Google Scholar] [CrossRef] [Green Version]
  8. Braimoh, A.K.; Vlek, P.L. Impact of land use on soil resources. In Land Use and Soil Resources; Springer: Berlin/Heidelberg, Germany, 2008; pp. 1–7. [Google Scholar]
  9. Vitousek, P.M.; Mooney, H.A.; Lubchenco, J.; Melillo, J.M. Human domination of Earth’s ecosystems. Science 1997, 277, 494–499. [Google Scholar] [CrossRef] [Green Version]
  10. Houghton, R.A. The worldwide extent of land-use change. BioScience 1994, 44, 305–313. [Google Scholar] [CrossRef]
  11. Houghton, R.A.; Nassikas, A.A. Global and regional fluxes of carbon from land use and land cover change 1850–2015. Glob. Biogeochem. Cycles 2017, 31, 456–472. [Google Scholar] [CrossRef]
  12. Deines, J.M.; Schipanski, M.E.; Golden, B.; Zipper, S.C.; Nozari, S.; Rottler, C.; Guerrero, B.; Sharda, V. Transitions from irrigated to dryland agriculture in the ogallala aquifer: Land use suitability and regional economic impacts. Agric. Water Manag. 2020, 233. [Google Scholar] [CrossRef]
  13. Ouyang, Z.; Zheng, H.; Xiao, Y.; Polasky, S.; Liu, J.; Xu, W.; Wang, Q.; Zhang, L.; Xiao, Y.; Rao, E. Improvements in ecosystem services from investments in natural capital. Science 2016, 352, 1455–1459. [Google Scholar] [CrossRef]
  14. Chen, C.; Park, T.; Wang, X.; Piao, S.; Xu, B.; Chaturvedi, R.K.; Fuchs, R.; Brovkin, V.; Ciais, P.; Fensholt, R. China and India lead in greening of the world through land-use management. Nat. Sustain. 2019, 2, 122–129. [Google Scholar] [CrossRef]
  15. Keesstra, S.; Mol, G.; de Leeuw, J.; Okx, J.; Molenaar, C.; de Cleen, M.; Visser, S. Soil-related sustainable development goals: Four concepts to make land degradation neutrality and restoration work. Land 2018, 7, 133. [Google Scholar] [CrossRef] [Green Version]
  16. Griggs, D.; Stafford-Smith, M.; Gaffney, O.; Rockstroem, J.; Oehman, M.C.; Shyamsundar, P.; Steffen, W.; Glaser, G.; Kanie, N.; Noble, I. Sustainable development goals for people and planet. Nature 2013, 495, 305–307. [Google Scholar] [CrossRef]
  17. Chen, K.; Long, H.; Liao, L.; Tu, S.; Li, T. Land use transitions and urban-rural integrated development: Theoretical framework and China’s evidence. Land Use Policy 2020, 92, 104465. [Google Scholar] [CrossRef]
  18. Qu, Y.; Long, H. The economic and environmental effects of land use transitions under rapid urbanization and the implications for land use management. Habitat Int. 2018, 82, 113–121. [Google Scholar] [CrossRef]
  19. Ike, M.; Donovan, J.D.; Topple, C.; Masli, E.K. The process of selecting and prioritising corporate sustainability issues: Insights for achieving the sustainable development goals. J. Clean. Prod. 2019, 236, 117661. [Google Scholar] [CrossRef]
  20. Li, Y.; Li, Y.; Westlund, H.; Liu, Y. Urban-rural transformation in relation to cultivated land conversion in China: Implications for optimizing land use and balanced regional development. Land Use Policy 2015, 47, 218–224. [Google Scholar] [CrossRef]
  21. Tian, J.; Wang, B.; Zhang, C.; Li, W.; Wang, S. Mechanism of regional land use transition in underdeveloped areas of China: A case study of northeast China. Land Use Policy 2020, 94, 104538. [Google Scholar] [CrossRef]
  22. Liu, Y.; Long, H. Land use transitions and their dynamic mechanism: The case of the Huang-Huai-Hai Plain. J. Geogr. Sci. 2016, 26, 515–530. [Google Scholar] [CrossRef] [Green Version]
  23. Li, T.; Long, H.; Liu, Y.; Tu, S. Multi-scale analysis of rural housing land transition under China’s rapid urbanization: The case of bohai rim. Habitat Int. 2015, 48, 227–238. [Google Scholar] [CrossRef]
  24. Mather, A.S. Forest transition theory and the reforesting of Scotland. Scott. Geogr. J. 2004, 120, 83–98. [Google Scholar] [CrossRef]
  25. Zhang, Y.; Long, H.; Ma, L.; Ge, D.; Tu, S.; Qu, Y. Farmland function evolution in the Huang-Huai-Hai plain: Processes, patterns and mechanisms. J. Geogr. Sci. 2018, 28, 759–777. [Google Scholar] [CrossRef] [Green Version]
  26. Jiang, G.; He, X.; Qu, Y.; Zhang, R.; Meng, Y. Functional evolution of rural housing land: A comparative analysis across four typical areas representing different stages of industrialization in China. Land Use Policy 2016, 57, 645–654. [Google Scholar] [CrossRef]
  27. Nizalov, D.; Thornsbury, S.; Loveridge, S.; Woods, M.; Zadorozhna, O. Security of property rights and transition in land use. J. Comp. Econ. 2016, 44, 76–91. [Google Scholar] [CrossRef] [Green Version]
  28. Jin, X.; Xu, X.; Xiang, X.; Bai, Q.; Zhou, Y. System-dynamic analysis on socio-economic impacts of land consolidation in China. Habitat Int. 2016, 56, 166–175. [Google Scholar] [CrossRef]
  29. Chen, W.; Chi, G.; Li, J. The spatial association of ecosystem services with land use and land cover change at the county level in China, 1995–2015. Sci. Total Environ. 2019, 669, 459–470. [Google Scholar] [CrossRef]
  30. Asadolahi, Z.; Salmanmahiny, A.; Sakieh, Y.; Mirkarimi, S.H.; Baral, H.; Azimi, M. Dynamic trade-off analysis of multiple ecosystem services under land use change scenarios: Towards putting ecosystem services into planning in Iran. Ecol. Complex. 2018, 36, 250–260. [Google Scholar] [CrossRef]
  31. Lu, X.; Shi, Y.; Chen, C.; Yu, M. Monitoring cropland transition and its impact on ecosystem services value in developed regions of China: A case study of Jiangsu Province. Land Use Policy 2017, 69, 25–40. [Google Scholar] [CrossRef]
  32. Long, H.; Liu, Y.; Hou, X.; Li, T.; Li, Y. Effects of land use transitions due to rapid urbanization on ecosystem services: Implications for urban planning in the new developing area of China. Habitat Int. 2014, 44, 536–544. [Google Scholar] [CrossRef]
  33. Faiz, M.A.; Liu, D.; Fu, Q.; Naz, F.; Hristova, N.; Li, T.; Niaz, M.A.; Khan, Y.N. Assessment of dryness conditions according to transitional ecosystem patterns in an extremely cold region of China. J. Clean. Prod. 2020, 255. [Google Scholar] [CrossRef]
  34. Asabere, S.B.; Acheampong, R.A.; Ashiagbor, G.; Beckers, S.C.; Keck, M.; Erasmi, S.; Schanze, J.; Sauer, D. Urbanization, land use transformation and spatio-environmental impacts: Analyses of trends and implications in major metropolitan regions of Ghana. Land Use Policy 2020, 96, 104707. [Google Scholar] [CrossRef]
  35. Liu, Y.; Long, H.; Li, T.; Tu, S. Land use transitions and their effects on water environment in Huang-Huai-Hai Plain, China. Land Use Policy 2015, 47, 293–301. [Google Scholar] [CrossRef]
  36. Nuissl, H.; Haase, D.; Lanzendorf, M.; Wittmer, H. Environmental impact assessment of urban land use transitions—A context-sensitive approach. Land Use Policy 2009, 26, 414–424. [Google Scholar] [CrossRef]
  37. Ge, D.; Wang, Z.; Tu, S.; Long, H.; Yan, H.; Sun, D.; Qiao, W. Coupling analysis of greenhouse-led farmland transition and rural transformation development in China’s traditional farming area: A case of Qingzhou city. Land Use Policy 2019, 86, 113–125. [Google Scholar] [CrossRef]
  38. Long, H.; Qu, Y. Land use transitions and land management: A mutual feedback perspective. Land Use Policy 2018, 74, 111–120. [Google Scholar] [CrossRef]
  39. Liu, J.; Diamond, J.M. China’s environment in a globalizing world. Nature 2005, 435, 1179–1186. [Google Scholar] [CrossRef]
  40. Bryan, B.A.; Gao, L.; Ye, Y.; Sun, X.; Connor, J.D.; Crossman, N.D.; Stafford-Smith, M.; Wu, J.; He, C.; Yu, D. China’s response to a national land-system sustainability emergency. Nature 2018, 559, 193–204. [Google Scholar] [CrossRef]
  41. Liao, G.; He, P.; Gao, X.; Deng, L.; Zhang, H.; Feng, N.; Zhou, W.; Deng, O. The production-living-ecological land classification system and its characteristics in the hilly area of Sichuan province, southwest China based on identification of the main functions. Sustainability 2019, 11, 1600. [Google Scholar] [CrossRef] [Green Version]
  42. Liu, J.; Liu, Y.; Li, Y. Classification evaluation and spatial-temporal analysis of “production-living-ecological” spaces in China. Acta Geogr. Sin. 2017, 72, 1290–1304. (In Chinese) [Google Scholar]
  43. Deng, W.; Zhang, J.; Shi, Z.; Wan, J.; Meng, B. Interpretation of mountain territory space and its optimized conceptual model and theoretical framework. Mt. Res. 2017, 35, 121–128. (In Chinese) [Google Scholar]
  44. Fang, C.; Yang, J.; Fang, J.; Huang, X.; Zhou, Y. Optimization transmission theory and technical pathways that describe multiscale urban agglomeration spaces. Chin. Geogr. Sci. 2018, 28, 543–554. (In Chinese) [Google Scholar] [CrossRef] [Green Version]
  45. Zhang, H.; Xu, E.; Zhu, H. An ecological-living-industrial land classification system and its spatial distribution in China. Resour. Sci. 2015, 37, 1332–1338. (In Chinese) [Google Scholar]
  46. Shi, Z.; Deng, W.; Zhang, S. Spatio-temporal pattern changes of land space in Hengduan Mountains during 1990–2015. J. Geogr. Sci. 2018, 28, 529–542. [Google Scholar] [CrossRef] [Green Version]
  47. Li, G.; Fang, C. Quantitative function identification and analysis of urban ecological-production-living spaces. Acta Geogr. Sin. 2016, 71, 49–65. (In Chinese) [Google Scholar]
  48. Xi, J.; Wang, S.; Zhang, R. Restructuring and optimizingproduction-living-ecology space in rural settlements: A case study of Gougezhuang village at Yesanpo tourism attraction in Hebei province. J. Nat. Resour. 2016, 31, 425–435. (In Chinese) [Google Scholar]
  49. Zhou, D.; Xu, J.; Lin, Z. Conflict or coordination? Assessing land use multi-functionalization using production-living-ecology analysis. Sci. Total Environ. 2017, 577, 136–147. [Google Scholar] [CrossRef]
  50. Yang, Y.; Bao, W.; Liu, Y. Coupling coordination analysis of rural production-living-ecological space in the Beijing-Tianjin-Hebei region. Ecol. Indic. 2020, 117, 106512. [Google Scholar] [CrossRef]
  51. Yu, Z.; Xu, E.; Zhang, H.; Shang, E. Spatio-temporal coordination and conflict of production-living-ecology land functions in the Beijing-Tianjin-Hebei region, China. Land 2020, 9, 170. [Google Scholar] [CrossRef]
  52. Huang, A.; Xu, Y.; Hao, J.; Sun, P.; Liu, C.; Zheng, W. Progress review on land use functions evaluation and its prospects. China Land Sci. 2017, 31, 88–96. (In Chinese) [Google Scholar]
  53. Ma, W.; Jiang, G.; Chen, Y.; Qu, Y.; Zhou, T.; Li, W. How feasible is regional integration for reconciling land use conflicts across the urban–rural interface? Evidence from Beijing–Tianjin–Hebei metropolitan region in China. Land Use Policy 2020, 92, 104433. [Google Scholar] [CrossRef]
  54. Tan, M.; Li, X.; Xie, H.; Lu, C. Urban land expansion and arable land loss in China—A case study of Beijing–Tianjin–Hebei region. Land Use Policy 2005, 22, 187–196. [Google Scholar] [CrossRef]
  55. Deng, X.; Huang, J.; Rozelle, S.; Zhang, J.; Li, Z. Impact of urbanization on cultivated land changes in China. Land Use Policy 2015, 45, 1–7. [Google Scholar] [CrossRef]
  56. Tian, Y.; Zhou, D.; Jiang, G. Conflict or coordination? Multiscale assessment of the spatio-temporal coupling relationship between urbanization and ecosystem services: The case of the Jingjinji Region, China. Ecol. Indic. 2020, 117, 106543. [Google Scholar] [CrossRef]
  57. Haas, J.; Ban, Y. Urban growth and environmental impacts in Jing-Jin-Ji, the Yangtze, River Delta and the Pearl River Delta. Int. J. Appl. Earth Obs. Geoinf. 2014, 30, 42–55. [Google Scholar] [CrossRef]
  58. Wang, Z.; Yang, L. Delinking indicators on regional industry development and carbon emissions: Beijing–Tianjin–Hebei economic band case. Ecol. Indic. 2015, 48, 41–48. [Google Scholar] [CrossRef]
  59. Deng, X.; Dan, L.; Ye, Q.; Wang, Z.; Liu, Y.; Zhang, X.; Zhang, F.; Qi, W.; Wang, G.; Wang, P.; et al. Methodological framework and research progress on the social and economic costs of carbon emission and reduction. J. Geo-Inf. Sci. 2018, 20, 405–413. (In Chinese) [Google Scholar]
  60. Song, W.; Deng, X. Effects of urbanization-induced cultivated land loss on ecosystem services in the north china plain. Energies 2015, 8, 5678–5693. [Google Scholar] [CrossRef]
  61. Cui, X.; Wei, X.; Liu, W.; Zhang, F.; Li, Z. Spatial and temporal analysis of carbon sources and sinks through land use/cover changes in the Beijing-Tianjin-Hebei urban agglomeration region. Phys. Chem. Earth 2019, 110, 61–70. [Google Scholar] [CrossRef]
  62. Li, S.; Yang, H.; Lacayo, M.; Liu, J.; Lei, G. Impacts of land-use and land-cover changes on water yield: A case study in Jing-Jin-Ji, China. Sustainability 2018, 10, 960. [Google Scholar] [CrossRef] [Green Version]
  63. Li, J.; Liu, Y.; Yang, Y.; Liu, J. Spatial-temporal characteristics and driving factors of urban construction land in Beijing-Tianjin-Hebei region during 1985–2015. Geogr. Res. 2018, 37, 37–52. (In Chinese) [Google Scholar]
  64. Liu, Y.; Yang, Y.; Li, Y.; Li, J. Conversion from rural settlements and arable land under rapid urbanization in Beijing during 1985–2010. J. Rural Stud. 2017, 51, 141–150. [Google Scholar] [CrossRef]
  65. Liu, J.; Kuang, W.; Zhang, Z.; Xu, X.; Qin, Y.; Ning, J.; Zhou, W.; Zhang, S.; Li, R.; Yan, C.; et al. Spatiotemporal characteristics, patterns, and causes of land-use changes in China since the late 1980s. J. Geogr. Sci. 2014, 24, 195–210. [Google Scholar] [CrossRef]
  66. Li, X.; Fang, C.; Huang, J.; Mao, H. The urban land use transformations and associated effects on eco-environment in northwest china arid region:a case study in ehxi region, gansu province. Quat. Sci. 2003, 23, 280–290. (In Chinese) [Google Scholar]
  67. Zhang, Y.; Liu, Y.; Gu, J.; Ding, Q. Land use/land cover change and its environmental effects in Wuhan city. Sci. Geogr. Sin. 2011, 31, 1280–1285. (In Chinese) [Google Scholar]
  68. Hu, F.; An, Y.; Zhao, H. Research on characteristics of ecological environment effect on a “Semi-Karst” region based on land use transition: A case in central Guizhou province, China. Earth Environ. 2016, 44, 447–454. (In Chinese) [Google Scholar]
  69. Li, C.; Xin, G.; Yang, C.; Cheng, X. Land Use and Land Cover Change(LUCC)and its environmental effects of traditional farm area. J. Southwest Univ. Nat. Sci. Ed. 2016, 38, 139–145. (In Chinese) [Google Scholar]
  70. Luo, G.; Liao, H.; Li, Q.; Liao, L.; Li, Y.; Fang, A. A study of land use function transformation based on ecological-production-living spaces and associated eco-environment responsea case study of banan district. J. Southwest Univ. Nat. Sci. Ed. 2018, 40, 105–113. (In Chinese) [Google Scholar]
  71. Gong, Y.; Han, S.; Shi, X.; Tang, X. Temporal and spatial evolution and associated eco-environment effects of the land use transformation of ecological-production-living spaces in Guangdong province. Res. Soil Water Conserv. 2020, 27, 203–209. (In Chinese) [Google Scholar]
  72. Wu, H.; Guo, Z.; Peng, C. Land use induced changes of organic carbon storage in soils of China. Glob. Chang. Biol. 2003, 9, 305–315. [Google Scholar] [CrossRef]
  73. Turner, D.P.; Koerper, G.J.; Harmon, M.E.; Lee, J.J. A carbon budget for forests of the conterminous United States. Ecol. Appl. 1995, 5, 421–436. [Google Scholar] [CrossRef]
  74. He, C.; Zhang, D.; Huang, Q.; Zhao, Y. Assessing the potential impacts of urban expansion on regional carbon storage by linking the LUSD-urban and InVEST models. Environ. Model. Softw. 2016, 75, 44–58. [Google Scholar] [CrossRef]
  75. Sun, X.; Lu, Z.; Li, F.; Crittenden, J.C. Analyzing spatio-temporal changes and trade-offs to support the supply of multiple ecosystem services in Beijing, China. Ecol. Indic. 2018, 94, 117–129. [Google Scholar] [CrossRef]
  76. Wang, C.; Zhan, J.; Chu, X.; Liu, W.; Zhang, F. Variation in ecosystem services with rapid urbanization: A study of carbon sequestration in the Beijing-Tianjin-Hebei region, China. Phys. Chem. Earth 2019, 110, 195–202. [Google Scholar] [CrossRef]
  77. Chen, T.; Feng, Z.; Zhao, H.; Wu, K. Dataset of ecosystem services in Beijing and its surrounding areas. Data Brief 2020, 29, 105151. [Google Scholar] [CrossRef]
  78. Li, J.; Xia, S.; Yu, X.; Li, S.; Xu, C.; Zhao, N.; Wang, S. Evaluation of carbon storage on terrestrial ecosystem in Hebei province based on InVEST model. J. Ecol. Rural Environ. 2020, 854–861. (In Chinese) [Google Scholar] [CrossRef]
  79. Pérez-Soba, M.; Petit, S.; Jones, L.; Bertrand, N.; Briquel, V.; Omodei-Zorini, L.; Contini, C.; Helming, K.; Farrington, J.H.; Mossello, M.T. Land use functions—A multifunctionality approach to assess the impact of land use changes on land use sustainability. In Sustainability Impact Assessment of Land Use Changes; Springer: Berlin/Heidelberg, Germany, 2008; pp. 375–404. [Google Scholar]
  80. Huang, A.; Xu, Y.; Lu, L.; Liu, C.; Zhang, Y.; Hao, J.; Wang, H. Research progress of the identification and optimization of production-living-ecological spaces. Prog. Geogr. 2020, 39, 503–518. (In Chinese) [Google Scholar] [CrossRef]
  81. Lu, L.; Zhou, S.; Zhou, B.; Dai, L.; Chang, T.; Bao, G.; Zhou, H.; Li, Z. Land use tansformation and its eco-environmental response in process of the regional development:A case study of Jiangsu province. Sci. Geogr. Sin. 2013, 33, 1442–1449. (In Chinese) [Google Scholar]
  82. Yang, Q.; Duan, X.; Wang, L.; Jin, Z. Land use transformation based onecological-production-living spaces and associated eco-environment efects: A case study in the Yangtze river delta. Sci. Geogr. Sin. 2018, 38, 97–106. (In Chinese) [Google Scholar]
  83. Liu, Y.; Liu, Y.; Chen, Y.; Long, H. The process and driving forces of rural hollowing in China under rapid urbanization. J. Geogr. Sci. 2010, 20, 876–888. [Google Scholar] [CrossRef]
  84. Liu, Y. Research on the urban-rural integration and rural revitalization in the new era in China. Acta Geogr. Sin. 2018, 73, 637–650. (In Chinese) [Google Scholar]
  85. Zheng, X.; Liu, Y. Scientific connotation, formation mechanism and regulation strategy of “rural disease” in China in the new era. Hum. Geogr. 2018, 33, 100–106. (In Chinese) [Google Scholar]
  86. Gökyer, E. Understanding landscape structure using landscape metrics. In Advances in Landscape Architecture; InTech: London, UK, 2013; pp. 663–676. [Google Scholar]
  87. Pacione, M. Private profit, public interest and land use planning-A conflict interpretation of residential development pressure in Glasgow’s rural-urban fringe. Land Use Policy 2013, 32, 61–77. [Google Scholar] [CrossRef]
  88. Tudor, C.A.; Ioja, I.C.; Patru-Stupariu, I.; Nita, M.R.; Hersperger, A.M. How successful is the resolution of land-use conflicts? A comparison of cases from Switzerland and Romania. Appl. Geogr. 2014, 47, 125–136. [Google Scholar] [CrossRef]
  89. Wu, Z. Optimization of production-living-ecological space and environmental protection of the Beijing-Tianjin-Hebei region. City 2014, 12, 26–29. (In Chinese) [Google Scholar]
  90. Zhang, W.; Jiang, H.; Wang, J. Ecological and environmental protection strategy for the coordinated development of the Beijing-Tian-Hebei region. Chin. J. Environ. Manag. 2017, 9, 41–45. (In Chinese) [Google Scholar] [CrossRef]
Figure 1. Relationships among production–living–ecological functions in the land system.
Land 09 00285 g001
Figure 2. Location of the study area.
Land 09 00285 g002
Figure 3. The production–living–ecological land use maps for the years (a) 1985; (b) 1995; (c) 2005; (d) 2018.
Land 09 00285 g003
Figure 4. Change of the land use structure from 1985 to 2018.
Land 09 00285 g004
Figure 5. Distribution of ecological environment quality in the BTH region.
Land 09 00285 g005
Figure 6. Carbon sequestration in the BTH region in 1985, 1995, 2005, and 2018.
Land 09 00285 g006
Figure 7. Carbon storage in different land use categories from 1985 to 2018.
Land 09 00285 g007
Figure 8. Spatial distribution of the changes in carbon storage from (a) 1985 to 1995, (b) 1995 to 2005, and (c) 2005 to 2018.
Land 09 00285 g008
Figure 9. The driving mechanism of land use transition on eco-environment effects in the BTH region.
Land 09 00285 g009
Table 1. Production–living–ecological land classification and eco-environmental quality index.
Production–Living–Ecological Land ClassificationBasic Land Use Classification
1st Level ClassesSubclassesEco-Environment Quality IndexSecondary TypeEco-Environment Quality Index
Production landAgricultural production land0.2522Paddy land0.30
Arid land0.25
Industrial production land0.1500Other construction land0.15
Living landUrban living land0.2000Urban built-up land0.20
Rural living land0.2000Rural settlement0.20
Ecological landForestland0.7813Woodland0.95
Shrub land0.65
Sparse woodland0.45
Other woodland0.40
Grassland0.6306High coverage grassland0.75
Medium coverage grassland0.45
Low coverage grassland0.20
Water area0.5519River canal0.55
Lake 0.75
Reservoir pond0.55
Permanent glacial snow land0.90
Tidal flat0.45
Beach0.55
Other ecological land0.4050Desert0.01
Gobi0.01
Saline-alkali land0.05
Swamp0.65
Bare land0.05
Bare rock0.01
Table 2. Carbon density of each land use type (unit: Mg C/hm2).
1st Level ClassesSubclassesCi_aboveCi_belowCi_soilCi_dead
Production landAgricultural production land11.1922.967.244.11
Industrial production land2.0011.9444.240
Living landUrban living land2.0011.9444.240
Rural living land2.0011.9444.240
Ecological landForestland28.3935.96133.1610.77
Grassland12.4425.7372.923.74
Water area3.7415.811.550
Other ecological land4.4814.0146.180.1
Table 3. Land use transfer matrix from 1985 to 2018 (km2).
Final YearInitial TotalGross Loss
Agricultural Production LandIndustrial Production landUrban Living LandRural Living LandForestGrasslandWater AreaOther Ecological Land
Initial YearAgricultural Production Land105,159.13319.241030.172294.641020.431543.32705.66128.94112,201.547042.42
108,315.48296.46752.53376.4354.5514.47158.098.77109,976.791661.31
93,394.361958.032042.016164.101598.852215.051299.18167.71108,839.2815,444.92
Industrial Production Land71.411694.4757.613.2110.869.4721.443.861872.33177.86
12.332239.4243.7713.020.960.5831.030.622341.72102.30
225.10655.04195.85275.5245.0195.261182.6142.442716.842061.81
Urban Living Land48.860.212061.010.753.102.8411.684.312132.7671.75
15.140.463406.600.870.700.661.570.043426.0519.45
145.9299.353971.17189.8815.2436.5631.230.554489.90518.73
Rural Living Land1282.947.67246.819066.2626.7232.2028.048.6910,699.331633.07
41.298.07163.4011,235.791.060.383.000.1111,453.09217.31
2340.35170.20469.408461.0550.7379.9576.4212.7911,660.893199.85
Forest822.2331.3712.0426.0342,140.231466.6651.568.1244,558.242418.02
57.4732.1918.0514.2644,568.9542.2415.810.0944,749.07180.12
1137.31319.3447.79198.8240,920.411929.2792.7921.1344,666.863746.45
Grassland1894.25126.336.3534.501466.5531,983.87123.3046.7935,681.943698.06
95.6554.718.924.8318.5834,950.5942.270.6035,176.16225.56
1944.63618.7957.48250.402740.0428,994.17248.95180.4935,034.946040.77
Water Area498.7795.6610.8921.9172.3891.305523.6928.826343.42498.77
267.4782.3375.2313.7118.6720.355991.1526.656495.57504.41
975.12253.6292.55153.94142.14315.483919.21427.916279.952360.74
Other Ecological Land199.2166.771.165.798.8046.4930.191865.812224.22358.41
34.453.2021.411.983.385.6537.011988.262095.34107.09
611.6161.0912.2648.8752.27316.03129.78793.212025.131231.92
Initial Total109,976.792341.723426.0511,453.0944,749.0735,176.166495.572095.34215,713.79
108,839.282716.844489.9011,660.8944,666.8635,034.946279.952025.13215,713.79
100,774.394135.466888.5115,742.5745,564.6833,981.786980.171646.23215,713.79
Gross Gain4817.66647.251365.042386.832608.843192.28971.88229.53
523.80477.421083.30425.1197.9184.35288.7936.87
7380.033480.432917.347281.534644.274987.613060.96853.02
Note: Area counts of persistence on the main diagonal (in bold) and change off the main diagonal from 1985 to 1995 (in italics), 1995–2005, and 2005–2018 (underlined).
Table 4. Changes in the area of ecological environment quality in the Beijing–Tianjin–Hebei (BTH) region from 1985 to 2018.
Types1985199520052018
Area (km2)%Area (km2)%Area (km2)%Area (km2)%
Low-quality area87,011.5840.3487,294.7540.4790,050.2741.7589,365.2441.43
Medium-low-quality area27,390.1012.7027,250.7912.6324,511.4711.3625,693.2111.91
Medium-quality area18,778.398.7118,782.558.7118,746.038.6918,403.218.53
Medium-high-quality area44,135.4620.4643,894.5220.3545,254.2220.9843,825.5620.32
High-quality area38,398.2617.8038,491.1817.8437,151.8117.2238,426.5717.81
Table 5. Major land use changes and contributions affecting the quality of the ecological environment in the BTH region.
Type of ChangeLand Use Function Transformation1985–19951995–20052005–2018
L%L%L%
Eco-Environment ImprovementAgricultural production land→Forestland0.00250230.560.00013423.440.00392123.86
Agricultural production land→Grassland0.00270733.070.00388523.64
Agricultural production land→Water area0.00097211.870.0002238.480.00180510.98
Industrial production land→Water area0.00005810.140.00220213.40
Grassland→Forestland0.00102412.510.0000132.270.00191411.65
Total0.00720588.010.00042574.330.01372783.53
Eco-Environment Deterioration Agricultural production land→Industrial production land0.000147.540.0009285.27
Agricultural production land→Urban living land0.0002492.700.0001829.810.0004942.81
Agricultural production land→Rural living land0.0005566.030.0000914.900.0014918.47
Forestland→Agricultural production land0.00201921.900.0001417.600.00278915.84
Forestland→Industrial production land0.0009345.30
Forestland→Grassland0.0013487.66
Grassland→Agricultural production land0.00332636.080.0001689.050.00341119.37
Grassland→Industrial production land0.0002823.060.0001226.570.0013787.83
Water area→Agricultural production land0.0006947.530.00037220.040.0013517.67
Water area→Industrial production land0.0001538.270.0004712.68
Total0.00712677.300.00136973.780.01459582.90

