Next Article in Journal
Evaluating Some Major Assumptions in Land Registration: Insights from Ghana’s Context of Land Tenure and Registration
Previous Article in Journal
Environmental Pollution Control and Sustainability Management of Slum Settlements in Makassar City, South Sulawesi, Indonesia
 
 
Erratum published on 12 January 2021, see Land 2021, 10(1), 60.
Article

Warming Effort and Energy Budget Difference of Various Human Land Use Intensity: Case Study of Beijing, China

1
Key Laboratory of Geospatial Technology for the Middle and Lower Yellow River Regions (Henan University), Ministry of Education, Kaifeng 475004, China
2
Key Laboratory of Integrative Prevention of Air Pollution and Ecological Security of Henan Province, College of Environment and Planning, Henan University, Kaifeng 475004, China
3
School of Geography and Information Engineering, China University of Geosciences, Wuhan 430074, China
4
Institute of Geographic Sciences and Natural Resources Research, Chinese Academy of Sciences, Beijing 100101, China
*
Author to whom correspondence should be addressed.
Land 2020, 9(9), 280; https://doi.org/10.3390/land9090280
Submission received: 12 July 2020 / Revised: 8 August 2020 / Accepted: 17 August 2020 / Published: 20 August 2020
(This article belongs to the Section Land–Climate Interactions)

Abstract

:
Human land use intensity affects the surface energy balance by changing the biogeophysical parameters. This study used Moderate Resolution Imaging Spectroradiometer remote sensing data and surface energy balance algorithms to quantify changes in surface energy budgets corresponding to changes in land use in Beijing from 2000 to 2015. Land use was reclassified by considering land use intensity. The difference in the latent heat flux (LE) and net radiation (Rn) (LE−Rn) expressed the warming or cooling effect. The results showed that: (i) The increasing trend of net longwave radiation in Beijing offset the decreasing trend of net shortwave radiation. The Rn changed slightly, while the LE and LE−Rn showed a significant increase of 0.55 and 0.56 W/(m²∙year), respectively. The findings indicated that considering only radiative forcing, or even Rn, was not enough to measure the impacts of land use change on the energy budget. (ii) The order of Rn, LE, and LE−Rn values from high to low were natural and seminatural areas, cropland, mixed pixel areas, urban expansion areas, and old urban areas. Compared with natural and seminatural areas, the changing LE−Rn trend in the other four land use types decreased with the increase in human impact intensity, indicating that human activities weakened the positive change trend of LE−Rn and increased the warming effect. (iii) Although the temporal trend of LE increased in Beijing from 2000 to 2015, the effect of Rn on LE−Rn was greater than that of LE, especially in the four land use types affected by human activities. The results for surface temperature in various land use types confirmed this point. This study highlights the energy budget differences of various land use types affected by human activities. It makes an important contribution to understanding the urban heat island effect from a biogeophysical perspective.

Graphical Abstract

1. Introduction

Land use change (LUC), resulting from human activities, is one of the main driving factors of global climate change [1,2]. LUC changes the surface biogeochemical cycle and biogeophysical mechanisms that affect the regional and global climate systems [3,4,5,6]. At present, most studies emphasize the impact of the carbon source and sink aspect of the LUC system [7,8,9,10], but they ignore the effect of biogeophysical mechanisms on surface energy. Therefore, studying the impact of LUC on the surface energy budget is necessary to correctly understand the climate regulation effect of LUC and urban heat island effect of urban expansion [11].
The exchange process of surface radiation reflects the energy transmission in the ground-air coupling mechanism [12,13,14]. As a link between land-air energy conversion, the surface energy balance is an important intermediate mechanism for temperature changes caused by LUC [15]. LUC affects radiation and the energy budget by changing biogeophysical parameters, such as surface albedo and latent heat flux (LE), resulting in temperature changes [16,17,18,19,20,21]. As one of the important forcing factors, the albedo measures the reflection of solar radiation from different land use types, and thus can change the surface energy balance [22]. It has been found that the surface albedo can act on the planetary albedo at the top of the troposphere; if the global planetary albedo changes by 5%, the global surface temperature will change by ~1 °C [23]. Additionally, soil moisture and vegetation can affect the surface LE. More vegetation may increase the absorption of solar radiation on the ground, but if the extra energy is used in evapotranspiration it may cause a cooling effect [24]. Therefore, when studying the feedback effect of LUC on the surface energy budget, it is necessary to start from albedo-led radiative forcing (or energy intake or net radiation (Rn)) and LE-led energy expenditure to identify their interactions.
Land use and land management changes affect the energy budget and result in obvious surface temperature changes corresponding to various land use types [6,25]. In recent years, many researchers have studied the energy balance and constructed a series of methods for estimating surface energy budget processes under various land use types or conditions, such as the Surface Energy Algorithms for Land model and Surface Energy Balance System model [16,17,26,27]. In China, it has been confirmed that these methods can describe the surface energy balance process more accurately and quantitatively, and can highlight the interaction and role of various energy elements at a regional scale [28,29]. Some studies compared the radiative forcing corresponding to the albedo changes caused by typical land use types [30,31]; other studies analyzed the differences in energy budgets and evapotranspiration effects of different types of underlying surfaces based on local-scale urban meteorological parameterization schemes, they emphasized the differences in the energy budget under the complex urban surfaces in cities [18,32].
Using energy balance parameterization schemes combined with remote sensing to explore the energy and temperature feedbacks of LUC has also attracted research attention. Lee and Ge et al. (2011, 2019) introduced remote sensing data and methods to compare the energy and temperature feedbacks of typical LUC to radiant and non-radiative energy contributions in China [33,34]. Duveiller et al. (2018a, 2018b, 2020) also published a series of reports analyzing the role of biogeophysical factors, combined with remote sensing, to pioneer a framework for evaluating the energy and temperature effect of LUC [35,36,37]. These studies provide us with some information, but because of the diversity of land use and the complexity of the changes of surface parameters related to land use, understanding how the changes of surface energy intake and expenditure correspond to LUC still faces some challenges [38]. There are no practical guidelines for specific regions, and in and around urban areas, in particular, the impacts of human activities on the underlying surface are variable and complex [13,39,40,41]. The final impacts of LUC on the interaction between energy factors, under different intensities of human activities, remain inconclusive.
On the basis of previous research, we combined MODIS (Moderate Resolution Imaging Spectroradiometer) remote sensing products and land energy balance algorithms to calculate the surface energy intake and expenditure corresponding to the underlying surface changes in Beijing from 2000 to 2015. The results of mutual forcing between Rn and LE were also analyzed. Additionally, on the basis of the study results, we explored the relationship between temperature (LST), LE, and Rn.

2. Materials and Methods

2.1. Study Data

The land use data for 2000 and 2015 for Beijing, with a spatial resolution of 1 km used in this study, came from the Resource and Environmental Science Data Center of the Chinese Academy of Sciences (http://www.resdc.cn/), as did the annual interpolated temperature data for Beijing. The water vapor pressure data were obtained from the Scientific Data Sharing Center of the China Meteorological Administration (http://data.cma.cn/).
This study mainly used remote sensing products with MODIS as the source data, which have mature algorithms and theoretical supports, and have been widely used in the world. The solar radiation data were downloaded from the Environmental Ecology Laboratory of the National University of Seoul, South Korea (http://environment.snu.ac.kr/). As shown in Table 1, the remote sensing inversion data for land surface albedo (Albedo), LST, emissivity (Emissivity), and LE all came from MODIS data products provided by NASA (https://modis.gsfc.nasa.gov/), over the time span 2000–2015. We unified these remote sensing data into annual average data with a spatial resolution of 1 km to analyze the surface energy budget of Beijing from 2000 to 2015.

2.2. Methods

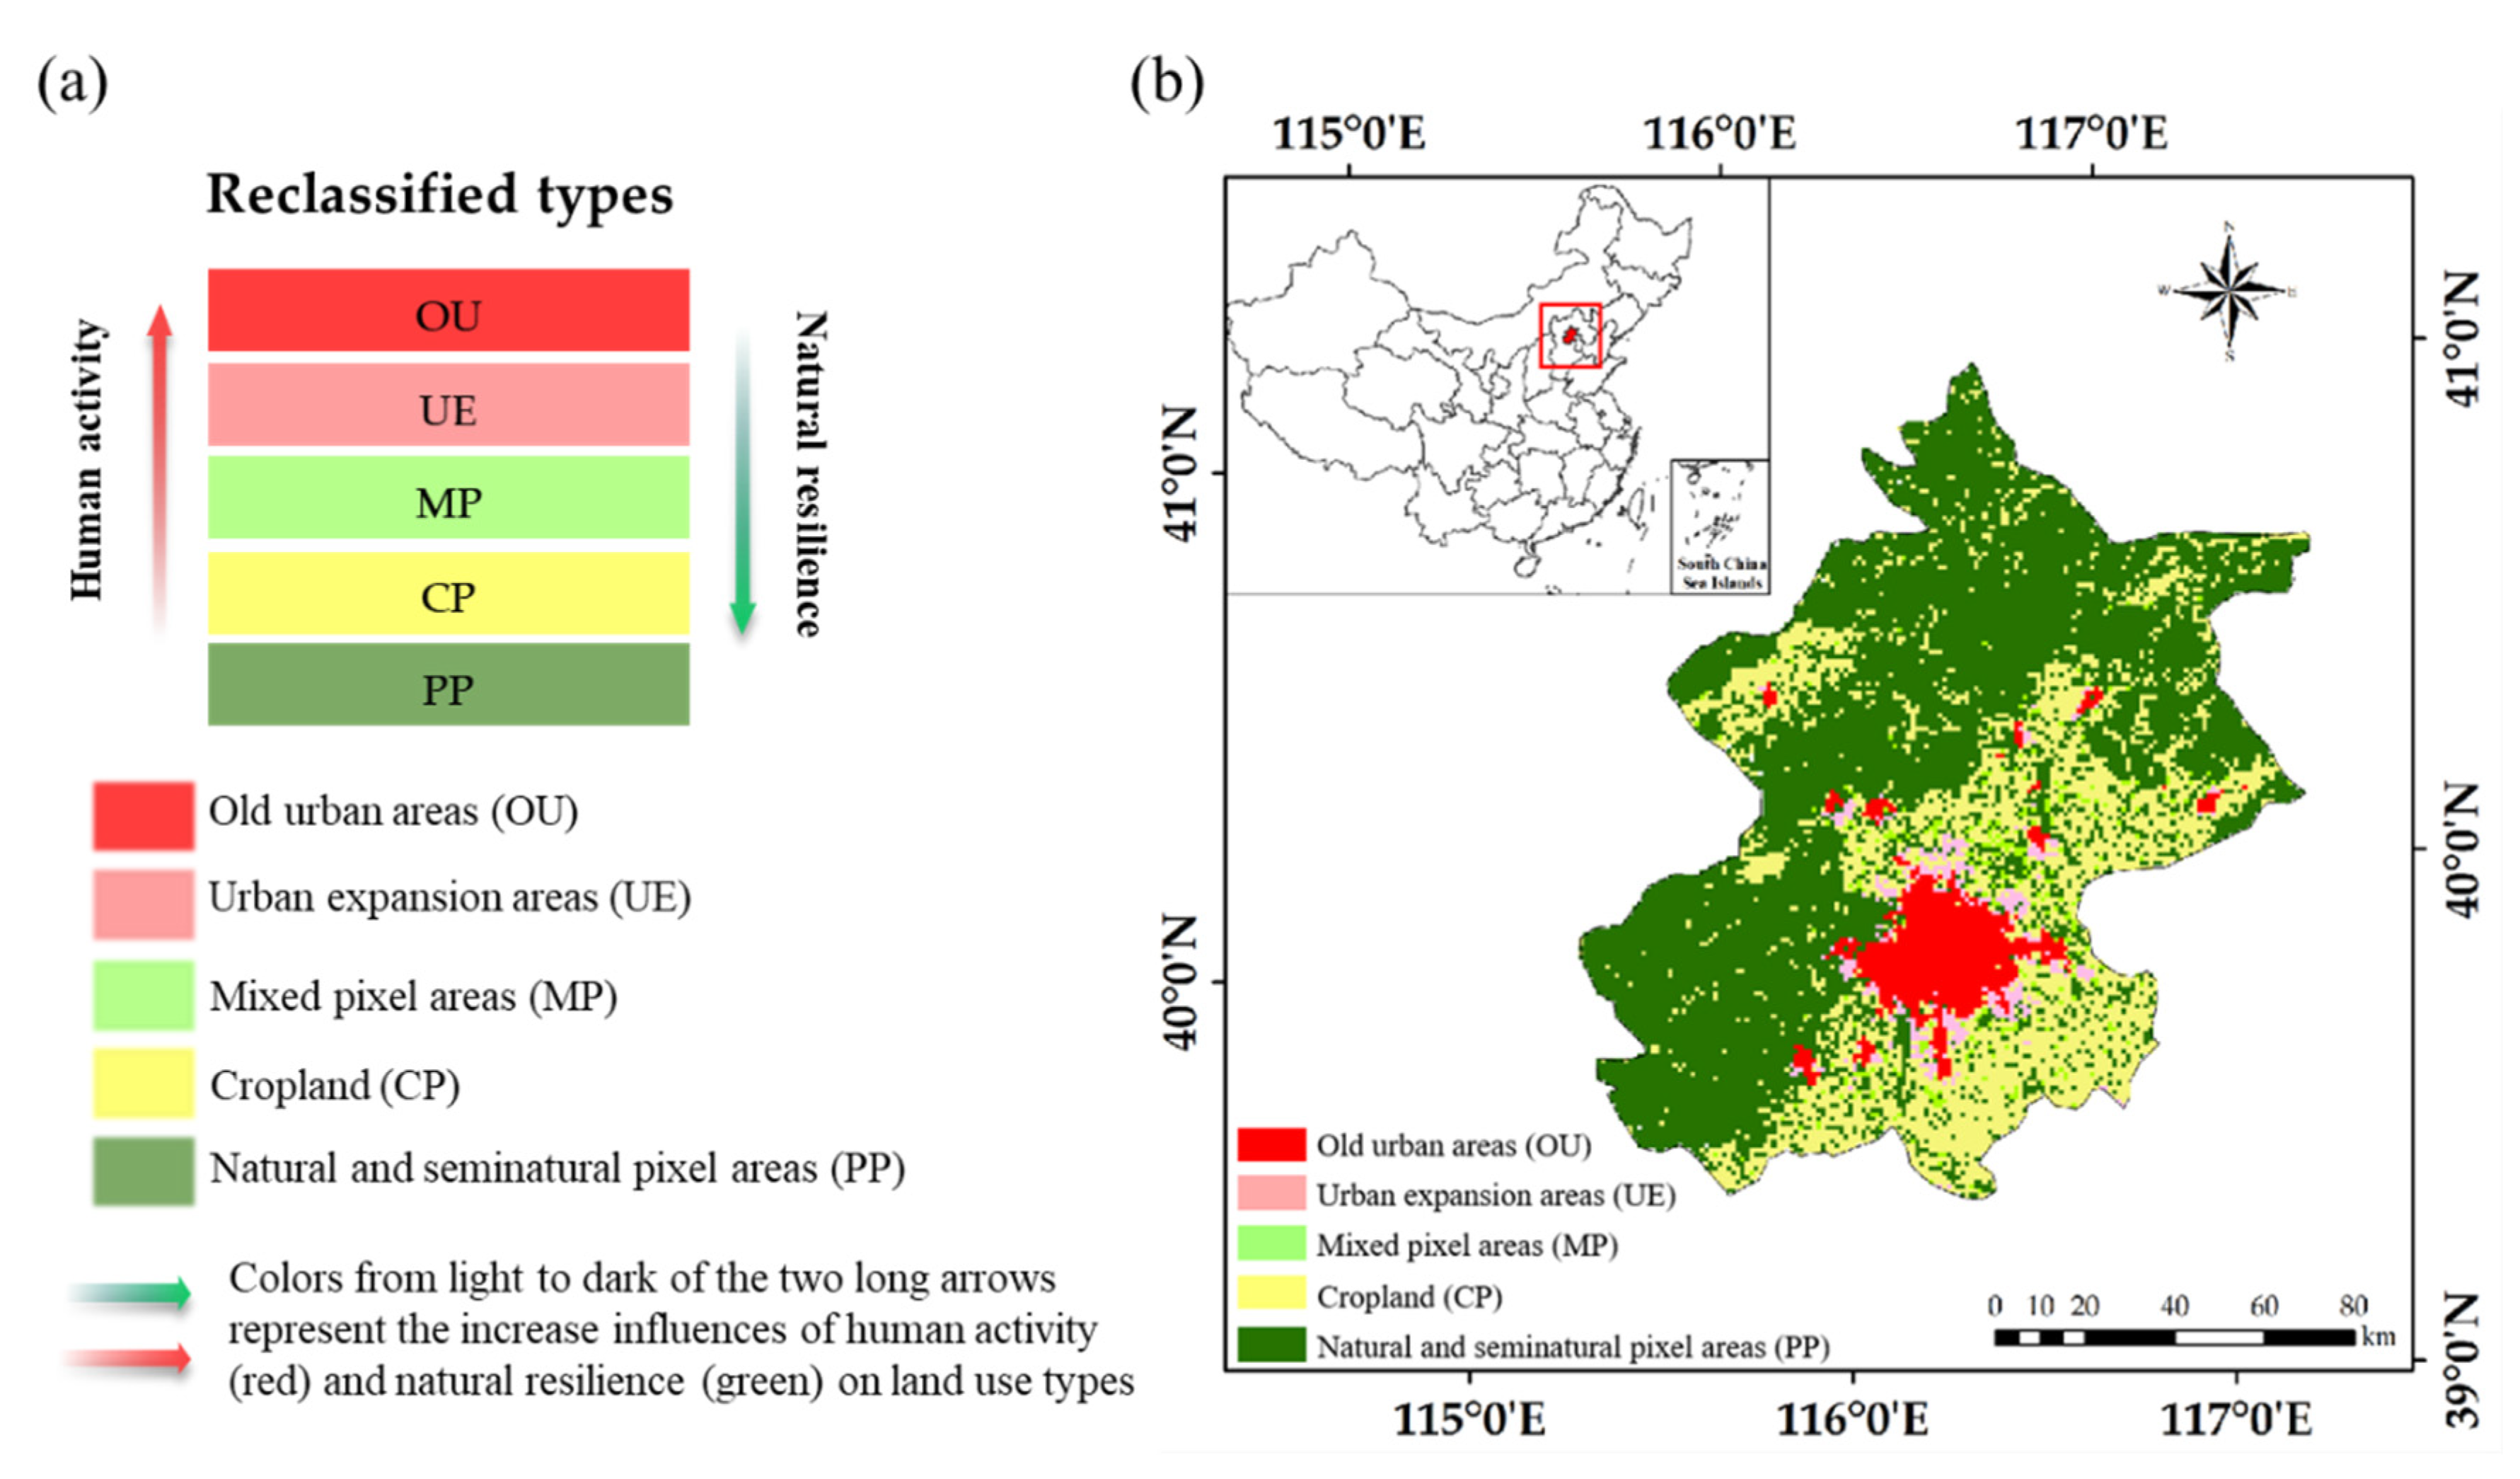
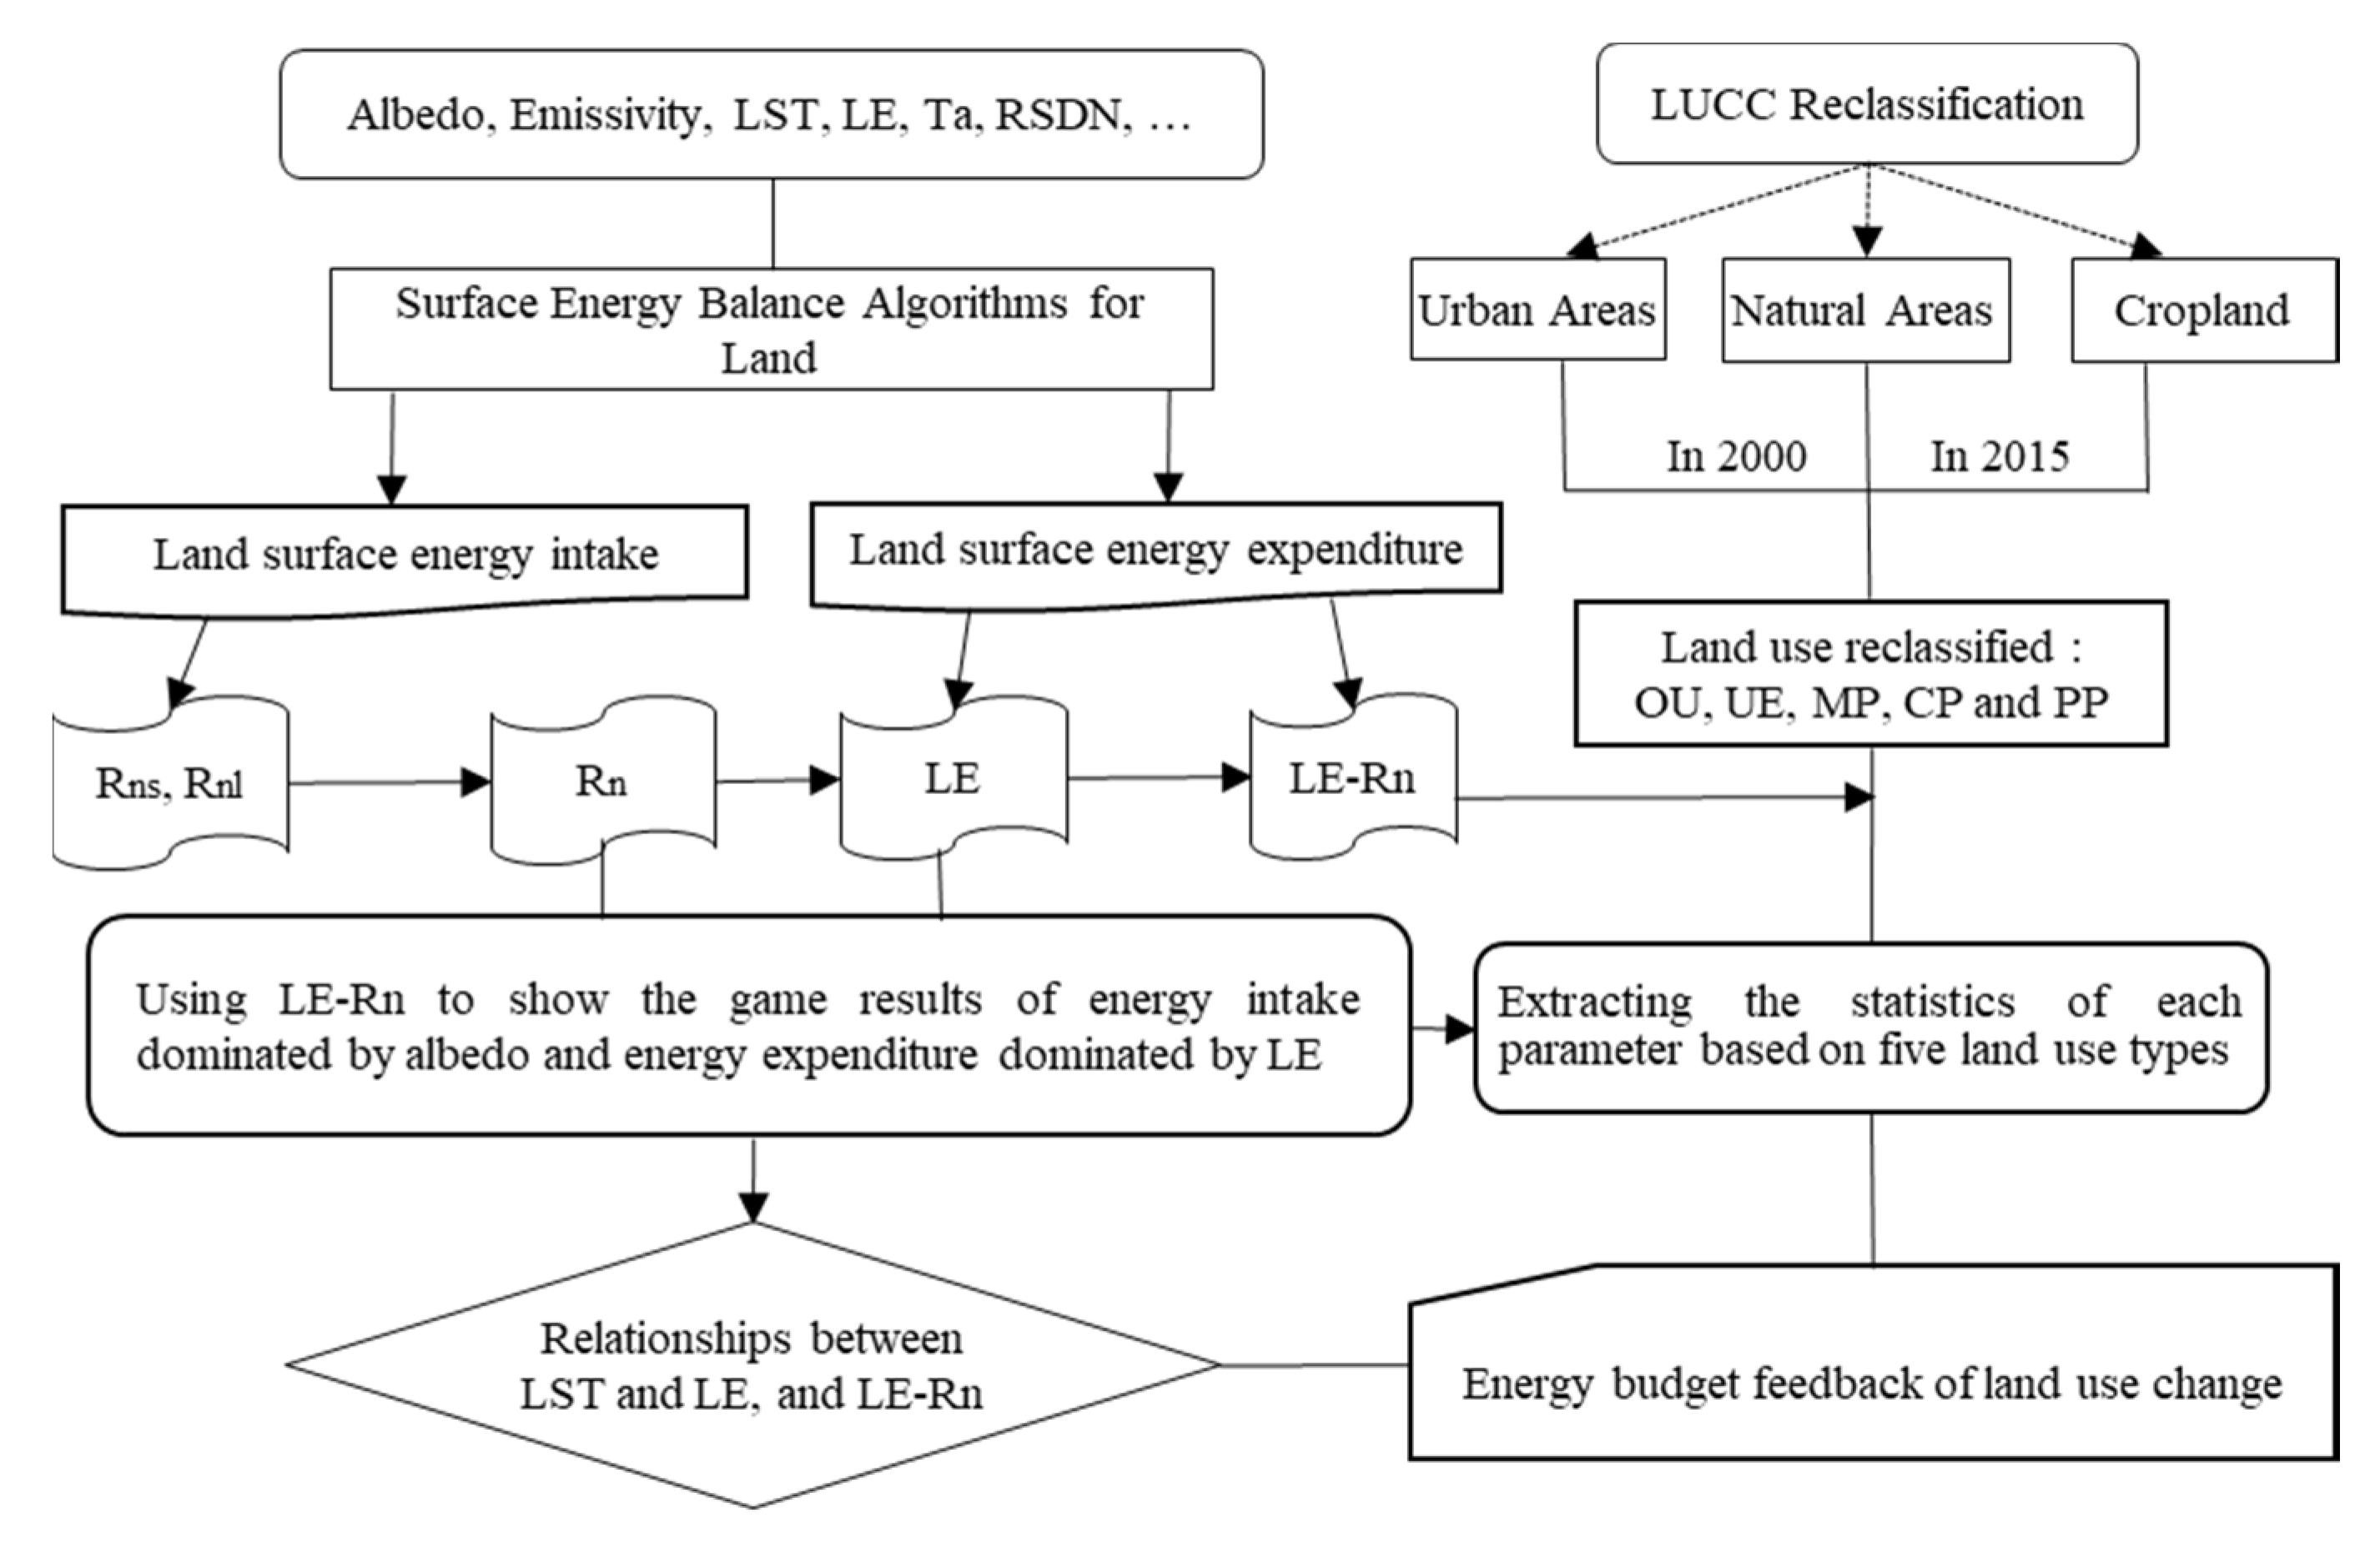
2.2.1. Land Use Data Reclassification

The land use datasets for 2000 and 2015 in Beijing were reclassified based on the effects of human activities and the natural resilience of the land use types [39]. First, three land use types with obvious differences in underlying surface cover were classed as: urban areas, cropland, and natural and seminatural areas for the two datasets. Second, areas that were always urban from 2000 to 2015 were defined as old urban areas (OU); areas that were always cultivated land were defined as cropland (CP); and unchanged natural or seminatural areas, the urban expansion areas, and areas with changes in land use type that were not urban expansion were defined as pure pixel areas (PP), urban expansion areas (UE), and mixed pixel areas (MP), respectively. According to their natural resilience, the land use types after reclassification were ordered from high to low as: PP > CP > MP > UE > OU. Conversely, based on the intensity of human activities, the order of land use types from high to low was: OU > UE > MP > CP > PP, so that the land use types reflected the strength of human activities to some extent (Figure 1a). Overall, the area of pixels with changed land use was 789 km2, accounting for 4.8% of the total area. As shown in Figure 1b, the total area of the OU was 1259 km2; the UE around the OU covered an area of 517 km2; and the MP covered a total area of 272 km2. The CP and PP occupied most of the land area in Beijing, at 4619 km2 and 9743 km2, respectively.

2.2.2. Surface Energy Balance and Warming Effect

Based on the surface energy balance algorithms of land uses, this study calculated the changes in the energy budget in Beijing and analyzed the effect of different land uses on the energy budget. On the basis of the five land use types (OU, UE, MP, CP, and PP), we explored the differences and relationships in energy intake and expenditure parameters under various land use types (Figure 2).
According to the studies of Bastiaanssen et al. (1998) and Huang et al. (2018) [16,28], the Rn was calculated as:
R n = R n s + R n l
R n s = R s R s = ( 1 α ) R s
where Rns is net shortwave radiation; Rnl is net longwave radiation; R s is the downward shortwave radiation; R s is the upward shortwave radiation, and its unit of radiation is W/m2; and α is the surface albedo. The net longwave radiation was calculated by the following formula:
R n l = R l R l = ε s R l ( T a , ε a ) R l ( T s , ε s ) = ε s σ ε a T a 4 σ ε s T s 4
where R l is downward longwave radiation; R l is upward longwave radiation, and its unit of radiation is W/m2; ε s is the surface emissivity; σ is the Boltzmann constant, which is 5.67 × 10⁻⁸ W/m2/K4; T a is the air temperature; and Ts is the land surface temperature and its unit is K. ε a is the emissivity of air, and its calculation formula is:
ε a = 1.24 ( e a / T a ) 1 7
where e a is the saturated water vapor pressure and its unit is hpa.
In keeping with the study of Anderson-Teixeira et al. (2012), this study used −Rn to denote the energy intake forcing caused by biogeophysical factor factors such as albedo [42]. According to the calculation of radiative forcing of albedo (Tang et al., 2020), the negative sign indicates that the Rn decreases with the increase of albedo. Meanwhile, LE represents the forcing of energy expenditure by consuming Rn. Therefore, LE−Rn in this study represents the final result of the energy intake and expenditure forcing balance caused by LUC. In the forcing balance, larger values of LE−Rn reduce the energy from the sensible heat flux and the soil heat flux. Therefore, less energy is available to heat the atmospheric and surface temperature, corresponding to a cooling feedback or a weak warming feedback. Conversely, lower values of LE−Rn equate to a stronger warming feedback.

2.2.3. Spatial Analysis and Statistical Analysis

During the process of specific analysis, we also used the zonal statistical method of spatial statistics to summarize the mean values of all pixels within a land use type. We also used the linear regression, trend fitting, and t test methods (a significance test with small sample) of classical statistics to analyze the temporal changes of different energy factors for various land use types from 2000 to 2015.

3. Results

3.1. Changes in the Surface Energy Intake

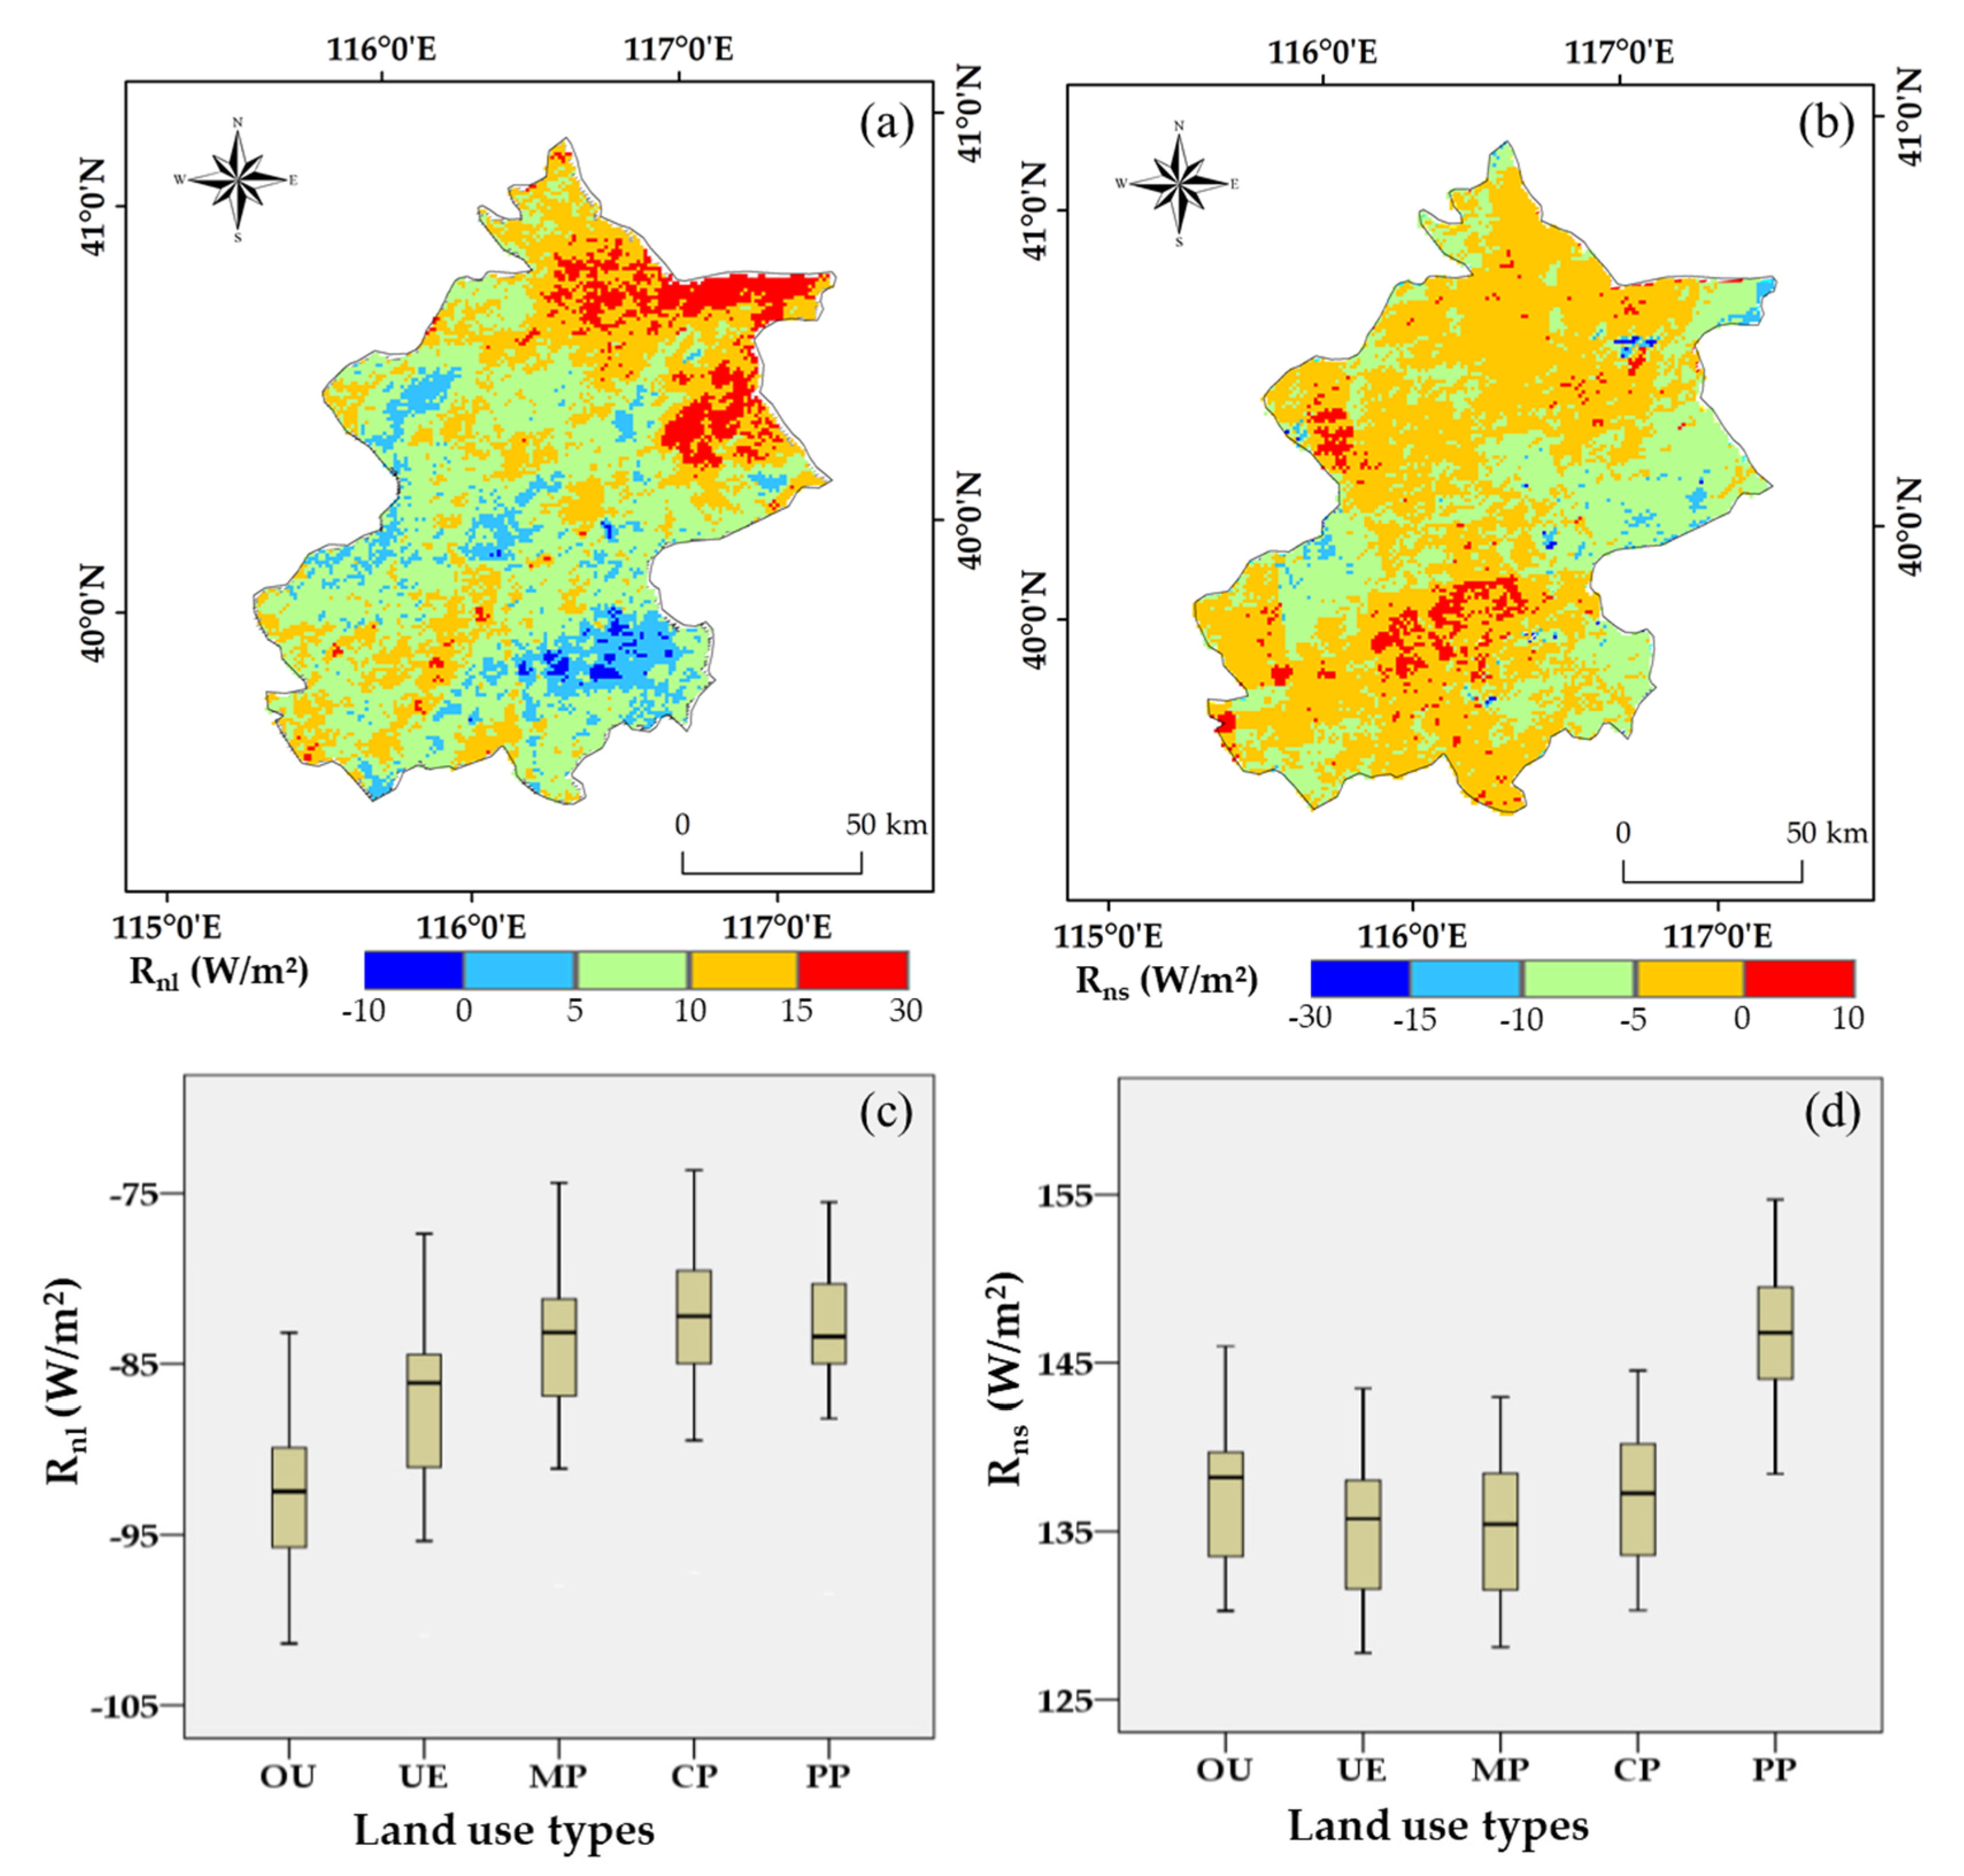
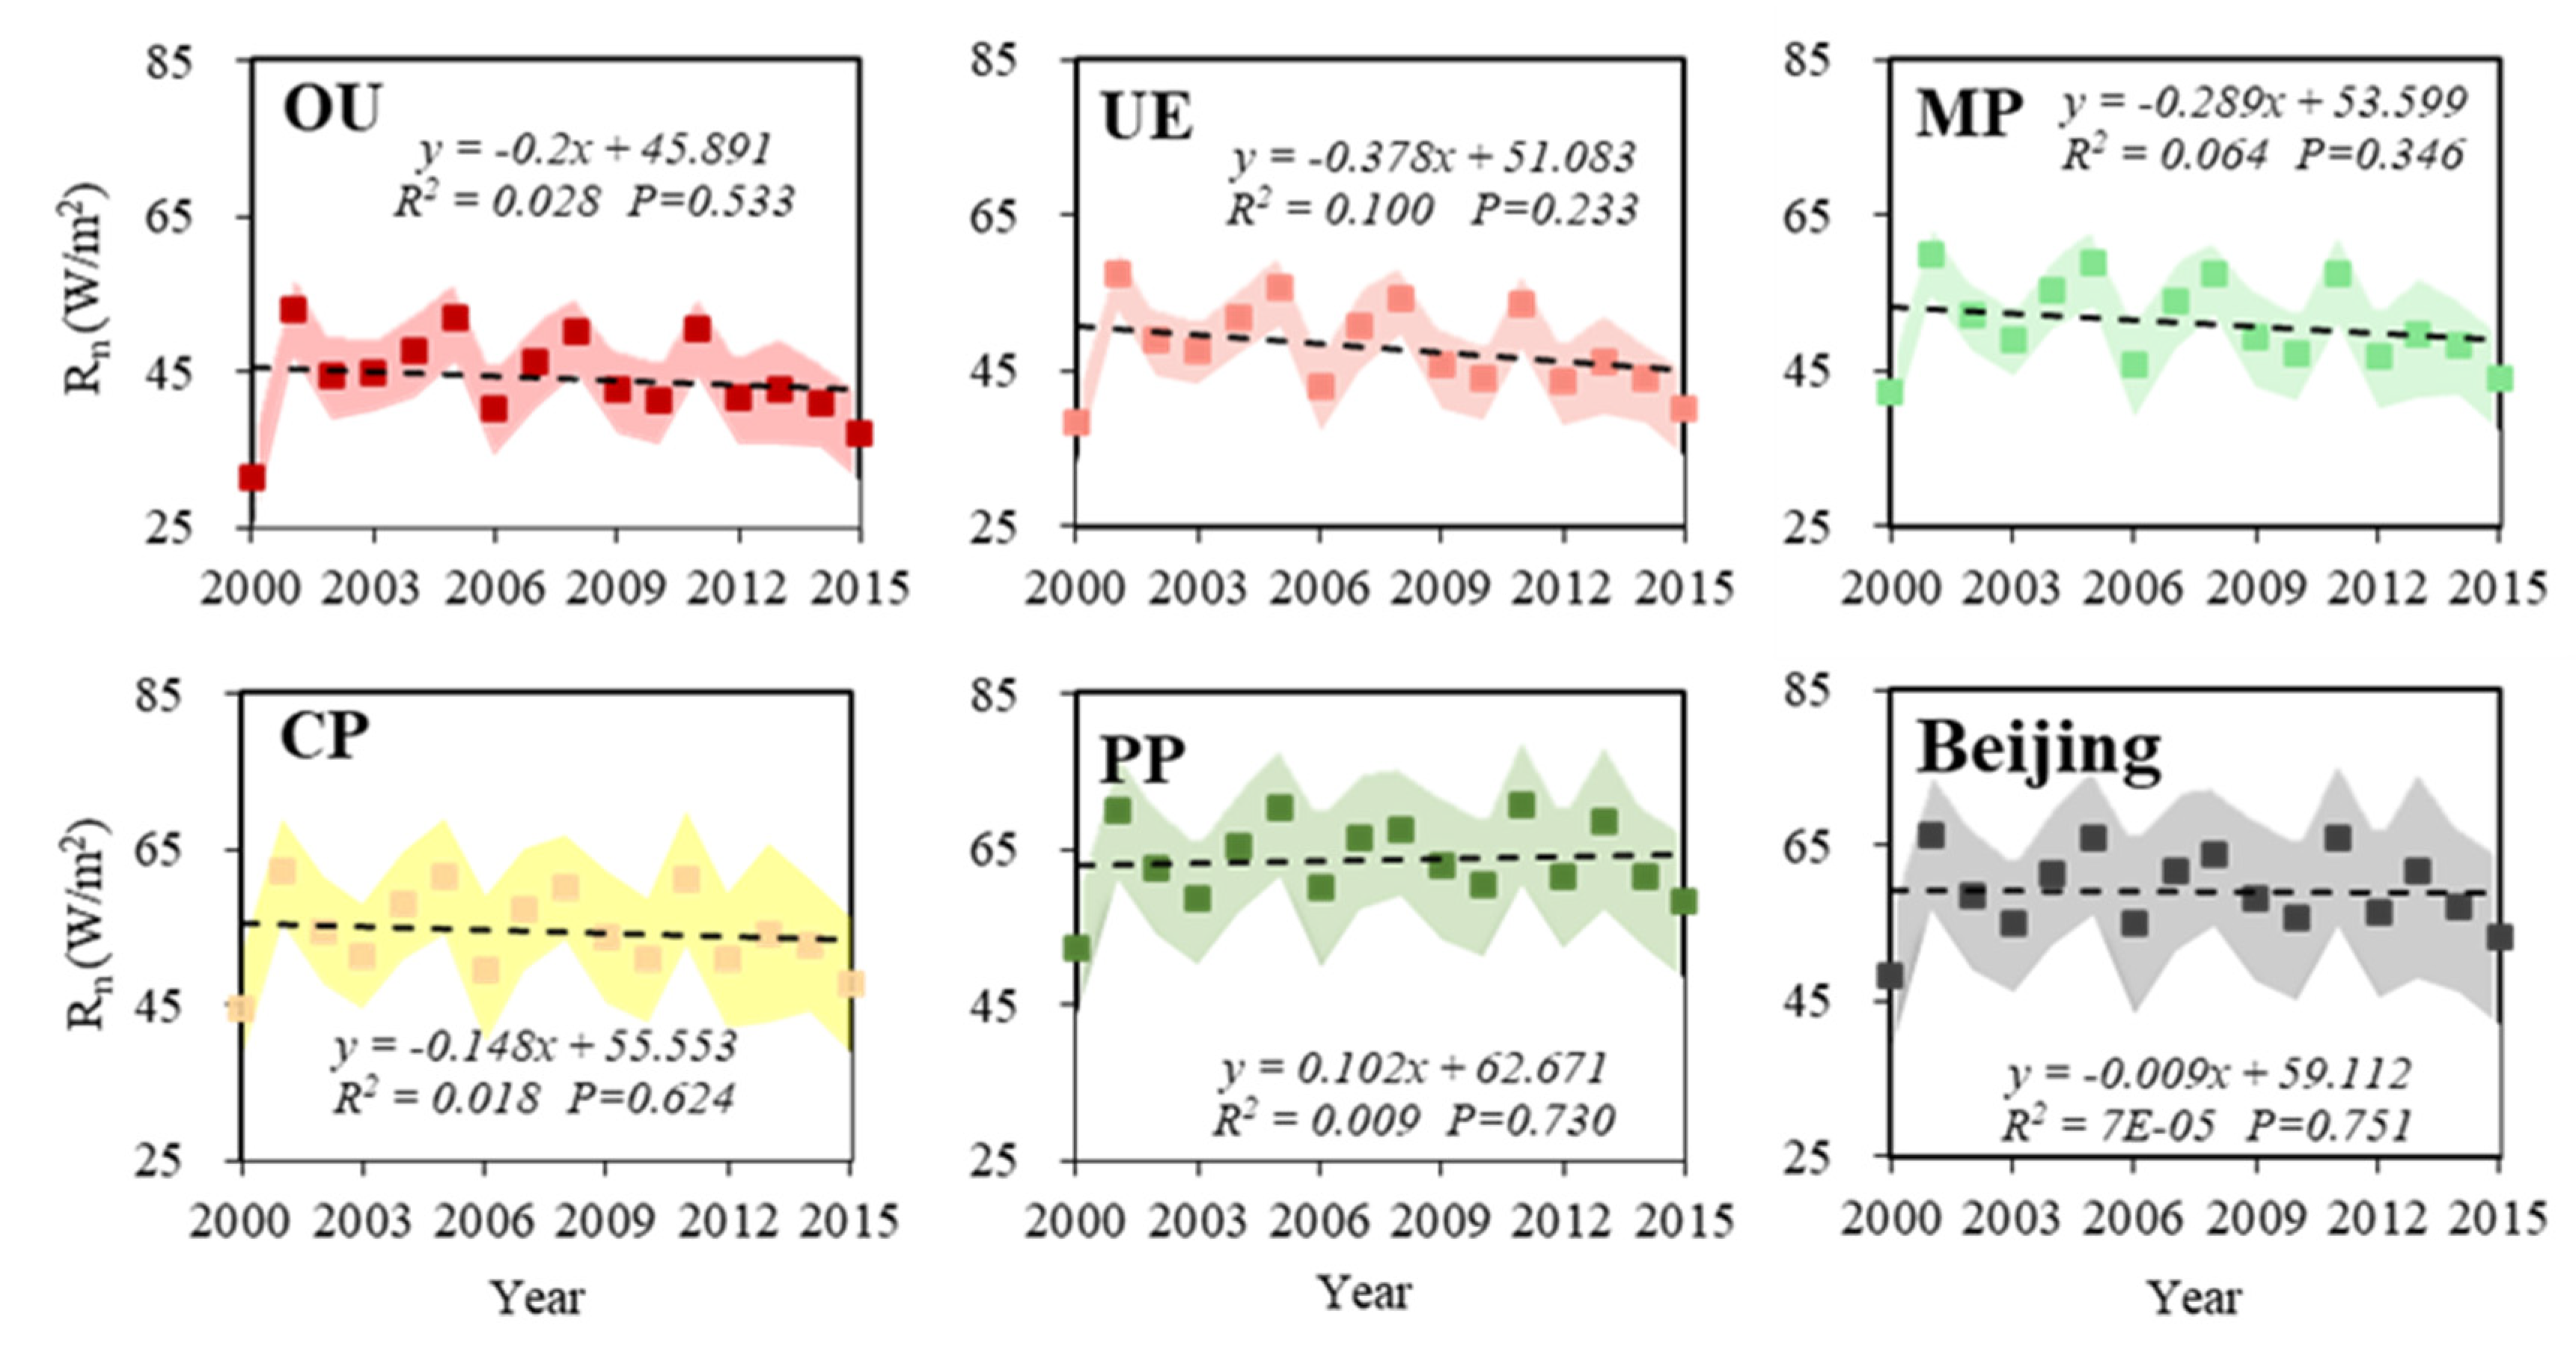
3.1.1. Net Longwave and Shortwave Radiation

The difference between the first and the last periods of data was used to calculate the spatial variation in the net shortwave and net longwave radiation from 2000 to 2015. Overall, the change in net longwave radiation in most areas of Beijing was positive (Figure 3a). The multi-year trend values of Rnl and Rns were 0.33 W/(m²∙year) and −0.34 W/(m²∙year), and the multi-year average values of Rnl and Rns were 142.94 W/m2 and −83.91 W/m2.
In terms of spatial distribution, the size of the net longwave radiation increment was generally large in the northeast and smaller in the southeast (Figure 3a). The regional distribution of negative differences was concentrated in the OU and CP regions in the southeast, while the high positive differences were mainly distributed in the PP region of the northeast, where Rnl rose to 50 W/m2. In contrast, Figure 3b shows that the net shortwave radiation Rns in many areas of Beijing decreased, and its high value areas were mainly distributed in the OU area, with a maximum value of 61 W/m2.
The variation of Rnl showed that PP had the largest multi-year average of 146.79 W/m2, followed by OU, CP, UE, and MP. Although the surface parameters had a great influence on Rnl, this result showed that Rnl did not correspond to obvious rules for the land use types under different intensities of human activities. For Rns, when human activities increased, the corresponding Rns decreased. As shown in Figure 3b, the multi-year mean of Rns was negative, and the order from large to small was CP > PP > MP > UE > OU.

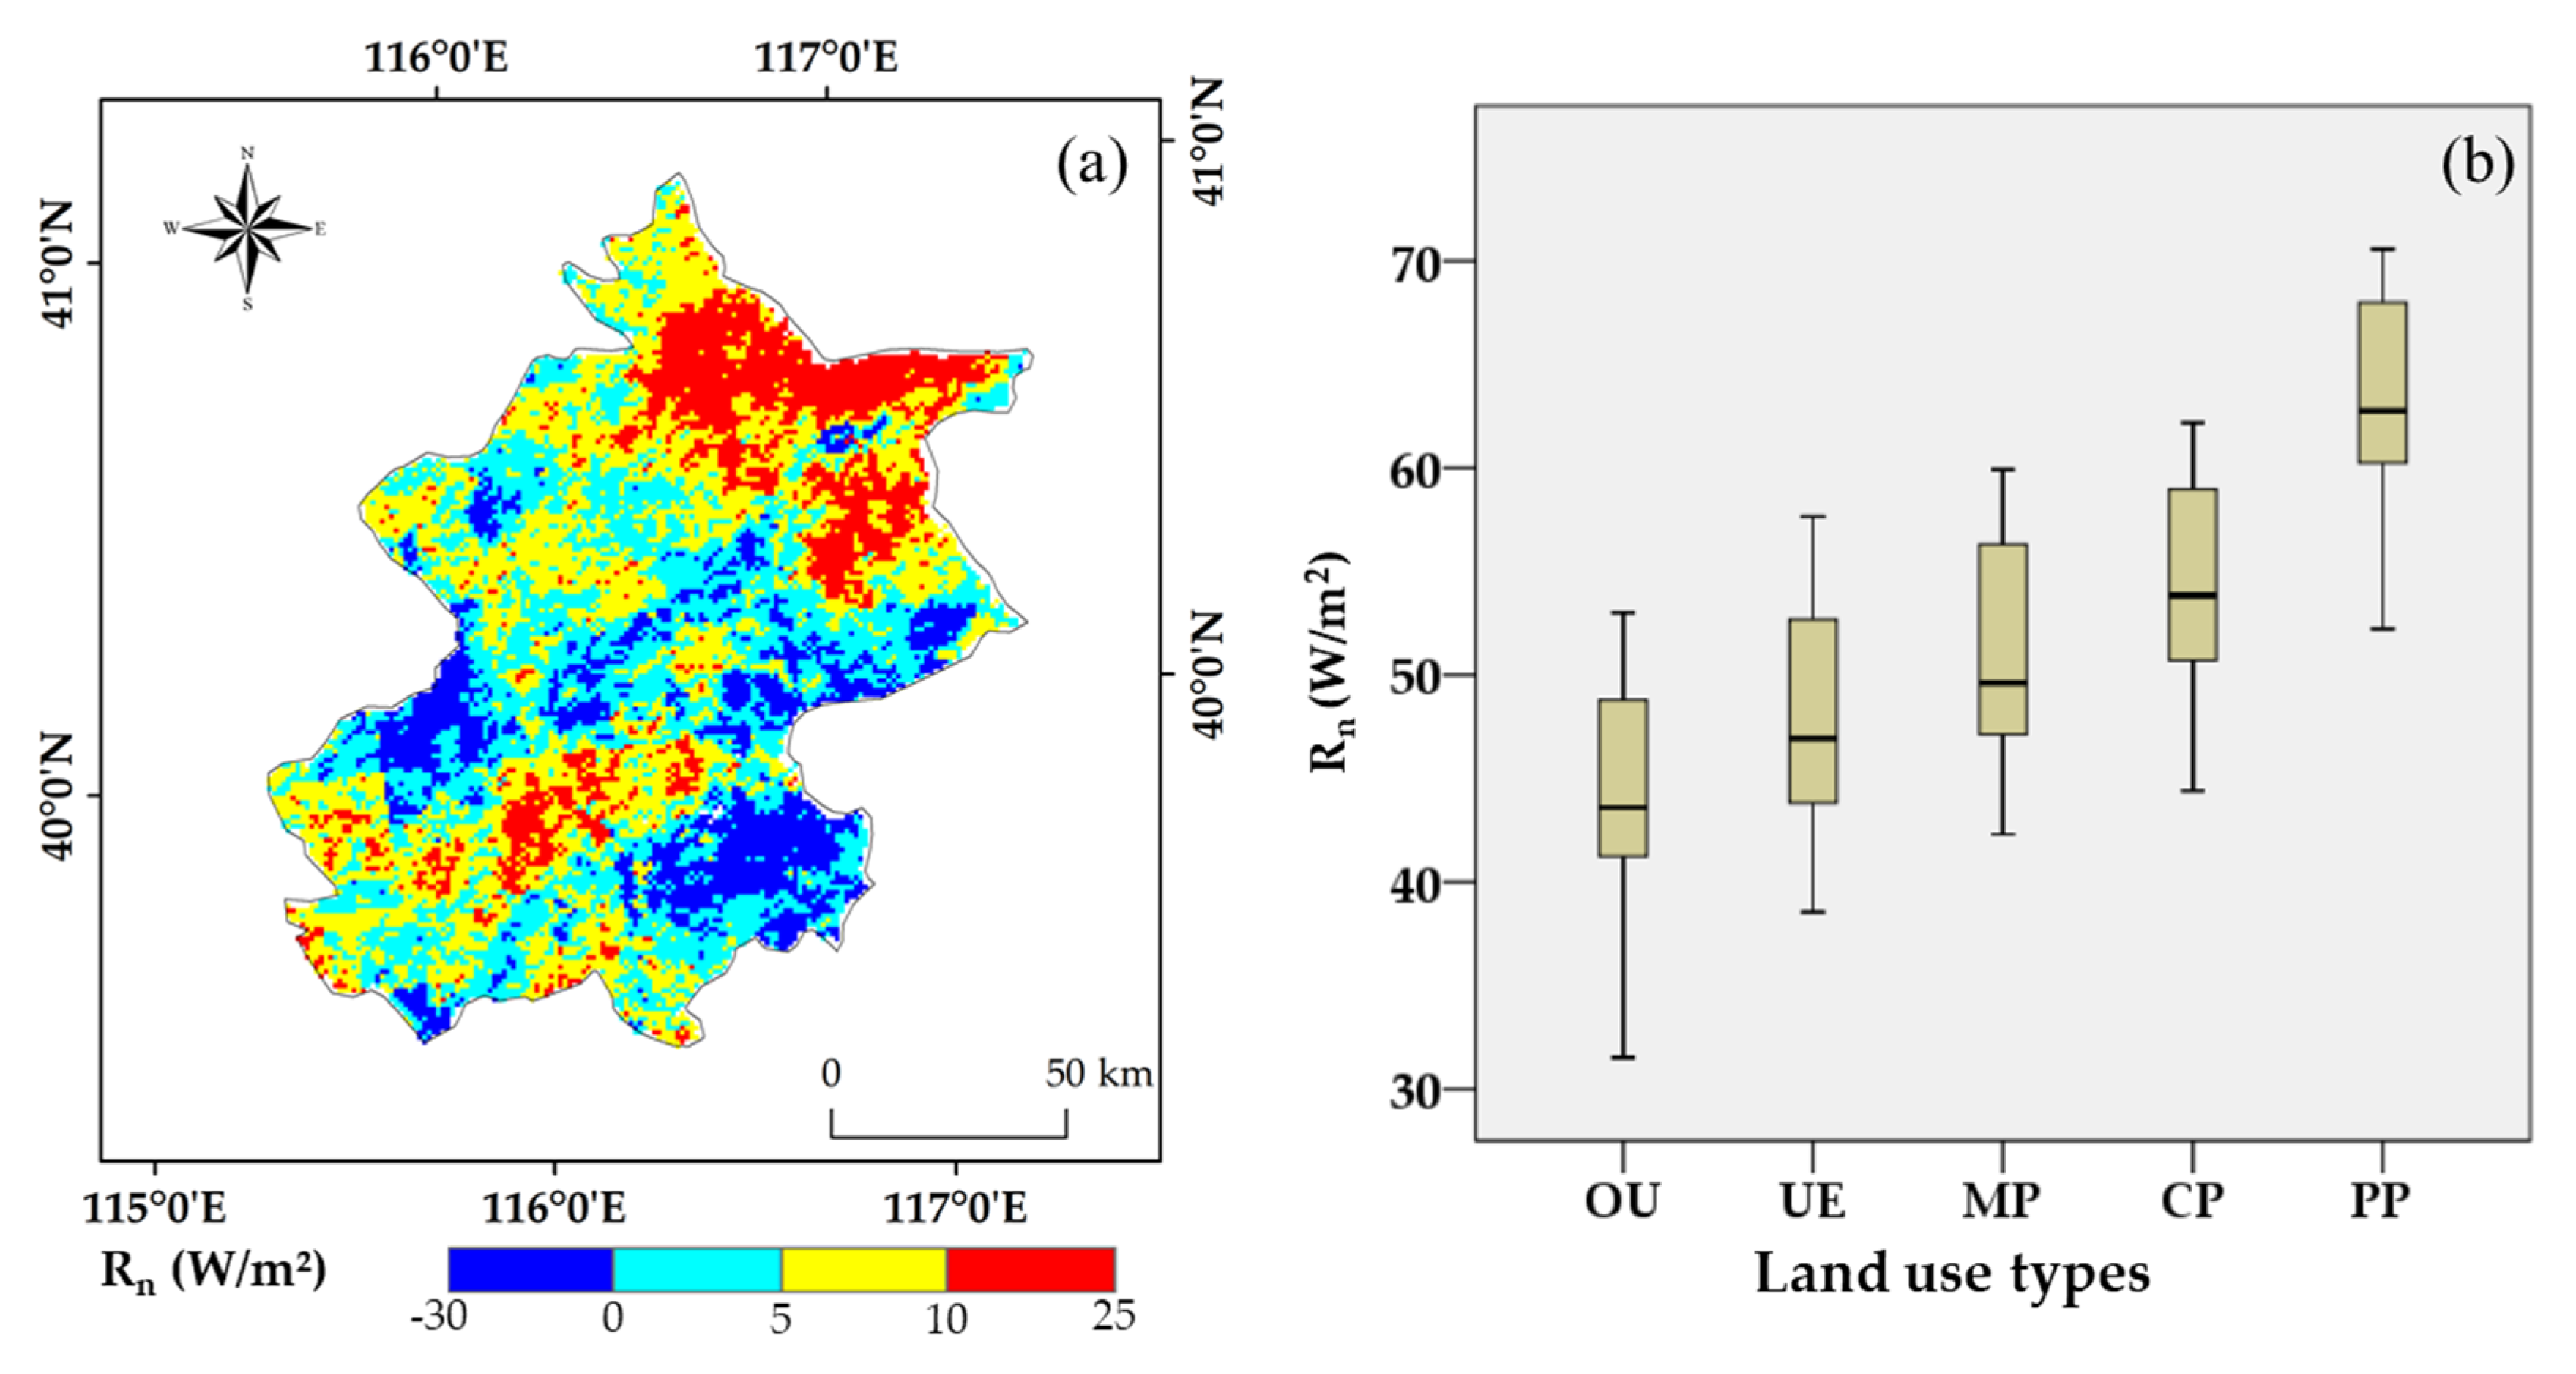
3.1.2. Changes in Net Radiation

The net surface radiation is the net energy obtained from the net longwave and shortwave radiation processes, and therefore it is an important indicator to measure the regional energy intake. The average annual surface radiation in Beijing from 2000 to 2015 was 59.03 W/m². By superimposing the net longwave and shortwave radiation, the Rn changed significantly in some areas, showing increases in the northeast but decreases in the southeast (Figure 4a). Although the overall Rn in 2015 was higher than that in 2000, the changes in Rn over the years were very small. Thus, the variation in Rn was not statistically significant (p = 0.751, Figure 5).
Although the difference between net shortwave and net longwave radiation corresponding to different land use types was not dissimilar, a clear difference in Rn was observed between land use types (Figure 4b). Considering that the value of Rn decreases as the impact of human activities on the surface increases, the Rn of PP was much larger than that of other land use types (Figure 5). Its multi-year average was 63.54 W/m2, followed by CP and MP. Moreover, the Rn of UE and OU, which were more affected by human intervention, were always smaller than other types of land use. The value of OU was the smallest, and the multi-year average was 44.19 W/m2. The trends of the land use types (OU, UE, and MP) that were greatly affected by human activities during the study period were all negative. The values of land use types more intensively affected by human factors were also lower than PP and CP. Compared with PP, the change trends of Rn in the four land use types with various human influences were all negative, with a decreasing trend. However, the changes were not statistically significant (p > 0.1).

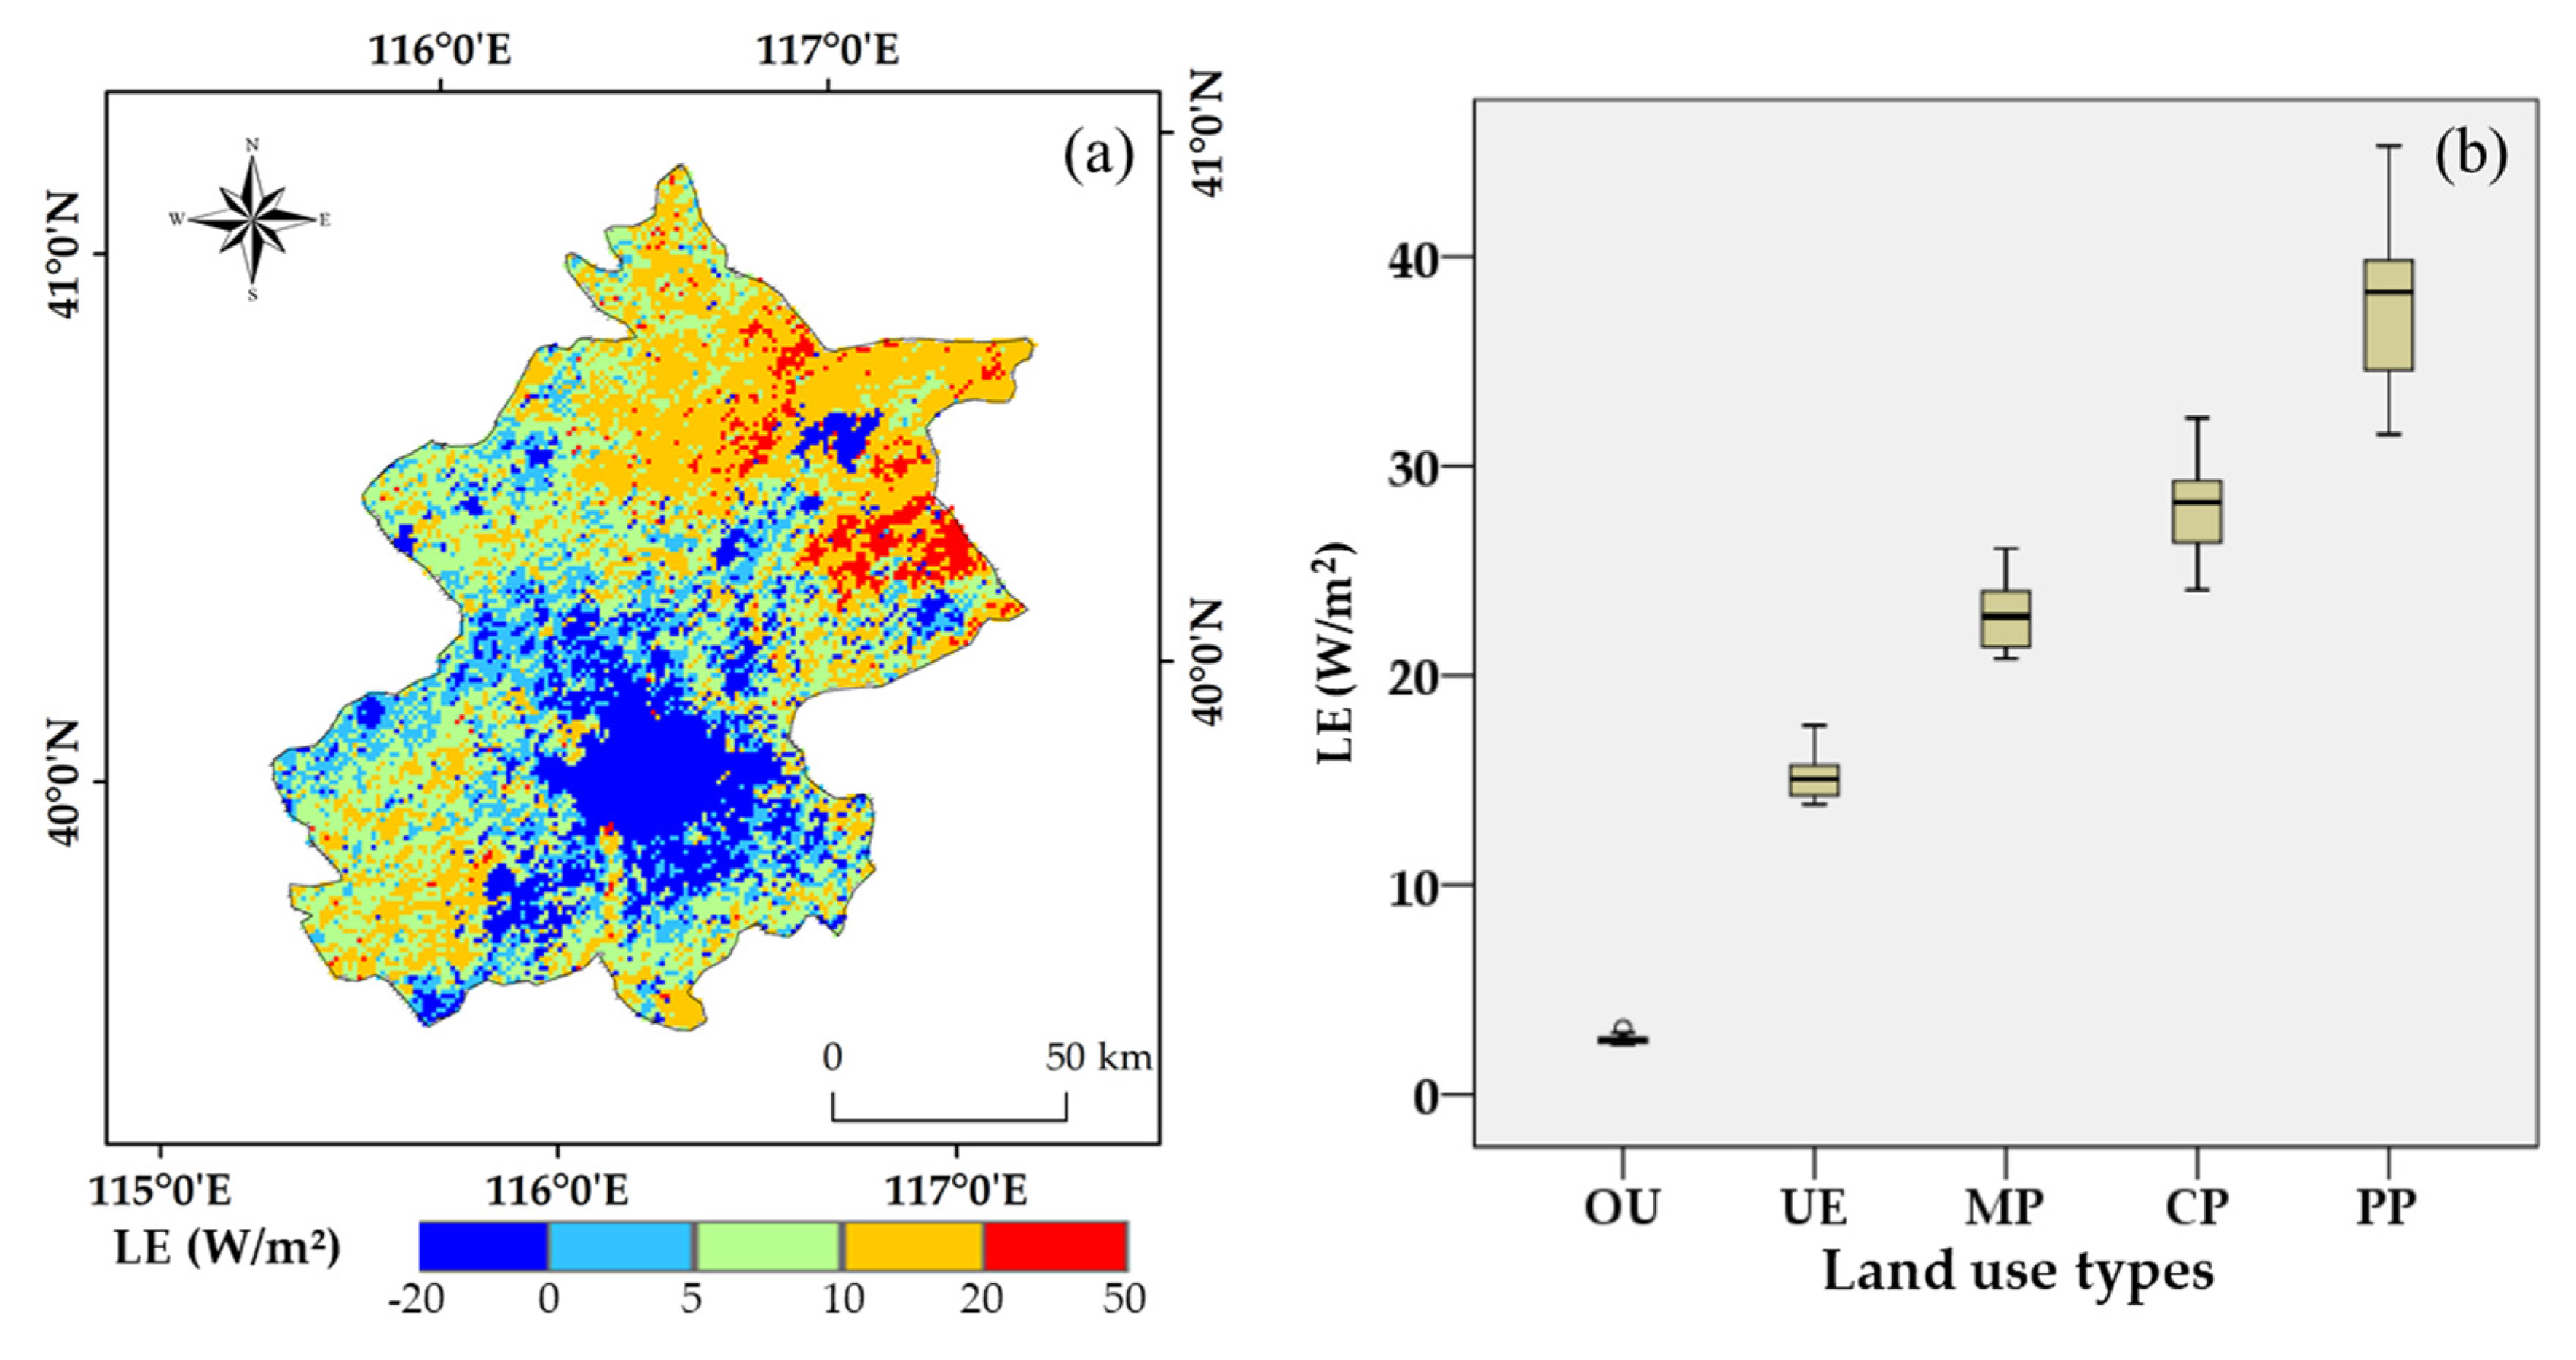
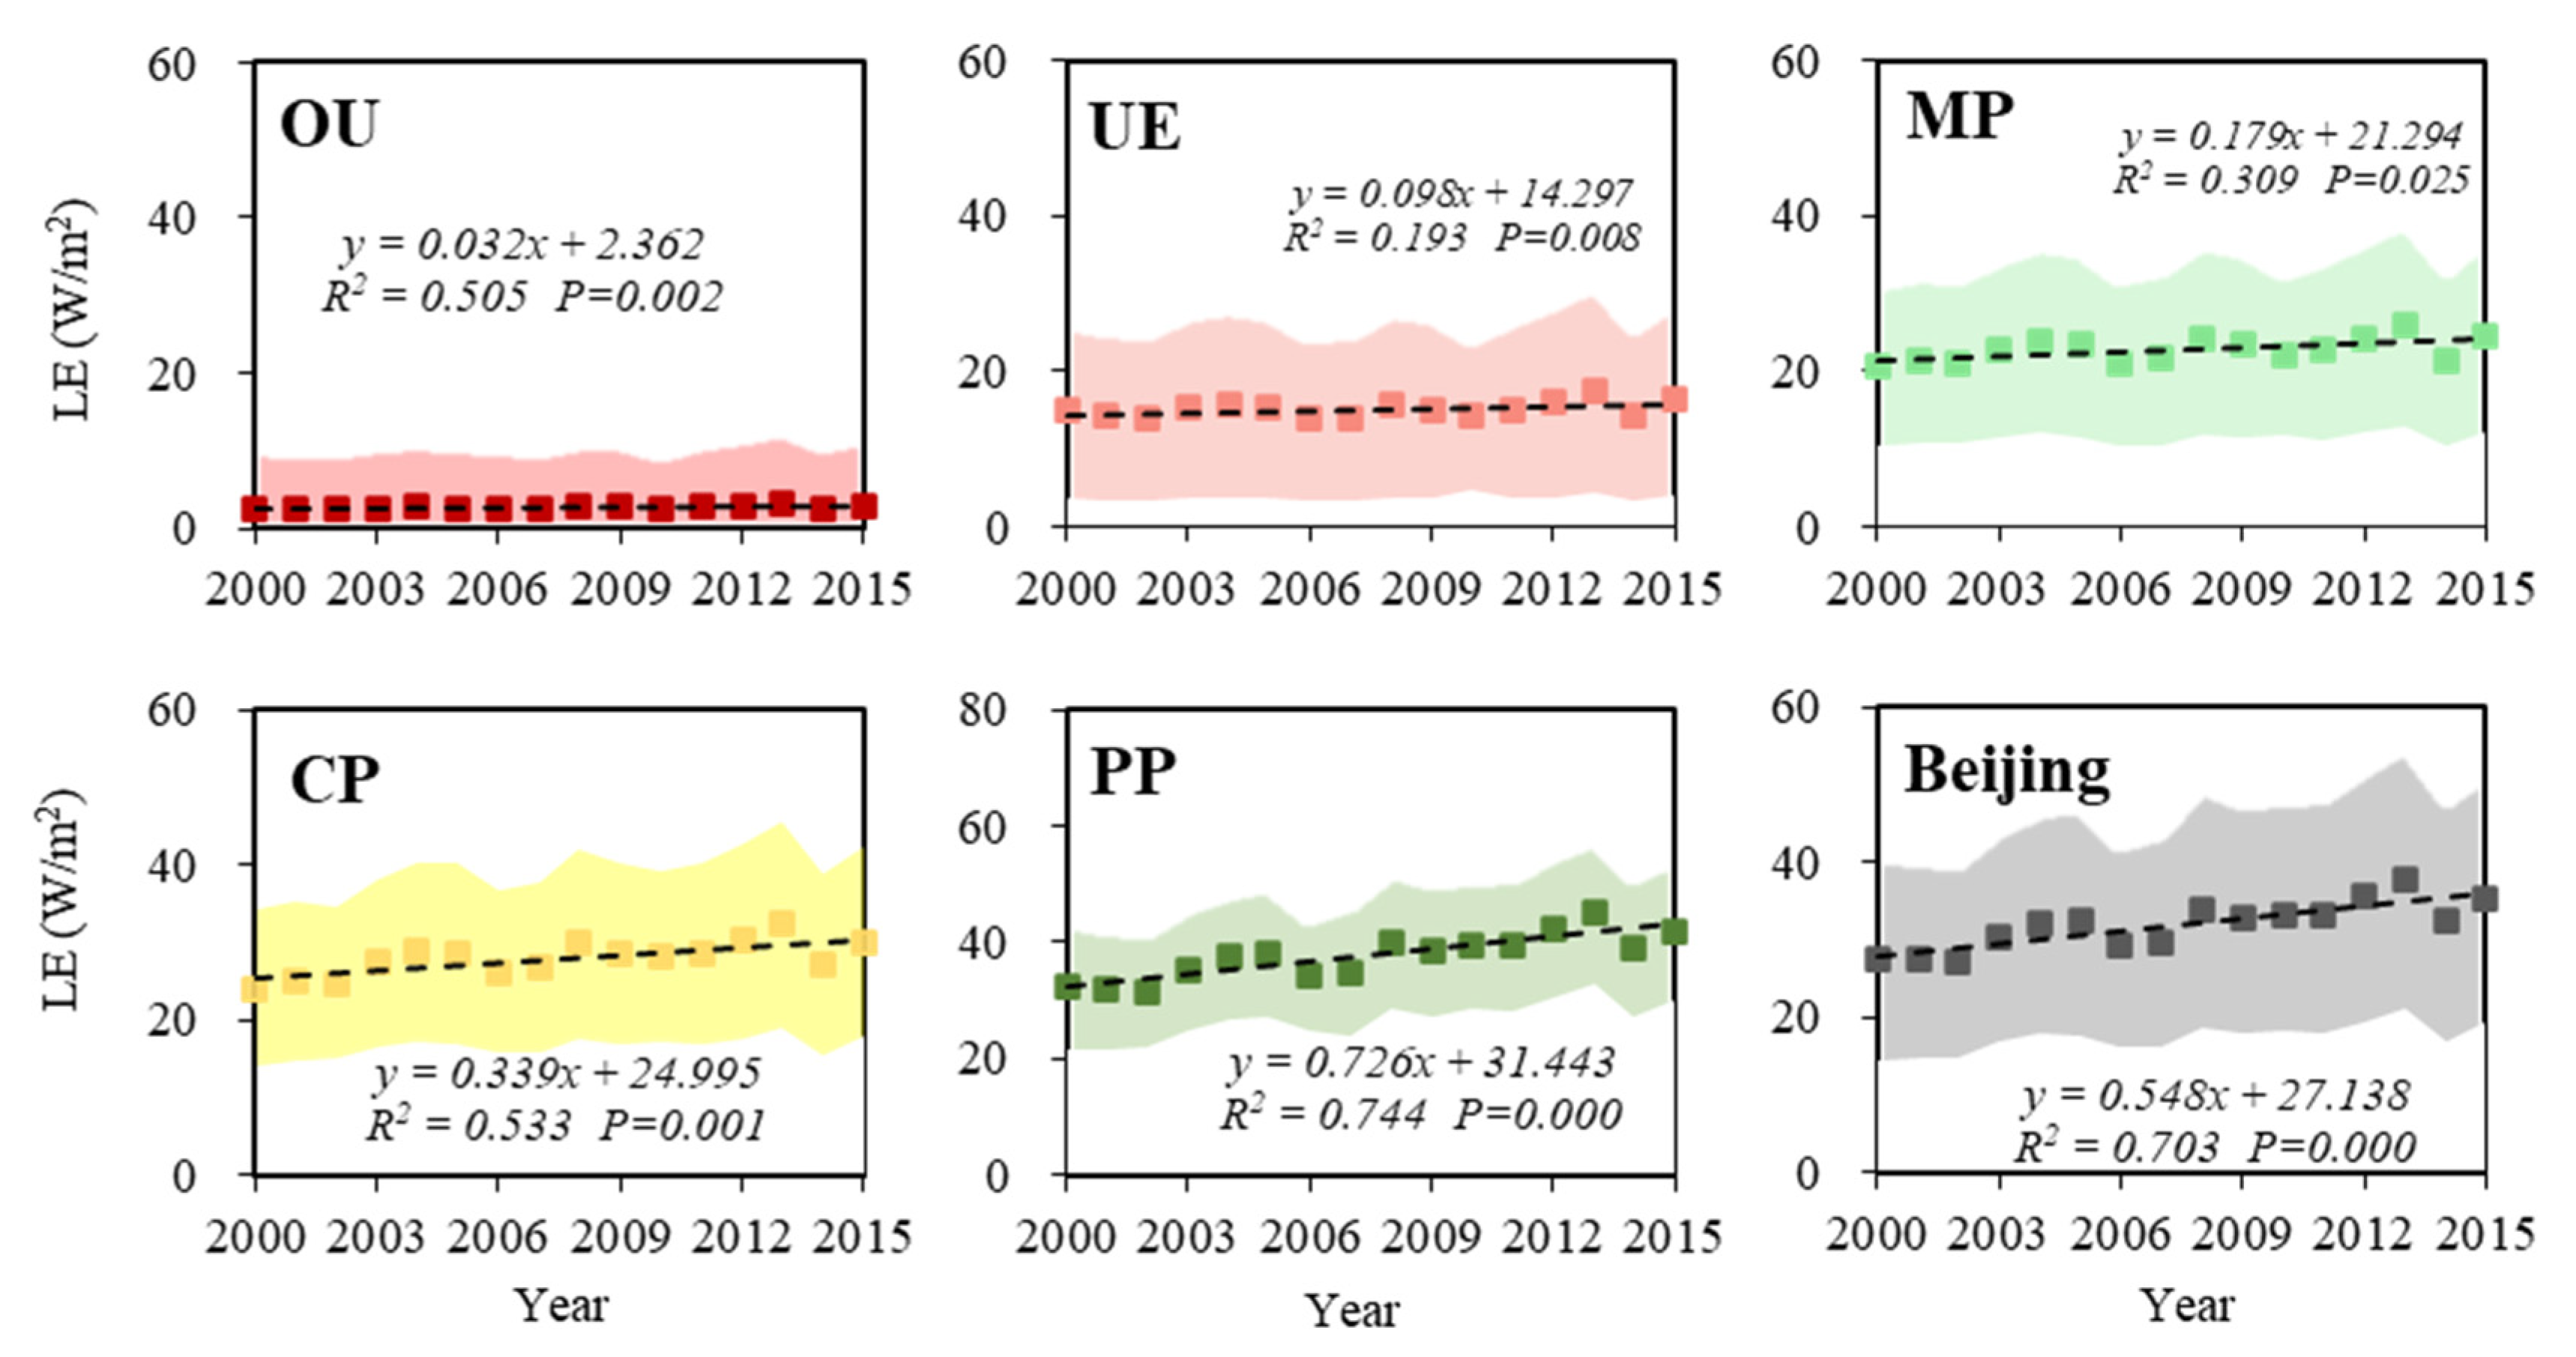
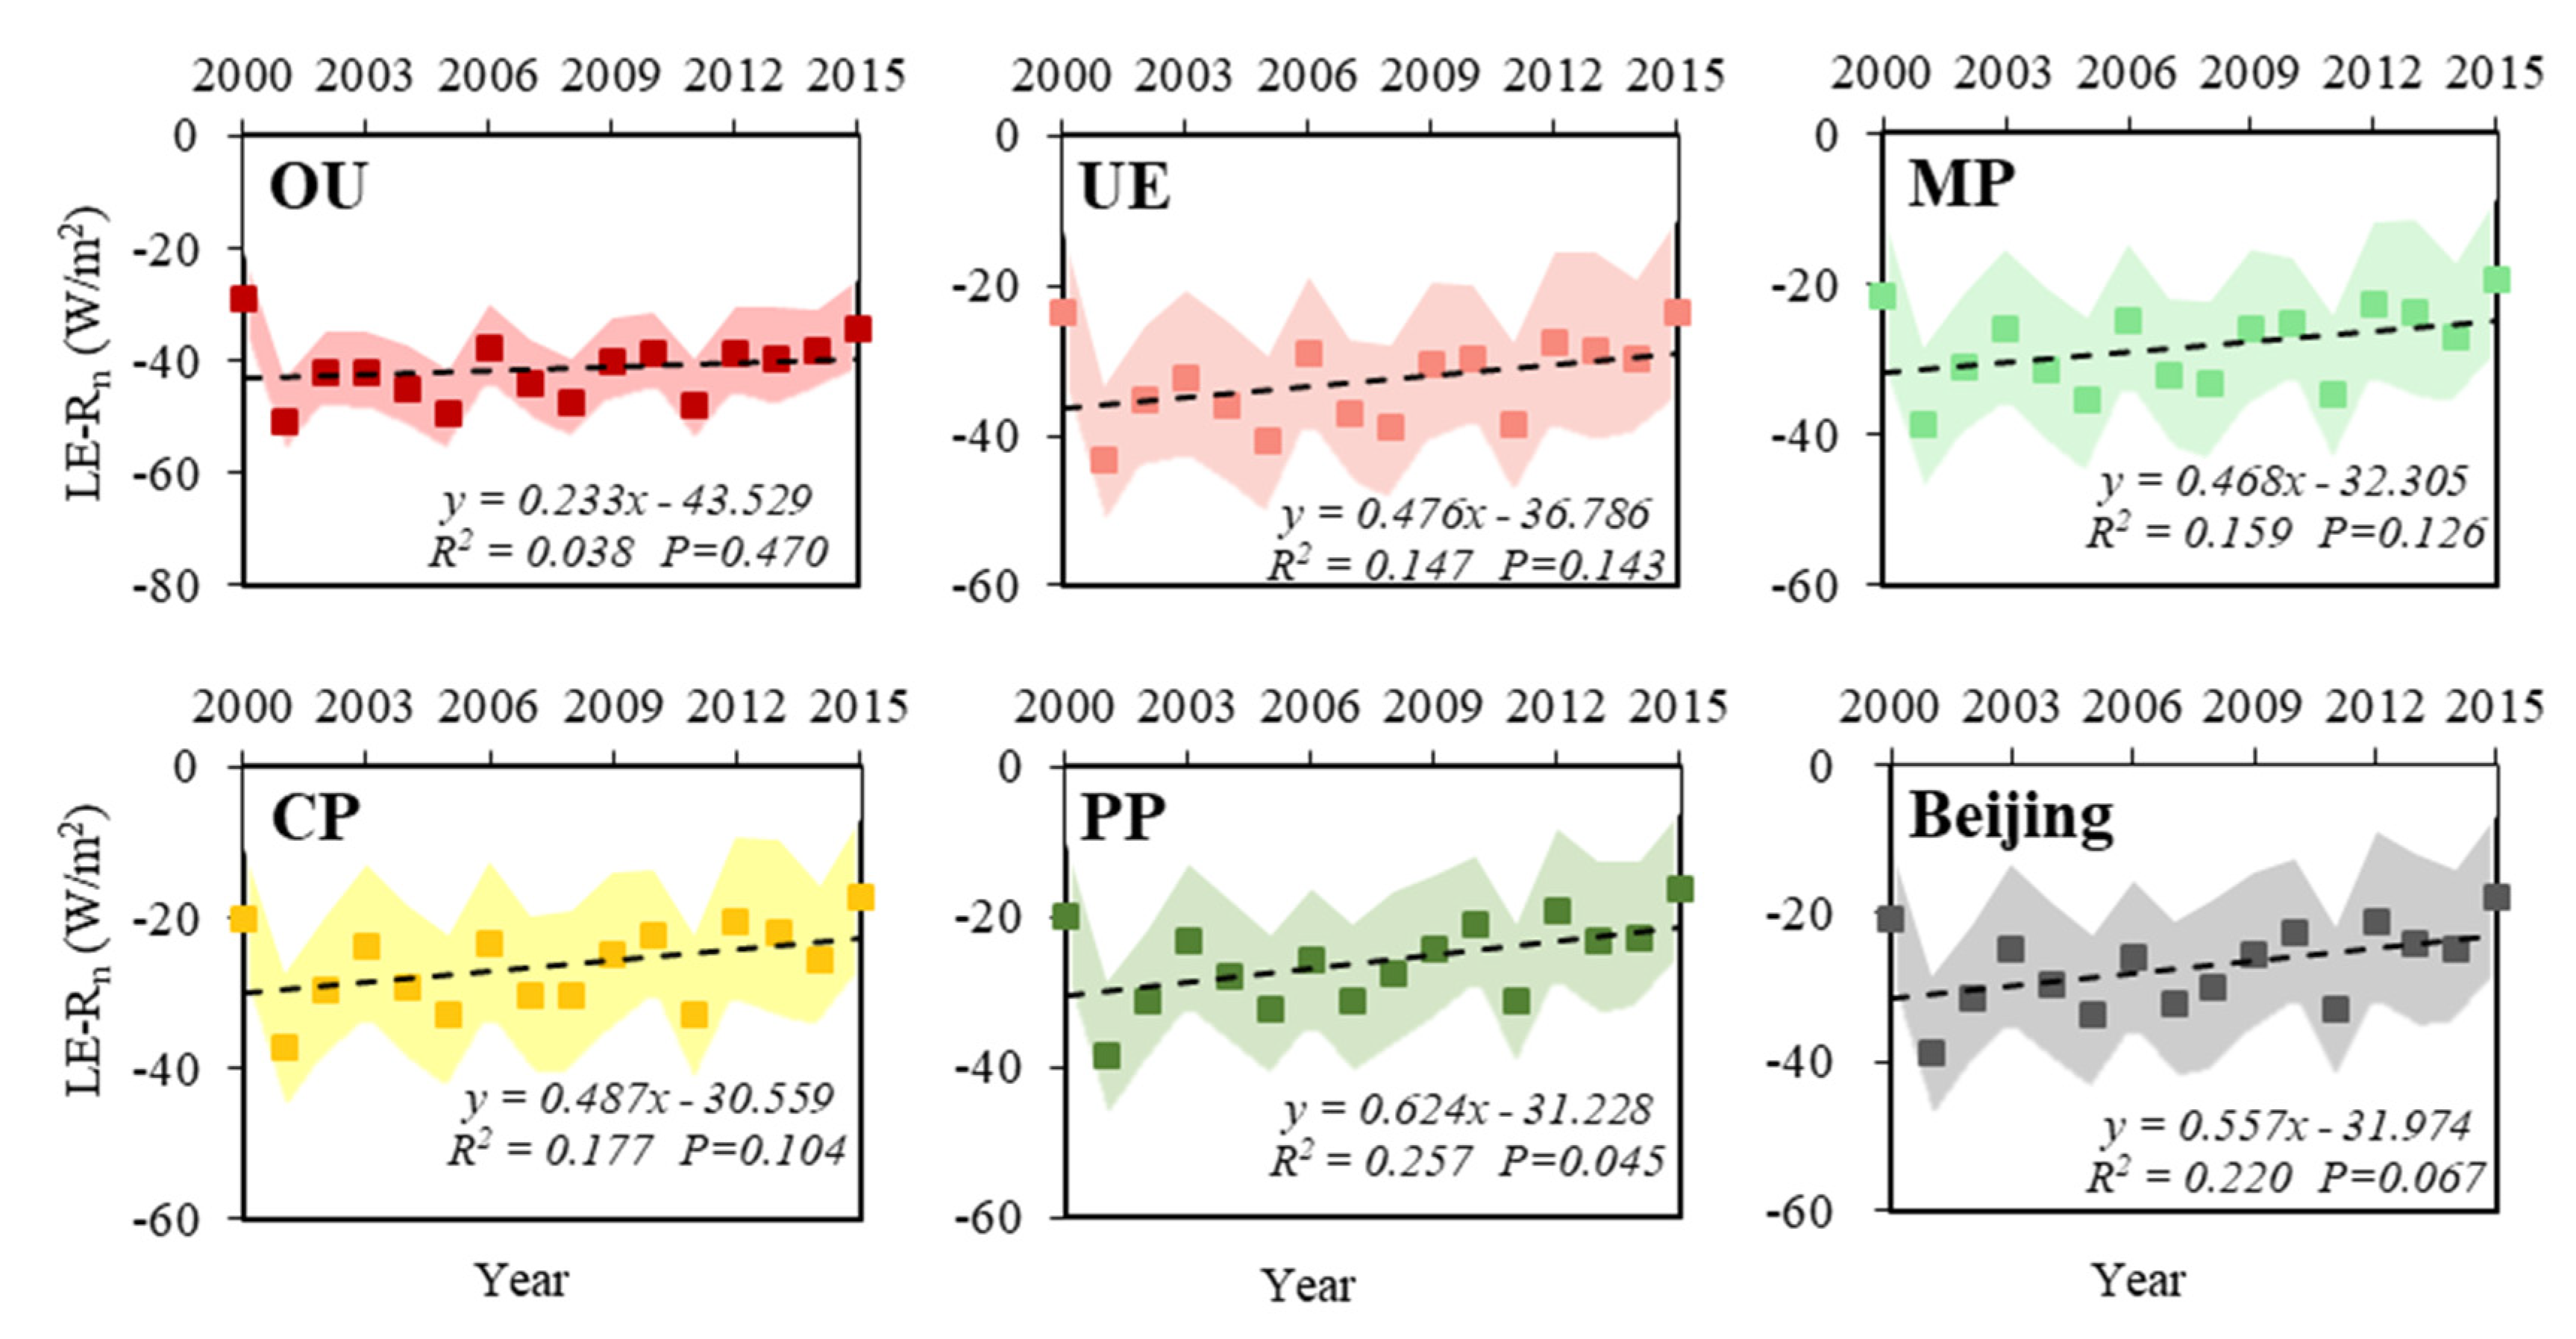
3.2. Analysis on the Change of the Surface Energy Expenditure

As shown in Figure 6a, the LE changes in most parts of Beijing were positive from 2000 to 2015, except in central Beijing. Expanding outward from the central city, the LE difference increased from low to high. The value range of LE corresponding to the land use type under the influence of human activity showed marked differences (Figure 6b). Most of the northeast part of region, far from Beijing city, showed high values of LE. In Beijing, the multi-year average LE was 31.8 W/m². PP had the largest multi-year mean value, at 37.61 W/m2, followed by CP, MP, UE, and OU.
Figure 7 shows the trend of LE in Beijing and various land use types from 2000 to 2015. Beijing’s LE multi-year mean was 37.8 W/m² and the annual change trend was 0.55 W/m². The change trends of LE in OU and UE were small with a value below 0.1 W/(m²∙year), while the trends of LE in CP, PP, and MP were all greater than 0.1 W/(m²∙year). Moreover, LUC under different impacts of human activities had clear differences in LE in Beijing. The order of trends of LE in the five land use types was: PP > CP > MP > UE > OU. This indicated that human activities had a great impact on LE. Additionally, although the LE of OU still showed an increasing trend, it can be seen from a comparison of the trend of LE in PP that human activities had a negative impact on both the value and trend of LE.

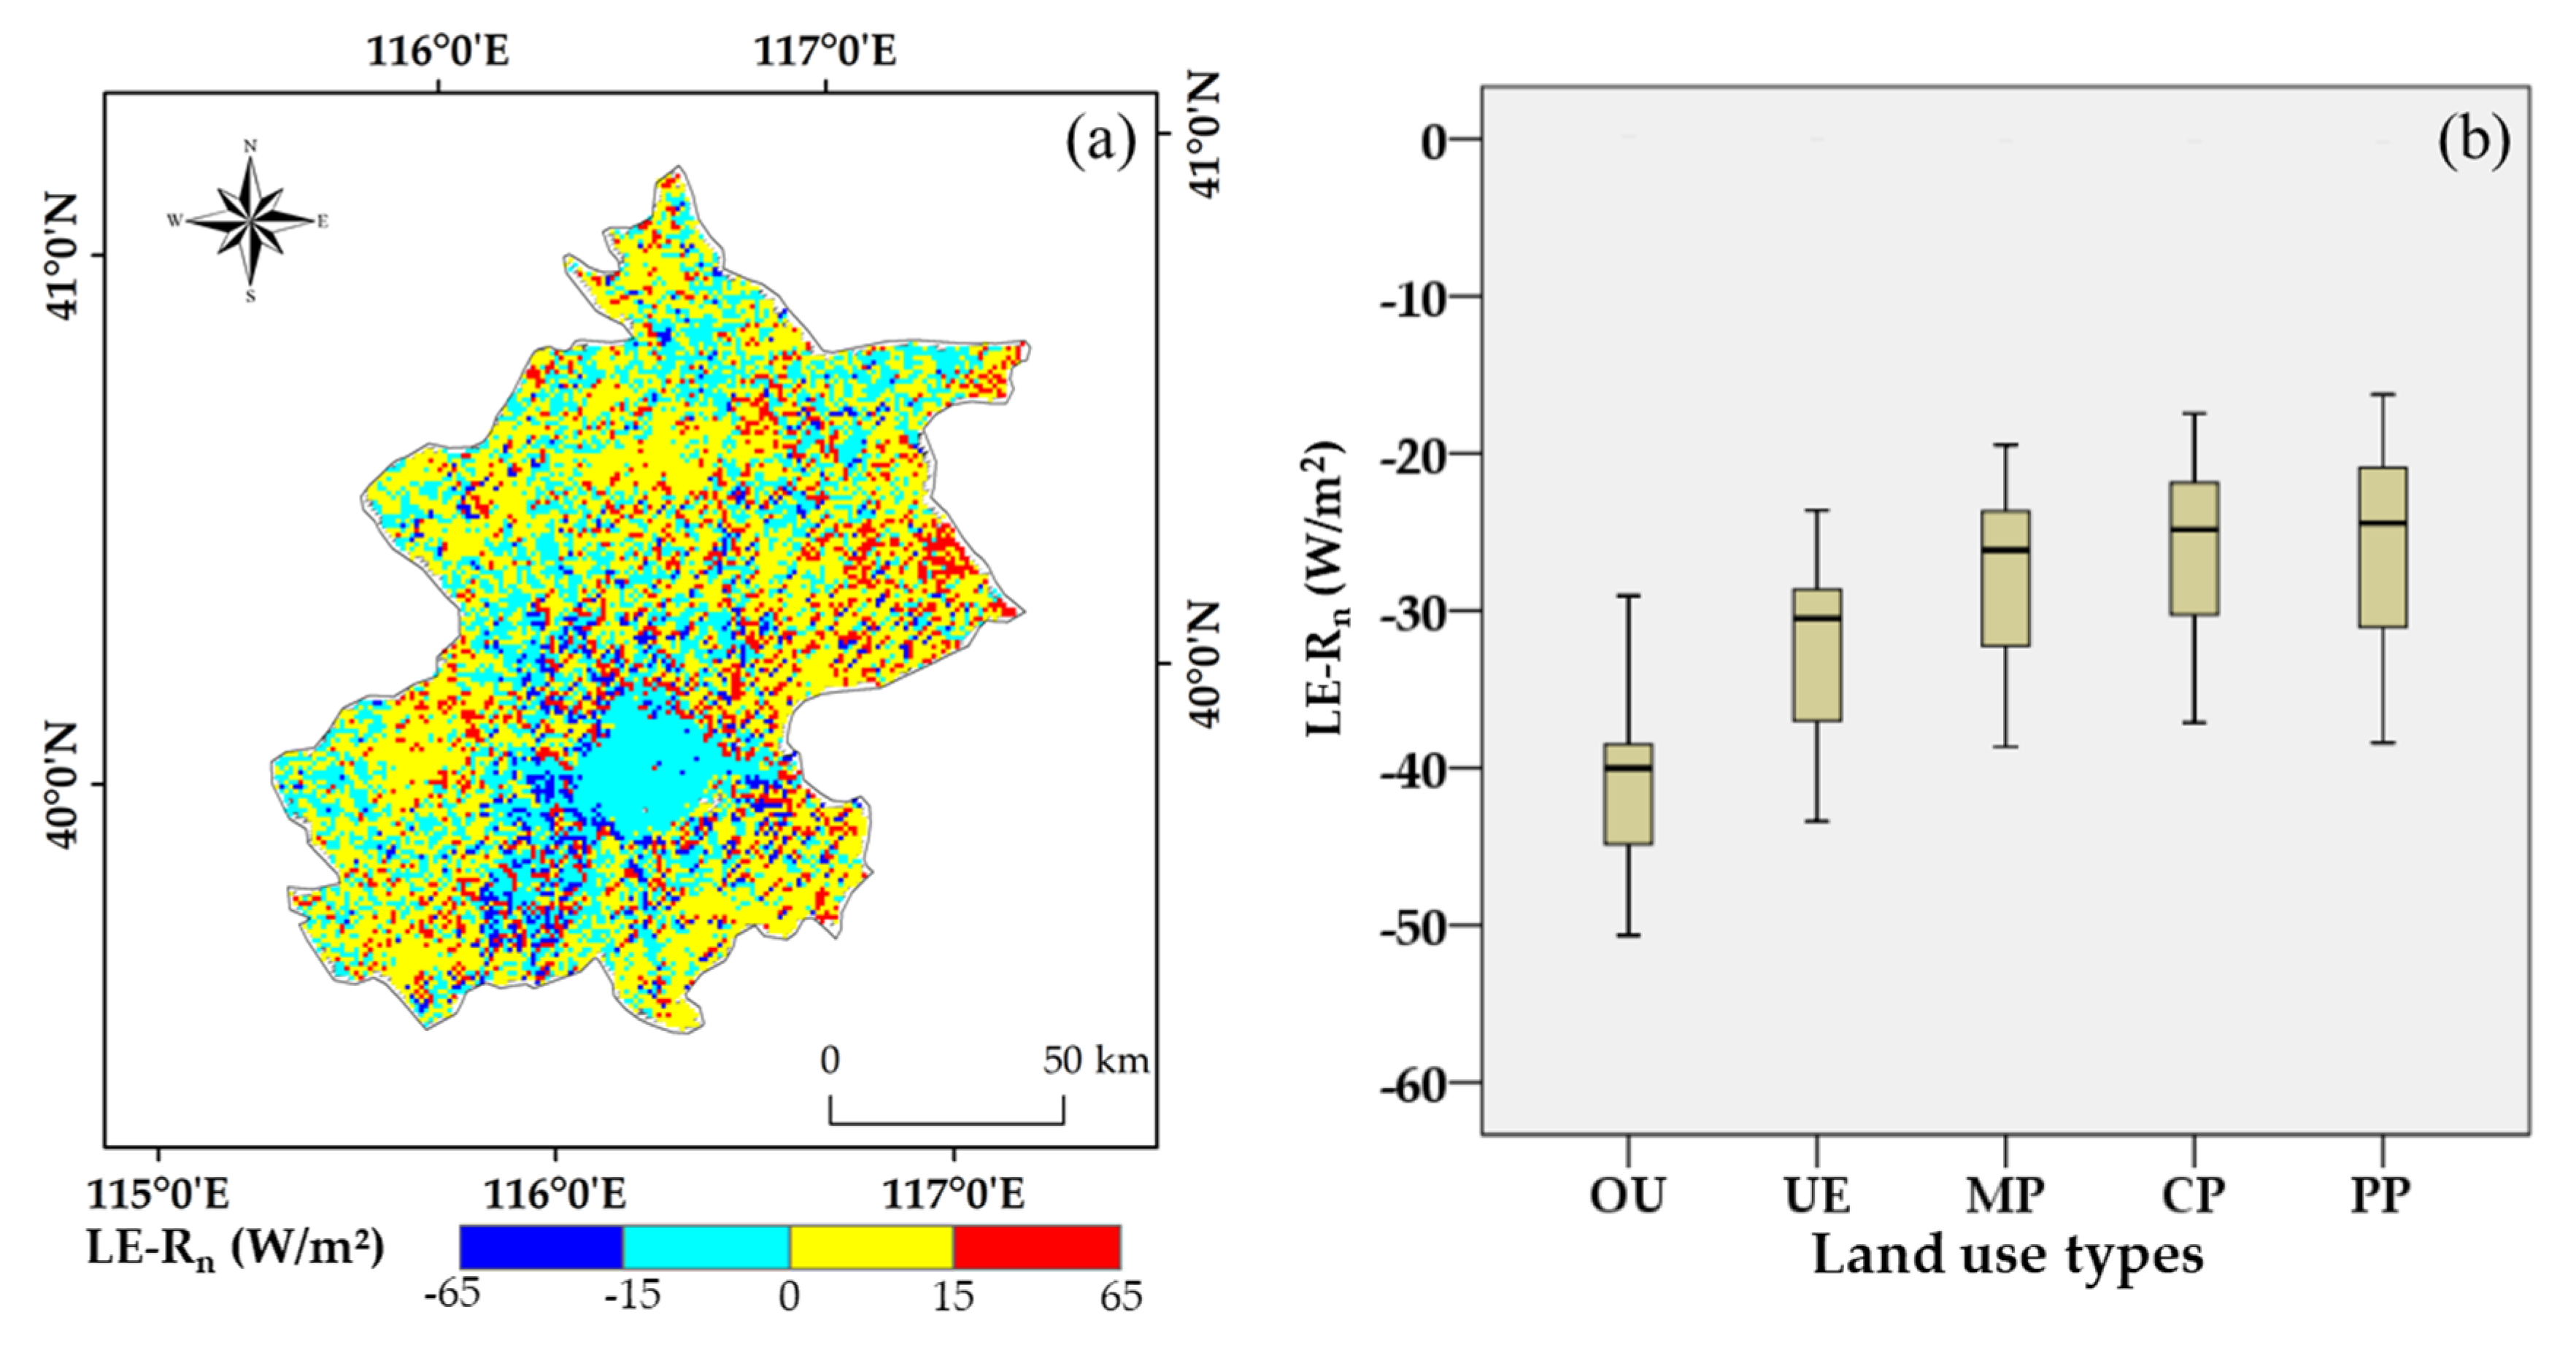
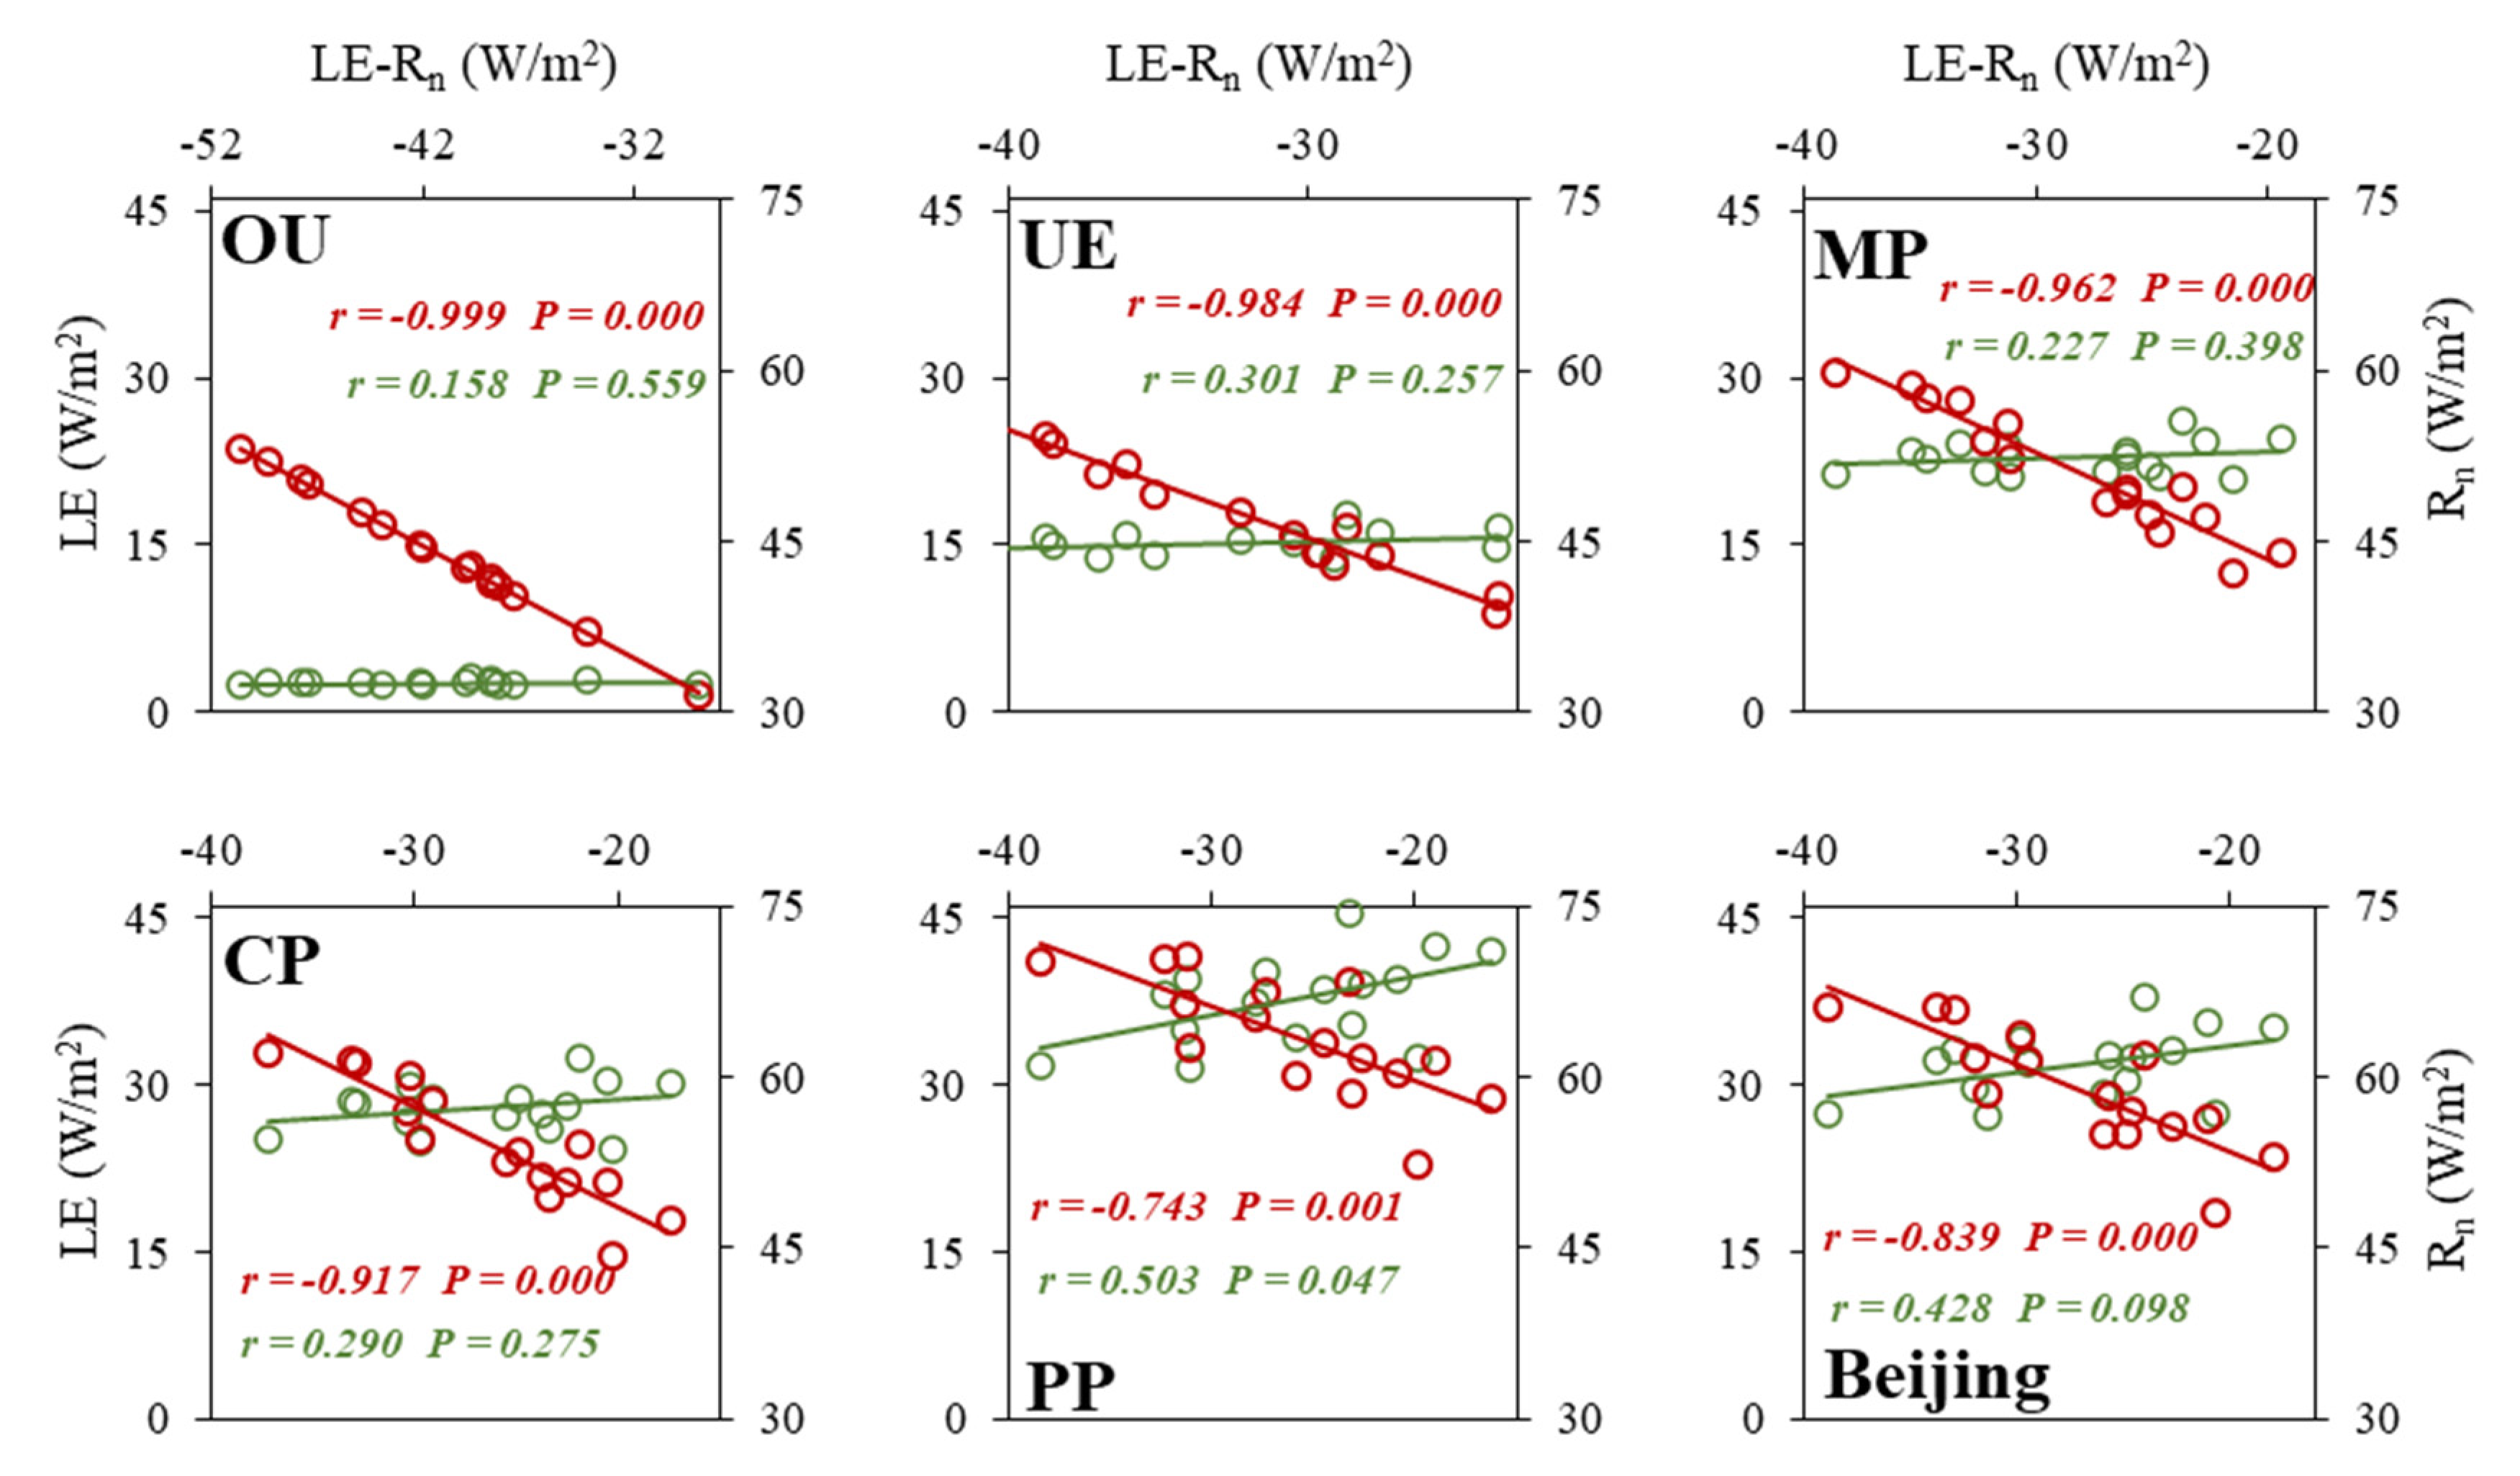
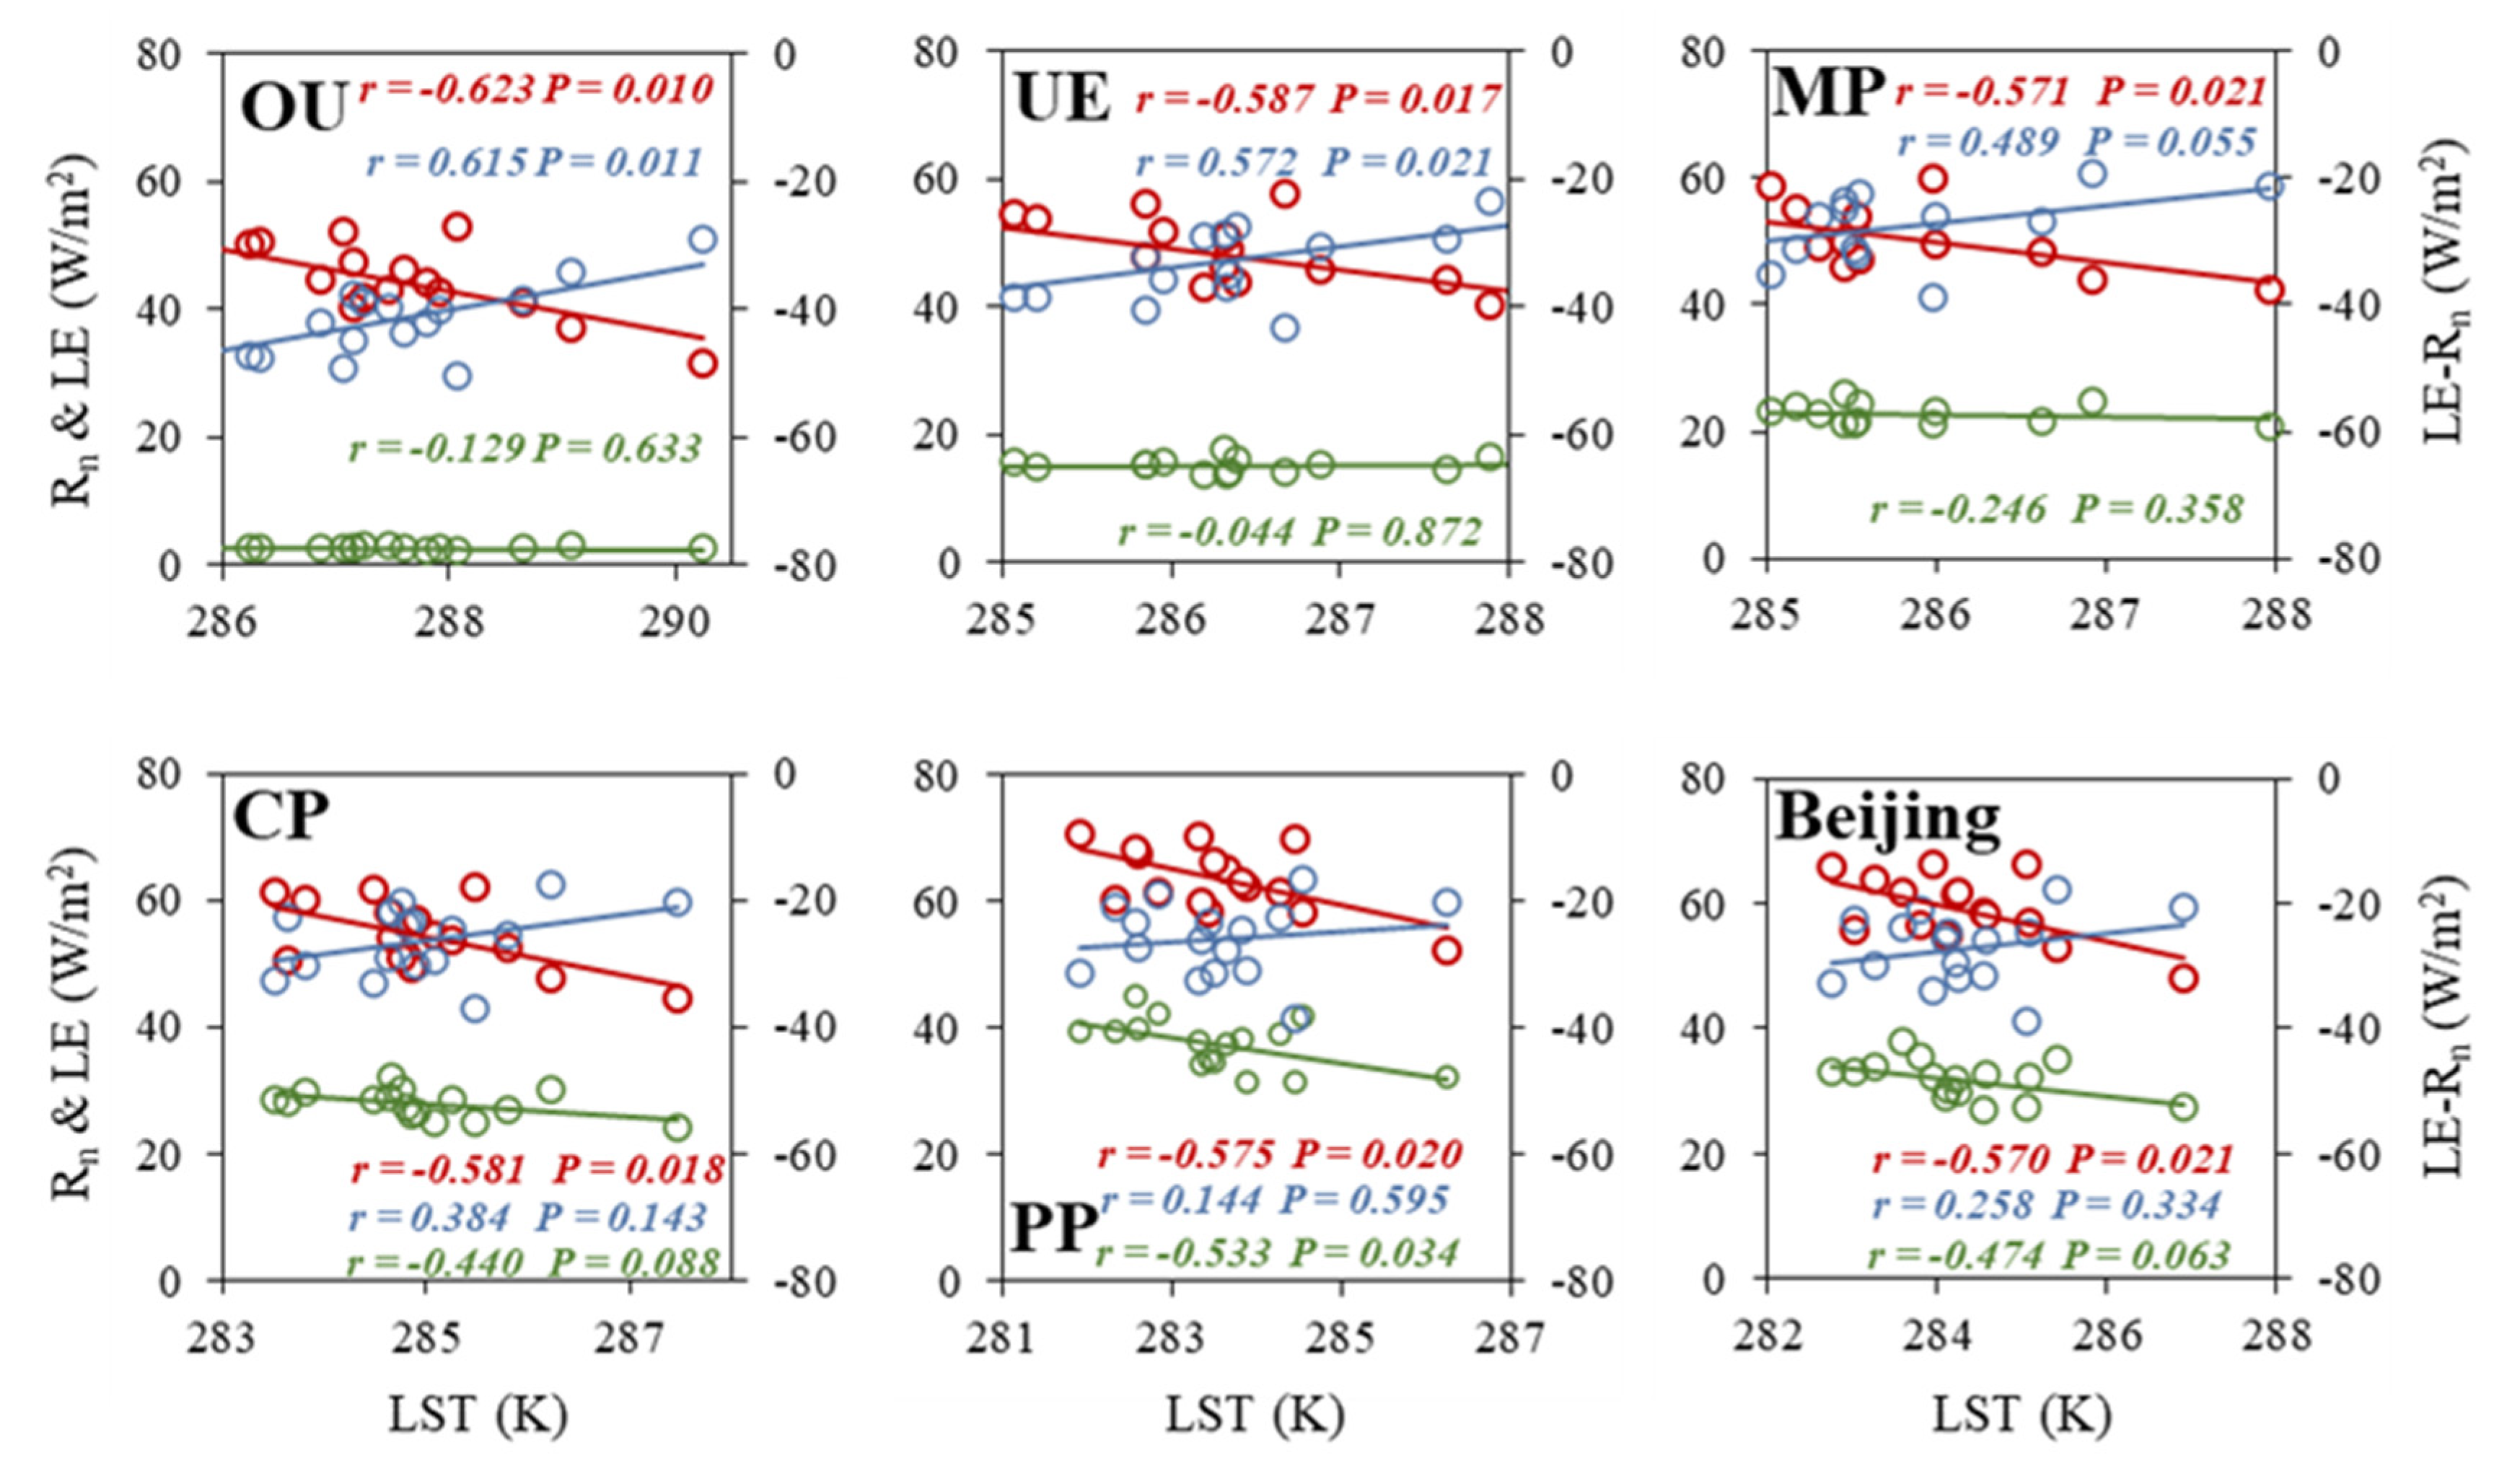
3.3. Comparison of Net Radiation and Latent Heat Flux

The spatial distribution of LE−Rn was almost the opposite to the LE distribution (Figure 8a). The values of LE−Rn in downtown Beijing and its surroundings were negative, while the distribution of positive values was dominant in the remaining areas. However, there were scattered grid cells with negative values. The multi-year mean value of LE−Rn was negative, −25.92 W/m2, and the order of LE−Rn from large to small was PP > CP > MP > UE > OU (Figure 8b). This order was consistent with the strength of natural resilience, and contrasted with the intensity of human activities. This indicates that LE−Rn will gradually decrease, and the warming feedback will become stronger, as human activities increase.
From 2000 to 2015, the LE−Rn in various land types showed an upward trend (0.56 W/(m2∙year), indicating that the feedback effect of LUC on regional warming was weakening. However, compared with the trend of PP, the LE−Rn trends in other four types were relatively small. The order from small to large was OU < MP ~ UE < CP (Figure 9). This also shows that the more intense the human activity, the greater the corresponding warming feedback effect.
To find out whether LE or Rn had a greater impact on net radiation (LE−Rn), we compared the three relationships among the three energy factors. Compared with Rn, the differences of LE in the five land cover types were more obvious, and the correlation between Rn and LE−Rn was greater than that between LE and LE−Rn during the study period (Figure 10). This indicates that, in terms of the final forcing balance, the LE−Rn in land use type was more sensitive to the change of Rn indicating the importance of energy intake on warming or cooling effects.

4. Discussion

Since the 20th century, Beijing has been in the stage of rapid urbanization. Correspondingly, the land use pattern of Beijing has undergone obvious changes, especially the most significant changes in cultivated land and urban land, and urban construction has taken up a lot of cultivated land [19]. Vegetation growth conditions of different land use types are different, and the differences in each land use type are reflected in biogeophysical parameters such as albedo, resulting in different energy budget effects [18,32]. Many researchers have explored the climatic effects of LUC from the perspective of radiative forcing [43,44]. Previous studies have shown that if only the radiative forcing corresponding to albedo is considered, the radiative forcing at the top of the atmosphere would increase with the intensity of human activity [39]. Simply considering albedo’s radiative forcing only includes shortwave radiation, which has a limited impact on the overall energy budget and on changes in various parameters within the energy balance mechanism that regulate local energy [32].
The results of our study showed that the regularity of Rns in various land use types was not immediately obvious, but after superimposing Rnl, the Rn did show an obvious regularity corresponding to various land use types as the intensity of human activities increased. Other studies have also confirmed that there is a large non-radiation impact on regional energy and temperature [33,34]. Our results further found that LE−Rn was more sensitive to Rn than to LE, namely, the energy regulation effect of Rn is greater than LE in Beijing.
Additionally, the energy budget itself will be directly affected by the LST during the calculation process (by upward longwave radiation), and the energy expenditure process will also react to the LST, including LE, which can cause changes to LST. Here, we explored the relationship between energy and temperature and found that the relationships between LST, Rn, and LE were negative while the relationships between LST and LE−Rn were positive in all the five land use types (Figure 11). Overall, the relationship between Rn and LST was the closest, followed by LE and LST, which passed the significance test of P = 0.1, while the relationship between LST and LE−Rn did not pass the significance test. However, with the increase of natural resilience, the relationships between LE−Rn and LST became weaker, and LE showed a more significant relationship with LST (p < 0.1), indicating that LE had a strong regulatory effect on LST in the areas with natural attributes. This is consistent with our previous model simulation [45].
When analyzing the urban heat island effect, the role of Rn on LST or various land use types cannot be ignored. In terms of specific land use types, LE−Rn has a significant impact on LST in OU, UE, and MP, which have been strongly impacted by human activities, while LE plays an important role in LST in CP and PP, which have natural or seminatural resilience. That is to say, the energy budget item that dominates the LST change is not immutable. This implies that when studying urban heat island, problems may arise with the spatial scale and extent of the study area. Additionally, the impact area of the urban heat island is far greater than the urban physical boundary [46,47]. Therefore, when we analyze the spatial differences in the urban thermal environment, the setting of its boundary extent and land use type will affect not only the heat island intensity but also the intrinsic energy budget corresponding to its LST change.

5. Conclusions

On the basis of the different human impacts, this study divided the land use types of Beijing into five types—OU, UE, MP, CP, and PP—and analyzed the differences in Rn and LE corresponding to various land use types and changes from 2000 to 2015. The difference in the relationship between LST and energy intake and expenditure on different underlying surfaces was also discussed. This study reached the following conclusions:
From 2000 to 2015, under the impacts of different human activity intensities and natural resilience, the energy budgets of various land use types showed very obvious differences. The order of Rn, LE, and LE−Rn values were all PP > CP > MP > UE > OU. The trends of LE−Rn on the four land use types affected by human activities were all less than that of PP, showing that human activities weaken the trend of LE−Rn and increased the warming effect.
From the perspective of energy balance, the role of Rn in energy regulation for a warming or cooling effect was greater than LE. This study also found that the main energy regulation factors on LST varied in different land use types. With the increasing intensity of human activities in relation to land use, the warming/cooling effect of LE−Rn gradually increased.
This study reveals the clear differences in the energy budget correspondingly to various land use types under the impact of human activities. It makes an important contribution to understanding the urban heat island effect from the perspective of biogeophysical mechanisms. Furthermore, this study suggests that for urban planners and decision makers, urban vegetation or water bodies can be used to regulate evapotranspiration during the urban design process to mitigate the urban heat island effect. At the same time, adjusting net radiation factors may have more obvious effects on reducing the heat island effect.

Author Contributions

Conceptualization, Y.C., S.Z., G.Z., and J.D.; methodology, S.Z., Y.C., K.W., and S.Y.; software, K.W., S.Y., W.L., Y.Z., and B.Z.; formal analysis, Y.C., S.Z., Y.F., X.L., Y.R., and O.G.C.; writing-original draft preparation, S.Z., Y.C., K.W., and S.Y.; writing-review and editing, Y.C. and G.Z.; supervision, J.D., Y.C.; funding acquisition, Y.C. All authors have read and agreed to the published version of the manuscript.

Funding

This research was funded by National Natural Science Foundation of China [41671425, 41401504, 41701501 and 41565008], Key Research Program of Frontier Sciences by the Chinese Academy of Sciences [QYZDB-SSW-DQC005] and Postdoctoral Research Foundation of China [2016M602232].

Acknowledgments

The authors acknowledge the Natural Resources and Environment Center (Chinese Academy of Sciences) and NASA’s Land Processes Distributed Active Archive Center (LP DAAC, https://modis.gsfc.nasa.gov/data/) for providing land use data and MODIS products. We thank Leonie Seabrook, from Liwen Bianji, Edanz Group China (www.liwenbianji.cn/ac), for editing the English text of a draft of this manuscript.

Conflicts of Interest

The authors declare no conflict of interest.

References

  1. Reinhard, R.; Almut, A.; Alberte, B.; Nathalie, N.D.; Thomas, P.; Stephen, S.; Stehfest, E.; Peter, V. Current Challenges of Implementing Anthropogenic Land-Use and Land-Cover Change in Models Contributing to Climate Change Assessments. Earth. Syst. Dynam. 2017, 8, 1–28. [Google Scholar]
  2. Meyer, W.B.; Turner, B.L.I. Human population growth and global land-use/cover change. Annu. Rev. Ecol. Syst. 1992, 23, 39–61. [Google Scholar] [CrossRef]
  3. Steffen, W.; Sanderson, R.A.; Tyson, P.D.; Jäger, J.; Matson, P.; Moore, B.; Oldfield, F.; Richardson, K.; Schellnhuber, H.J.; Turner, B.L.; et al. Global Change and the Earth System: A Planet Under Pressure; Springer: Berlin/Heidelberg, Germany, 2005; ISBN 978-3-540-26607-5. [Google Scholar]
  4. Diffenbaugh, N.S. Influence of modern land cover on the climate of the United States. Clim. Dynam. 2009, 33, 945–958. [Google Scholar] [CrossRef] [Green Version]
  5. Claussen, M.; Brovkin, V.; Ganopolski, A. Biogeophysical versus biogeochemical feedbacks of large-scale land cover change. Geophys. Res. Lett. 2001, 28, 1011–1014. [Google Scholar] [CrossRef] [Green Version]
  6. Bright, R.; Davin, E.; O’Halloran, T.; Pongratz, J.; Zhao, K.; Alessandro, A. Local temperature response to land cover and management change driven by non-radiative processes. Nat. Clim. Chang. 2017, 7, 296–302. [Google Scholar] [CrossRef]
  7. Li, M.; Cui, Y.; Fu, Y.; Li, N.; Tang, X.; Liu, X.; Run, Y. Simulating the Potential Sequestration of Three Major Greenhouse Gases in China’s Natural Ecosystems. Forests 2020, 11, 128. [Google Scholar] [CrossRef] [Green Version]
  8. Lin, D.; Xia, J.; Wan, S. Climate warming and biomass accumulation of terrestrial plants: A meta-analysis. New Phytol. 2010, 188, 187–198. [Google Scholar] [CrossRef]
  9. Chen, Y.; Yu, S.; Liu, S.; Wang, X.; Zhang, Y.; Liu, T.; Zhou, L.; Zhang, W.; Fu, S. Reforestation makes a minor contribution to soil carbon accumulation in the short term: Evidence from four subtropical plantations. For. Ecol. Manage. 2017, 384, 400–405. [Google Scholar] [CrossRef]
  10. Cui, Y.; Meadows, E.M.; Li, N.; Fu, Y.; Zhao, G.; Dong, J. Land Cover Change Intensifies Actual and Potential Radiative Forcing through CO2 in South and Southeast Asia from 1992 to 2015. Int. J. Environ. Res. Public Health 2019, 16, 2460. [Google Scholar] [CrossRef] [Green Version]
  11. Betts, R.A.; Falloon, P.D.; Goldewijk, K.K.; Ramankutty, N. Biogeophysical effects of land use on climate: Model simulations of radiative forcing and large-scale temperature change. Agric. For. Meteorol. 2007, 142, 216–233. [Google Scholar] [CrossRef]
  12. Piao, M.; Liu, S.; Wang, Y.; Yu, X.; Wang, W.; Xiao, W.; Cao, C.; Xu, J. Observed Analysis of Radiation and Energy Fluxes Characteristic sacross Lake Taihu Surface in Summer. Sci. Technol. Eng. 2014, 14, 1–7. [Google Scholar]
  13. Gastellu-Etchegorry, J.P. 3D Modeling of satellite spectral images, radiation budget and energy budget of urban landscapes. Meteorol. Atmos. Phys. 2008, 102, 187–207. [Google Scholar] [CrossRef] [Green Version]
  14. Brown, I.; Castellazzi, M.; Feliciano, D. Comparing path dependence and spatial targeting of land use in implementing climate change responses. Land 2014, 3, 850–873. [Google Scholar] [CrossRef] [Green Version]
  15. Tang, T.; Wang, L.; Wen, X. Analysis of the characteristics of radiation budget and surface energy balance in the Eling Lake area at the source of the Yellow River. Glaciol. Geocryol. 2013, 35, 112–123. [Google Scholar]
  16. Bastiaanssen, W.G.M.; Menenti, M.; Feddes, R.A.; Holtslag, B.A. remote sensing surface energy balance algorithm for land (SEBAL).1. Formulation. J. Hydrol. 1998, 212–213, 198–212. [Google Scholar] [CrossRef]
  17. Mu, Q.; Zhao, M.; Running, S.W. Improvements to a MODIS global terrestrial evapotranspiration algorithm. Remote Sens. Environ. 2011, 115, 1781–1800. [Google Scholar] [CrossRef]
  18. Cui, Y.; Liu, J.; Hu, Y.; Wang, J.; Kuang, W. Modeling the radiation balance of different urban underlying surfaces. Sci. Bull. 2012, 57, 465–473. [Google Scholar] [CrossRef] [Green Version]
  19. Cui, Y.; Liu, J.; Zhang, X.; Qin, Y.; Dong, J. Modeling urban sprawl effects on regional warming in Beijing-Tianjin-Tangshan urban agglomeration. Acta Ecol. Sin. 2015, 35, 993–1003. [Google Scholar]
  20. Richardson, A.D.; Keenan, T.F.; Migliavacca, M.; Ryu, Y.; Sonnentag, O.; Toomey, M.J.A. Climate change, phenology, and phenological control of vegetation feedbacks to the climate system. Agric. For. Meteorol. 2013, 169, 156–173. [Google Scholar] [CrossRef]
  21. Stephens, G.L.; O’Brien, D.; Webster, P.J.; Pilewski, P.; Kato, S.; Li, J. The albedo of Earth. Rev. Geophys. 2015, 53, 141–163. [Google Scholar] [CrossRef] [Green Version]
  22. Houspanossian, J.; Raul, G.; Esteban, J.; Marcelo, N. Surface albedo raise in the South American Chaco: Combined effects of deforestation and agricultural changes. Agric. For. Meteorol. 2017, 232, 118–127. [Google Scholar] [CrossRef] [Green Version]
  23. North, G.R.; Cahalan, R.F.; Coakley, J.A. Energy balance climate models. Rev. Geophys. 1981, 19, 91–121. [Google Scholar] [CrossRef] [Green Version]
  24. Peng, S.S.; Coauthors. Afforestation in China cools local land surface temperature. Proc. Natl. Acad. Sci. USA 2014, 111, 2915–2919. [Google Scholar] [CrossRef] [PubMed] [Green Version]
  25. Addas, A.; Goldblatt, R.; Rubinyi, S. Utilizing Remotely Sensed Observations to Estimate the Urban Heat Island Effect at a Local Scale: Case Study of a University Campus. Land 2020, 9, 191. [Google Scholar] [CrossRef]
  26. Su, Z. The Surface Energy Balance System (SEBS) for estimation of turbulent heat fluxes. Hydrol. Earth Syst. Sci. 2002, 6, 85–100. [Google Scholar] [CrossRef]
  27. Roerink, G.J.; Su, Z.; Menenti, M. S-SEBI: A Simple Remote Sensing Algorithm to Estimate the Surface Energy Balance. Phys. Chem. Earth. 2000, 25, 147–157. [Google Scholar] [CrossRef]
  28. Huang, L.; Zhai, J.; Sun, C. Biogeophysical Forcing of Land-Use Changes on Local Temperatures across Different Climate Regimes in China. J. Clim. 2018, 31, 7053–7068. [Google Scholar] [CrossRef]
  29. Li, X.; Yang, L.; Xu, X.; Tian, W.; He, C. Analysis of evapotranspiration pattern by SEBAL model during the growing season in the agro-pastoral ecotone in Northwest China. Acta Ecol. Sinica. 2020, 40, 2175–2185. [Google Scholar]
  30. Kirschbaum, M.U.F.; Saggar, S.; Tate, K.R.; Thakur, K.P.; Giltrap, D.L. Quantifying the climate-change consequences of shifting land use between forest and agriculture. Sci. Total Environ. 2013, 465, 314–324. [Google Scholar] [CrossRef]
  31. Schwaab, J.; Bavay, M.; Davin, E.; Hagedorn, F.; Hüsler, F.; Lehning, M.; Schneebeli, M.; Thürig, E.; Bebi, P. Carbon storage versus albedo change: Radiative forcing of forest expansion in temperate mountainous regions of Switzerland. Biogeosciences 2015, 12, 467–487. [Google Scholar] [CrossRef] [Green Version]
  32. Cui, Y.; Liu, J.; Zhang, X.; Hu, Y.; Wang, J. Modeling urban energy balance and temperature differences of different underlying surfaces. Geogr. Res. 2012, 31, 1257–1268. [Google Scholar]
  33. Ge, J.; Guo, W.; Pitman, A.J.; Kauwe, M.G.; Chen, X.; Fu, C. The Nonradiative Effect Dominates Local Surface Temperature Change Caused by Afforestation in China. J. Clim. 2019, 32, 4445–4471. [Google Scholar] [CrossRef]
  34. Lee, X.; Goulden, M.; Hollinger, D.; Barr, A.; Andrew Black, T.; Bohrer, G.; Bracho, R.; Drake, B.; Goldstein, A.; Gu, L.; et al. Observed increase in local cooling effect of deforestation at higher latitudes. Nature 2011, 479, 384–387. [Google Scholar] [CrossRef] [PubMed]
  35. Duveiller, G.; Forzieri, G.; Robertson, E.; Wei, L.; Cescatti, A. Biophysics and vegetation cover change: A process-based evaluation framework for confronting land surface models with satellite observations. Earth. Syst. Sci. Data 2018, 10, 1265–1279. [Google Scholar] [CrossRef] [Green Version]
  36. Duveiller, G.; Hooker, J.; Cescatti, A. The mark of vegetation change on Earth’s surface energy balance. Nat. Commun. 2018, 9, 679. [Google Scholar] [CrossRef] [Green Version]
  37. Duveiller, G.; Caporaso, L.; Abad-Viñas, R.; Perugini, L.; Grassi, G.; Arneth, A.; Cescatti, A. Local biophysical effects of land use and land cover change: Towards an assessment tool for policy makers. Land Use Policy 2020, 91, 104382. [Google Scholar] [CrossRef]
  38. Zhou, Y.; Ge, J.P.F.; Li, Y.; Li, J.; Li, Y.; Weng, W. Energy flux and balance analysis of Dajiuhu Peatland in Shennongjia. J. Hydroecology 2019, 40, 14–21. [Google Scholar]
  39. Tang, X.; Cui, Y.; Li, N.; Fu, Y.; Liu, X.; Run, Y.; Li, M.; Zhao, G.; Dong, J. Human activities enhance radiation forcing through surface albedo associated with vegetation in Beijing. Remote Sens. 2020, 12, 837. [Google Scholar] [CrossRef] [Green Version]
  40. Arnfield, A.J.; Mills, G.M. An analysis of the circulation characteristics and energy budget of a dry, asymmetric, east-west urban canyon. I. Circulation characteristics. Int. J. Climatol. 1994, 14, 119–134. [Google Scholar] [CrossRef]
  41. Sakakibara, Y. A numerical study of the effect of urban geometry upon the surface energy budget. Atmos. Environ. 1996, 30, 1–496. [Google Scholar] [CrossRef]
  42. Anderson-Teixeira, K.J.; Snyder, P.K.; Twine, T.E.; Cuadra, S.V.; Costa, M.H.; Delucia, E.H. Climate-regulation services of natural and agricultural ecoregions of the Americas. Nat. Clim. Chang. 2012, 2, 177–181. [Google Scholar] [CrossRef]
  43. Jones, A.D.; Calvin, K.V.; Collins, W.D.; Edmonds, J. Accounting for radiative forcing from albedo change in future global land-use scenarios. Clim. Chang. 2015, 131, 691–703. [Google Scholar] [CrossRef] [Green Version]
  44. Barnes, C.A.; Roy, D.P. Radiative forcing over the conterminous United States due to contemporary land cover land use change and sensitivity to snow and interannual albedo variability. J. Geophys. Res. Biogeosci. 2010, 115, G04033. [Google Scholar] [CrossRef] [Green Version]
  45. Zhao, G.; Dong, J.; Cui, Y.; Liu, J.; Zhai, J.; He, T.; Zhou, Y.; Xiao, X. Evapotranspiration-dominated biogeophysical warming effect of urbanization in the Beijing-Tianjin-Hebei region, China. Clim. Dynam. 2019, 52, 1231–1245. [Google Scholar] [CrossRef]
  46. Zhou, D.; Zhao, S.; Zhang, L.; Sun, G.; Liu, Y. The footprint of urban heat island effect in China. Sci. Rep. 2015, 5, 11160. [Google Scholar] [CrossRef] [PubMed]
  47. Cui, Y.; Xiao, X.; Zhang, Y.; Dong, J.; Qin, Y.; Doughty, R.B.; Zhang, G.; Wang, J.; Wu, X.; Qin, Y. Temporal consistency between gross primary production and solar-induced chlorophyll fluorescence in the ten most populous megacity areas over years. Sci. Rep. 2017, 7, 14963. [Google Scholar] [CrossRef]
Figure 1. Land use reclassification (a) and spatial distribution of land use types (b) in Beijing in 2015.
Land 09 00280 g001
Figure 2. Basic research framework on energy budget feedback of land use change.
Land 09 00280 g002
Figure 3. Net longwave and shortwave radiation in Beijing. Spatial differences of (a) net longwave radiation (Rnl) and (b) shortwave radiation (Rns) from 2000 to 2015; statistical feature values of the five land use types for (c) Rnl and (d) Rns from 2000 to 2015.
Land 09 00280 g003
Figure 4. Net radiation (Rn) in Beijing. (a) Spatial difference of Rn from 2000 to 2015; (b) Statistical feature values of the five land use types for Rn from 2000 to 2015.
Land 09 00280 g004
Figure 5. Variation trends of net radiation (Rn) under various land use types in Beijing from 2000 to 2015.
Land 09 00280 g005
Figure 6. Latent heat flux (LE) in Beijing. (a) Spatial difference of LE from 2000 to 2015; (b) statistical feature values of the five land use types for LE from 2000 to 2015.
Land 09 00280 g006
Figure 7. Variation trends of latent heat flux (LE) under various land use types in Beijing from 2000 to 2015.
Land 09 00280 g007
Figure 8. Difference in latent heat flux and net radiation (LE−Rn) in Beijing. (a) Spatial difference of LE−Rn from 2000 to 2015; (b) statistical feature values of the five land use types for LE−Rn from 2000 to 2015.
Land 09 00280 g008
Figure 9. Variation trends of the difference of latent heat flux and net radiation (LE−Rn) under various land use types in Beijing from 2000 to 2015.
Land 09 00280 g009
Figure 10. Relationships between latent heat flux and net radiation (LE−Rn) and LE, and Rn under various land use types in Beijing from 2000 to 2015. The red dots and lines are the scatter plot of LE−Rn and Rn; the green dots and lines are the scatter plot of LE−Rn and LE.
Land 09 00280 g010
Figure 11. Relationships between temperature (LST), net radiation (Rn), latent heat flux (LE), and LE−Rn under various land use types in Beijing from 2000 to 2015. The red dots and lines are the scatter plot of LST and Rn; the green dots and lines are the scatter plot of LST and LE; the blue dots and lines are the scatter plot of LST and LE−Rn.
Land 09 00280 g011
Table 1. Moderate Resolution Imaging Spectroradiometer (MODIS) data items and descriptions.
Data ItemsTime ResolutionSpatial ResolutionData Resource
Albedo daily500 mMCD43A3
Temperature (LST)daily1 kmMOD11A1
Latent heat flux (LE)8 days500 mMOD16A2
Emissivitydaily1 kmMOD11A1

