Processes of Forest Cover Change since 1958 in the Coffee-Producing Areas of Southwest Ethiopia


1
Department of Human Geography, Stockholm University, SE-106 91 Stockholm, Sweden
2
Department of Ecology, Environment and Plant Sciences, Stockholm University, SE-106 91 Stockholm, Sweden
*
Author to whom correspondence should be addressed.
Land 2020, 9(8), 278; https://doi.org/10.3390/land9080278
Submission received: 16 July 2020
/
Revised: 7 August 2020
/
Accepted: 11 August 2020
/
Published: 18 August 2020
Abstract
:We investigated the spatial relations of ecological and social processes to point at how state policies, population density, migration dynamics, topography, and socio-economic values of ‘forest coffee’ together shaped forest cover changes since 1958 in southwest Ethiopia. We used data from aerial photos, Landsat images, digital elevation models, participatory field mapping, interviews, and population censuses. We analyzed population, land cover, and topographic roughness (slope) data at the ‘sub-district’ level, based on a classification of the 30 lowest administrative units of one district into the coffee forest area (n = 17), and highland forest area (n = 13). For state forest sites (n = 6) of the district, we evaluated land cover and slope data. Forest cover declined by 25% between 1973 and 2010, but the changes varied spatially and temporally. Losses of forest cover were significantly higher in highland areas (74%) as compared to coffee areas (14%) and state forest sites (2%), and lower in areas with steeper slopes both in coffee and highland areas. Both in coffee and highland areas, forest cover also declined during 1958–1973. People moved to and converted forests in relatively low population density areas. Altitudinal migration from coffee areas to highland areas contributed to deforestation displacement due to forest maintenance for shade coffee production in coffee areas and forest conversions for annual crop production in highland areas. The most rapid loss of forest cover occurred during 1973–1985, followed by 2001–2010, which overlapped with the implementations of major land and forest policies that created conditions for more deforestation. Our findings highlight how crop ecology and migration have shaped spatial variations of forest cover change across different altitudinal zones whilst development, land, and forest policies and programs have driven the temporal variations of deforestation. Understanding the mechanisms of deforestation and forest maintenance simultaneously and their linkages is necessary for better biodiversity conservation and forest landscape management.
1. Introduction
Tropical forests shelter a substantial part of the world’s biodiversity [1,2] and play a vital role in regulating global climate processes by storing carbon [3,4]. They also provide important sources of food, energy, and shelter for millions of people [5,6], and many other ecosystem services, e.g., flood control and cultural services [7,8]. However, deforestation remains a threat to tropical forests, including forests in Ethiopia [3,9,10,11].
Various direct and indirect mechanisms are reported for the continued high rates of deforestation in tropical countries, including expansion of small-scale and commercial agriculture, wood fuel and timber extraction, increased global demand for land for food and biofuel production, and deforestation displacement [12,13,14,15,16]. Tropical deforestation is shaped by complex and varied proximate causes and underlying drivers [17]. The proximate causes are direct human activities or actions, e.g., agricultural expansion and timber extraction, that change forest conditions, whereas underlying drivers, e.g., demographic pressure, poverty, and broader social and market circumstances are core conditions that indirectly shape and reinforce the proximate causes of forest cover change. Hence, causes and drivers in a particular geographical setting, as well as land change in general, can in most cases only be understood through analysis of a complexity of driving forces involving situation-specific interactions among a large number of factors at different spatial and temporal scales [17,18,19]. This implies also that forces of conservation and forest maintenance are important to account for to fully comprehend forest dynamics and transitions (cf. [20]). Understanding temporally and spatially specific causes and driving forces, which relate both to forces of deforestation and conservation, is critical for devising policy interventions [17] and advancing understanding of land change at larger spatial scales [21].
Causes of deforestation in Ethiopia include conversion to agriculture [22,23,24,25,26], and use of forests as source of wood for timber, charcoal production, firewood, and construction [27,28]. These causes are shaped by underlying drivers, including national policies, institutional instability, agricultural stagnation, poverty, and demographic pressure [22,24,25,26,29]. Southwest Ethiopia, which is the focus of this study, shelters most of Ethiopia’s remaining forests that have important social-ecological significances [30,31]. The forest in the southwest offers amiable conditions for coffee (Coffea arabica) production and the “forest coffee ecosystem” mostly in the south and southwest [32] contribute about 45% of the total coffee produced in the country [33]. Coffee is Ethiopia’s main source of foreign currency earning [34], and the need for shade trees for coffee production has had a conserving effect that has reduced the rate of deforestation over the past four decades within coffee-growing altitudes, c. 1300–2000 m [35]. In contrast to this conserving effect, a number of studies have shown that state policies (e.g., resettlement programs), demographic pressure, demand for timber and wood products, and conversion of forest to agricultural land have reduced forest cover in the region (e.g., [23,36,37,38,39]). However, what remains to be studied in more detail is how farmers’ practices (e.g., coffee production) have interacted with state policies (e.g., logging quotas in the 1980s and early 1990s). This would lead to a better understanding of how such interactions have shaped forest cover change, both through mechanisms of deforestation and processes that favor forest maintenance.
In this study, we took the case of Gera district within southwest Ethiopia to investigate the spatial relations of ecological and social processes. More specifically, we wanted to see how state policies, migration dynamics, topography (slope and elevation), and the ecological and socio-economic values of ‘forest coffee’ have shaped forest cover changes over time and across space. We investigated (i) the mechanisms of deforestation and conservation at smaller scales, and (ii) how they add up to patterns at larger scales (sub-district) and links across landscapes. To do this, we combined an analysis of remote sensing data with data from participatory field mapping, interviews, focus group discussions, and population censuses. We quantified forest and non-forest area changes based on a classification of 30 kebeles (kebele is the lowest administrative unit in Ethiopia) of Gera district into a coffee forest area, hereafter coffee areas (n = 17), and highland forest area, i.e., the zone above coffee-growing altitudes, hereafter highland areas (n = 13) and state forest sites (n = 6). In a second step, we matched this pattern with the social-ecological drivers, e.g., agriculture and coffee production, slope, population density, and polices, that we could identify.
2. Methods
2.1. Research Setting
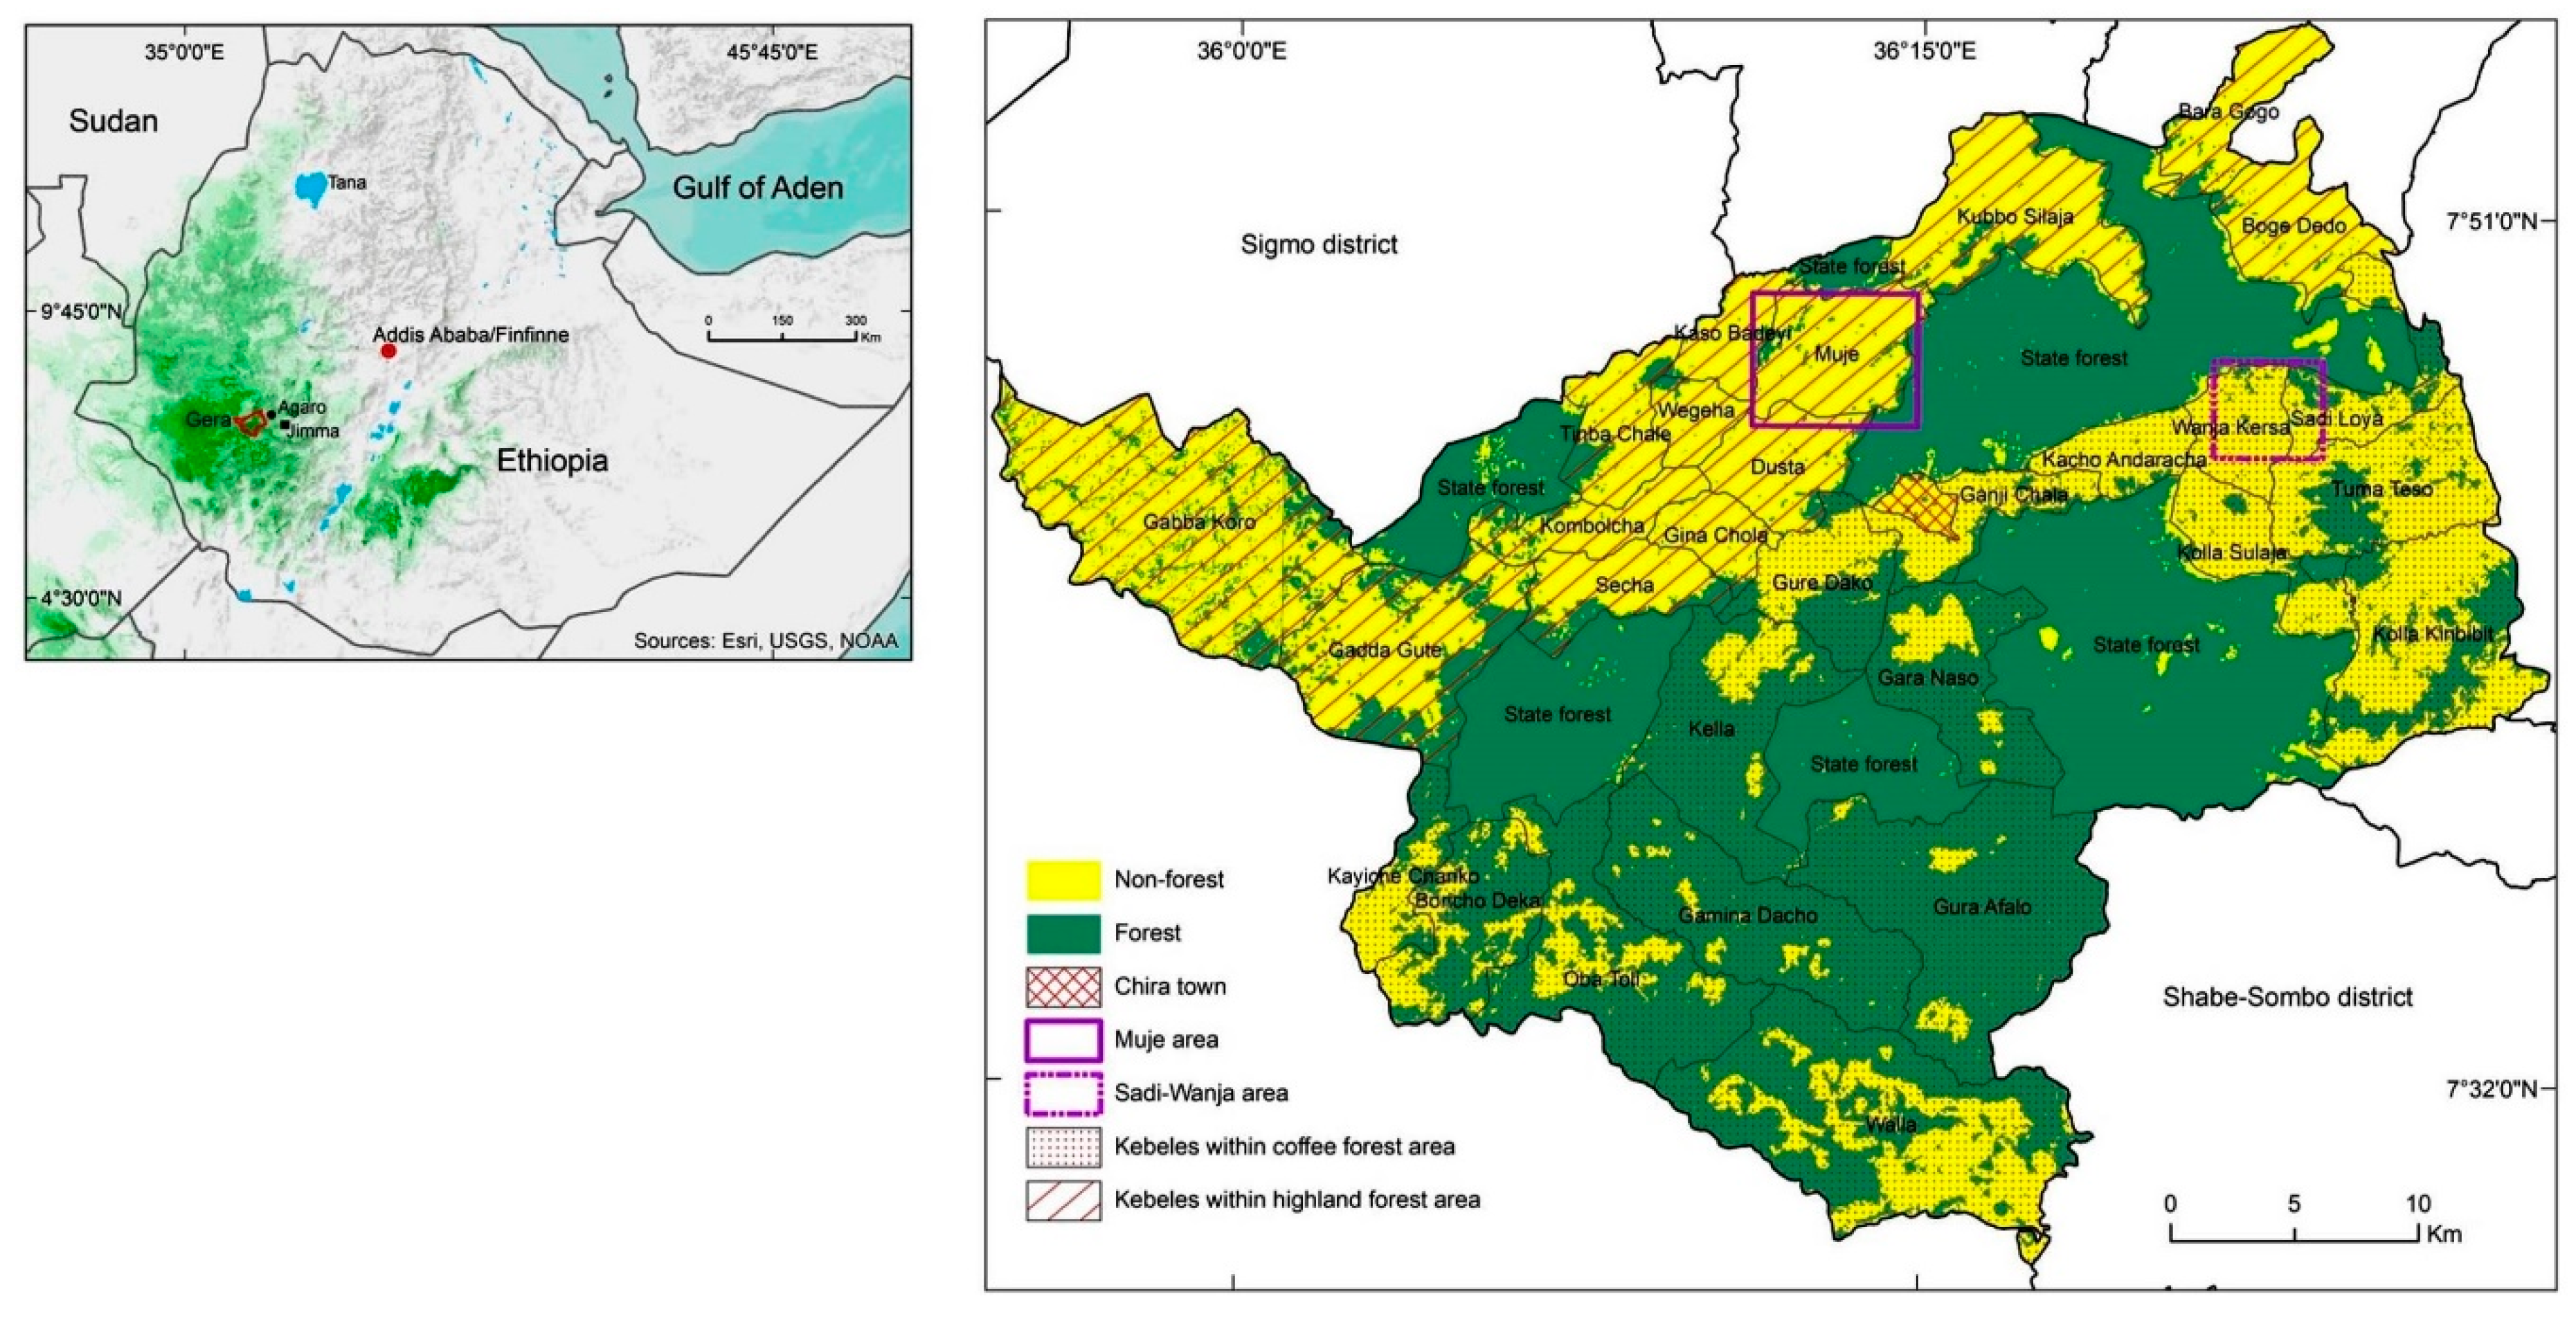
The study was conducted in Gera district, Jimma zone, Oromia region in southwest Ethiopia (Figure 1). The district is divided into 29 rural kebeles and a town and has a total area of 1454 km2 and about 138,000 inhabitants, 95% of whom are smallholder farmers [40]. Its landscape is characterized by an agriculture-forest mosaic that integrates shade coffee production in many places. Altitudes range between 1390 and 2980 m above sea level. Coffee is an important cash income source for most smallholding farmers in the district. Each kebele is classified as being located either within coffee areas or highland areas, largely on the basis of the microclimatic suitability for shade coffee production, following differences in elevation that influence other biotic and abiotic features ([41]; Figure 1). Sixteen kebeles and Chira town are located in the sub-district designated as coffee areas while the remaining 13 are situated in highland areas. The coffee and highland area kebeles are located in the southern and northern parts of the district, respectively (Figure 1). In addition to coffee, the moist evergreen Afromontane forest shelters several tree species, including Olea welwitschii, Pouteria adolfi-friedericii, Schefflera abyssinica, and Syzygium guineense [42], as well as other economically important endemic plant species, such as the spice Aframomum corrorima [30]. The forest has also been widely used for honey production via locally produced beehives hung on trees [43].
2.2. Data Collection and Analyses
2.2.1. Participatory Field mapping, Focus Group Discussions, and Interviews
We collected field data on land use dynamics and drivers during three periods: 3 May to 10 July 2011, 4 October to 4 November 2013, and 6 January to 17 January 2015 (hereafter the first, second, and third field work periods, respectively). During the first fieldwork period, we collected data on land use history through participatory field mapping and interviews with 21 farmers living in 4 villages: Hertanno, Kerebe, Kersa, and Maru. Kerebe and Kersa are located in Sadi Loya and Wanja Kersa, respectively, both of which are coffee area kebeles. Hertanno and Maru are located in Muje, a highland area kebele. We purposively selected five farmers from each village (six from Kersa), covering different ages (younger, <35; middle ages, 36–50 years; older, >50 years) and genders (19% women) to capture diverse perspectives on land use dynamics. We visited nearly all (99%) of the 213 fields used by the selected farm households and mapped 97.7% of these fields by recording coordinates of their boundaries with a hand-held GPS (Global Positioning System) device. We also identified these fields and outlined their boundaries on printouts of Google Earth images. The interviews with the farmers covered the land use histories of all the different fields they used, including home gardens as well as annual crop, grazing, and coffee land. To systematize the oral history and help trigger the interviewed farmers’ memory of past events, we used two key reference years: 1974 (when the socialist military overthrew the last feudal monarch, Emperor Haile Selassie) and 1991 (the year when the socialist government was itself overthrown and the current government, the Ethiopian People’s Revolutionary Democratic Front, took power).
During the first fieldwork period, we also conducted focus group discussions about forest cover histories and drivers in the villages and district with groups of seven men on average in each of the four villages. We conducted interviews on the same subject with a total of 12 key informants during the first and second fieldwork periods (five and seven interviews, respectively), as well as a group discussion with three key informants during the second fieldwork period to generate additional data on forest cover change histories and for triangulation. The key informants, who were identified through snowball sampling, were either farmers or staff at the Agricultural and Rural Development Office or the Oromia Forest and Wildlife Enterprise—Jimma Branch Office (OFWE-JBO). All of them were considered knowledgeable about past land use dynamics in the district, and most of them were elderly.
During the third fieldwork period, we published our preliminary findings in the form of a short pamphlet containing popularized text in Afaan Oromo (a regional language) along with photos from previous fieldwork. This was distributed mainly to informants and other farmers as a means of reporting back and to invite comments and debate on findings. We also conducted several informal conversations with farmers encountered while walking across the landscape, which generated data on both current and historical forest cover change that corroborated data from earlier fieldwork periods.
We combined the qualitative data from participatory field mapping, focus group discussions, and interviews, and thematically analyzed this data to get an understanding of possible underlying mechanisms for the patterns of forest cover changes observed in the remotely sensed imageries. More specifically, the qualitative data provided insights about the diversity of drivers that explain the temporal and spatial variations in the patterns of forest cover change.
2.2.2. Analysis of Satellite Images and Slope Data
We used the forest and non-forest cover datasets for 1973, 1985, 1995, 2001, and 2010 generated by Hylander et al. [35] from the analysis of free multispectral Landsat images obtained from http://www.usgs.gov/. From these datasets, we extracted and used the data covering Gera district. However, the land cover data of Hylander et al. [35] only covered 94.4% of the district’s total area. To produce a complete analysis of forest and non-forest cover change for Gera district, we analyzed free multispectral Landsat images for the omitted part using a method similar to that of Hylander et al. [35] (for a detailed description of the analysis of satellite images, see Appendix A.1).
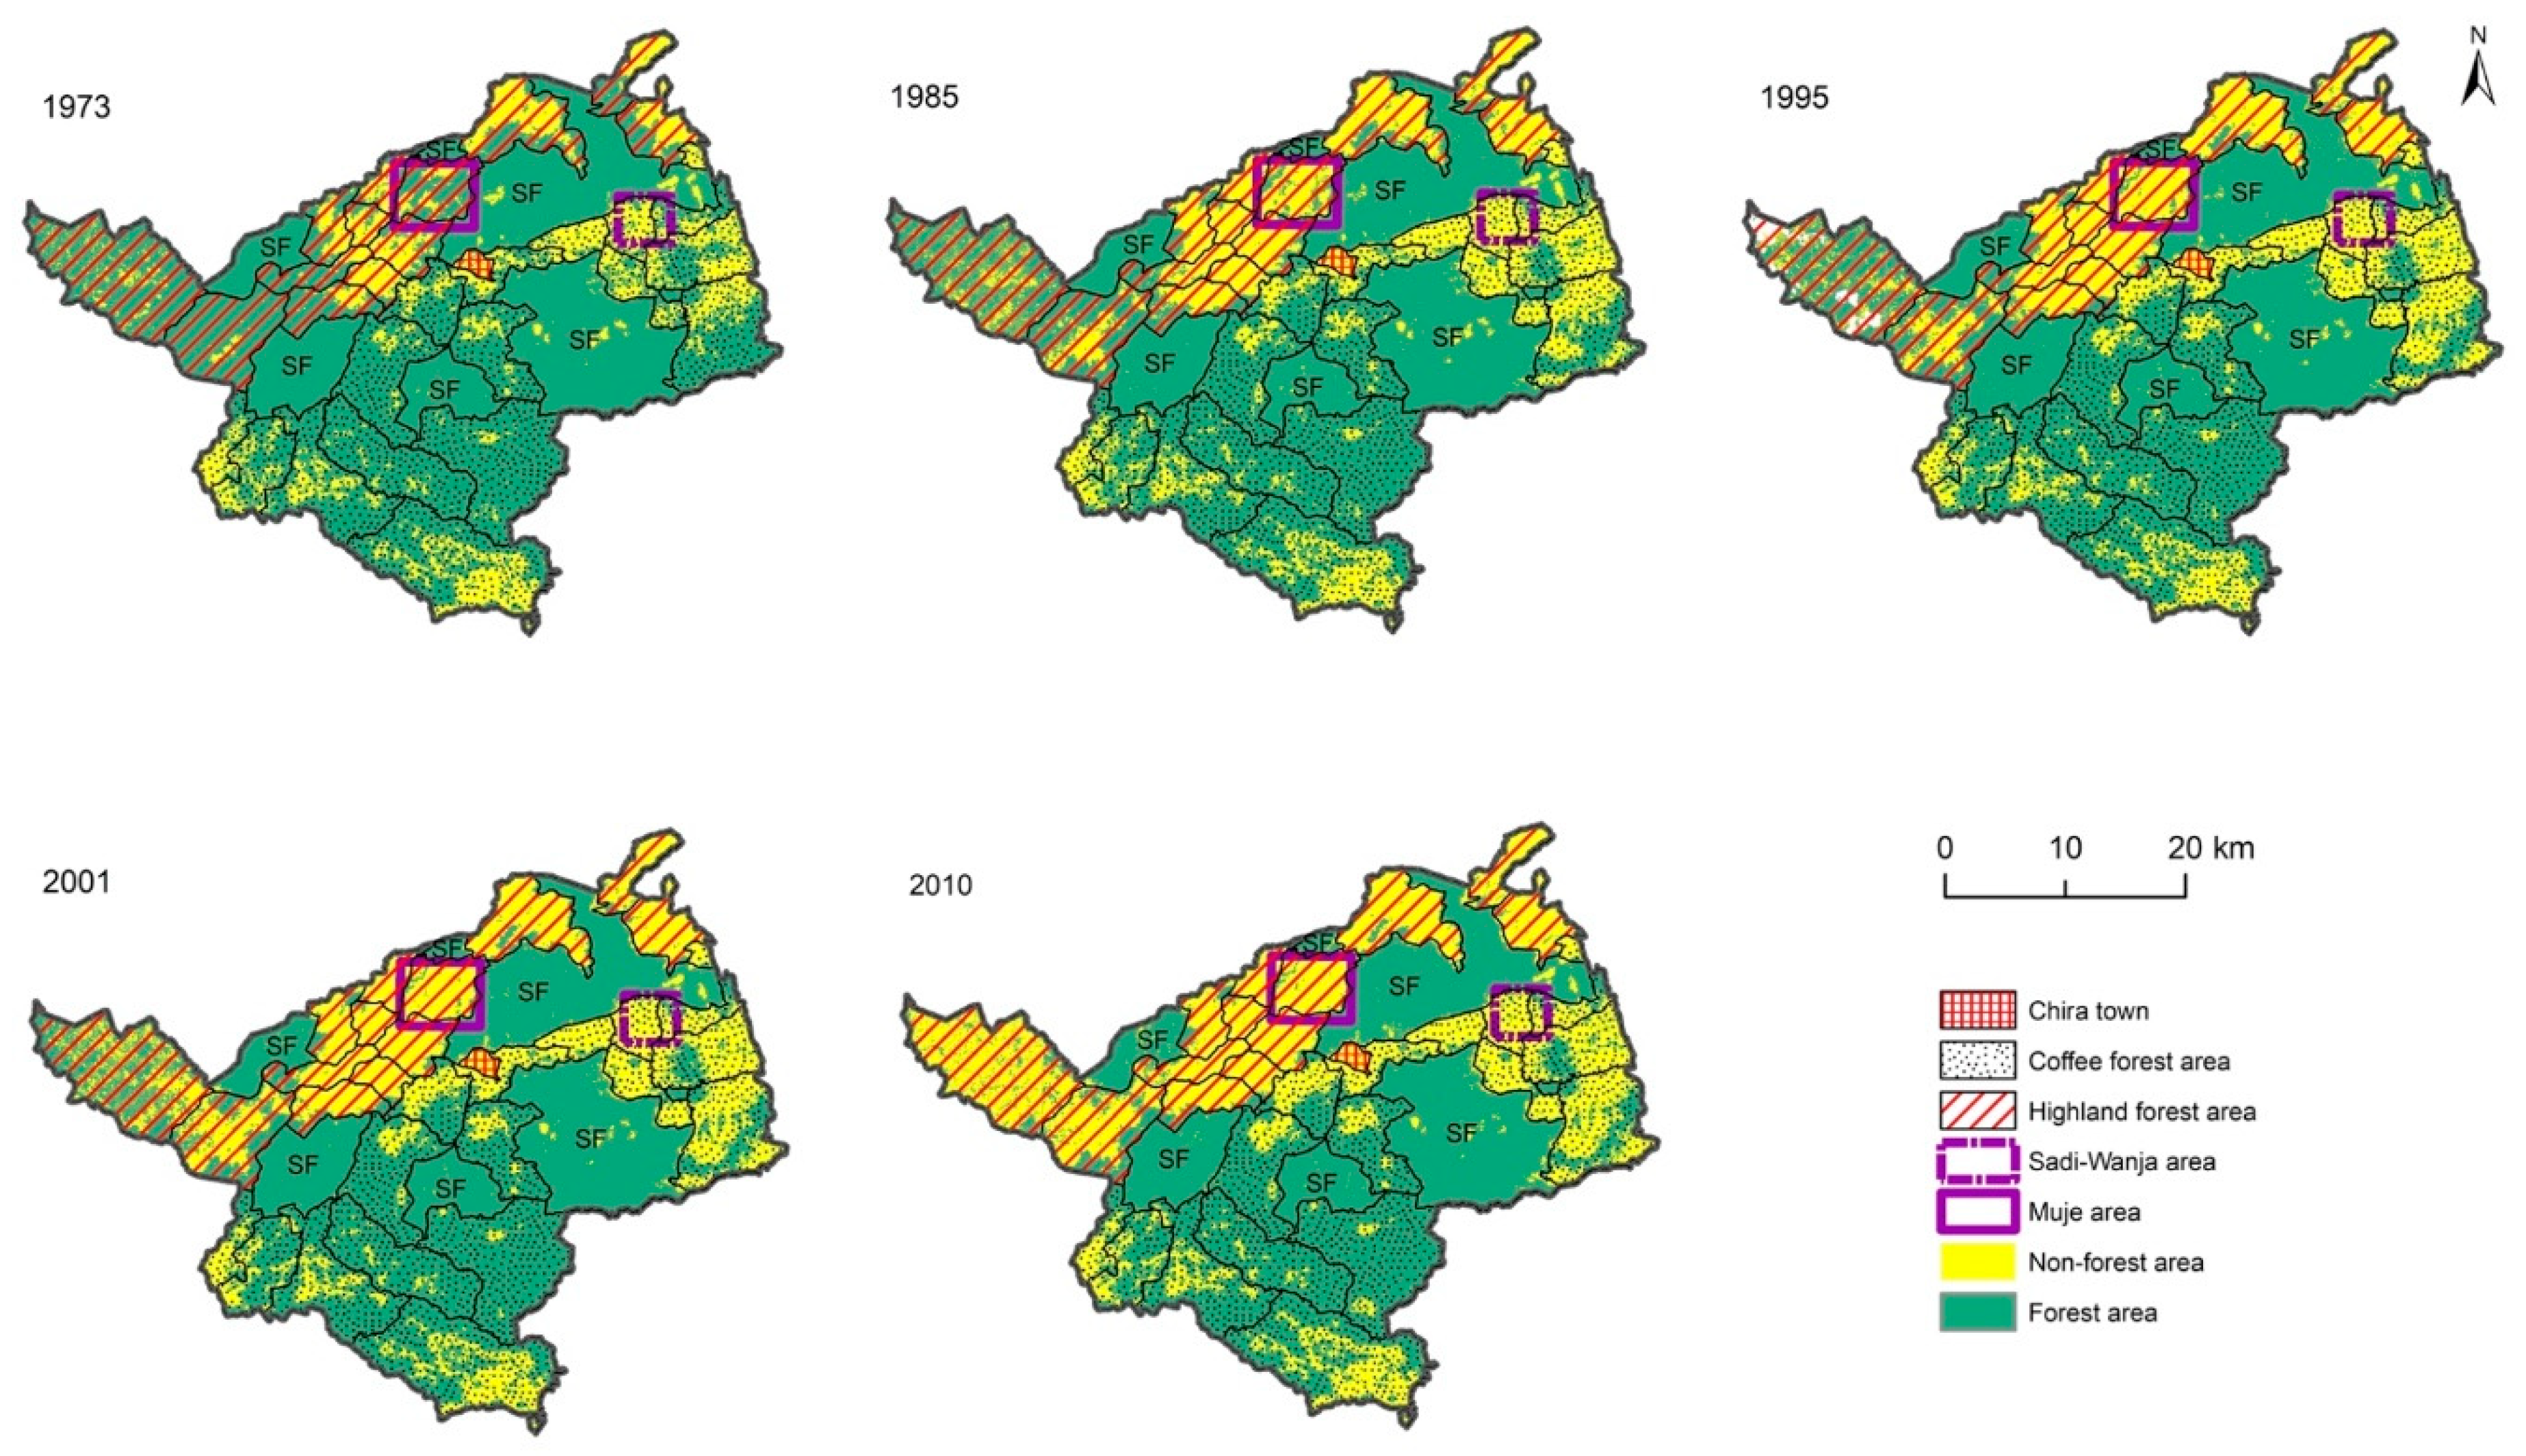
We then computed the extent of forest and non-forest cover for each kebele from each image using kebele boundaries obtained from the Central Statistical Agency of Ethiopia (Figure 2). Most of the forestland outside kebele boundaries was designated as separate “state forest” sites (Figure 1). We used the kebele and state forest sites boundaries for the 2007 census for all studied years, and thus, the findings of this study should be interpreted within this context. We used the zonal histogram in ArcMap’s spatial analyst tools to extract forest and non-forest areas for each kebele and state forest sites. From the forest cover data, we computed (i) the percentages of forest cover in 1973, 1985, 1995, 2001, and 2010; and (ii) the relative rate of forest and forest area changes per year for the periods 1973–1985, 1985–1995, 1995–2001, 2001–2010, and 1973–2010. We did this first for each kebele and each state forest site and then for the aggregated coffee areas, highland areas, state forest sites, and district separately.
To evaluate if topographic roughness, i.e., steep slopes, might have prevented the conversion of forests to agriculture, we analyzed the relations between forest cover and the mean slopes. We used the Shuttle Radar Topographic Mission’s (SRTM) 30-m digital elevation models (DEMs) (https://lta.cr.usgs.gov/SRTM1Arc) and extracted the mean slope (in degree) for each kebele and state forest site. We used the zonal statistics as table in ArcMap’s spatial analyst tools to extract the mean slope for quantitative analysis.
2.2.3. Interpretation of Aerial Photos
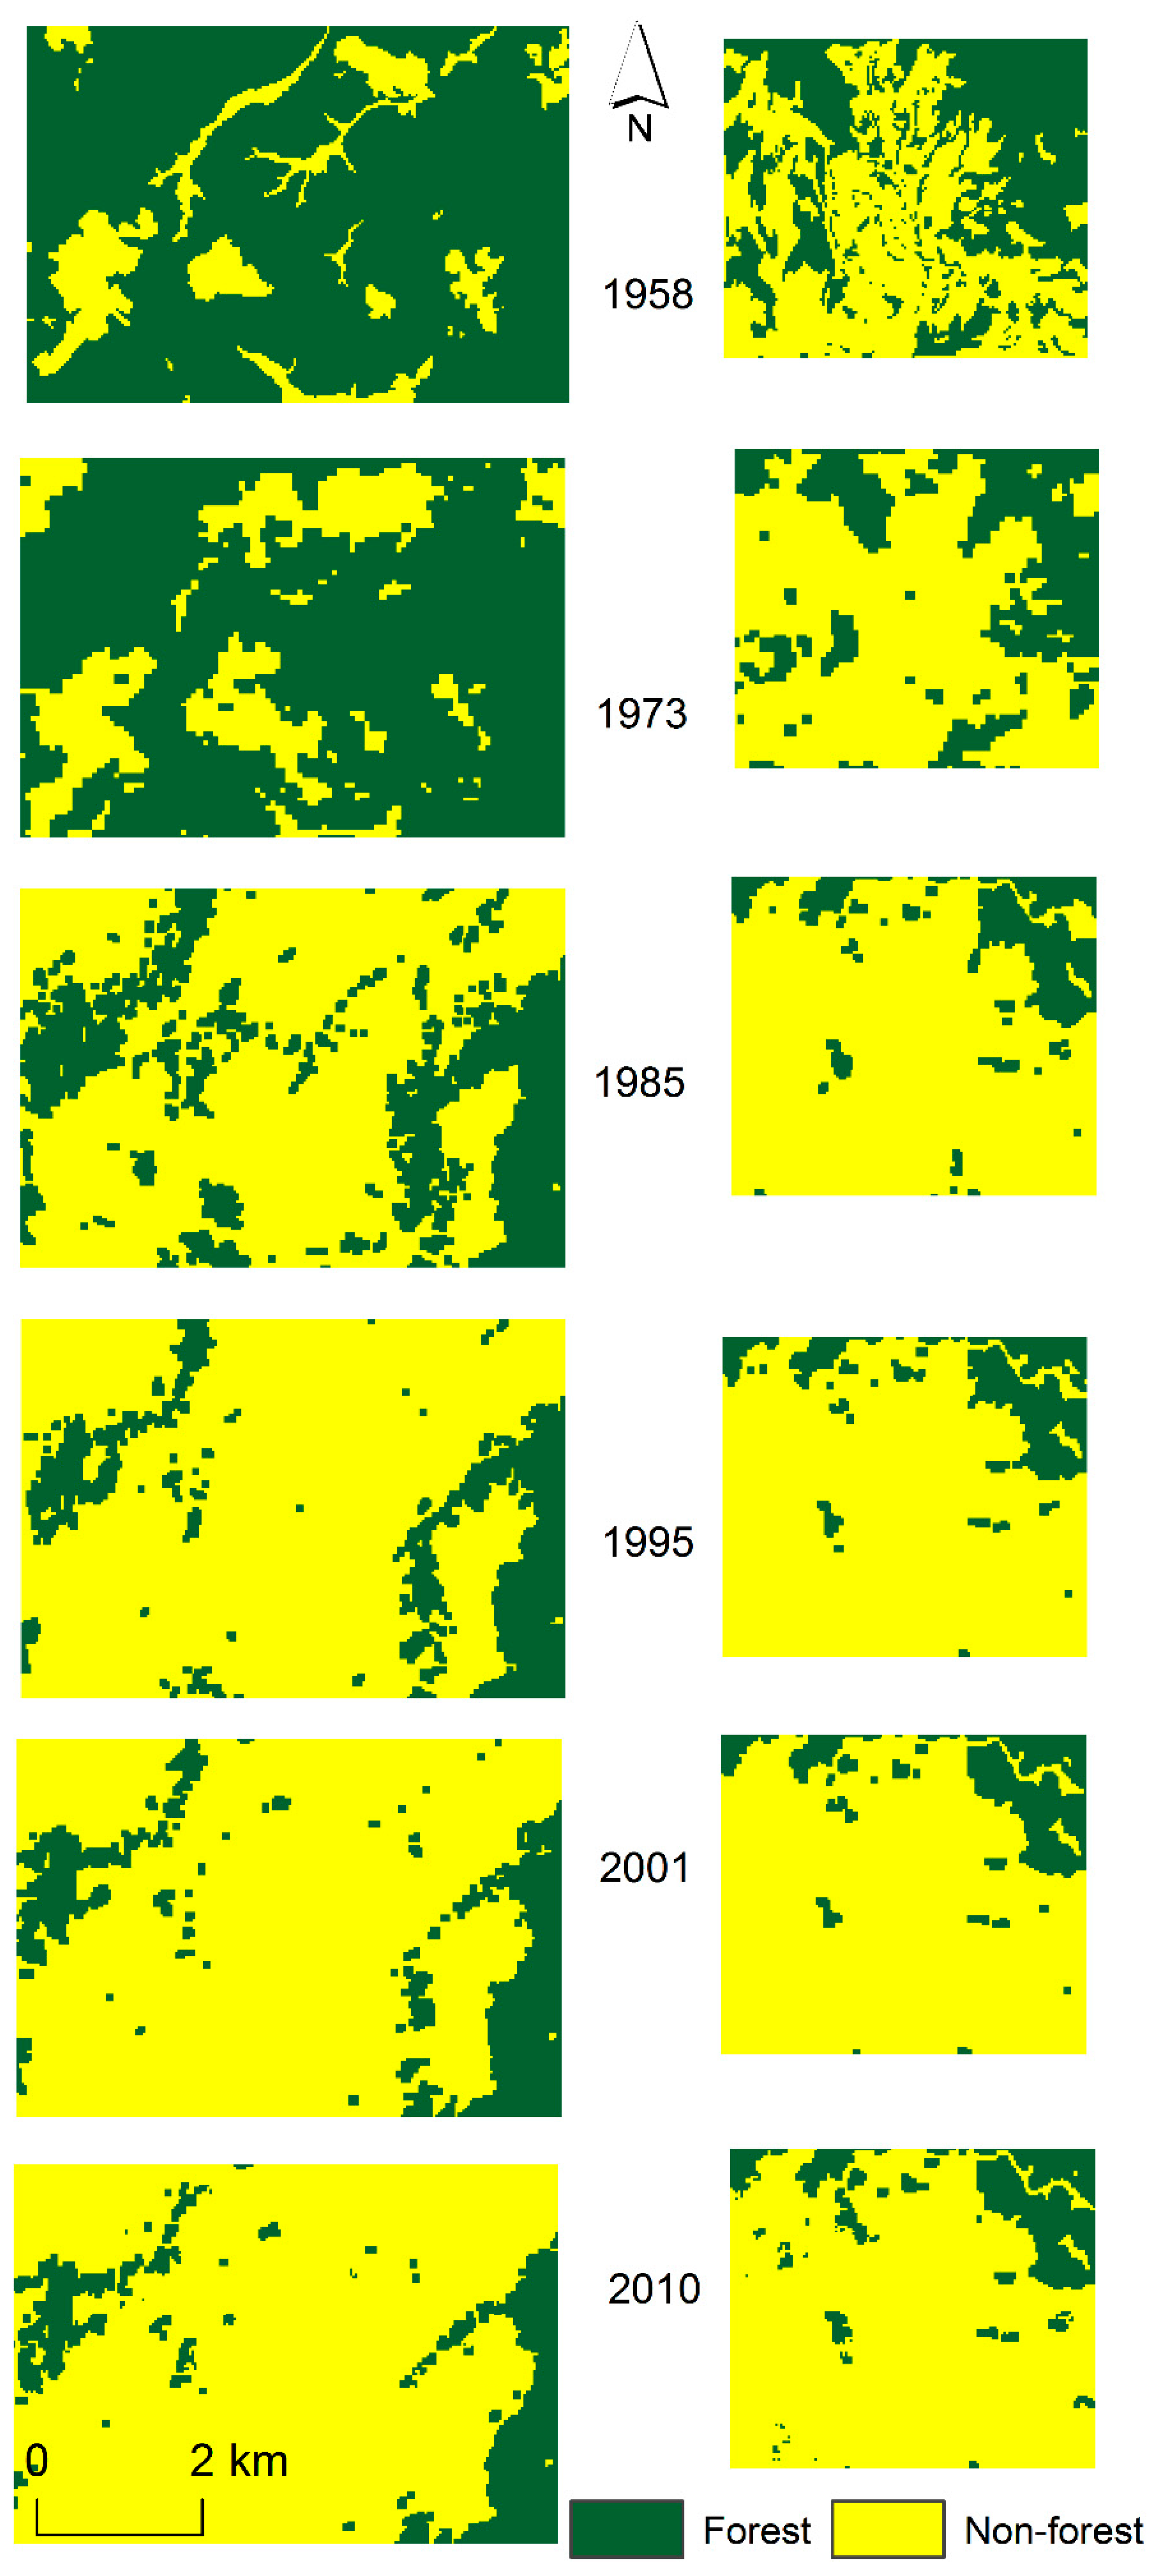
In order to understand forest cover prior to the 1973 Landsat image, aerial photographs taken on 15 January 1958 were interpreted for one coffee area—Sadi-Wanja, and one highland area—Muje (Figure 1; Figure A1). Sadi-Wanja is a coffee area of approximately 1700 ha located mostly within Sadi Loya and Wanja Kersa kebeles, while Muje is a highland area of approximately 3000 ha located mostly within Muje kebele. Sadi-Wanja and Muje were selected for the aerial photo analysis because we had detailed field data for these areas, including oral history accounts. Sadi-Wanja, which is situated along a road that has been in place for over a half century, has attracted immigrant settlers and private coffee investments. Muje kebele has also attracted migrations from other kebeles within Gera and nearby districts, as well as logging enterprises. We obtained the aerial photographs as paper copies from the Ethiopian Mapping Agency (for a detailed description of the aerial photos and their interpretation, see Appendix A.2). The forest and non-forest land uses were visually interpreted on the basis of tone, texture, and patterns, and digitized manually in ArcMap. We computed forest and non-forest areas for 1958 for Muje and Sadi-Wanja and compared these to the areas from the datasets of Hylander et al. [35].
2.2.4. Population Data from National Censuses
Kebele population data were taken from the 1984, 1994, and 2007 national population censuses [44,45,46]. During the 1984 and 1994 censuses, Gera had 47 and 50 smaller rural kebeles including ‘towns’, respectively. These smaller kebeles had been merged into 29 larger kebeles and one town when the 2007 census was conducted. We obtained a list of the smaller kebeles and towns that were merged from key informants at district offices and aggregated the population numbers of the smaller kebeles as the total population for each merged kebele in 1984 and 1994, thus allowing comparison with the corresponding population numbers in 2007 (Table A1).
We proportionally interpolated the population numbers for 1985, and for 1995 and 2001 based on the population increase during 1984–1994 and 1994–2007, respectively. We extrapolated the population number for 2010 based on the population increase during 1994–2007. Next, we calculated crude population densities for 1985, 1995, 2001, and 2010 to form proxy population densities for the periods 1973–1985, 1985–1995, 1995–2001, and 2001–2010, respectively, and used these in non-parametric statistical tests.
2.3. Statistical Tests
To evaluate the patterns of forest cover change, population density, and slope in coffee areas, highland areas, and state forest sites, we used two non-parametric methods: Wilcoxon rank-sum and Spearman’s rank correlation tests. We used non-parametric methods due to skewed distributions in the data. We used the Wilcoxon rank-sum test to evaluate differences in the extent of (a) forest cover changes, and (b) population densities between the coffee and highland area kebeles. We compared the (a) forest area change per year and (b) rate of relative forest cover change in coffee areas versus highland area kebeles for the 1973–2010 period and for the four sub-periods: 1973–1985, 1985–1995, 1995–2001, and 2001–2010. We tested whether there were any differences in the population densities of coffee areas and highland areas in 1985, 1995, 2001, and 2010. We used the Wilcoxon rank-sum test to also evaluate if there were any differences in the mean slope between coffee areas, highland areas, and the state forest sites. We compared the mean slopes of (a) coffee areas to highland areas, (b) coffee areas to state forest sites, and (c) highland areas to state forest sites.
We used Spearman’s rank correlation test to evaluate whether the extent of forest cover changes, in terms of forest area change per year and rate of relative forest cover change, was correlated with population densities in coffee and highland area kebeles. As inputs, we used the population densities in 1985, 1995, 2001, and 2010 versus (a) the forest area change per year or (b) the rate of relative forest cover change during 1973–1985, 1985–1995, 1995–2001, and 2001–2010 and 1973–2010. We used Spearman’s rank correlation test to also evaluate whether the extent of (a) forest cover and (b) rate of relative forest cover change were correlated with the mean slopes for the whole district, the state forest sites, and coffee and highland area kebeles. In the first test (a), we used the mean slope versus the percentages of forest cover in 2010 for the state forest sites, and coffee and highland area kebeles, as inputs. In the second test (b), the inputs used were the mean slope versus the rate of relative forest cover change during 1973–2010 for the state forest sites, and coffee and highland area kebeles. We used version 3.1.0 of the free R software package to perform the non-parametric tests [47].
3. Results
3.1. Extent and Patterns of Forest Cover Change
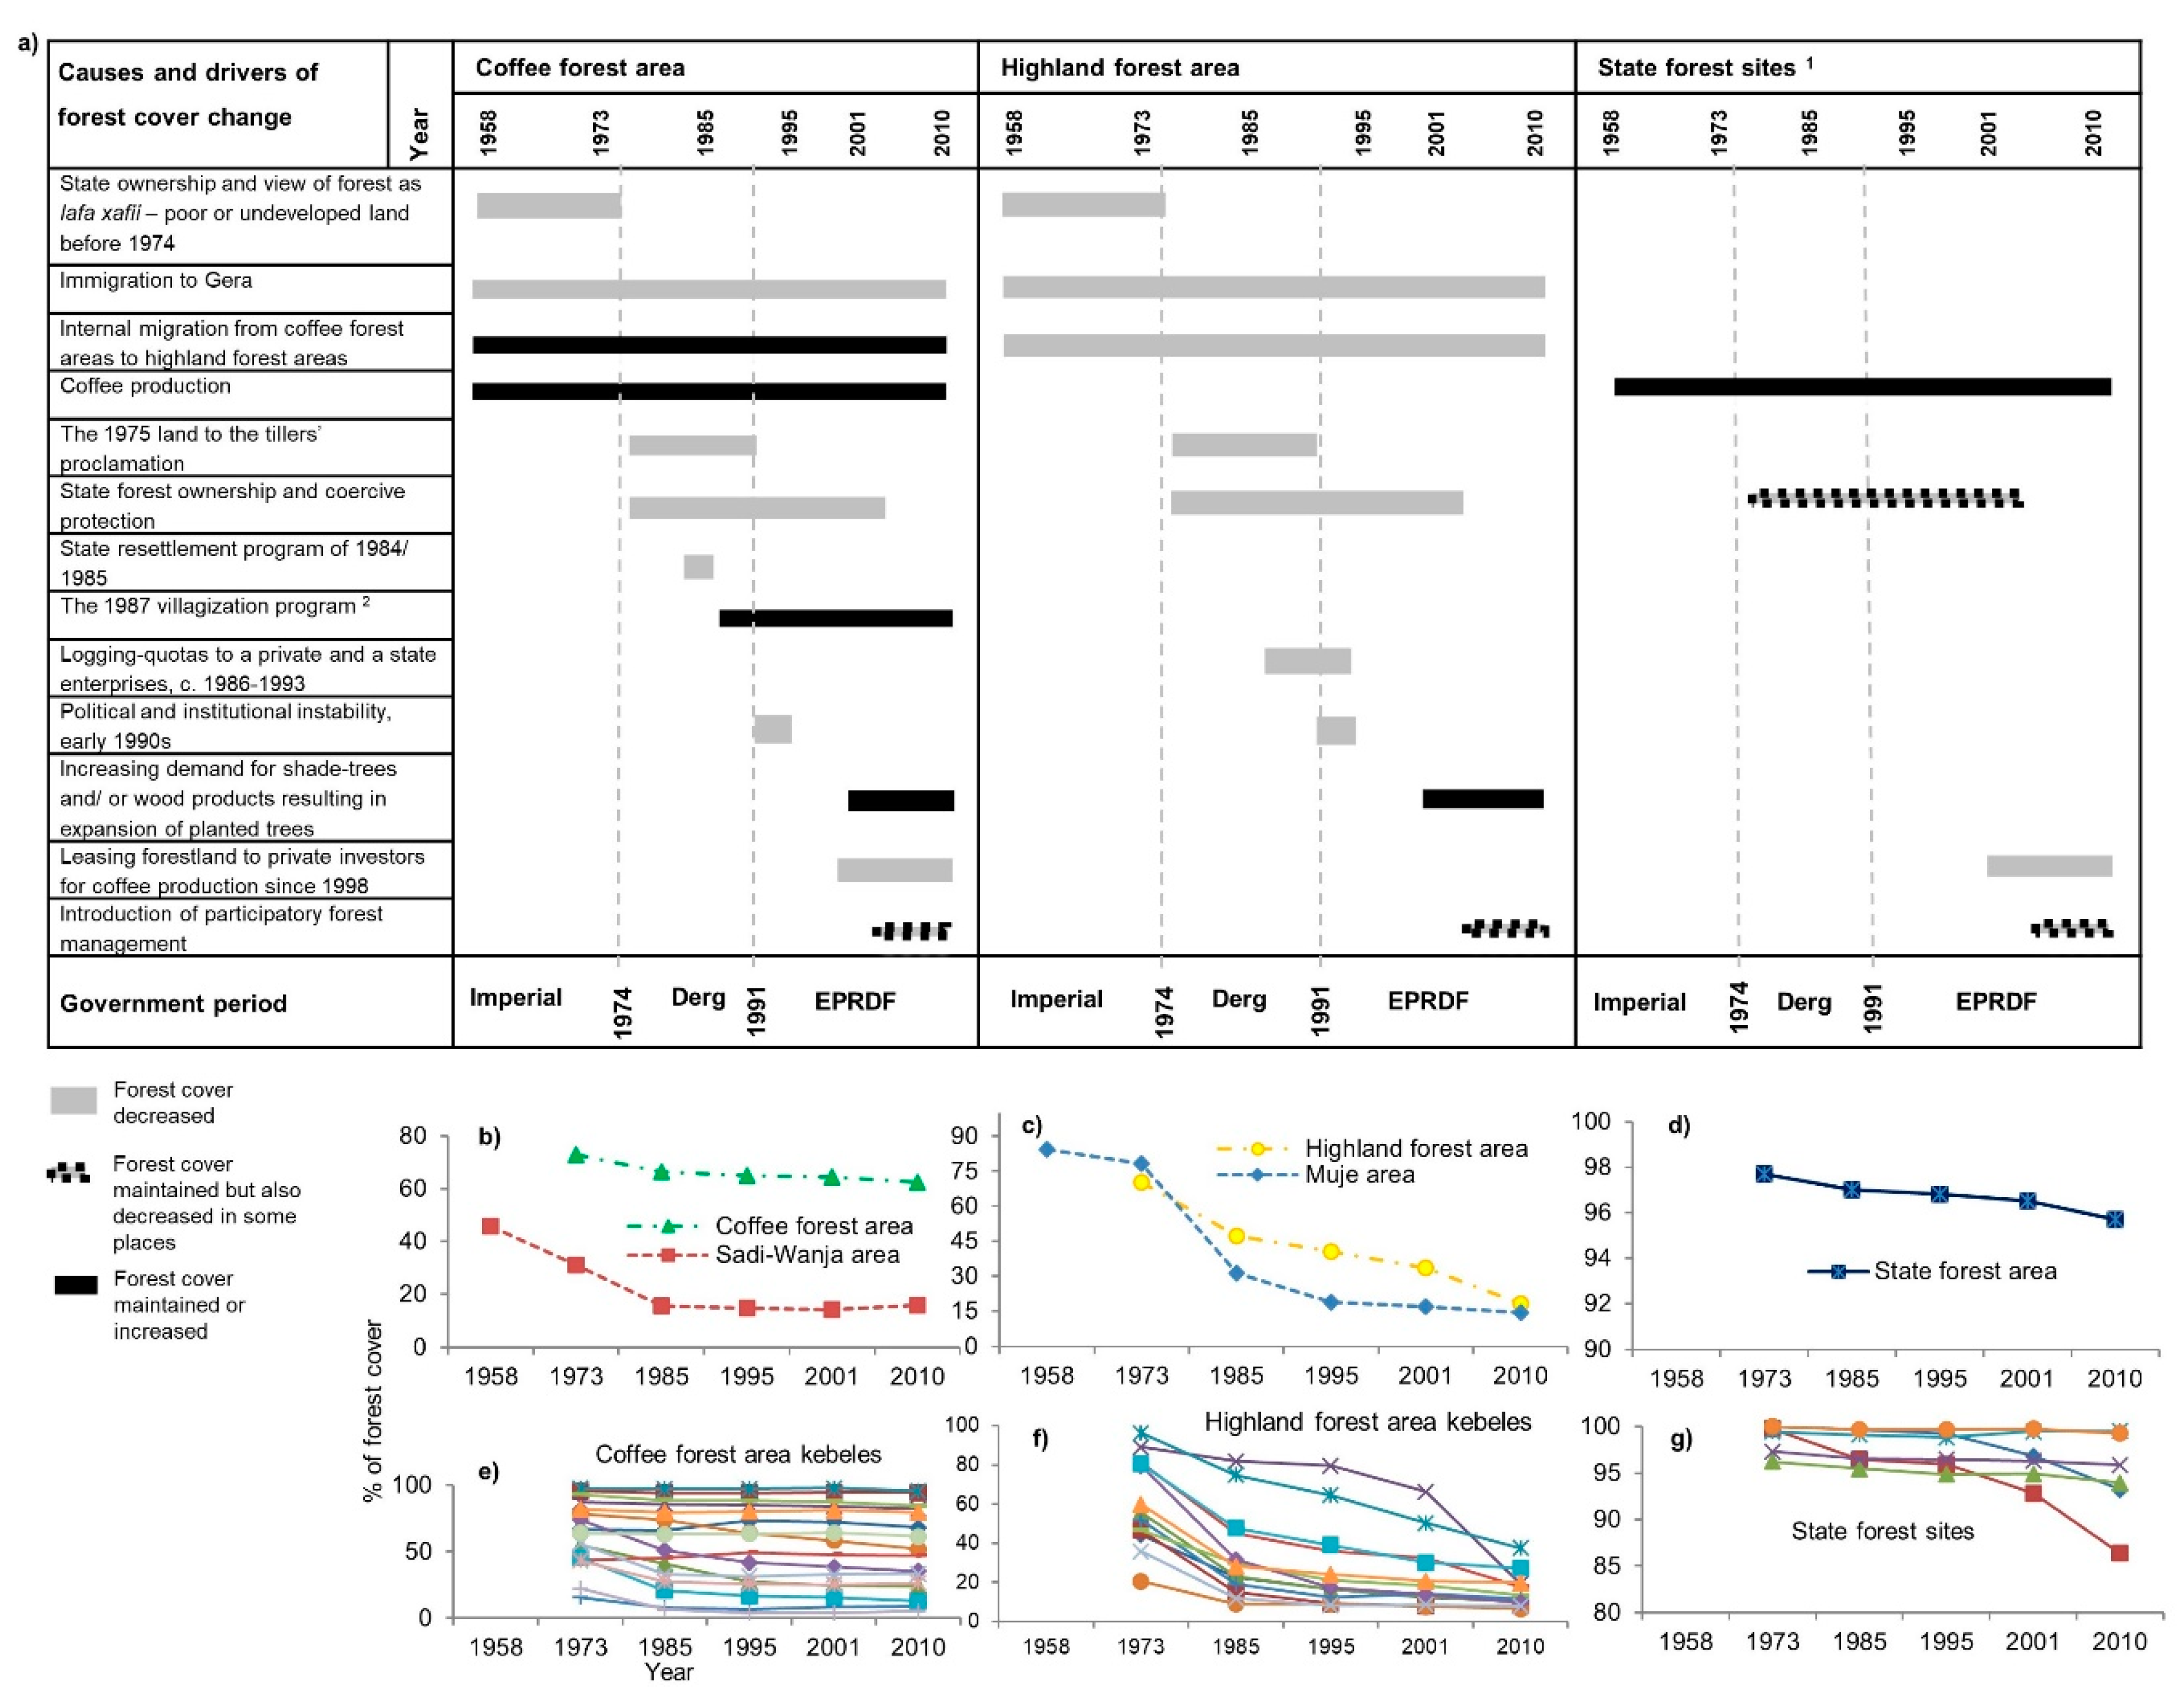
From 1973 to 2010, the forest cover in Gera declined from 78.9% to 59.5%, corresponding to about 760 ha per year, or 24.5% of the 1973 forest cover was lost (Table 1; Table A2). However, the spatial variation was large. The forest cover in highland area kebeles shrank from 70.2% in 1973 to 18.1%, which amounts to a loss of 74.2% of the 1973 forest in 2010 while that in coffee area kebeles declined from 72.6% to 62.1%, i.e., a loss of 14.4% of the 1973 forest. During this period, the forest cover in areas designated as state forest decreased from 97.7% to 95.7%, which amounts to a loss of 2.1% of the 1973 forest in 2010 (Table 1).
During 1973–2010 and all sub-periods except 2001–2010, highland area kebeles saw significantly larger forest area change per year in comparison to coffee area kebeles (Table 2; p-values 0.002, 0.001, 0.009, and 0.017, respectively). Moreover, during 1973–2010 and all four sub-periods, the relative rate of forest cover change was significantly higher in highland area kebeles than in coffee area kebeles (Table 2; p-values < 0.001, 0.003, 0.004, 0.001, and <0.001, respectively). The highest forest area decline per year in both coffee and highland area kebeles and the whole district occurred between 1973 and 1985 (360, 744, and 1127 ha per year, respectively), and the second highest occurred between 2001 and 2010 (137, 667, and 844 ha per year, respectively) (Table A2).
The aerial photo interpretation revealed that a total of 70.4% of the Muje and Sadi-Wanja areas was covered by forest in 1958, but only 21.1% of the forest that existed in 1958 remained in 2010 (Table A3; Figure A1). These two areas differed both in the extent of forest cover in 1958 and in the rate of forest cover change during 1958–1973. In 1958, about 84.2% of Muje and 45.9% of Sadi-Wanja was covered by forest (Table A3). In 2010, about 17.1% and 34.4% of the 1958 forest area remained in Muje and Sadi-Wanja, respectively.
According to the participatory field mapping and interviews, the land that the interviewed farmers allocated for annual crop production and settlement in highland areas increased from 28% in 1974 to 75% in 2011 at the expense of forests (all were converted to other land uses, mainly to agriculture). Forest land was also converted to semi-managed forest coffee in coffee areas (Table A4).
3.2. Population Density and Forest Cover Changes
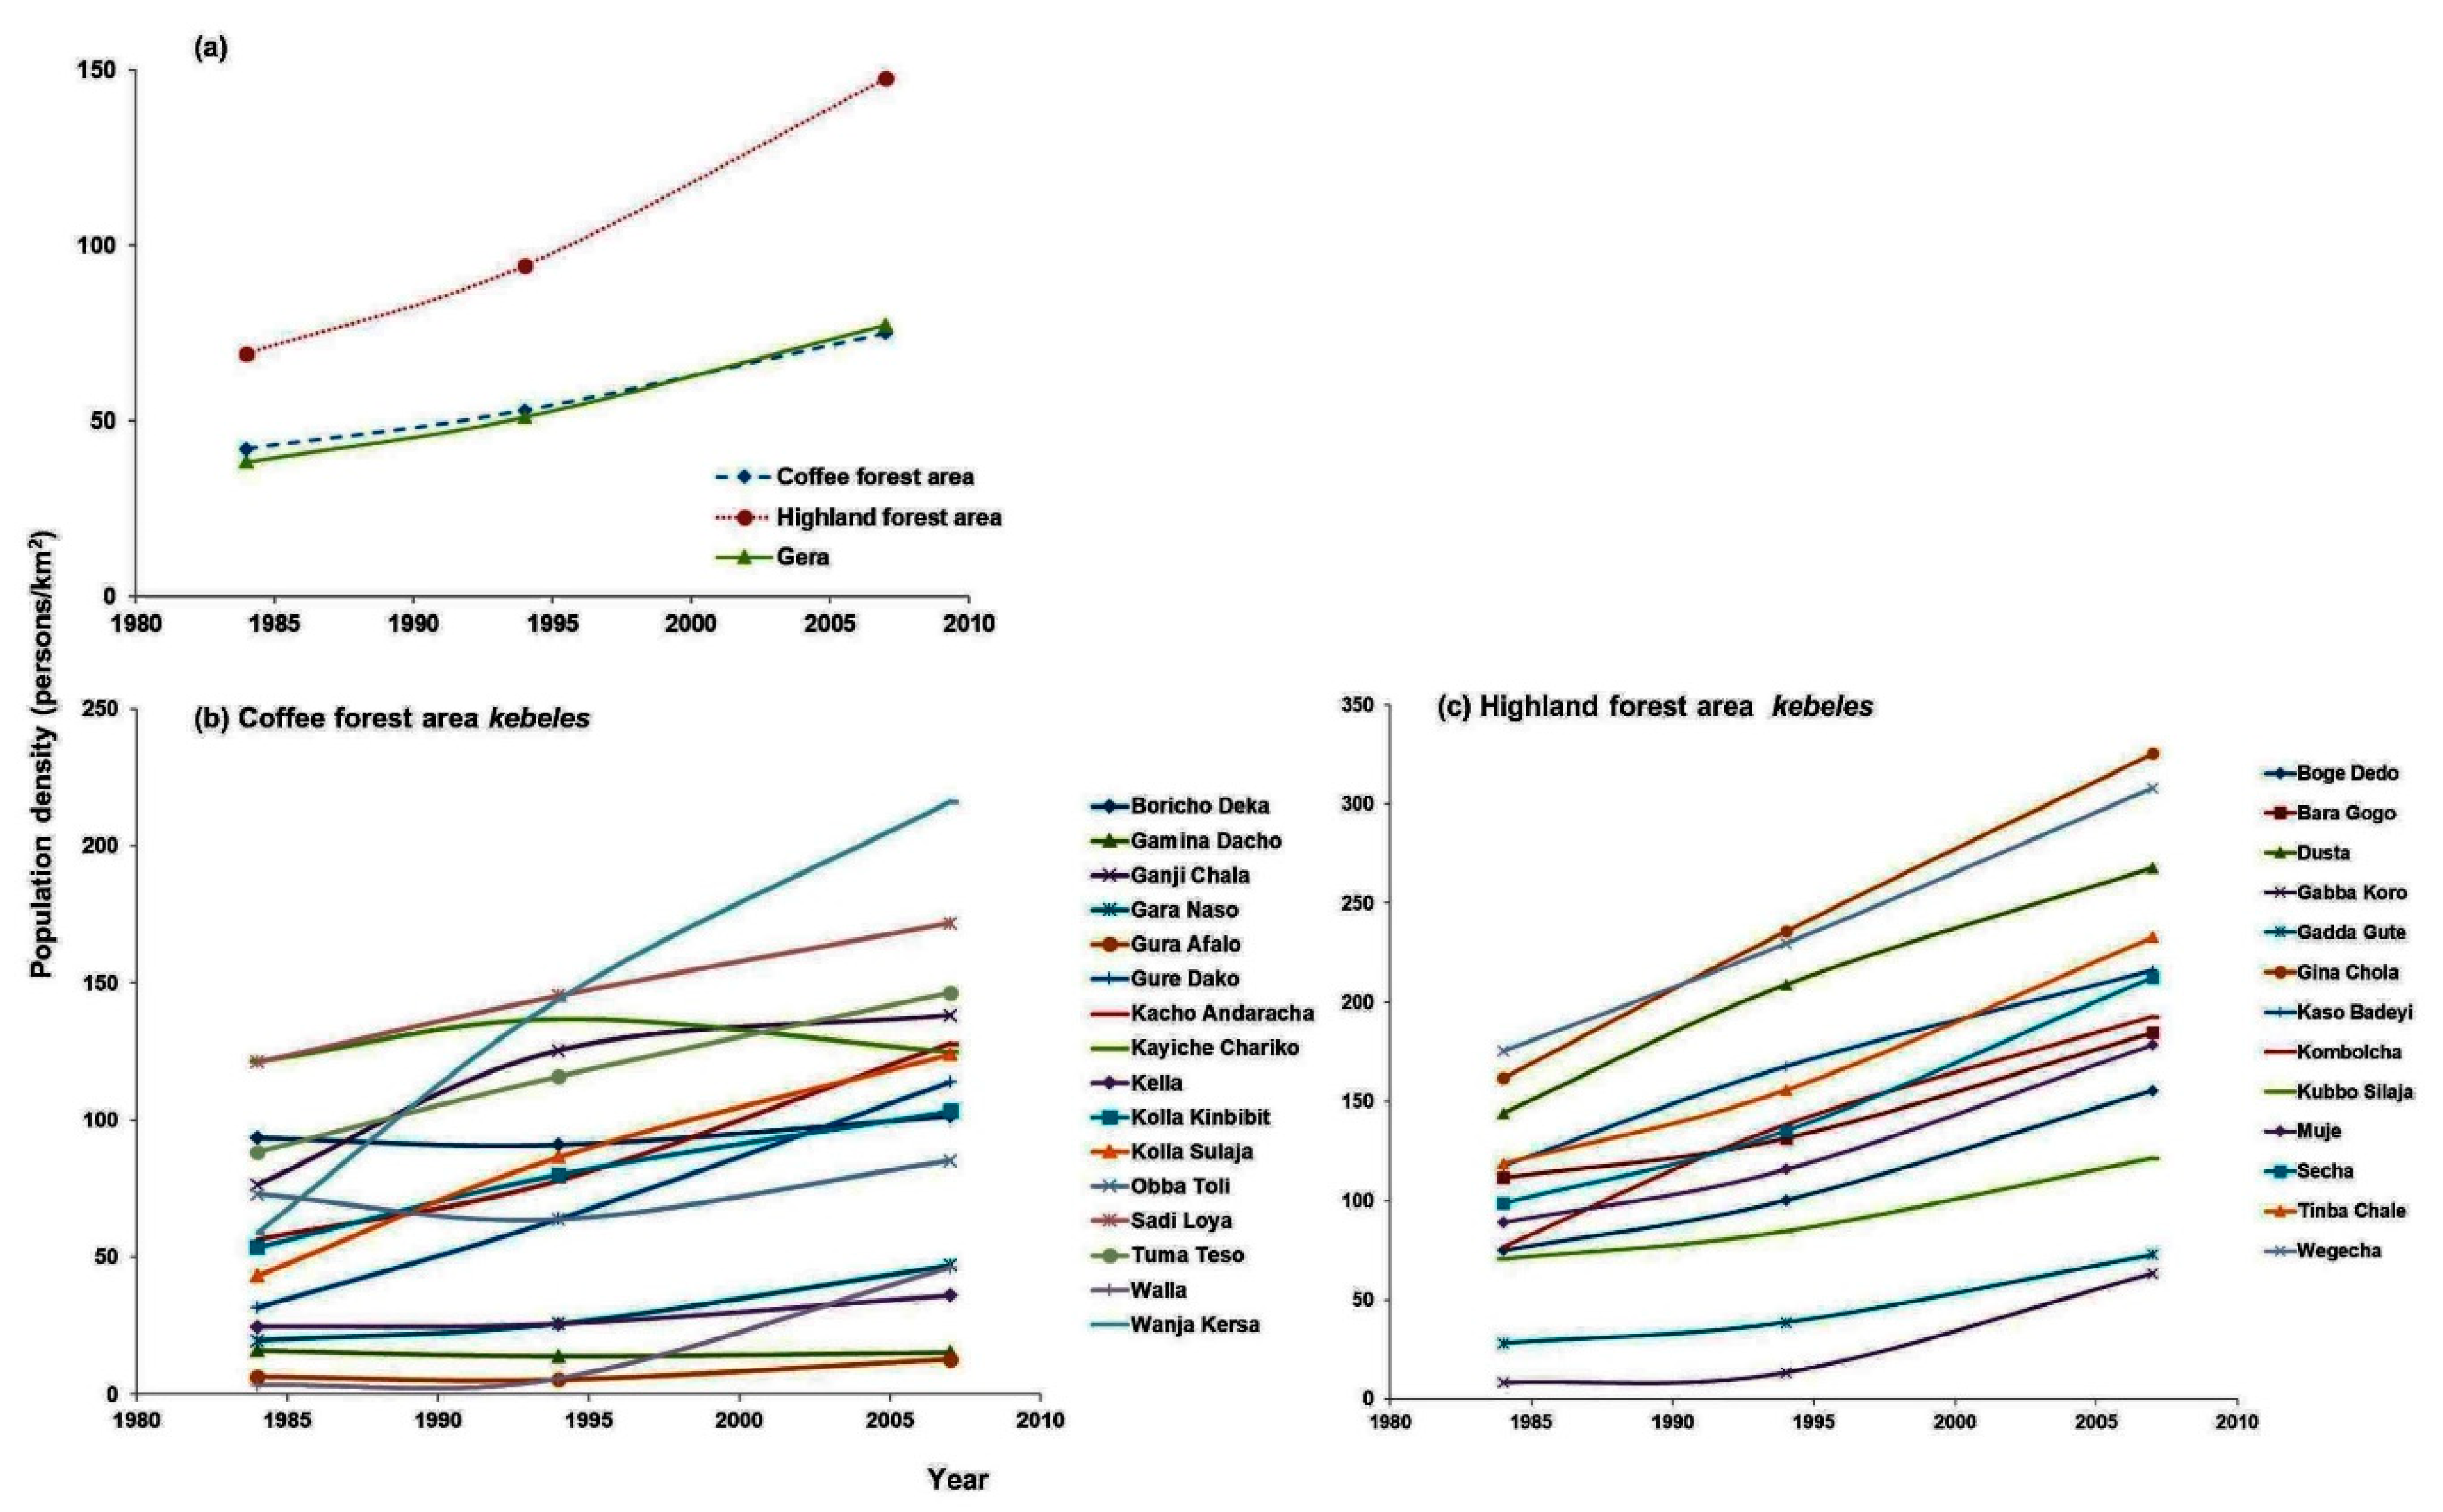
Gera’s population density increased from 38 persons/km2 in 1984 to 77 persons/km2 in 2007 (Figure A2a). In all highland area kebeles, and in many coffee area kebeles, human population densities increased during the 1984–2007 period (Figure A2b,c). In some coffee area kebeles, the population densities remained low, e.g., less than 50 persons/km2 in Gamina Dacho, Gara Naso, Gura Afalo, Kella, and Walla, and stable, e.g., in Kayiche Chariko and Boricha Deka (Figure A2b). The estimated population densities in 1985, 1995, 2001, and 2010 were significantly lower in coffee area kebeles compared to highland area kebeles (Table 2; p-values 0.041, 0.012, 0.005, and 0.002, respectively). Highland area kebeles with higher population density had lower forest cover or area changes per year during 1973–2010 and the four sub-periods from 1973 to 2010 (Figure 3a–e; p-values 0.003, 0.020, <0.001, 0.015, and p = 0.023, respectively). Coffee area kebeles with higher population density also had lower forest cover area changes per year during 2001–2010 (Figure 3e; p = 0.002). Highland area kebeles with higher population densities had higher relative rate of forest cover changes during 1973–1985 (Figure 3g; p = 0.025), and a tendency to have lower rates of forest cover changes during 2001–2010 (Figure 3j; p = 0.067). Coffee area kebeles with higher population density also had higher relative rate of forest cover change during 1973–2010 (Figure 3f; p = 0.004).
3.3. Slopes and Forest Cover Changes
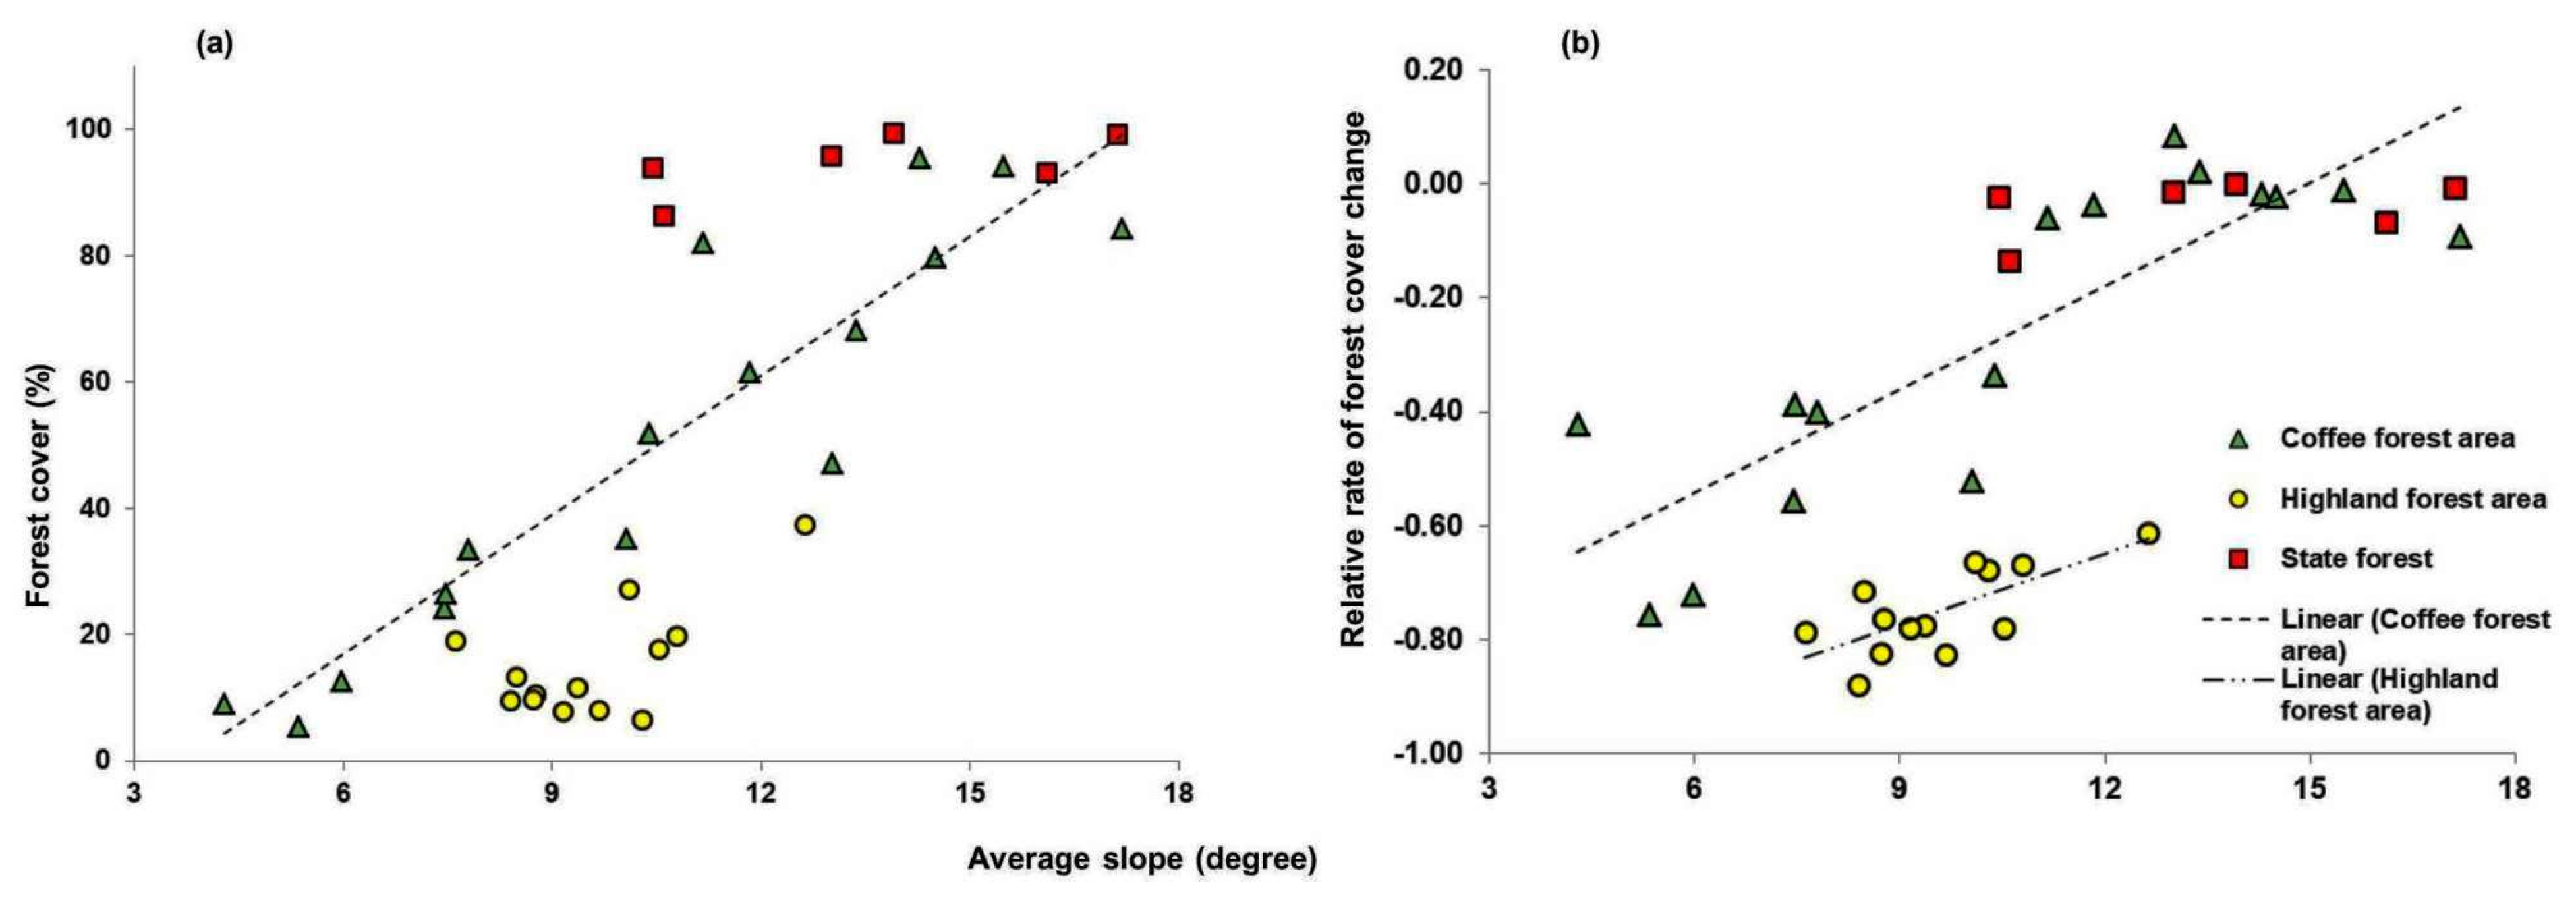
On average, state forest sites had somewhat steeper mean slopes (13.5 degrees) than the coffee and highland area kebeles (10.6 and 9.6 degrees for coffee and highland areas, respectively, significant between state forest and highland areas, p = 0.001). When all kebeles and state forest sites were pooled there was a significant higher percentage of forest cover (2010 data) in areas with steep slopes (p < 0.001). However, when analyzed separately, only coffee area kebeles displayed such a relationship (p < 0.001), while state forest sites and highland area kebeles consistently had high and low forest cover irrespective of slope, respectively (Figure 4a). The relative change in forest cover during 1973–2010 was higher in kebeles with lower mean slopes, both for coffee (Figure 4b, p < 0.001) and highland areas (p = 0.02).
3.4. State View, Ownership, and Management of Forest
Prior to 1974, the Ethiopian government explicitly conceived forests as lafa xafii that had to be converted to and developed as agricultural land (Figure 5a). The Emperors, who claimed the ownership of forestland, sold this land, and offered it to the nobilities, churches, and soldiers as gifts for their services [48,49]. According to the farmers we interviewed, the forestland—being perceived as lafa xafii—was sold at low prices, which attracted many people to Gera because it gave them an opportunity to own agricultural land (see also Section 3.5).
State forest ownership and coercive management during the socialist government, commonly known as Derg, period (1974–1991) also failed to mitigate forest conversion (Figure 5a). A lack of logistic capacity and manpower to coercively protect forest from being cleared reduced the effect of protection efforts in many places. During the political and institutional gap and instability of the government change in the early 1990s, large parts of community forest areas were cleared and claimed by farmers as agricultural land. Later, these farmers received certificates of ownership of these lands from the district. The transfer of forestland to investors for coffee production by the post-1991 government also contributed to forest cover change in some places. The 2010 satellite image analysis, along with the interview data, confirmed a decline in forest cover bordering the northeast of Ganji Challa kebele (Figure 1), which is one of the areas where private coffee-producing companies have been active in recent years.
Since 2003, a participatory forest management (PFM) program has been in place in Gera, guaranteeing farmers the right to access non-timber forest products. OFWE-JBO oversees the protection and development of the forest in Gera on behalf of the government. According to our informants, the protection offered by OFWE-JBO and the PFM program has contributed to the rehabilitation of forest and a reduction in deforestation in some areas (see also [50]). However, the informants also confirmed that major deforestation has taken place in several other areas where PFM has been scaled up lately, especially in remote highland area kebeles.
3.5. Immigration and Resettlement
Over the past half century, there have been flows of immigrants to Gera from other parts of Ethiopia. The perception that there were ample amounts of fertile land available in the southwest has been a major reason attracting immigrants from land-scarce and/or drought- and famine-prone parts of the country. According to our informants, large numbers of people from both distant areas and nearby districts, such as Sigimo, Setema, and Gomma, migrated to Gera before the mid-1970s due to the availability of cheap forestland that could be bought from the Emperor or his ancillaries (mainly absentee landlords). Such immigration contributed to forest conversion during the earlier period (1958–1974) in both coffee and highland areas. According to the local residents interviewed in Muje, this immigration was the major cause for the forest cover decline in the area during 1958–1973 (Table A3).
“My father came from Ilu Abbaa Booraa [a neighboring zone] to Gera district, and bought forestland from a Koro [a local governor] of the Muje area during Haile Selassie. At that time, there were only a few households living in the area, and if you needed to borrow a fire from a neighbor, you had to travel a long way to your nearest neighbor’s house. There were no footpaths, not even for visiting neighbors, and you had to make your own paths in the forest.” (50-year-old man from Muje, interviewed on 16 May 2011)
“I came from Sigimo district when I was around seven years old [c. 1954]. At that time, there were only about thirty-five households living in Muje. Later on, as the relatives of early settlers started to slowly arrive, the number of residents began to increase.” (64-year-old man from Muje, interviewed on 17 May 2011)
The Derg’s national “land to the tillers” proclamation in 1975, which offered any person interested in engaging in agriculture the possibility of being allocated up to 10 ha of agricultural land [51], initiated more chain migration from many neighboring districts to Gera. Migrants also arrived in Gera around the mid-1970s from north and central Ethiopia, settling both in some of the coffee area kebeles (e.g., Tuma Teso and Sadi Loya) and in highland area kebeles (e.g., Boge Dedo). The people interviewed in Gera had a common understanding that immigration had contributed to increasing the population size and pressure on the forests through more land conversions to agriculture as well as forest degradation from increased demand for firewood, timber, and wood for construction. According to our informants, even though the rate of in-migration to Gera had recently decreased significantly, the sharp increase in population numbers in Walla (2007) was, for example, attributed to immigration (Table A1). Notably, this increase was also correlated with the highest forest cover loss per year (29 ha) during 2001–2010 compared to all the other coffee area kebeles (Table A2).
Finally, another policy intervention intended to stimulate development in the region was a state-led resettlement program conducted in 1984/5 by the Derg in six coffee area kebeles: Ganji Chala, Gara Naso, Kacho Andaracha, Kolla Kinbibit, Kolla Sulaja, and Wanja Kersa. According to our informants, all those who were resettled in Gara Naso had left the area shortly after being resettled, but the resettlement program, particularly in Kolla Kinbibit, had contributed to higher forest conversions during 1985–1995 (Table A2).
3.6. Altitudinal Migration and Deforestation Displacement: The Role of Coffee Production and Wild Mammal Pests
Farmers in Gera frequently used to change their places of residence for reasons including the search for more or better land, occurrence of disease or death of family members or neighbors, disagreement with landlords, and problems with wild mammal pests. Land, especially forestland, which could be converted to agricultural land, was in the past also readily available in several new locations. Until very recently, internal migration, i.e., migration within Gera district from one kebele to another, due to severe pest problems had been a dominant push factor. According to our informants, ‘altitudinal migration’, i.e., population movements from coffee areas to kebeles in highland areas, that reduced or stabilized population growth (Figure A2b, e.g., Gamina Dacho, Gura Afalo, and Kayiche Chariko) contributed to forest rehabilitation or lower forest cover decline per year in some coffee area kebeles (Table A2, e.g., Gamina Dacho and Gura Afalo). Conversely, this pest-related migration contributed to increasing population numbers and the relatively much more rapid forest conversions taking place in highland area kebeles (Table A2; Table A4). Migrants from coffee area kebeles were also, in most cases, able to retain their use rights to forests for coffee and honey production, which meant a reduced economic risk, as they were migrating out of coffee-growing altitudes.
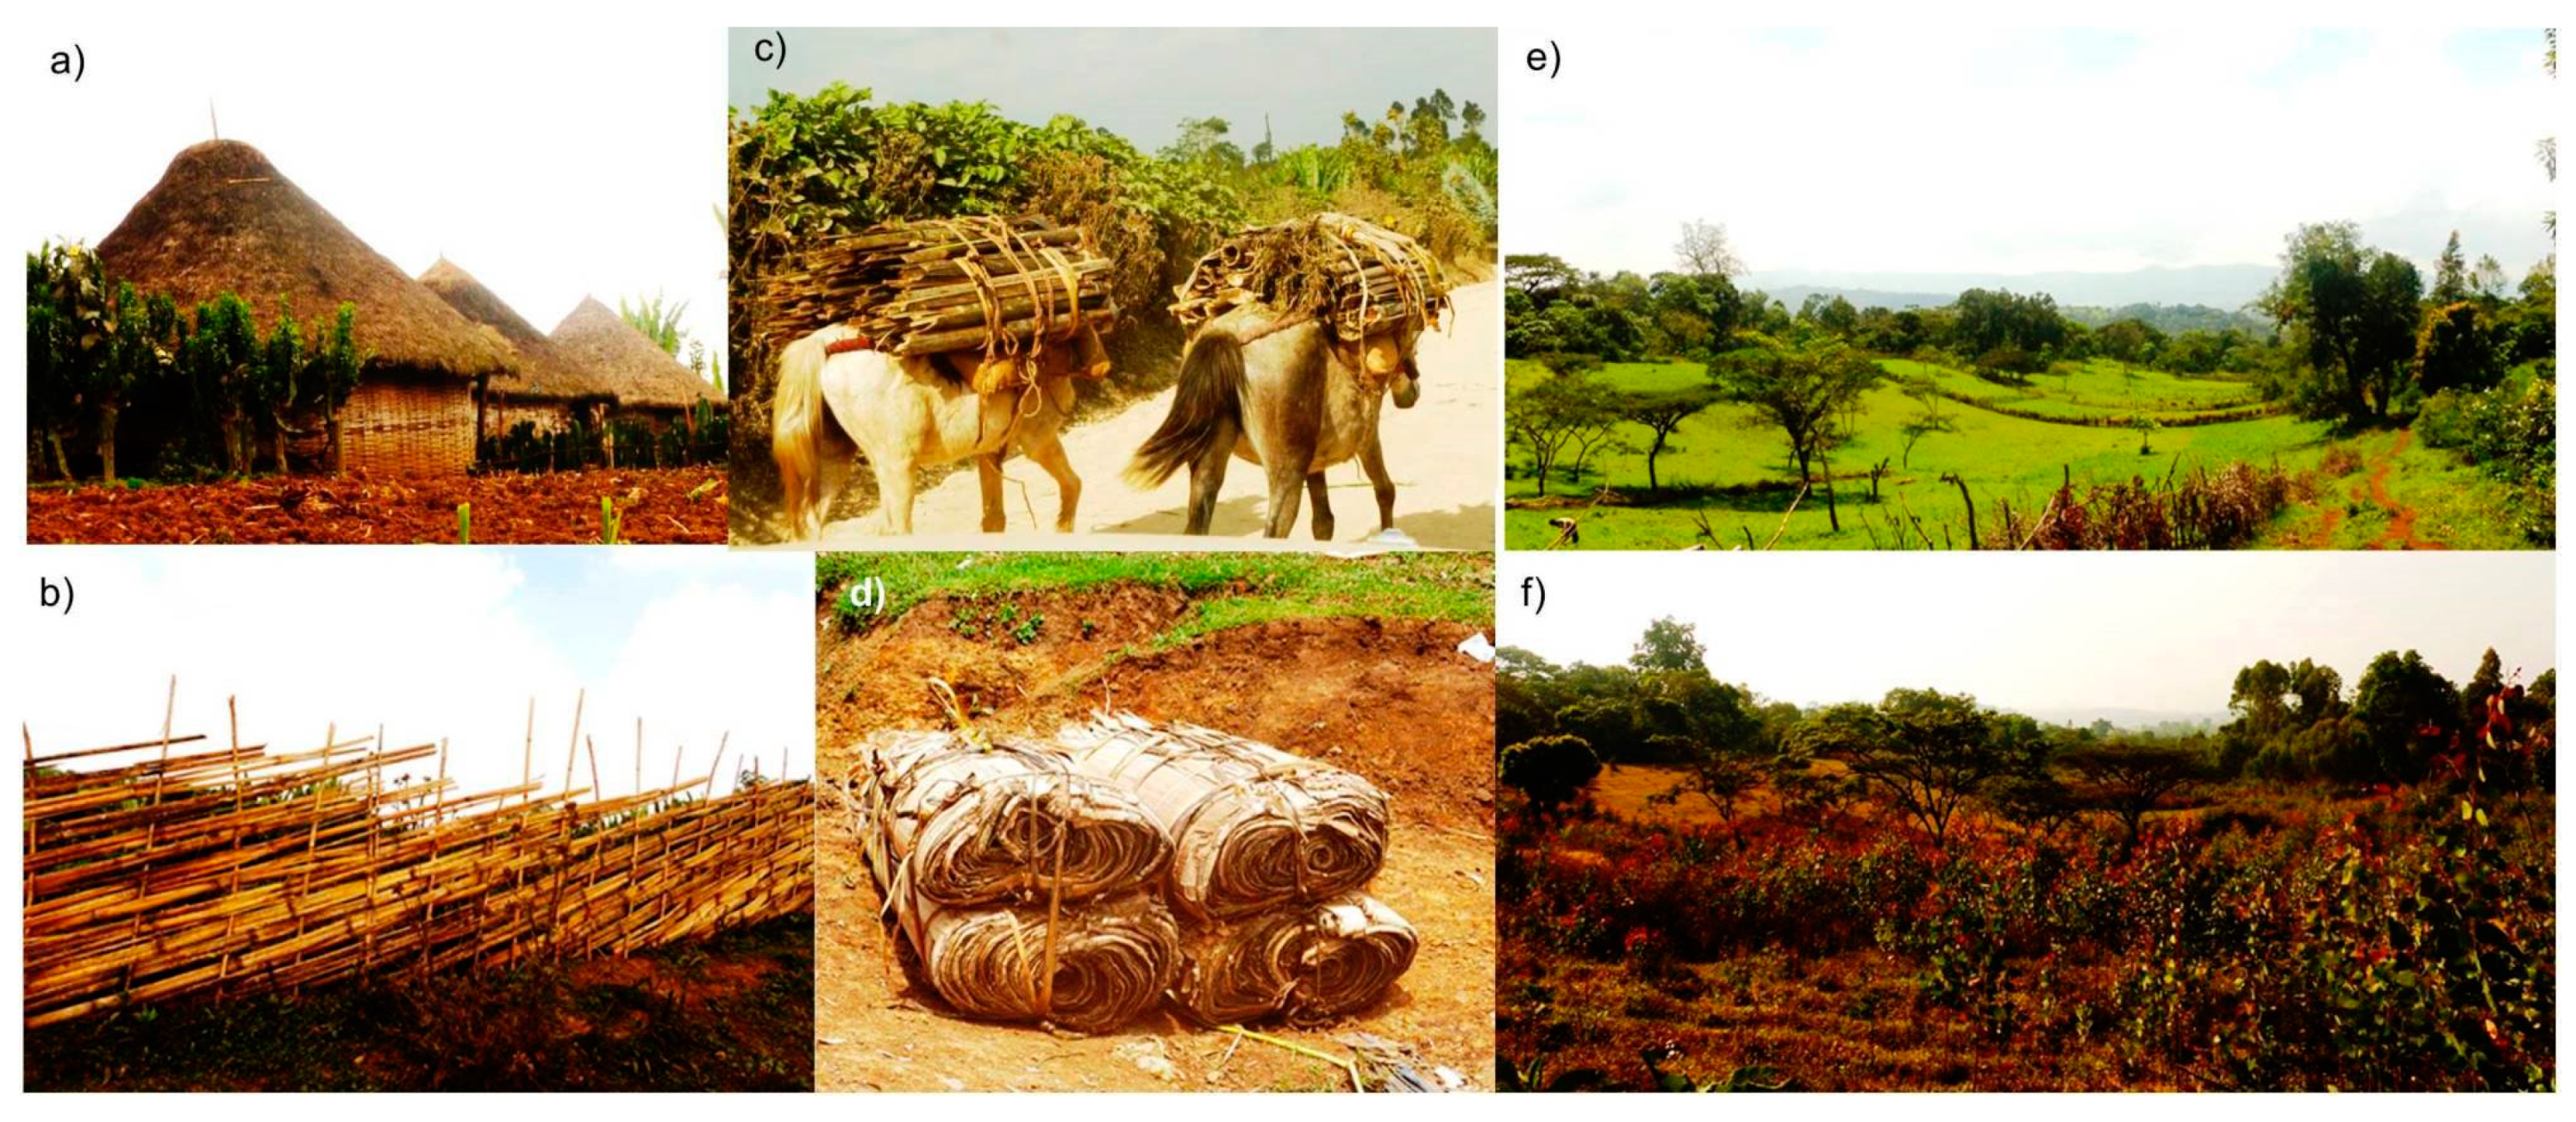
The highest forest cover decrease in recent years in highland areas, especially Gabba Koro and Gadda Gute kebeles (Table A2), was also linked to the population increase from internal migration (Figure A2c), but in this case from both coffee and highland area kebeles. For example, from Tinba Challe alone, “about one hundred households migrated to Gabba Koro” (45–year-old man from Chira town, interviewed on 26 October 2013). As the newly converted land in this kebele generated good harvests for immigrants, many people in Gera started to say: “adeemsa duwwaa biyya alaarra Gabbaa dhaquu wayya”, meaning “it is better to migrate to Gabba Koro than to other countries, as it offers the possibility to make a full living”. The causes of deforestation in this area were, however, related not only to the in-migration and consequent land conversion but also to the economic value of bamboo (Arundinaria alpina) (Figure 6a–d). According to our local informants, this was also stimulated by the drying-up of the bamboo forest that was related to ‘mass flowering’ of bamboo in Gabba Koro, which contributed to speeding up deforestation and stimulating further in-migration (cf. [52]).
On the other hand, in addition to the need for trees as shade for coffee production, increased domestic and market demand for wood products contributed to a recent expansion of tree planting by farmers, including woodlots, mainly eucalyptus, during 2001–2010 (Figure 5a). For example, the two coffee area kebeles Sadi Loya and Wanja Kersa gained forest cover from 1995 to 2010 (Table A2), partly as an effect of eucalyptus planting. Recently established woodlots of varying size were a common sight along the road from Chira town towards Sadi-Loya and across most of the landscapes visited during our fieldwork (Figure 6e,f).
3.7. Logging Quotas
For about eight years between 1986 and 1993, the state offered logging quotas to a private enterprise commonly known as Almaz-Goshu and a state-owned enterprise called Jimma Branch Ethiopian Compensato Factory (hereafter private and state enterprises, respectively). According to the interviewed farmers and the staff at OFWE-JBO and Gera district Agricultural and Rural Development Office, the logging quotas contributed to forest conversions during 1985–1995 in many highland area kebeles, e.g., Muje and Kubbo Silaja (Table A2). To transport the logs, dry weather tracks for vehicles were opened to most of the kebeles where logging quotas were obtained. Logs were transported to Chira town, where they were stored, and later transported to the neighboring towns of Agaro and Jimma and to Addis Ababa.
“The main footpath coming from Chira town and branching into two [to northeast and northwest] in Muje was the dry-weather road that the enterprises used to transport the logs. The path branching towards the northeast goes to Kubbo Silaja while the other branch leads to Kaso Badeyi and other parts of Muje.” (67-year-old man from Muje, interviewed on 13 May 2011)
Seasonal workers were brought from elsewhere (mainly central Ethiopia), and camped in the area to cut trees and prepare the logs. Each year, logs were transported to Chira town by about five lorries, with two or three trips per day during the dry season (from November to May). The farmers reported that after the companies logged the forest in Kaso Badeyi, it became possible to see the neighboring Sigimo district from Gera. The logging quotas extracted valuable timber tree species, including qararoo (Pouteria adolfi-friedericii) and wandabiyoo (Apodytes dimidiata). Migrants and local people settled on and cultivated the forestlands from which these trees had been removed, leaving no room for forest regeneration. After 1991, no more logging quotas were offered to the state enterprise, but the private enterprise received quotas for two more years under the new government that took power in 1991. The quota system was interrupted, and eventually ended, after a conflict erupted between the private enterprise and farmers.
4. Discussion
With the easy access to high-quality remote sensing products, possibilities for studying spatial and temporal variation in land-use/cover, for example, forest cover, across landscapes are remarkable. However, there is a risk that simplified conclusions are drawn from studies of patterns if the underlying processes and mechanisms of change are also not thoroughly investigated [12,17,18]. Here, we demonstrate with a rich data of both remote sensing, interviews, population censuses, and slopes the mechanisms that have been driving the pattern of forest cover in a southwestern Ethiopian mosaic landscape. We show that the spatial variability in forest cover and loss is predominantly an effect of the ecology of a major smallholder cash crop, coffee, which grows under shade trees at a specific altitudinal zone. This feature caused both the retention of forest at lower altitudes and deforestation in frontier landscapes at higher altitudes. Our study also shows how this pattern of deforestation and forest maintenance is interlinked with and reinforced by local migration processes and economic relations, augmented by an overall population growth, which reach across different altitudinal or agroecological zones. Hence, applying population growth as a simple driver of deforestation would be misleading. We also show that the temporal variation of increasing or slowing deforestation is largely driven by the impact of rural and national development policies (e.g., priority for food crop production, resettlement programs, commercialization of coffee and logging quotas), where deforestation has been both an intended and unintended consequence. An interesting observation is that deforestation has been an outcome of both socialist and market-oriented policies, while only a period of heightened civil war and hiatus of enforced government policy were associated with a slower rate of deforestation. Below, we discuss these findings and their implications for sustainable forest landscape management in relation to previous studies of deforestation and agriculture-forest mosaics dynamics and management in tropical countries.
4.1. Crop Ecology and Migration Have Shaped Spatial Variations of Forest Cover Change across Different Altitudinal Zones
Increased conversions of forests to agricultural land are often observed when such conversions promise more economic returns [12,23] and/or due to growing demand for agricultural land [37,39,53]. Our finding that the rates of forest cover changes were lower in coffee areas is in agreement with studies that have demonstrated forest conversions or maintenance based on economic returns. Coffee is Ethiopia’s dominant export commodity and a key cash income source to smallholders in the shade coffee-growing regions. Smallholders’ need to maintain tree species suitable as shade for coffee production has been a strong conserving factor that slowed forest cover decline as also documented in previous studies [35,54]. Our finding that the parts of coffee areas with higher population densities had higher relative rates of forest cover change (Figure 3f) shows how smallholders also seek to meet their need for agricultural land, mainly for annual crop production, by converting forest to cropland. Moreover, ‘livelihood diversification’, in terms of producing a number of different crop types as a strategy to maintain food security during market price fluctuations (e.g., lower price for cash crops (cf. [55]) or failure of crop production due to recurrent drought, is common in smallholder-dominated landscapes [56]. In this regard, a recent study on rural livelihoods and food security in the southwest has demonstrated that households who engaged in the production of several food and cash crops, including coffee, were relatively food secure [57]. Whereas, our findings that (1) rates of forest cover changes and (2) population densities were significantly higher in highland areas compared to coffee areas (Table 2) show how both the economic-returns arising from forestland conversions to agricultural land and the growing demand for agricultural land have contributed to massive forestland clearances. The lack of the possibility to engage in shade coffee production in highland areas has indeed implied large-scale forest land conversions to agricultural land for food crop production by smallholders. Moreover, the finding that parts of the highland areas with lower population densities had higher rates of forest cover decline (Figure 3a–e) implies that people moved to and converted forests in relatively low population density areas and more likely at forest edges.
Coffee and non-coffee-growing regions in southwest Ethiopia are interconnected through altitudinal migrations and spatial differentiation of agricultural production. Although it is important to study the effects of such connections on forest landscape dynamics, they have been largely unaddressed in studies of forest cover changes. In our case, we found that many farmers who were maintaining forest for shade coffee and honey production in coffee areas were also involved in internal migration and forest conversions in highland areas. This shows that forest conservation in the coffee areas implied forest conversion in the highland areas. A growing number of studies have shown cases of deforestation displacement, because of strict conservation in other places and countries (e.g., [15,58]). However, the deforestation displacement in Gera is unique in the sense that it has been largely driven by local farmers’ decisions and practices to use forest ecosystem services across the landscape (i.e., shade coffee production) and to avoid related ‘disservices’ (e.g., wild mammal pests) [59]. In the forest-dominated Gera landscape, wild mammal pests pose a challenge to agricultural production [60]. In addition to altitudinal migration, farmers usually welcomed the help of the immigrants in pushing the forest back [38], allowing them to produce cereals for subsistence.
The findings that the parts of coffee and highland areas with lower (gentle) mean slopes had higher relative rates of forest decline (Figure 4b) shows that smallholders have converted forest on cultivable slopes. This finding is consistent with other studies that have documented that uncultivable steeper slopes have sheltered the remaining primary forests, both in Ethiopia [39,54] and other tropical regions (e.g., [12,61]). In relation to state forest sites, our analysis shows no correlation between slopes and forest cover change. However, this lack of correlation between slopes and forest cover change is most likely a result of extremely low rates of forest cover changes in the state forest sites (Table 1; Figure 5d,g). Moreover, our observation that state forest sites were dominated by rugged terrain and that some of them are located furthest away from villages and cultivated lands, combined with our finding that the state forest sites have the highest (steeper) mean slopes, in particular compared to highland areas, highlight that these sites seem to be the least preferred for conversion to agricultural land. On the other hand, the Ethiopian constitution and forest law prohibit and criminalize the utilization and conversion of the state forests [62]. A state agency, i.e., OFWE-JBO, has also been attempting to conserve state forest as well as forest coffee areas, and there is indeed evidence for forest recovery during periods of strong law and/or bylaw enforcement, both in the southwest and other landscapes in Ethiopia [50,63]. Nevertheless, overall, the effect of state forest protection is uncertain as the relatively well-preserved forest cover in state forests could also be explained by the ruggedness of these areas, which make them largely unviable for cultivation. Even if we do not have concluding evidence to resolve this question, our observation highlights the importance of ruggedness to explain this pattern.
4.2. How Development Policies Have Shaped the Temporal Dynamics of Forest Cover Changes
State policy and political economy are observed to substantially shape forest cover changes in Ethiopia [64,65,66,67] and elsewhere [68,69,70]. Our study covered three government periods with varied political economy regimes: The pre-1974 feudal monarchy, the socialist government, and the post-1991 market-oriented with a large public sector government. Our finding that forest cover declined in Gera, both in coffee and highland areas, before the mid-1970s is not surprising, as the policies emanating from the political economy of the imperial government had prioritized agricultural production enhancement at the expense of forests [29,71]. Moreover, coffee berry disease came to the southwest in 1971 and forced farmers to abandon shade coffee production, particularly in central Gera [38]. It is likely that farmers converted some of the abandoned coffee land to agricultural land, which then explains, at least partly, the pre-1974 relatively higher forest cover decline in coffee areas (Table A3).
Our finding that a major deforestation occurred during 1973–1985 in both coffee and highland areas (Table 1) is notable. This is because the Derg government that was in power has generally been considered to have contributed to forestry development through, for example, afforestation and reforestation programs [72]. In Gera, the policies, and programs of the Derg’s “land to the tillers” proclamation in 1975, a resettlement program, and logging quotas were all found to have aggravated deforestation and stimulated the conversion of forests to agriculture. The “land to the tillers” proclamation attracted even more migration to many kebeles, which, in combination with internal migration to highland areas, seems to explain the positive correlation between population density and relative rate of forest cover change in highland areas during 1973–1985 (Figure 3g). Overall, the perception about the availability of land in southwest Ethiopia coupled with the possibility to obtain large tracts of land [51] motivated a large number of immigrants to this region, implying an increased demographic pressure and more forest conversions [37,39]. Gera also experienced increased conversions of forest to agricultural land due to the fixed price for coffee by the state and high food crop prices [38].
The finding that overall deforestation rates slowed down in both coffee and highland areas during 1985–1995 and 1995–2001 (Table 1) is most likely related to: (1) The heightened civil war in Ethiopia from the late 1980s until 1991, to which large numbers of working-age men from Gera and other parts of the country were forcibly recruited as soldiers; (2) the establishment of regions based on ethnicity after the war ended in 1991, which was perceived for some time as a hindrance to inter-region migrations; and (3) a drastic decrease in the possibility to formally acquire land after the change of government in 1991, which seems to have been an obstacle for immigrants and others to take up new land. The Ethiopian constitution entitles citizens the right to be allocated farmland, and regions are given the mandate to allocate land [62]. However, since 1991, land allocations have been rare. Despite the overall slowing down of deforestation during 1985–1995, we also found a higher level of deforestation in some highland area kebeles where the logging quotas were offered and in some coffee area kebeles where the resettlement program was executed. This higher level of deforestation in some coffee and highland areas further underscores the effect of policies and programs of the Derg government on forest dynamics. The contribution of logging and resettlement to tropical deforestation are widely documented in other landscapes in Ethiopia [39,73] and beyond [69,74].
Our finding that 2001–2010 was the second period of major forest cover decline in coffee and highland areas further highlights the strong relation between policies and forest cover dynamics. More specifically, this second major deforestation period overlaps with the transfer of forestland to private investors for coffee production and the implementation of a PFM in 2003 (Figure 5a). This deforestation seem to be driven by (1) ‘last-minute’ forest conversion during the establishment of the PFM [75], (2) forest conversions and/or intensive use by investors to establish coffee plantations, and (3) farmers who intensified their use of forestland for coffee production as a strategy to improve the security of their customary rights to land against future expropriations for investment [43]. This second major deforestation period, like the first major deforestation period (1973–1985), also occurred during the implementation of major policy and program related to development and forest. This similarity between the first and the second major deforestation periods shows how the policies of two vastly different government regimes, the socialist Derg rule and the post-1991 market-oriented government regime, both contributed to massive deforestation.
Our finding that during 2001–2010, some localities in coffee areas (e.g., Walla) and highland areas (Gabba Koro and Gadda Gute) had higher rates of forest cover decline (Table A2) while they had lower population densities (Figure A2) suggests a continuation of migration to places that offered the possibility of gaining access to land through informal arrangements [43]. Such informal arrangements were observed to be an important alternative after the possibility of obtaining land formally from the government became rare since the early 1990s.
For the most recent period, i.e., during 2001–2010, our finding of the absence of a difference in the forest area change per year across the Gera landscape (Table 2) suggests that there is a higher likelihood for forest cover decline in coffee areas as forest in highland areas dwindles, and by implication, an overall primary forest decline in Gera. That there is a growing pressure on the primary forests in the southwest is also supported by our finding that, for the state forest sites, the most substantial deforestation occurred during 2001–2010, followed by the 1973–1985 period, i.e., a reversed pattern compared to that of coffee and highland areas.
4.3. Early Signs of a Forest Transition?
Despite overall forest cover decline, Gera also witnessed localized forest cover gain (Table A2; Sadi Loya and Wanja Kersa) during 2001–2010, which is attributed to the woodlot establishment of eucalyptus trees (cf. [63]) in addition to tree management for shade coffee production. Domestic and market incentives for eucalyptus are major drivers for the expansion of eucalyptus tree planting [76]. These tree plantations, along with trees managed in the landscape for various purposes, including shade and fencing [59], could be sources of wood for farmers, which could ease the pressure on nearby forest for the same purpose and could also play a role in indigenous tree restoration efforts if used systematically [77]. Shaded and home garden coffee, and other agricultural land uses in southwest Ethiopia have been shown to support biodiversity, including higher epiphyte diversity, despite their limitations for native or forest specialist species conservation [78,79,80]. Elsewhere in the tropics, reforestation and afforestation by local people to meet their livelihood requirements and more importantly targeting to counter environmental problems, e.g., land degradation, are reported to have brought an overall transition from forest loss to gain, i.e., forest transition [20]. Hence, the expansion of planted and managed (retained) trees in Gera and tree cover gains in some areas might be early signs of a forest transition. Another factor that is likely to impact forest dynamics in the near future is intensified national and international interests in, and programs for, the governance of the southwest forests, for example, through REDD+ [81] and biosphere zoning (cf. [82]) for biodiversity conservation and climate change mitigation. REDD+ may, for instance, incentivize governments to recentralize forest governance [83], which may further marginalize poor communities [84], and lead to deforestation displacement [15].
5. Conclusions
Sustainably managed agriculture-forest mosaic landscapes support smallholders’ livelihood, and biodiversity conservation and climate change mitigation goals (cf. [85,86]). In this study, we investigated the spatial relations of ecological and social processes to point at how state policies, population density, migration dynamics, slopes, and the socio-economic values of ‘forest coffee’, as a main commercial crop, shaped the patterns of deforestation and forest maintenance in the Afromontane forest of southwest Ethiopia since the late 1950s. Our findings demonstrate a substantial spatial variation in deforestation rates that were driven mainly by altitudinal ranges of crops, coffee in particular, and human migration that involved moving to and converting relatively low population density areas and displaced deforestation to highland areas. Temporally, periods of major forest loss overlapped with the implementations of several development, land, and forest policies and programs, initiated by different government regimes, which demonstrates that the policies and programs created often unintended conditions for more forestland conversions with less opportunity for regeneration. We conclude that understanding the mechanisms of deforestation and forest maintenance simultaneously and their linkages is necessary for better biodiversity conservation and forest landscape management.
Author Contributions
Conceptualization, T.G.A., K.H. and L.B.; methodology, T.G.A., K.H. and L.B; software, T.G.A. and K.H.; validation, T.G.A., K.H. and L.B.; formal analysis, T.G.A., K.H. and L.B.; investigation, T.G.A.; data curation, T.G.A. and K.H.; writing—original draft preparation, T.G.A.; writing—review and editing, T.G.A., K.H. and L.B.; visualization, T.G.A., K.H. and L.B. All authors have read and agreed to the published version of the manuscript.
Funding
This research was funded by grants to Kristoffer Hylander from the Swedish International Development Cooperation Agency (contract number: SWE-2009-134) and the Swedish Research Council Formas (contract number: 229-2009-991). For the last fieldwork, Torsten Hägerstrands Fond was provided to Tola Gemechu Ango.
Acknowledgments
We acknowledge useful comments received from Mats Widgren on earlier version and advice received from Michael Meinild Nielsen on remote sensing. We also thank all our informants for their time and information, and our field assistants for their time and facilitation.
Conflicts of Interest
The authors declare no conflict of interest. The funders had no role in the design of the study; in the collection, analyses, or interpretation of data; in the writing of the manuscript, or in the decision to publish the results.
Appendix A. Satellite Images and Aerial Photos
Appendix A.1. Analysis of Satellite Images
We used the forest and non-forest cover datasets for 1973, 1985, 1995, 2001, and 2010 generated by Hylander et al. [35] from the analysis of free multispectral Landsat images obtained from http://www.usgs.gov/. From these datasets, we extracted and used the data covering Gera district. However, the land cover data of Hylander et al. [35] omitted approximately 5.6% of the district’s total area; specifically, most of Gabba Koro kebele (Figure 1). To produce a complete analysis of forest cover change for Gera district, we therefore analyzed various Landsat images for Gabba Koro kebele using a method similar to that of Hylander et al. [35]. Specifically, we used an ISODATA unsupervised classification of the Landsat images of 1973 (Landsat1-MSS, February 1), 1984 (Landsat5-TM, October 28), 1995 (Landsat5-TM, March 17), 2001 (Landsat7-ETM+, February 5), and 2011 (Landsat5-TM, January 8), which were set to return a maximum of 10 classes of pixels. We used six spectral bands (blue, green, red, near-infrared1, near-infrared2, and mid-infrared) in the Landsat 5 and 7 images, and all four spectral bands (green, red, near-infrared1, and near-infrared 2) in the Landsat 1 images. The resolution was 60 m for the Landsat 1 image and 30 m for the other images, and we used ArcMap (version 10.2) for the classification. We visually compared the classes from the unsupervised classification to the original images and repeated the classification until the pixel classes closely matched our visual assessments of the images. Next, we assigned the pixel classes as either forest or non-forest, based on spectral differences. Forest included both natural and planted forest, with and without coffee trees, while non-forest included all other land uses, such as cultivated, fallow, grazing, and settled land as well as permanent wetland.
About 15% of the 1995 image of Gabba Koro had cloud cover, so we removed the cloud-covered parts of the image before performing the ISODATA unsupervised classification. We visually estimated the forest (66%) and non-forest (33%) land cover classes for the cloud-covered part from nearby land cover types in the same image and from another Landsat image taken on 12 January 1995, then added the estimates for cloud-covered parts to the forest and non-forest classes for cloud-free parts. In addition, most of the image used by Hylander et al. [35], which was taken on 5 November 2010, had cloud cover, and hence we used a cloud-free image taken on 8 January 2011 instead. To fill the cloud-covered parts of the 1995 and 2010 Landsat images, Hylander et al. [35] used Landsat images taken on 12 January 1995 and 8 January 2011, respectively. We used the 1984 Landsat image instead of the 1985 image (Landsat5-TM, February 17) used by Hylander et al. [35].
We then mosaicked the satellite image data from Hylander et al. [35] and our added analysis into one image, and computed the extent of forest and non-forest cover for each kebele from this image using kebele boundaries obtained from the Central Statistical Agency of Ethiopia. Most of the forestland outside kebele boundaries was designated as separate “state forest” areas, but it should be noted that these forest areas may have included semi-managed forest coffee used by local farmers and partly offered to private companies for coffee production.
We used the zonal histogram in ArcMap’s spatial analyst tools to extract forest and non-forest areas for each kebele and classified each kebele as either coffee or highland areas, following the OFWE-JBO classification [41]. We then computed the percentages of forest cover in 1973, 1985, 1995, 2001, and 2010, and for each kebele, and used these to calculate the relative rate of forest and forest area changes per year for the periods 1973–1985, 1985–1995, 1995–2001, 2001–2010, and 1973–2010 for each kebele, the coffee areas, the highland areas, and the entire district.
Appendix A.2. Interpretation of Aerial Photos
In order to understand forest cover prior to the 1973 Landsat image, aerial photographs taken on 15 January 1958 were interpreted for one coffee area landscape and one highland area (Figure A1). Sadi-Wanja is a coffee area landscape of approximately 1700 ha located mostly within Sadi Loya and Wanja Kersa kebeles, while Muje is a highland area landscape of approximately 3000 ha located mostly within Muje kebele. Sadi-Wanja and Muje were selected for the aerial photo analysis because we had detailed field data for these areas, including oral history accounts. Sadi-Wanja, which is situated along a road that has been in place for over a half century, has attracted immigrant settlers and private coffee investments. Muje kebele has also attracted migrations from other kebeles within Gera and nearby districts, as well as logging enterprises.
We obtained aerial photographs at the scale of 1:50,000 as paper copies from the Ethiopian Mapping Agency. We scanned the photos at 600dpi in TIFF format, and geo-referenced them using coordinates from topographic maps (Ethiopian Mapping Agency, ETH 4 [DOS 450] 1978; USSR, ETH 4, 1986; Ethiopian Mapping Authority, ETH 2001) and GPS measurements in the field. Coordinates of rivers, roads, and wetland bends, which have been stable over time, were used for geo-referencing. We aligned the scanned aerial photos with the coordinates of control points using standard tools and procedures in ArcMap (https://desktop.arcgis.com/en/arcmap/10.3/manage-data/raster-and-images/fundamentals-for-georeferencing-a-raster-dataset.htm#GUID-CD1A1136-2E1B-4534-BB6E-113647C248AC). We visually interpreted the forest and non-forest land uses on the basis of tone, texture, and patterns, then identified and digitized them manually in ArcMap. For Muje and Sadi-Wanja separately, we converted the forest polygons to a raster image and then reclassified them as one class using ArcMap’s “Reclassify” spatial analyst tool. In a similar way, we converted the non-forest land uses to raster images and reclassified them as one class. For each of these two areas, we created a raster image with forest and non-forest classes using the “Raster calculator” function in the “Raster algebra” spatial analyst tool. We then resampled the raster images using nearest neighborhood resampling, with a 30-m resolution to match the resolution of the Landsat images. We computed forest and non-forest areas for 1958 for Muje and Sadi-Wanja, and compared these to the 1973 areas from the datasets of Hylander et al. [35] (see Table A3; Figure A1).
Appendix B. List of Kebeles (Kebele is the Lowest Administrative Unit) and the Total Number of Residents, Forest Cover and Patterns of Forest Cover Change since 1958 in Gera District, Southwest Ethiopia

Table A1.
List of old kebeles merged to match the kebeles of the 2007 population census and their population numbers. †
Table A1.
List of old kebeles merged to match the kebeles of the 2007 population census and their population numbers. †
| S.N. | List of Kebeles Merged into One ‡ | Total Number of Residents (Population) | ||||
|---|---|---|---|---|---|---|
| 2007 § | 1994 | 1984 | 1984 | 1994 | 2007 | |
| 1 | Bara Gogo | Bera Gogo; Bera Bore | Bora Gogo; Bora Tore | 2112 | 2490 | 3496 |
| 2 | Boge Dedo | Bera Dedo; Bera Boge | Bora Daye;Bora Bage | 2011 | 2687 | 4172 |
| 3 | Boricho Deka | Deka; Borcho Gebeta | Deka; Borcho Gubuta | 3226 | 3140 | 3495 |
| 4 | Chira town | Chera town | Chera Kebele 001 | 1260 | 2390 | 4746 |
| 5 | Dusta | Dusta; Dusta town | Dusta | 3287 | 4762 | 6107 |
| 6 | Gabba Koro | Gabba Koro | Koro Guba | 776 | 1260 | 5992 |
| 7 | Gadda Gute | Gute; Geda Keshemari | Gote; Gudaba Shemeri | 1552 | 2129 | 4017 |
| 8 | Gamina Dacho | Gimina; Dacho Laki | Gumina; Dacho Bake | 937 | 818 | 897 |
| 9 | Ganji Chala | Challa; Gure Genjo; Werwori | Chala; Gore Guneji; Werware | 1411 | 2317 | 2554 |
| 11 | Gara Naso | Naso Abo; Gera | Naso Abo; Gera | 751 | 983 | 1797 |
| 10 | Gina Chola | Gina Chola | Gina | 1923 | 2802 | 3868 |
| 12 | Gura Afalo | Ofalo; Gura | Afalo; Gura | 557 | 464 | 1087 |
| 13 | Gure Dako | Dako; Gure Kesso | Dako; Gorebesa | 880 | 1774 | 3153 |
| 14 | Kacho Andaracha | Kacho Tula; Anderacha | Anderacha; Abagero Abagela | 801 | 1108 | 1818 |
| 15 | Kaso Badeyi | Keso Bedeye | Bese Bedaye | 1643 | 2343 | 3022 |
| 16 | Kayiche Chariko | Keychesiso; Cheriko town | Keyche Sisa | 2149 | 2420 | 2209 |
| 17 | Kella | Keala; Choko Arare | Kela Arero | 1267 | 1320 | 1861 |
| 18 | Kolla Kinibibit | Kola Guncha; Kenbibit; Kola Bulcha | Kola Goncha; Kembibet; Kola Bulcha | 3157 | 4711 | 6067 |
| 19 | Kolla Sulaja | Kola Sulajie | Kola Sulagna | 891 | 1782 | 2553 |
| 20 | Kombolcha | Kombolcha | Kombolcha | 1322 | 2383 | 3323 |
| 21 | Kubbo Silaja | Kobo kocha; Selaja | Kobo kocha; Welaja | 3271 | 3916 | 5612 |
| 22 | Muje | Muje | Muje | 2693 | 3504 | 5405 |
| 23 | Obba Toli | Obba Wegemi; Toli Dembela | Abawegemi; Delo Dowkel | 4316 | 3775 | 5037 |
| 25 | Sadi Loya | Sedi Chawra, Loyi Uikro | Sedi Chawra; Loye Fakero | 2452 | 2941 | 3478 |
| 24 | Secha | Secha | Secha | 2202 | 3017 | 4746 |
| 26 | Tinba Chale | Tenba Chele | Timba Chole | 2408 | 3162 | 4728 |
| 27 | Tuma Teso | Teso Ture; Tumamaye | Teso Ture; Tumamaye | 3507 | 4600 | 5812 |
| 28 | Walla | Wala | Wola | 334 | 577 | 4564 |
| 29 | Wanja Kersa | Wanja Kersa | Telaja Kersa | 1006 | 2462 | 3695 |
| 30 | Wegecha | Wegecha | Wgecha | 1757 | 2300 | 3084 |
†: Kebele names and their population numbers were obtained from OPHCC [45] (pp. 82–83), CSA [44] (pp. 29, 88–89), and CSA [46] (pp. 9, 44–45) publications. ‡: Key informants were used to identify which kebeles were merged into one in the 2007 population census. The way some kebele names were spelled in the 1984 and 1994 publications (bold) posed an added challenge in matching them with the list of kebele names from key informants. One critical problem was that two kebeles mentioned by the key informants and also present in the 1994 census were written with different names in the 1984 census (see S.N. 14 and 23, columns 1994 and 1984, underline). This was most likely due to a serious typing error, as a typing error of the total population of one kebele was also encountered and fixed; specifically, for Bora Daye (S.N. 2, 1984 column; OPHCC, [45] (pp. 82–83)), the total population number was wrongly reported as the female population number. The mistake was traced by examining discrepancies between the sum of the total female, male, and district population numbers. Likewise, the matching of the abovementioned two kebeles (S.N. 14 and 23, columns 1994 and 1984, underline) was achieved by comparing the 1994 and 1984 population numbers of the two kebeles with those of the 2007 total population of Kacho Andaracha and Obba Toli. The population of Abagero Abagela (641) in 1984 were evaluated as a “better” expected match to that of Kacho Tula (930) in 1994, whereas that of Delo Dowkel (3023) was a match to Toli Dembela (2864) ([45] (pp. 82–83), [44] (pp. 88–89)). In addition, some kebeles in the 1994 census were split (see column 1994, italic). Overall, the identification of the kebeles merged into one was a success. The 1984 and 1994 kebele population numbers offered valuable historical information to this study. §: The spellings of kebele names in the 2007 CSA publication [46] have been modified in this table and article to better match how these names are locally spelled.
Table A2.
Forest cover and patterns of forest cover changes in kebeles located in highland and coffee forest areas in Gera from 1973 to 2010.
Table A2.
Forest cover and patterns of forest cover changes in kebeles located in highland and coffee forest areas in Gera from 1973 to 2010.
| Names | Total Area (ha) | Percentages of Forest Cover | Annual Forest Cover Change (ha) † | Relative Forest Cover Change (rate) ‡ | ||||||||||||
|---|---|---|---|---|---|---|---|---|---|---|---|---|---|---|---|---|
| 1973 | 1985 | 1995 | 2001 | 2010 | 1973–1985 | 1985–1995 | 1995–2001 | 2001–2010 | 1973–2010 | 1973–1985 | 1985–1995 | 1995–2001 | 2001–2010 | 1973–2010 | ||
| Forest coffee area (coffee areas) | ||||||||||||||||
| Boricho Deka | 3447.6 | 66.8 | 66.1 | 73.2 | 72.4 | 68.2 | −2.0 | 24.4 | −4.7 | −15.9 | 1.3 | −0.01 | 0.107 | −0.011 | −0.057 | 0.021 |
| Chira town | 500.8 | 31.6 | 17 | 5.5 | 6.6 | 9 | −6.2 | 5.7 | 0.9 | 1.3 | −3.1 | −0.465 | −0.671 | 0.179 | 0.364 | −0.717 |
| Gamina Dacho | 5828.7 | 95.4 | 94.2 | 94 | 94.5 | 94.3 | −6.0 | −1.3 | 4.9 | −0.8 | −1.7 | −0.013 | −0.002 | 0.005 | −0.001 | −0.011 |
| Ganji Chala | 1846.2 | 54.6 | 40.9 | 27.2 | 24.6 | 24.2 | −21.2 | −25.2 | −8.1 | −0.7 | −15.2 | −0.252 | −0.334 | −0.097 | −0.015 | −0.557 |
| Gara Naso | 3811.6 | 87.2 | 85.8 | 85.2 | 84.1 | 82 | −4.7 | −2.1 | −7.1 | −8.9 | −5.4 | −0.017 | −0.006 | −0.013 | −0.025 | −0.06 |
| Gura Afalo | 8560.4 | 97.5 | 97.3 | 97.2 | 97.8 | 95.6 | −1.0 | −1.1 | 8.1 | −20.7 | −4.3 | −0.001 | −0.001 | 0.006 | −0.022 | −0.019 |
| Gure Dako | 2767.4 | 78.4 | 74 | 64 | 58.3 | 52 | −10.1 | −27.6 | −26.3 | −19.5 | −19.7 | −0.056 | −0.135 | −0.089 | −0.108 | −0.336 |
| Kacho Andaracha | 1420.7 | 15.7 | 7.8 | 6.9 | 8.5 | 9 | −9.3 | −1.4 | 3.8 | 0.8 | −2.6 | −0.5 | −0.126 | 0.237 | 0.067 | −0.423 |
| Kayiche Chariko | 1768.5 | 43.5 | 45.4 | 49.4 | 47.6 | 47.1 | 2.8 | 7.1 | −5.3 | −1 | 1.7 | 0.044 | 0.088 | −0.037 | −0.011 | 0.083 |
| Kella | 5137 | 92.9 | 88.5 | 88.3 | 87.3 | 84.3 | −19.0 | −1.0 | −8.1 | −17.5 | −12 | −0.048 | −0.002 | −0.011 | −0.035 | −0.093 |
| Kolla Kinbibit | 5876.6 | 73.9 | 51.1 | 41.8 | 38.4 | 35.3 | −111.8 | −54.6 | −32.9 | −20.3 | −61.3 | −0.309 | −0.182 | −0.08 | −0.081 | −0.522 |
| Kolla Sulaja | 2057.3 | 45.5 | 20.9 | 16.7 | 15.8 | 12.6 | −42.1 | −8.8 | −3.1 | −7.2 | −18.3 | −0.54 | −0.204 | −0.055 | −0.198 | −0.722 |
| Obba Toli | 5910.5 | 81.7 | 79.7 | 80.1 | 80.9 | 79.7 | −9.7 | 2.4 | 7.3 | −7.6 | −3.2 | −0.024 | 0.005 | 0.009 | −0.014 | −0.024 |
| Sadi Loya | 2022.8 | 56 | 32.8 | 31.5 | 32.9 | 33.5 | −39.1 | −2.7 | 4.7 | 1.3 | −12.3 | −0.414 | −0.041 | 0.046 | 0.017 | −0.402 |
| Tuma Teso | 3968.2 | 43.3 | 27.5 | 25.7 | 25.2 | 26.5 | −52.1 | −7.5 | −3 | 5.8 | −18 | −0.364 | −0.069 | −0.018 | 0.052 | −0.388 |
| Walla | 9829.5 | 64 | 63.2 | 63.4 | 64.2 | 61.5 | −6.8 | 1.6 | 14 | −29.1 | −6.5 | −0.013 | 0.003 | 0.014 | −0.042 | −0.038 |
| Wanja Kersa | 1709.7 | 22.3 | 6.5 | 3.8 | 4 | 5.5 | −22.4 | −4.7 | 0.5 | 2.8 | −7.8 | −0.706 | −0.42 | 0.046 | 0.368 | −0.756 |
| Coffee areas excluding Chira town | 65962.5 | 72.9 | 66.5 | 64.9 | 64.4 | 62.5 | −354.3 | −102.5 | −55.3 | −138.5 | −185.2 | −0.0883 | −0.023 | −0.008 | −0.029 | −0.142 |
| Coffee areas including Chira town | 66463.3 | 72.6 | 66.1 | 64.5 | 64 | 62.1 | −360.4 | −108.2 | −54.4 | −137.2 | −188.2 | −0.0896 | −0.025 | −0.008 | −0.029 | −0.144 |
| Coffee areas excluding Chira town average | −22.1 | −6.4 | −3.5 | −8.7 | −11.6 | −0.201 | −0.082 | −0.003 | −0.007 | −0.266 | ||||||
| Highland forest area (highland areas) | ||||||||||||||||
| Bara Gogo | 1892.4 | 44.4 | 22.6 | 16.6 | 12.4 | 10.6 | −34.4 | −11.3 | −13.5 | −3.8 | −17.3 | −0.491 | −0.264 | −0.257 | −0.145 | −0.762 |
| Boge Dedo | 2683.1 | 46.7 | 15.1 | 9.2 | 7.9 | 8.1 | −70.7 | −15.9 | −5.7 | 0.8 | −28 | −0.677 | −0.393 | −0.138 | 0.028 | −0.826 |
| Dusta | 2280.9 | 55.6 | 23.1 | 16.5 | 12.8 | 9.9 | −61.7 | −15.1 | −14 | −7.5 | −28.2 | −0.584 | −0.286 | −0.223 | −0.232 | −0.823 |
| Gabba Koro | 9449.7 | 89.1 | 81.9 | 79.5 | 66.3 | 19.2 | −56.7 | −23.1 | −208.6 | −494.3 | −178.7 | −0.081 | −0.03 | −0.167 | −0.71 | −0.785 |
| Gadda Gute | 5518.8 | 96.4 | 74.8 | 64.6 | 50.2 | 37.5 | −99.4 | −56.7 | −132 | −77.6 | −87.8 | −0.224 | −0.137 | −0.222 | −0.252 | −0.611 |
| Gina Chola | 1188.8 | 20.6 | 9.1 | 9 | 7.7 | 6.6 | −11.3 | −0.1 | −2.4 | −1.5 | −4.5 | −0.557 | −0.009 | −0.14 | −0.141 | −0.676 |
| Kaso Badeyi | 1397.9 | 51.9 | 19.1 | 12.2 | 14.3 | 11.7 | −38.3 | −9.6 | 4.9 | −4.1 | −15.2 | −0.632 | −0.36 | 0.17 | −0.185 | −0.775 |
| Kombolcha | 1723.4 | 81.1 | 45.1 | 36 | 32.5 | 17.8 | −51.8 | −15.7 | −9.9 | −28.2 | −29.5 | −0.444 | −0.202 | −0.095 | −0.453 | −0.78 |
| Kubbo Silaja | 4622 | 46.7 | 29.7 | 20.9 | 18.6 | 13.4 | −65.3 | −40.9 | −17.2 | −26.9 | −41.6 | −0.363 | −0.298 | −0.107 | −0.281 | −0.713 |
| Muje | 3023.4 | 79.5 | 31.6 | 17.3 | 13.8 | 9.7 | −120.7 | −43.3 | −17.7 | −13.8 | −57.1 | −0.602 | −0.453 | −0.203 | −0.297 | −0.878 |
| Secha | 2232.4 | 80.5 | 47.9 | 39 | 30.2 | 27.2 | −60.7 | −19.9 | −32.5 | −7.5 | −32.2 | −0.405 | −0.186 | −0.224 | −0.101 | −0.662 |
| Tinba Chale | 2030.6 | 59.7 | 28.3 | 24 | 20.6 | 19.9 | −53.3 | −8.7 | −11.4 | −1.7 | −21.9 | −0.527 | −0.152 | −0.142 | −0.036 | −0.668 |
| Wegecha | 1001.4 | 35.8 | 11.8 | 8.3 | 8.6 | 7.9 | −20.0 | −3.6 | 0.5 | −0.8 | −7.6 | −0.669 | −0.303 | 0.036 | −0.081 | −0.78 |
| Highland areas total | 39044.8 | 70.2 | 47.3 | 40.6 | 33.5 | 18.1 | −744.0 | −263.9 | −459.5 | −666.9 | −549.4 | −0.326 | −0.143 | −0.174 | −0.459 | −0.742 |
| Highland areas average | −57.2 | −20.3 | −35.3 | −51.3 | −42.3 | −0.481 | −0.236 | −0.132 | −0.222 | −0.749 | ||||||
| Coffee areas and highland areas excluding Chira town | 105007 | 71.9 | 59.4 | 55.9 | 52.9 | 46 | −1098.3 | −366.4 | −515 | −805 | −735 | −0.175 | −0.059 | −0.053 | −0.13 | −0.36 |
| Coffee areas and highland areas including Chira town | 105508 | 71.7 | 59.2 | 55.6 | 52.7 | 45.9 | −1104.4 | −372.1 | −514 | −804.1 | −737.6 | −0.175 | −0.06 | −0.053 | −0.13 | −0.361 |
| Forest outside kebeles designated as state forest | 39904.5 | 97.7 | 97 | 96.8 | 96.5 | 95.7 | −22.5 | −11.1 | −13.7 | −39.6 | −22.2 | −0.007 | −0.003 | −0.002 | −0.009 | −0.021 |
| Gera | 145413 | 78.9 | 69.6 | 66.9 | 64.7 | 59.5 | −1126.9 | −383.2 | −527.6 | −843.6 | −759.8 | −0.118 | −0.038 | −0.033 | −0.081 | −0.245 |
| Wilcoxon rank sum test for kebeles in coffee areas excluding Chira town vs. highland areas | 178 | 163 | 159 | 125 | 174.5 | 171 | 168 | 179 | 183 | 198 | ||||||
| p-value for kebeles in coffee areas vs. highland areas | 0.001 | 0.009 | 0.02 | 0.369 | 0.002 | 0.003 | 0.004 | 0.001 | <0.001 | <0.001 | ||||||
†: Area of forest cover change per year = (N2 − N1)/(t2 − t1); and ‡: Relative rate of forest cover change = (N2 − N1)/N1, where N1 = forest area in the earlier year (t1) and N2 = forest area in the later year (t2).
Table A3.
Patterns of forest cover change in the Muje and Sadi-Wanja areas of Gera from 1958 to 2010.
Table A3.
Patterns of forest cover change in the Muje and Sadi-Wanja areas of Gera from 1958 to 2010.
| Land Cover | Year | |||||
|---|---|---|---|---|---|---|
| 1958 | 1973 | 1985 | 1995 | 2001 | 2010 | |
| Muje area | ||||||
| Forest (ha) | 2551 | 2376 | 949 | 567 | 515 | 435 |
| Non-forest (ha) | 478 | 653 | 2080 | 2462 | 2514 | 2594 |
| % of forest cover | 84.2 | 78.4 | 31.3 | 18.7 | 17.0 | 14.4 |
| Remaining of the 1958 forest (%) | 93.1 | 37.2 | 22.2 | 20.2 | 17.0 | |
| Sadi-Wanja area | ||||||
| Forest (ha) | 784 | 532 | 264 | 250 | 243 | 270 |
| Non-forest (ha) | 923 | 1175 | 1443 | 1457 | 1464 | 1437 |
| % of forest cover | 45.9 | 31.2 | 15.5 | 14.6 | 14.2 | 15.8 |
| Remaining of the 1958 forest (%) | 67.9 | 33.7 | 31.9 | 31.0 | 34.4 | |
| Total (Muje and Sadi-Wanja) | ||||||
| Forest (ha) | 3335 | 2908 | 1213 | 817 | 758 | 705 |
| Non-forest (ha) | 1401 | 1828 | 3523 | 3919 | 3978 | 4031 |
| % of forest cover | 70.4 | 61.4 | 25.6 | 17.2 | 16.0 | 14.9 |
| Remaining of the 1958 forest (%) | 87.2 | 36.4 | 24.5 | 22.7 | 21.1 | |
Table A4.
Changes in the composition of the fields used by the farmers interviewed in Gera in 2011. †
Table A4.
Changes in the composition of the fields used by the farmers interviewed in Gera in 2011. †
| Land Use Type | Percentage of Land Use Type | ||
|---|---|---|---|
| 1974 | 1991 | 2011 | |
| Coffee forest (Sadi-Wanja) area (n = 54) | |||
| Agriculture | 61.1 | 75.9 | 63.0 |
| Coffee | 3.7 | 7.4 | 13.0 |
| Forest | 9.3 | 1.9 | 0.0 |
| Other (e.g., homegarden, wetland, woodlot) | 25.9 | 14.8 | 24.1 |
| Total | 100.0 | 100.0 | 100.0 |
| Highland forest (Muje) area (n = 61) | |||
| Agriculture | 27.9 | 83.6 | 75.4 |
| Forest | 65.6 | 1.6 | 0.0 |
| Other (e.g., homegarden, wetland, woodlot) | 6.6 | 14.8 | 24.6 |
| Total | 100.0 | 100.0 | 100.0 |
| Coffee forest area and highland forest area (n = 115) | |||
| Agriculture | 43.5 | 80.0 | 69.6 |
| Coffee | 1.7 | 3.5 | 6.1 |
| Forest | 39.1 | 1.7 | 0.0 |
| Other (e.g., homegarden, wetland, woodlot) | 15.7 | 14.8 | 24.3 |
| Total | 100.0 | 100.0 | 100.0 |
†: Data from two villages are pooled for each category (coffee areas and highland areas). Of the 213 fields used by the farmers included in the participatory field mapping and interviews, land use data for the three reference years were obtained only for 115 fields, 54 in coffee areas and 61 in highland areas, from which the percentages were calculated. Agricultural land includes grazing land, land for annual crops, and fallow land; and coffee land includes both cultivated and semi-managed forest coffee land.
Figure A1.
Forest and non-forest land cover in the Muje (left) and Sadi-Wanja (right) areas of Gera from 1958 to 2010.
Figure A1.
Forest and non-forest land cover in the Muje (left) and Sadi-Wanja (right) areas of Gera from 1958 to 2010.

Figure A2.
Population densities in 1984, 1994, and 2007 for Gera (a) and kebeles in coffee (b) and highland (c) forest areas. Areas designated as state forest and Chira town included in the density estimation for Gera while Chira town was excluded from the density estimation for the coffee forest area (a).
References
- Gibson, L.; Lee, T.M.; Koh, L.P.; Brook, B.W.; Gardner, T.A.; Barlow, J.; Peres, C.A.; Bradshaw, C.J.A.; Laurance, W.F.; Lovejoy, T.E.; et al. Primary forest are irreplaceable for sustaining tropical biodiversity. Nature 2011, 478, 378–381. [Google Scholar] [CrossRef]
- Lewis, S.L.; Edwards, D.P.; Galbraith, D. Increasing human dominance of tropical forests. Science 2015, 349, 827–832. [Google Scholar] [CrossRef] [PubMed]
- Goodman, R.C.; Herold, M. Why Maintaining Tropical Forests Is Essential and Urgent for a Stable Climate; Center for Global Development: Washington, DC, USA, 2014. [Google Scholar]
- Lawrence, D.; Vandecar, K. The impact of tropical deforestation on climate and links to agricultural productivity. Nat. Publ. Group 2015, 5, 27–36. [Google Scholar] [CrossRef]
- CIFOR. Contributing to Africa’s Development through Forests: Strategy for Engagement in Sub-Saharan Africa; Center for International Forestry Research: Bogor Barat, Indonesia, 2005. [Google Scholar]
- FAO. State of the World’s Forests: Enhancing the Socioeconomic Benefits from Forests; FAO: Rome, Italy, 2014. [Google Scholar]
- FAO. Global Forest Resources Assessment 2010; Main Report; Food and Agriculture Organization of the United Nations (FAO): Rome, Italy, 2010. [Google Scholar]
- Millennium Ecosystem Assessment (MA). Forest and woodland systems. In Ecosystems and Human Well-being: Current State and Trends; Island Press: London, UK, 2005; Volume I, pp. 587–621. ISBN 1-55963-227-5. [Google Scholar]
- Gibbs, H.K.; Ruesch, A.S.; Achard, F.; Clayton, M.K.; Holmgren, P.; Ramankutty, N.; Foley, J.A. Tropical forests were the primary sources of new agricultural land in the 1980s and 1990s. Proc. Natl. Acad. Sci. USA 2010, 107, 16732–16737. [Google Scholar] [CrossRef] [PubMed] [Green Version]
- Keenan, R.J.; Reams, G.A.; Achard, F.; de Freitas, J.V.; Grainger, A.; Lindquist, E. Dynamics of global forest area: Results from the FAO Global Forest Resources Assessment 2015. For. Ecol. Manag. 2015, 352, 9–20. [Google Scholar] [CrossRef]
- Morales-Hidalgo, D.; Oswalt, S.N.; Somanathan, E. Status and trends in global primary forest, protected areas, and areas designated for conservation of biodiversity from the Global Forest Resources Assessment 2015. For. Ecol. Manag. 2015, 352, 68–77. [Google Scholar] [CrossRef] [Green Version]
- Busch, J.; Ferretti-Gallon, K. What drives deforestation and what stops it? A meta-analysis. Rev. Environ. Econ. Policy 2017, 11, 3–23. [Google Scholar] [CrossRef] [Green Version]
- DeFries, R.S.; Rudel, T.; Uriarte, M.; Hansen, M. Deforestation driven by urban population growth and agricultural trade in the twenty-first century. Nat. Geosci. 2010, 3, 178–181. [Google Scholar] [CrossRef]
- Hecht, S.B. Soybeans, development and conservation on the Amazon frontier. Dev. Chang. 2005, 36, 375–404. [Google Scholar] [CrossRef]
- Ingalls, M.L.; Meyfroidt, P.; Xuan, T.P.; Kenney-lazar, M.; Epprecht, M. The transboundary displacement of deforestation under REDD+: Problematic intersections between the trade of forest-risk commodities and land grabbing in the Mekong region. Glob. Environ. Chang. 2018, 50, 255–267. [Google Scholar] [CrossRef]
- Ordway, E.M.; Asner, G.P.; Lambin, E.F. Deforestation risk due to commodity crop expansion in sub-Saharan Africa. Environ. Res. Lett. 2017, 12. [Google Scholar] [CrossRef]
- Geist, H.J.; Lambin, E.F. Proximate causes and underlying driving forces of tropical deforestation. BioScience 2002, 52, 143–150. [Google Scholar] [CrossRef]
- Lambin, E.F.; Turner, B.L.; Geist, H.J.; Agbola, S.B.; Angelsen, A.; Bruce, J.W.; Coomes, O.T.; Dirzo, R.; Fischer, G.; Folke, C.; et al. The causes of land-use and land-cover change: Moving beyond the myths. Glob. Environ. Chang. 2001, 11, 261–269. [Google Scholar] [CrossRef]
- Turner, B.L., II; Lambin, E.F.; Reenberg, A. The emergence of land change science for global environmental change and sustainability. Proc. Natl. Acad. Sci. USA 2007, 104, 20666–20671. [Google Scholar] [CrossRef] [PubMed] [Green Version]
- Rudel, T.K.; Meyfroidt, P.; Chazdon, R.; Bongers, F.; Sloan, S.; Grau, H.R.; Holt, T.V.; Schneider, L. Whither the forest transition? Climate change, policy responses, and redistributed forests in the twenty-first century. Ambio 2019. [Google Scholar] [CrossRef] [PubMed]
- Lambin, E.F.; Geist, H.J.; Lepers, E. Dynamics of land-use and land-cover change in Tropical regions. Annu. Rev. Environ. Resour. 2003, 28, 205–241. [Google Scholar] [CrossRef] [Green Version]
- Betru, T.; Tolera, M.; Sahle, K.; Kassa, H. Trends and drivers of land use/land cover change in Western Ethiopia. Appl. Geogr. 2019, 104, 83–93. [Google Scholar] [CrossRef]
- Kassa, H.; Dondeyne, S.; Poesen, J.; Frankl, A.; Nyssen, J. Transition from Forest-based to Cereal-based Agricultural Systems: A Review of the Drivers of Land use Change and Degradation in Southwest Ethiopia. Land Degrad. Dev. 2017, 28, 431–449. [Google Scholar] [CrossRef] [Green Version]
- Tolessa, T.; Dechassa, C.; Simane, B.; Alamerew, B.; Kidane, M. Land use/land cover dynamics in response to various driving forces in Didessa sub-basin, Ethiopia. GeoJournal 2020, 85, 747–760. [Google Scholar] [CrossRef]
- Dibaba, W.T.; Demissie, T.A.; Konrad, M. Drivers and Implications of Land Use/Land Cover Dynamics in Finchaa Catchment, Northwestern Ethiopia. Land 2020, 9, 113. [Google Scholar] [CrossRef] [Green Version]
- Hailemariam, S.N.; Soromessa, T.; Teketay, D. Land Use and Land Cover Change in the Bale Mountain Eco-Region of Ethiopia during 1985 to 2015. Land 2016, 5, 41. [Google Scholar] [CrossRef] [Green Version]
- Garedew, E.; Sandewall, M.; Söderberg, U.; Campbell, B.M. Land-use and land-cover dynamics in the central rift valley of Ethiopia. Environ. Manag. 2009, 44, 683–694. [Google Scholar] [CrossRef] [PubMed]
- Kindu, M.; Schneider, T.; Teketay, D.; Knoke, T. Drivers of land use/land cover changes in Munessa-Shashemene landscape of the south-central highlands of Ethiopia. Environ. Monit. Assess. 2015, 187, 452. [Google Scholar] [CrossRef] [PubMed]
- Bekele, M. Forest Property Rights, the Role of the State and Institutional Exigency. Ph.D. Thesis, Swedish University of Agricultural Sciences, Uppsala, Sweden, 2003. [Google Scholar]
- Senbeta, F. Biodiversity and Ecology of Afromontane Rainforest with Wild Coffea Arabica L. Populations in Ethiopia. Ph.D. Thesis, University of Bonn, Bonn, Germany, 2006. [Google Scholar]
- Shumi, G.; Rodrigues, P.; Schultner, J.; Dorresteijn, I.; Hanspach, J.; Hylander, K.; Senbeta, F.; Fischer, J. Conservation value of moist evergreen Afromontane forest sites with different management and history in southwestern Ethiopia. Biol. Conserv. 2019, 232, 117–126. [Google Scholar] [CrossRef]
- Gole, T.W.; Denich, M.; Teketay, D.; Vlek, P.L.G. Human impacts on the Coffea arabica genepool in Ethiopia and the need for its in situ conservation. In Managing Plant Genetic Diversity; Engels, J.M.M., Ramanatha Rao, V., Brown, A.H.D., Jackson, M.T., Eds.; CAB International: Wallington, UK, 2002; pp. 237–247. [Google Scholar]
- Kufa, T. Recent Coffee Research Development in Ethiopia. In Proceedings of the Ethiopian Coffee Export Conference: Strengthening the Legacy of Our Coffee, Hilton, Addis Ababa, Ethiopia, 8–9 November 2012. [Google Scholar]
- Gray, Q.; Tefera, A.; Tefera, T. Ethiopia: Coffee Annual Report. 2013. Available online: https://apps.fas.usda.gov/newgainapi/api/report/downloadreportbyfilename?filename=Coffee%20Annual_Addis%20Ababa_Ethiopia_6-4-2013.pdf (accessed on 6 February 2020).
- Hylander, K.; Nemomissa, S.; Delrue, J.; Enkosa, W. Effects of coffee management on deforestation rates and forest integrity. Conserv. Biol. 2013, 27, 1031–1040. [Google Scholar] [CrossRef] [PubMed]
- Cheng, S.; Hiwatashi, Y.; Imai, H.; Naito, M.; Numata, T. Deforestation and degradation of natural resources in Ethiopia: Forest management implications from a case study in the Belete-Gera Forest. J. For. Res. 1998, 3, 199–204. [Google Scholar] [CrossRef]
- Getahun, K.; Poesen, J.; Van Rompaey, A. Impacts of Resettlement Programs on Deforestation of Moist Evergreen Afromontane Forests in Southwest Ethiopia. Mt. Res. Dev. 2017, 37, 474–486. [Google Scholar] [CrossRef] [Green Version]
- McCann, J.C. People of the Plow: An agricultural History of Ethiopia; University of Wisconsin Press: London, UK, 1995. [Google Scholar]
- Tadesse, G.; Zavaleta, E.; Shennan, C.; FitzSimmons, M. Policy and demographic factors shape deforestation patterns and socio-ecological processes in southwest Ethiopian coffee agroecosystems. Appl. Geogr. 2014, 54, 149–159. [Google Scholar] [CrossRef] [Green Version]
- CSA. Population Projection of Ethiopia for All Regions at Wereda Level from 2014–2017; Central Statistical Agency: Addis Ababa, Ethiopia, 2013.
- Oromia Forest and Wildlife Enterprise Jimma Branch Office Unpublished internal document. Jimma, Ethiopia.
- Friis, I.; Demissew, S.; van Breugel, P. The Atlas of Potential Vegetation of Ethiopia; The Royal Danish Academy of Sciences and Letters: Copenhagen, Denmark, 2010; ISBN 978-87-7304-347-9. [Google Scholar]
- Ango, T.G. “Medium-Scale” Forestland Grabbing in the Southwestern Highlands of Ethiopia: Impacts on Local Livelihoods and Forest Conservation. Land 2018, 7, 24. [Google Scholar] [CrossRef] [Green Version]
- CSA. The 1994 Population and Housing census of Ethiopia, Results for Oromia Region: Statistical Report on Population Size of Kebeles; CSA: Addis Ababa, Ethiopia, 1996; Volume I, Part VI.
- OPHCC. Population and Housing Census 1984: Analytical Report on Keffa Region; Office of the Population and Housing Census Commission: Addis Ababa, Ethiopia, 1990.
- CSA. The 2007 Population and Housing Census of Ethiopia: Statistical report for Oromiya region; Part V: Population Size of Kebeles; Central Statistical Agency: Addis Ababa, Ethiopia. Available online: http://www.csa.gov.et/census-report/complete-report/census-2007?download=192:statistical-oromiya (accessed on 6 August 2020).
- R Core Team. R: A Language and Environment for Statistical Computing, Version 3.1.0; R Foundation for Statistical Computing: Vienna, Austria, 2014. [Google Scholar]
- Bulcha, M. Flight and Integration. Causes of Mass Exodus from Ethiopia and Problems of Integration in the Sudan; Scandinavian Institute of African Studies: Uppsala, Sweden, 1990; ISBN 91-7106-279-3. [Google Scholar]
- Stellmacher, T. Governing the Ethiopian Coffee Forests: A Local Level Institutional Analysis in Kaffa and Bale Mountains. Ph.D. Thesis, Institut für Lebensmittel-und Ressourcenökonomik (ILR), Bonn, Germany, 2007. [Google Scholar]
- Takahashi, R.; Todo, Y. The impact of a shade coffee certification program on forest conservation using remote sensing and household data. Environ. Impact Assess. Rev. 2014, 44, 76–81. [Google Scholar] [CrossRef]
- Provisional Military Administration Council. Public Ownership of Rural Lands, Proclamation No. 31/1975; Provisional Military Administration Council: Addis Ababa, Ethiopia, 1975.
- Sertse, D.; Disasa, T.; Bekele, K.; Alebachew, M.; Kebede, Y.; Eshete, N.; Eshetu, S. Mass flowering and death of bamboo: A potential threat to biodiversity and livelihoods in Ethiopia. J. Biodivers. Environ. Sci. JBES 2011, 1, 16–25. [Google Scholar]
- Caldas, M.; Walker, R.; Arima, E.; Perz, S.; Aldrich, S.; Simmons, C. Theorizing land cover and land use change: The peasant economy of Amazonian deforestation. Ann. Assoc. Am. Geogr. 2007, 97, 86–110. [Google Scholar] [CrossRef]
- Getahun, K.; Van Rompaey, A.; Van Turnhout, P.; Poesen, J. Factors controlling patterns of deforestation in moist evergreen Afromontane forests of Southwest Ethiopia. For. Ecol. Manag. 2013, 304, 171–181. [Google Scholar] [CrossRef]
- Petit, N. Ethiopia’s Coffee Sector: A Bitter or Better Future? J. Agrar. Chang. 2007, 7, 225–263. [Google Scholar] [CrossRef]
- Ellis, F. The Determinants of Rural Livelihood Diversification in Developing Countries. J. Agric. Econ. 2000, 51, 289–302. [Google Scholar] [CrossRef]
- Manlosa, A.O.; Hanspach, J.; Schultner, J.; Dorresteijn, I.; Fischer, J. Livelihood strategies, capital assets, and food security in rural Southwest Ethiopia. Food Secur. 2019, 11, 167–181. [Google Scholar] [CrossRef] [PubMed] [Green Version]
- Meyfroidt, P.; Lambin, E.F. Forest transition in Vietnam and displacement of deforestation abroad. Proc. Natl. Acad. Sci. USA 2009, 106, 16139–16144. [Google Scholar] [CrossRef] [Green Version]
- Ango, T.G.; Börjeson, L.; Senbeta, F.; Hylander, K. Balancing ecosystem services and disservices: Smallholder farmers’ use and management of forest and trees in an agricultural landscape in southwestern Ethiopia. Ecol. Soc. 2014, 19, 30. [Google Scholar] [CrossRef] [Green Version]
- Lemessa, D.; Hylander, K.; Hambäck, P. Composition of crops and land-use types in relation to crop raiding pattern at different distances from forests. Agric. Ecosyst. Environ. 2013, 167, 71–78. [Google Scholar] [CrossRef]
- Calaboni, A.; Tambosi, L.R.; Igari, A.T.; Farinaci, J.S.; Metzger, J.P.; Uriarte, M. The forest transition in São Paulo, Brazil: Historical patterns and potential drivers. Ecol. Soc. 2018, 23, 7. [Google Scholar] [CrossRef]
- FDRE. Constitution of the Federal Democratic Republic of Ethiopia, Proclamation No. 1/1995; Negarit Gazeta: Addis Ababa, Ethiopia, 1995.
- Tekalign, M.; Flasse, C.; Frankl, A.; Van Rompaey, A.; Poesen, J.; Nyssen, J.; Muys, B. Forest cover loss and recovery in an East African remnant forest area: Understanding its context and drivers for conservation and sustainable ecosystem service provision. Appl. Geogr. 2018, 98, 133–142. [Google Scholar] [CrossRef]
- Kidane-Mariam, T.; Levia, D.F. The political ecology of land degradation in Ethiopia. In Africa’s Development in the Twenty-First Century: Pertinent Socio-Economic and Development Issues; Konadu-Agyemang, K., Panford, K., Eds.; Ashgate: Burlington, NJ, USA, 2006; pp. 139–160. [Google Scholar]
- Lanckriet, S.; Derudder, B.; Naudts, J.; Bauer, H.; Deckers, J.; Haile, M.; Nyssen, J. A political ecology perspective of land degradation in the north Ethiopian Highlands. Land Degrad. Dev. 2015, 26, 521–530. [Google Scholar] [CrossRef] [Green Version]
- Reid, R.S.; Kruska, R.L.; Muthui, N.; Taye, A.; Wotton, S.; Wilson, C.J.; Mulatu, W. Land-use and land-cover dynamics in response to changes in climatic, biological and socio-political forces: The case of southwestern Ethiopia. Landsc. Ecol. 2000, 15, 339–355. [Google Scholar] [CrossRef]
- Teka, K.; Van Rompaey, A.; Poesen, J. Assessing the role of policies on land use change and agricultural development since 1960s in northern Ethiopia. Land Use Policy 2013, 30, 944–951. [Google Scholar] [CrossRef]
- Kuusela, O.P.; Amacher, G.S. Changing Political Regimes and Tropical Deforestation. Environ. Resour. Econ. 2016, 64, 445–463. [Google Scholar] [CrossRef]
- Peres, C.A.; Schneider, M. Subsidized agricultural resettlements as drivers of tropical deforestation. Biol. Conserv. 2012, 151, 65–68. [Google Scholar] [CrossRef]
- Rudel, T.K. Changing agents of deforestation: From state-initiated to enterprise driven processes, 1970–2000. Land Use Policy 2007, 24, 35–41. [Google Scholar] [CrossRef]
- Ayana, A.N.; Arts, B.; Wiersum, K.F. Historical development of forest policy in Ethiopia: Trends of institutionalization and deinstitutionalization. Land Use Policy 2013, 32, 186–196. [Google Scholar] [CrossRef]
- Zewde, B. Forest and forest management in Wallo in historical perspective. J. Ethiop. Stud. 1998, 31, 87–121. [Google Scholar]
- Dessie, G.; Kleman, J. Pattern and Magnitude of Deforestation in the South Central Rift Valley Region of Ethiopia. Mt. Res. Dev. 2007, 27, 162–168. [Google Scholar] [CrossRef] [Green Version]
- Nepstad, D.C.; Veríssimo, A.; Alencar, A.; Nobre, C.; Lima, E.; Lefebvre, P.; Schlesinger, P.; Potter, C.; Moutinho, P.; Mendoza, E.; et al. Large-scale impoverishment of Amazonian forests by logging and fire. Nature 1999, 398, 505–508. [Google Scholar] [CrossRef]
- Takahashi, R.; Todo, Y. Impact of community-based forest management on forest protection: Evidence from an aid-funded project in Ethiopia. Environ. Manag. 2012, 50, 396–404. [Google Scholar] [CrossRef] [PubMed]
- Lemenih, M.; Kassa, H. Re-greening Ethiopia: History, challenges and lessons. Forests 2014, 5, 1896–1909. [Google Scholar] [CrossRef]
- Telila, H.; Hylander, K.; Nemomissa, S. The potential of small Eucalyptus plantations in farmscapes to foster native woody plant diversity: Local and landscape constraints. Restor. Ecol. 2015, 23, 918–926. [Google Scholar] [CrossRef]
- Hylander, K.; Nemomissa, S. Home garden coffee as a repository of epiphyte biodiversity in Ethiopia. Front. Ecol. Environ. 2008, 6, 524–528. [Google Scholar] [CrossRef]
- Rodrigues, P.; Shumi, G.; Dorresteijn, I.; Schultner, J.; Hanspach, J.; Hylander, K.; Senbeta, F.; Fischer, J. Coffee management and the conservation of forest bird diversity in southwestern Ethiopia. Biol. Conserv. 2018, 217, 131–139. [Google Scholar] [CrossRef]
- Shumi, G.; Schultner, J.; Dorresteijn, I.; Rodrigues, P.; Senbeta, F.; Fischer, J.; Hanspach, J.; Hylander, K. Land use legacy effects on woody vegetation in agricultural landscapes of south-western Ethiopia. Divers. Distrib. 2018, 24, 1136–1148. [Google Scholar] [CrossRef] [Green Version]
- Bekele, M.; Tesfaye, Y.; Mohammed, Z.; Zewdie, S.; Tebikew, Y.; Brockhaus, M.; Kassa, H. The Context of REDD+ in Ethiopia: Drivers, Agents, and Institutions; Occasional Paper; CIFOR: Bogor, Indonesia, 2015. [Google Scholar]
- Getaneh, F.; Gole, T.W. Conservation Planning and Management: Developing a Zoning Concept for Yayu Coffee Forest Biosphere Reserve, Oromia. In Socio-Ecological Change in Rural Ethiopia: Understanding Local Dynamics in Environmental Planning and Natural Resource Management; Stellmacher, T., Ed.; Peter Lang AG: Frankfurt, Germany, 2015; pp. 61–74. [Google Scholar]
- Phelps, J.; Webb, E.L.; Agrawal, A. Does REDD+ threaten to recentralize forest governance? Science 2010, 328, 312–313. [Google Scholar] [CrossRef]
- Poudyal, M.; Ramamonjisoa, B.S.; Hockley, N.; Rakotonarivo, O.S.; Gibbons, J.M.; Mandimbiniaina, R.; Rasoamanana, A.; Jones, J.P.G. Can REDD+ social safeguards reach the ‘right’ people? Lessons from Madagascar. Glob. Environ. Chang. 2016, 37, 31–42. [Google Scholar] [CrossRef] [Green Version]
- Fischer, J.; Abson, D.J.; Bergsten, A.; French Collier, N.; Dorresteijn, I.; Hanspach, J.; Hylander, K.; Schultner, J.; Senbeta, F. Reframing the Food–Biodiversity Challenge. Trends Ecol. Evol. 2017, 32, 335–345. [Google Scholar] [CrossRef]
- Sayer, J.; Sunderland, T.; Ghazoul, J.; Pfund, J.-L.; Sheil, D.; Meijaard, E.; Venter, M.; Boedhihartono, A.K.; Day, M.; Garcia, C.; et al. Ten principles for a landscape approach to reconciling agriculture, conservation, and other competing land uses. Proc. Natl. Acad. Sci. USA 2013, 110, 8349–8356. [Google Scholar] [CrossRef] [PubMed] [Green Version]
Figure 1.
Map of Gera and names of kebeles within coffee and highland forest areas, and state forest blocks. The land cover (situation for 2010) of the district was produced from a free Landsat image (http://glovis.usgs.gov). Tree cover of the upper map represents the situation for 2000 (Hansen/UMD/Google/USGS/NASA).

Figure 2.
Forest and non-forest land cover in Gera from 1973 to 2010.

Figure 3.
Correlation between forest cover changes (area and relative) and population density in kebeles in coffee and highland forest areas of Gera. Chira town is not included in the graph and statistical test for which the p-values are reported. The linear trend lines are included where the p-values for Spearman’s rank correlation tests are <0.05 (solid) and 0.067 (dotted). The y-values are forest cover changes (area, a–e; relative, f–j) during 1973–2010, 1973–1985, 1985–1995, 1995–2001, and 2001–2010, while the x-values are population densities in 2010 (a,e,f,j), 1985 (b,g), 1995 (c,h), and 2001 (d,i) for the kebeles in coffee and highland forest areas.
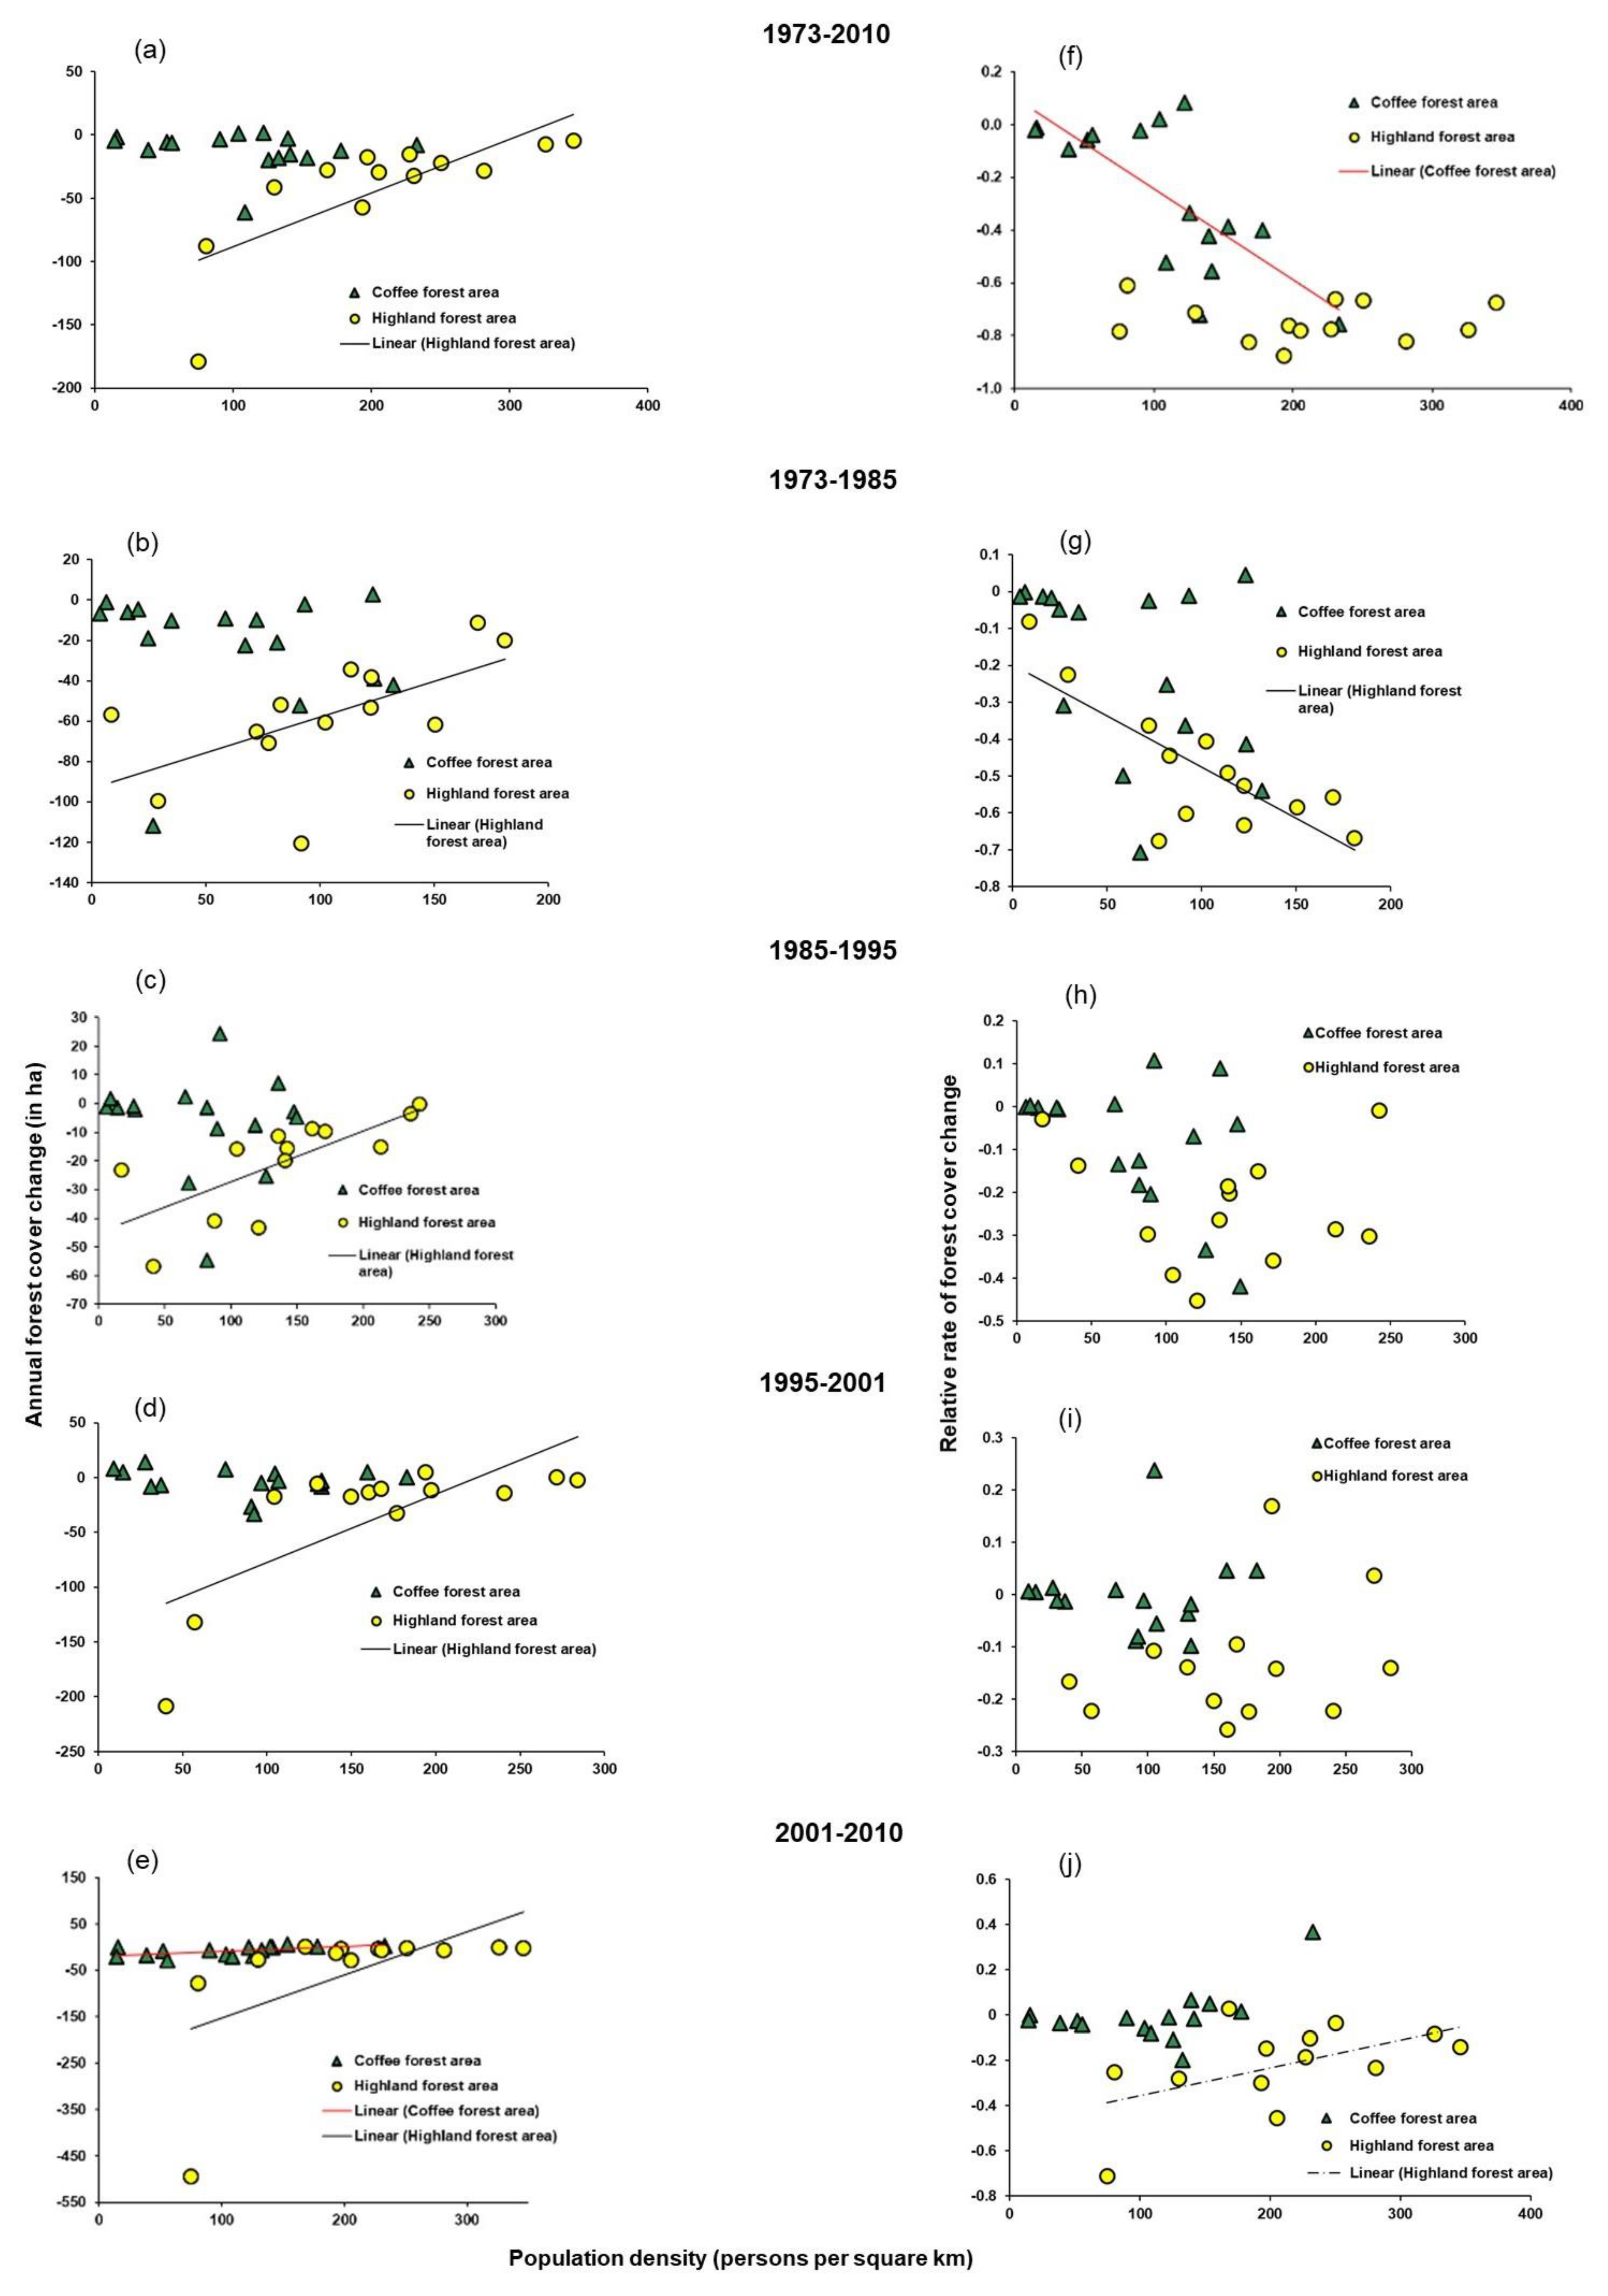
Figure 4.
Correlation between forest cover or relative change and average slopes in kebeles in coffee and highland forest areas, and state forest blocks of Gera. The linear trend lines are included where the p-values for Spearman’s rank correlation tests are <0.05. The y-values are percentages of forest cover in 2010 (a) and relative rates of forest cover change during 1973–2010 (b) while the x-values are average slopes for the coffee areas (excluding Chira town) and highland area kebeles, and the state forest blocks.

Figure 5.
Summary of causes and drivers of forest cover change and percentages of forest cover in coffee and highland forest areas and state forest sites of Gera, 1958–2010 (a). Imperial refers to the pre-1974 feudal monarchy; Derg was the socialist military government; and EPRDF stands for Ethiopian People’s Revolutionary Democratic Front, a party that took government power since 1991. The y-values (b–g) are percentages of forest cover in 1958, 1973, 1985, 1995, 2001, and 2010. Blank spaces in (a) indicate that the driver is not relevant or that data is lacking for that specific land area. 1 Some of the state forest sites include forest and semi-managed forest coffee. 2 In the villagization program, the Derg government forced farmers in and around forests to move to a newly established village far from forest edges. This move led to forest recovery in limited parts of a small number of coffee area kebeles, e.g., Wanja Kersa, since the fields were left uncultivated. Afterwards, the recovered forest was maintained.

Figure 6.
Farmers’ use of timber and non-timber products from bamboo forest, and grazing land conversion to eucalyptus plantation in the Gera landscape of Ethiopia. Domestic and market demand for timber and non-timber products from bamboo forest: houses (a) and fence constructed from bamboo (b), dried bamboo used as firewood (c), and bamboo bark as cover for locally made beehives (d). Grazing land converted to eucalyptus plantation by a group of farmers in Kerebe village, Sadi Loya kebele (e and f). Photos taken before and after the conversion: (e) on 19 October 2013 and (f) on 9 January 2015.

Table 1.
Patterns of forest cover change in Gera from 1973 to 2010.
| Land Cover | Year | ||||
|---|---|---|---|---|---|
| 1973 | 1985 | 1995 | 2001 | 2010 | |
| Coffee forest areas (including Chira town) | |||||
| Forest (ha) | 48,265 | 43,941 | 42,861 | 42,534 | 41,300 |
| Non-forest (ha) | 18,198 | 22,522 | 23,602 | 23,929 | 25,163 |
| % of forest cover | 72.6 | 66.1 | 64.5 | 64.0 | 62.1 |
| Remaining of the 1973 forest (%) | 91.0 | 88.8 | 88.1 | 85.6 | |
| Highland forest areas | |||||
| Forest (ha) | 27,407 | 18,478 | 15,839 | 13,082 | 7080 |
| Non-forest (ha) | 11,638 | 20,567 | 23,206 | 25,963 | 31,965 |
| % of forest cover | 70.2 | 47.3 | 40.6 | 33.5 | 18.1 |
| Remaining of the 1973 forest (%) | 67.4 | 57.8 | 47.7 | 25.8 | |
| Areas outsidekebeles designated as state forest | |||||
| Forest (ha) | 38,991 | 38,721 | 38,610 | 38,528 | 38,171 |
| Non-forest (ha) | 914 | 1184 | 1295 | 1377 | 1734 |
| % of forest cover | 97.7 | 97.0 | 96.8 | 96.5 | 95.7 |
| Remaining of the 1973 forest (%) | 99.3 | 99.0 | 98.8 | 97.9 | |
| Gera (total) | |||||
| Forest (ha) | 114,663 | 101,140 | 97,310 | 94,144 | 86,551 |
| Non-forest (ha) | 30,750 | 44,273 | 48,103 | 51,269 | 58,862 |
| % of forest cover | 78.9 | 69.6 | 66.9 | 64.7 | 59.5 |
| Remaining of the 1973 forest (%) | 88.2 | 84.9 | 82.1 | 75.5 | |
Table 2.
Differences in forest area change per year, relative rate of forest cover change, and population density between kebeles located in coffee and highland forest areas of Gera.
Table 2.
Differences in forest area change per year, relative rate of forest cover change, and population density between kebeles located in coffee and highland forest areas of Gera.
| Area Names | Annual Forest Cover Change (ha/year) | Relative Forest Cover Change (rate) | Population Density | |||||||||||
|---|---|---|---|---|---|---|---|---|---|---|---|---|---|---|
| 1973–1985 | 1985–1995 | 1995–2001 | 2001–2010 | 1973–2010 | 1973–1985 | 1985–1995 | 1995–2001 | 2001–2010 | 1973–2010 | 1985 | 1995 | 2001 | 2010 | |
| Coffee forest area kebeles excluding Chira town (n = 16) | ||||||||||||||
| Average | −22.1 | −6.4 | −3.5 | −8.7 | −11.6 | −0.201 | −0.082 | −0.003 | −0.007 | −0.266 | 61 | 77 | 89 | 107 |
| Standard deviation | 28.7 | 17.4 | 12.1 | 10.5 | 15.0 | 0.240 | 0.145 | 0.077 | 0.118 | 0.280 | 44 | 50 | 53 | 60 |
| Highland forest area kebeles (n = 13) | ||||||||||||||
| Average | −57.2 | −20.3 | −35.3 | −51.3 | −42.3 | −0.481 | −0.236 | −0.132 | −0.222 | −0.749 | 102 | 140 | 167 | 209 |
| Standard deviation | 29.6 | 16.8 | 62.6 | 134.8 | 46.5 | 0.177 | 0.133 | 0.118 | 0.193 | 0.077 | 50 | 68 | 74 | 83 |
| Wilcoxon rank sum test for kebeles in Coffee areas excluding Chira town vs. highland areas | 178 | 163 | 159 | 125 | 174.5 | 171 | 168 | 179 | 183 | 198 | 57 | 46.5 | 39 | 35 |
| P-value for kebeles in coffee areas excluding Chira town vs. highland areas † | 0.001 | 0.009 | 0.02 | 0.369 | 0.002 | 0.003 | 0.004 | 0.001 | <0.001 | <0.001 | 0.041 | 0.012 | 0.005 | 0.002 |
†: The p-values were obtained from a Wilcoxon rank-sum test for (i) forest area per year change, (ii) relative rate of forest cover change, and (iii) population densities of coffee areas and highland areas kebeles during each period and year.
© 2020 by the authors. Licensee MDPI, Basel, Switzerland. This article is an open access article distributed under the terms and conditions of the Creative Commons Attribution (CC BY) license (http://creativecommons.org/licenses/by/4.0/).
Share and Cite
MDPI and ACS Style
Ango, T.G.; Hylander, K.; Börjeson, L. Processes of Forest Cover Change since 1958 in the Coffee-Producing Areas of Southwest Ethiopia. Land 2020, 9, 278. https://doi.org/10.3390/land9080278
AMA Style
Ango TG, Hylander K, Börjeson L. Processes of Forest Cover Change since 1958 in the Coffee-Producing Areas of Southwest Ethiopia. Land. 2020; 9(8):278. https://doi.org/10.3390/land9080278
Chicago/Turabian StyleAngo, Tola Gemechu, Kristoffer Hylander, and Lowe Börjeson. 2020. "Processes of Forest Cover Change since 1958 in the Coffee-Producing Areas of Southwest Ethiopia" Land 9, no. 8: 278. https://doi.org/10.3390/land9080278
Note that from the first issue of 2016, this journal uses article numbers instead of page numbers. See further details here.