Article

Revisiting the Proximity Principle with Stakeholder Input: Investigating Property Values and Distance to Urban Green Space in Potchefstroom

Unit for Environmental Sciences and Management, North-West University, Potchefstroom 2520, South Africa
*
Author to whom correspondence should be addressed.
Land 2020, 9(7), 235; https://doi.org/10.3390/land9070235
Submission received: 5 June 2020 / Revised: 15 July 2020 / Accepted: 16 July 2020 / Published: 20 July 2020
(This article belongs to the Special Issue Urban Ecosystem Services)

Abstract

:
Nature is essential to urban quality of life, yet green spaces are under pressure. In an attempt to strengthen the case for urban greening and to reclaim nature into cities, this research considered green spaces from an economic spatial perspective. The proximity principle, as part of hedonic price analysis, is employed to determine the impact of green spaces on property value in specifically selected residential areas within Potchefstroom, South Africa. Our statistical analysis indicated a rejection of the proximity principle in some areas, contradicting internationally accepted theory. To investigate local trends and possible reasons for the rejection, supporting quantitative data was gathered through structured questionnaires disseminated to local residents of Potchefstroom and Professional Planners in South Africa. Challenges pertaining to the planning of green spaces were emphasised, despite residents’ willingness to pay more for such green spaces in close proximity to residential areas, according to the cross-tabulations conducted. The research results contributed to the discourse on the economic benefits of green spaces and presented the trends of such benefits within the local context of Potchefstroom. The results emphasised the need to rethink the planning of green spaces within the local context, and provided recommendations on how to reclaim nature into cities from a spatial planning perspective.

1. Introduction

Urban development often occurs at the expense of urban green spaces (UGSs), separating urbanites from nature [1] and depriving them of the various social and environmental benefits, also known as ecosystem services, that UGSs provide [2,3,4]. Importantly, UGSs also deliver certain economic benefits. These benefits are often much more difficult to measure, generally leading to a preference for land uses with an explicit monetary value, including commercial and residential development, above UGSs in property development decisions [5]. Various studies have been conducted using different techniques and methods to quantify the potential economic benefits of UGSs with the majority of these studies focusing on the contexts of the global North [6,7,8,9,10]. Among these, the proximity principle has been widely applied [8,10]. The proximity principle suggests that residential property value increases as the distance to UGSs decreases [11], thus providing potential reciprocal increases in property tax for authorities [6]. The majority of studies in the global North confirmed the proximity principle [8,10], whereas in the global South results have been less conclusive. In 2015, Cilliers and Cilliers disproved the proximity principle in a South African case study, testing the principle in the local context of Potchefstroom. [12]. The current paper returned to the 2015 case study to verify, update and refine the work conducted by Cilliers and Cilliers [12] as a preliminary study to direct future research. The paper followed a quantitative approach investigating municipal property valuations for three zones differentiated based on distance from a green space in five residential areas bordering a UGS in Potchefstroom. Additional data were also gathered by means of a survey on the social, environmental and economic values attributed to green spaces by a sample of Potchefstroom residents; and a second survey of South African urban planners concerning perceptions on planning for green spaces. The paper is initiated with a review of core concepts in a South African context to provide orientation and reference existing studies in the field. This is followed by the quantitative investigation and a discussion of the results, finally arriving at our conclusions and ultimate recommendations.

1.1. Green Spaces in the South African Context

Urban green spaces (UGSs) include various types and land uses that are located within the urban boundary, primarily covered by permeable surfaces, soil or plant species including grass, shrubs or trees [13]. Zoning classifications may include recreational, institutional, residential, commercial or agricultural categories to accommodate land uses such as sports fields, private gardens, street trees, playgrounds, greenways, urban farms and urban forests [13,14]. UGSs may also include more informal, residual and seemingly abandoned areas, similar to vacant lots, spaces along and under freeways, railways and side streets, sidewalks and derelict properties. Green land uses in urban areas have been studied extensively for their contributions to urban quality of life [1,2,5,15], as part of urban green infrastructure [15].
The majority of studies have been conducted in the contexts of the global North, with scholarship in the global South still being relatively underrepresented [15], with the exception of South Africa. Like most countries, South Africa is experiencing rapid urbanisation as the most urbanised sub-region in Africa [16]. Sub-Saharan Africa along with Asia, is expected to accommodate 90% of the total increase in population over the next four decades [15]. Urban expansion is driven by development in both formal and informal areas, placing green spaces on the expanding urban periphery and within the existing urban envelope in danger of land use conversion [13,17,18,19]. According to Lubbe et al. [19], the socio-economic status of an urban area determines what resources are available to change the environment, having a tremendous impact on the vegetation types, plant diversity and green space availability [20]. Moreover, South African standards call for a minimum 10% of development area to be allocated to green space, but as in other global areas, UGSs continuously compete with other land uses that may present more explicit monetary values and returns [21,22]. Green spaces also face additional threats from illegal dumping, pollution, invasive species and other social ails that may damage natural ecosystems and diminish biological diversity [23]. To defend existing and promote the development of UGSs, a compelling argument for the social, environmental and, importantly, the economic benefits UGSs can provide, must be made. However, such arguments must also make balanced reference to the potential disadvantages often related to these green spaces, especially in the contexts of the global South. The following section provides a succinct discussion of these benefits, as ecosystem services, as well as potential disadvantages, as ecosystem disservices.

1.2. Ecosystem Services and Disservices

Ecosystem services refer to the benefits people derive from any form of ecosystem functions delivered by UGSs (urban green spaces) that have a positive impact on human wellbeing [2]. Ecosystem services may be classified according to two broad categories, distinguishing between direct and indirect benefits [1,5]. Direct benefits include environmental and social benefits or services, whereas indirect benefits refer to economic benefits (Table 1).
It is imperative that the different categories of UGS and types of ecosystem services and benefits green spaces provide, are well understood and communicated in aid of UGS protection and advancement [1]. A case study in Johannesburg, one of the fastest growing cities in Africa, determined that cities and towns are in desperate need of green planning strategies which are only possible when ecosystem services are recognised in city budgeting and accounting systems and when the “ecological economy” is integrated in urban planning processes [16]. Many of the indirect environmental and social benefits potentially delivered by UGSs may be more readily accepted and anticipated by the public and authorities [28]. The direct economic benefits delivered by UGSs are often less thoroughly understood and accepted, ascribed to the complexities of determining and expressing such values [5]. De Wit et al. [29] determined the monetary value of specific ecosystem services in Cape Town, South Africa, and concluded that these services generated economically valuable services in the context of the metro’s economy and should, thus, be considered in its budgeting processes. Cognisance of such economic contributions may incentivise investment in and spending on maintenance and protection of UGSs [6] and may justify expenditure to address possible associated disadvantages (ecosystem disservices). Ecosystem disservices EDS) refer to the same ecosystem functions that provide benefits in social, environmental and economic terms, but recognise related actual or perceived negative impacts on human wellbeing [3,30]. Ecosystem disservices are an especially important consideration in the South African context as [30,31]. This paper highlights the ecosystem disservices that are present in towns and cities in South Africa, similar to Potchefstroom, that pose a threat to human wellbeing and require financial resources and private investment to address these disservices in spatial planning, as seen in the third column of Table 2.
The valuation of the economic benefits delivered by UGSs can, thus, be influenced by both ecosystem services and the ecosystem disservices derived from the same spaces. Various approaches and methods have been developed to quantify the economic benefits of UGSs in this regard [6,7,8,9,27,32]. A comprehensive review of all existing methods falls beyond the scope of this paper. As this research is based on the work completed by Cilliers and Cilliers [12], only the approach used in that study is recapitulated in Section 1.3 of this paper.

1.3. The Proximity Principle as A Hedonic Price Analysis Method

The proximity principle, also called the proximate principle, suggests that the value of an amenity, like a green space, is determined by the property values of adjacent residential properties [11,12,33]. The proximity principle reflects on the concept of “willingness to pay”, as residents are willing to pay more for properties adjacent to or enjoying a view of such an amenity, or green space [33]. As a result, residents pay more property tax leading to higher tax returns available to local municipalities to direct towards planning, developing and maintaining quality UGSs [6]. Hedonic Price Analysis is generally the most commonly employed method to quantify the value of green spaces [8]. Hedonic Price Analysis is used to identify and quantify the different factors and characteristics that influence the value of property by using several regression models and considering property value as a function of measures of proximity to green space [8,33,34,35]. Thus, the Hedonic Price Analysis method considers that residential properties are not homogeneous, but reflect various factors that influence property value including property size, the physical condition of the property and accessibility [8]. Several studies [6,22] have determined the positive impact of green spaces on property value, thus, testing the proximity principle using Hedonic Price Analysis. Cilliers and Cilliers [12] invoked the proximity principle as a hedonic pricing method in the local context of Potchefstroom, South Africa, to compare local case study findings with case study results proving the proximity principle in international literature. In the Potchefstroom case study, Cilliers and Cilliers [12] rejected the proximity principle, as proximity to nearest UGS exerted a negative impact on residential property value, as elaborated on in Section 2. These contrasting findings underscore the potential impact of ecosystem services and disservices within the parameters of socio-cultural and physical context in South Africa in realising certain economic values derived from UGSs.

1.4. The Importance of Context and Planning at Community Level

As referenced in Section 1.2 (ecosystem disservices in SA context) and the contrasting findings in the previous section, context is key in eliciting ecosystem services and downplaying potential disservices in the realisation of economic benefits. Context specificities must be acknowledged in planning for UGSs, local level research, data collection and spatial planning [36]. As part of this process, public participation and stakeholder engagement can render valuable inputs regarding perceptions, experiences and acknowledged benefits and disadvantages related to UGSs at local level. Not all inputs from community members can be incorporated in planning and decision making [36], but such processes at least provide nuanced information related to citizen experience and may highlight previously unknown cultural, biodiversity, recreational values, community needs and preferences [36] that may not be captured in spreadsheets dealing with economic data. A study was conducted in South Africa investigating the inequality of public green space, finding that poorer suburbs are endowed with less public green space area than provided in more affluent areas, resulting in poor access to such spaces for the poor [15]. The South African context’s severe socio-economic disparities, which are also expressed spatially and in access to amenities, provides fertile ground for community-based participatory planning. Stakeholder engagement may thus consider the interests and opinions of urban residents in the planning and management of public green spaces [15] and provide nuanced understanding of the impacts of such spaces in varied contexts in recognition of generally acknowledged challenges. As mentioned in Section 1.2, UGSs in South Africa are often under-maintained, unattractive and perceived as crime hotspots [37], leading to underutilisation and further dereliction. Such conditions demand continuous efforts to maintain and improve UGSs, akin to Dempsey and Burton’s [38] conceptualisation of ‘place-keeping’ as a collaborative process that surpasses a focus on mere physical upkeep to include ongoing inputs from public and private stakeholders, as well as communities. Thus, calling for community stewardship and the use of local knowledge and community networks to increase the quality of UGSs and by extension, their potential economic benefits.

2. Methodology

This section provides a discussion of the methodologies followed in data acquisition for the two components of quantitative research completed. The results are presented for each component in Section 3. As previously mentioned, this paper presents a refinement of and elaboration on the study conducted by Cilliers and Cilliers (2015) [12] investigating the proximity principle in the case study of Potchefstroom using updated municipal valuations in its analysis (See Section 2.1). The paper tested the proximity principle in the local context in 2019, and compared 2019 findings with 2015 findings, to identify if the proximity principle would still be rejected, as in the 2015 study. The 2019 study was further substantiated with supporting quantitative data collected through two structured questionnaires capturing perceptions amongst a sample of Potchefstroom residents pertaining to green space values; and a questionnaire distributed amongst Professional Planners in South Africa regarding green space planning in the local context (See Section 2.2). Although these questionnaires were limited in sample size, and should be expanded on in future research endeavours, results provide preliminary insights into community and professional perspectives on UGSs in support of the importance of context and community input discussed in Section 1.4.

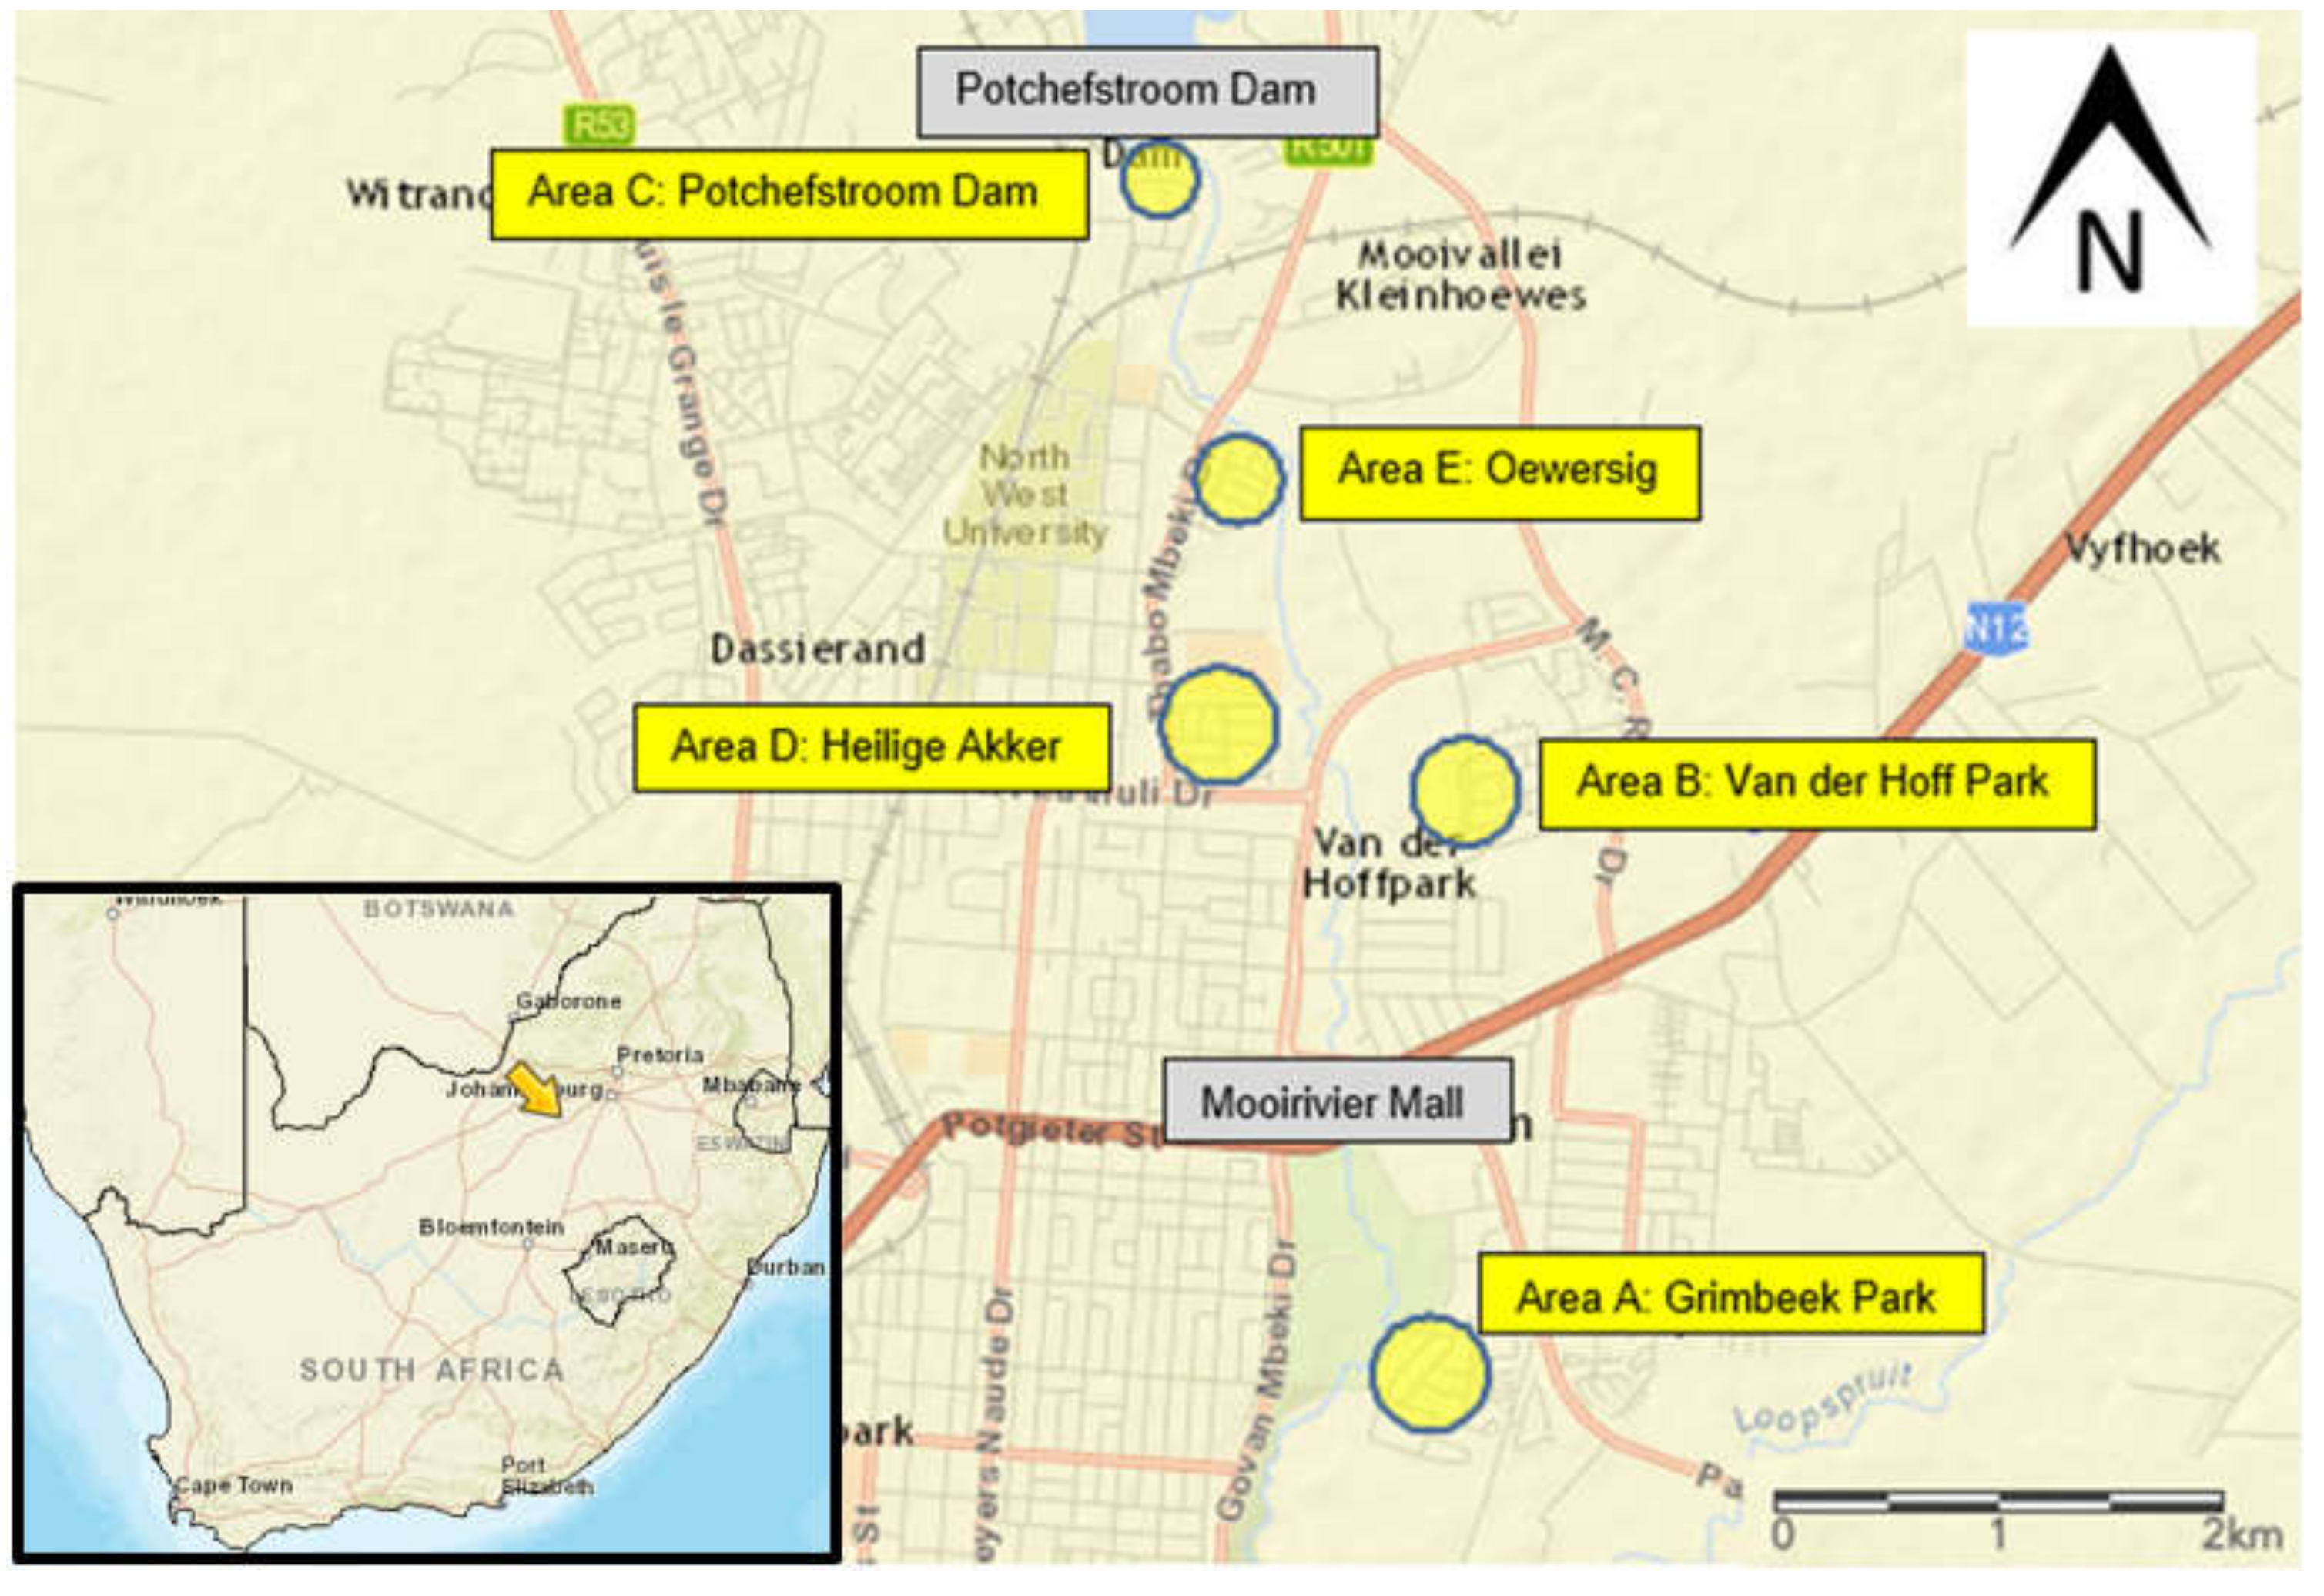
2.1. Data Acquisition Part A: Proximity Principle in Potchefstroom

The data were collected in Potchefstroom (26.7145° S, 27.0970° E), situated in the North-West province of South Africa. Potchefstroom was chosen as the local case study area as international literature were divergent from the results of a study conducted in Potchefstroom by Cilliers and Cilliers in 2015 [12]. This paper refined the previous study by Cilliers and Cilliers, employing the same methods of data collection and data analysis to verify the results study four years later. As such, the same residential areas and respective properties within each residential area included in the 2015 study by Cilliers and Cilliers [12] were reselected in 2019 to determine the impact of green spaces on property value, using 2019 municipal property valuations. These residential areas were originally selected based on their proximity and accessibility to UGSs, and included the following, as seen in Figure 1:
-
Area A: Grimbeek Park, bordering the Potchefstroom Country Club
-
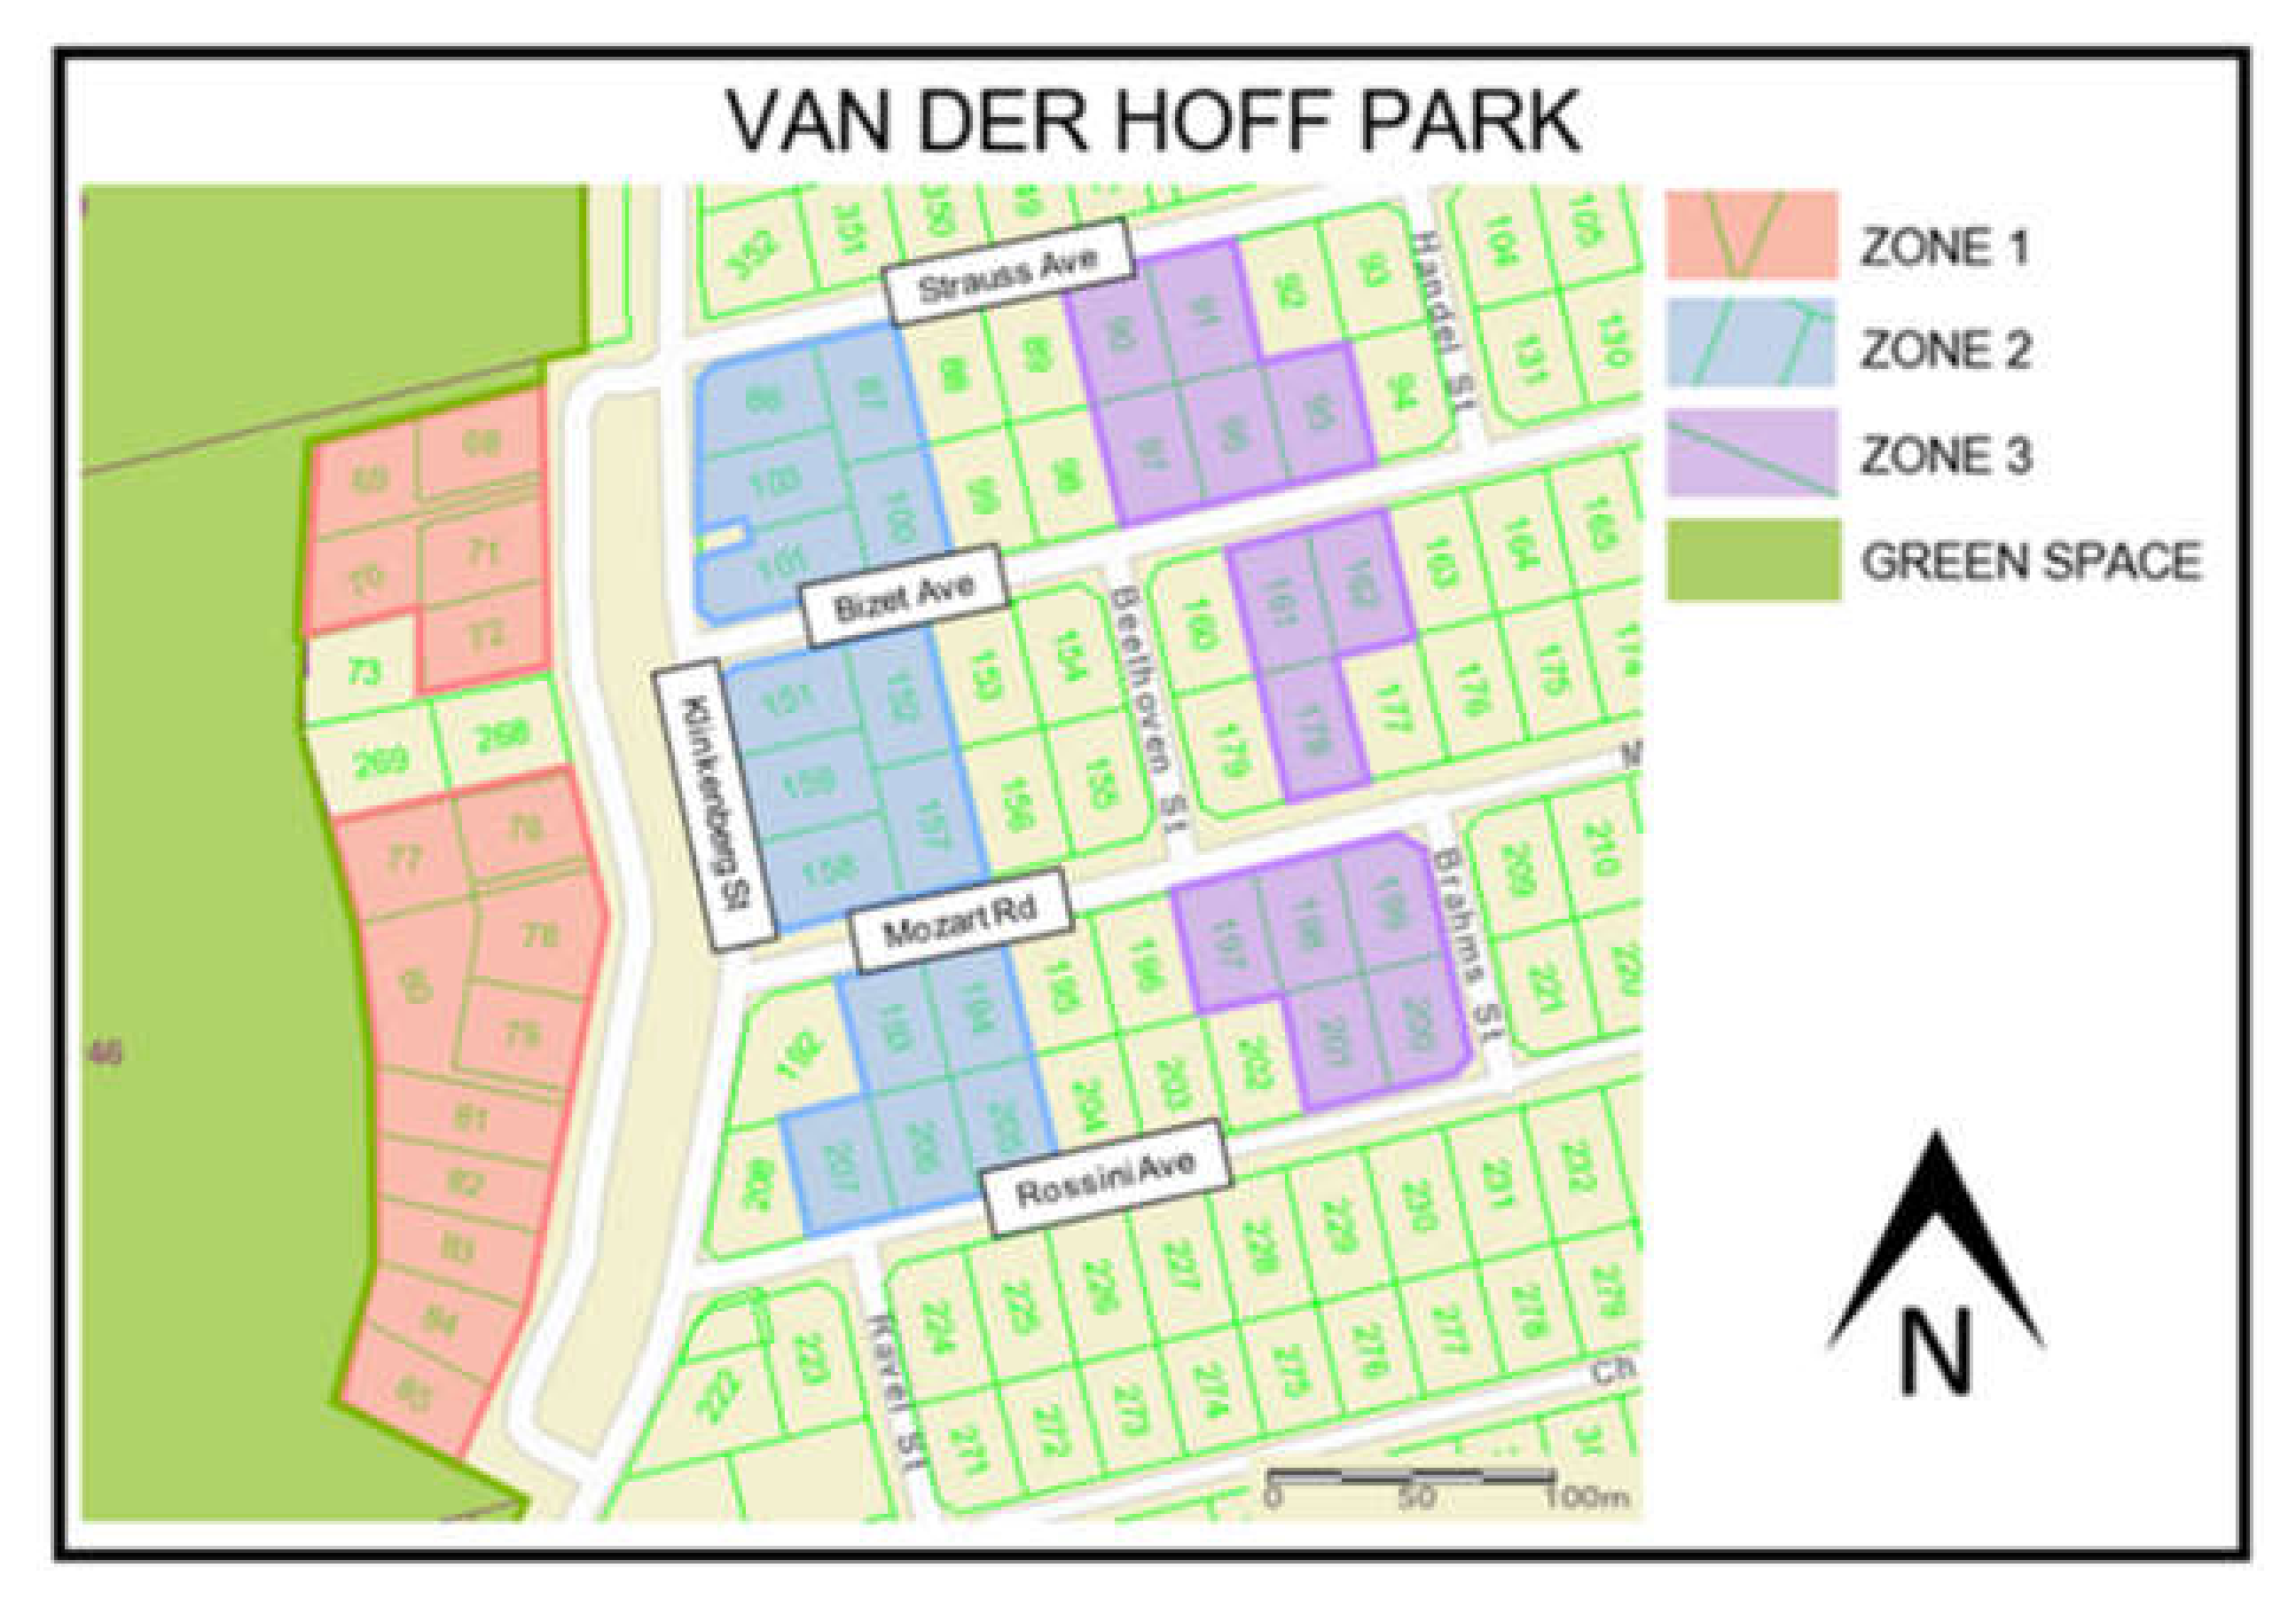
Area B: Van der Hoff Park, situated next to an equestrian open space and wetland.
-
Area C: Potchefstroom Dam Area, situated next to Potch Dam and the surrounding open space.
-
Area D: Heilige Akker, situated adjacent to the Fanie du Toit sports grounds.
-
Area E: Oewersig, situated adjacent to the Mooi River and surrounding open space.
Within each residential area, the selected properties were divided into three zones to test the proximity principle, as illustrated in Figure 2. Zone 1 bordered a UGS, whereas zone 3 was located furthest away from the green the same UGS. Firstly, the property price per square meter was determined by dividing the municipal property values of June 2019 with the total area (in square meters). Thereafter, the mean square meter value per zone in each selected residential area was calculated. Therefore, in each selected residential area, zone 1, zone 2 and zone 3 were assigned a mean ZAR per square meter value that was used to statistically analyse the data. As verified in the international literature, the proximity principle suggests, that zone 1 should present the highest property value [12]. The data obtained from the 2019 Potchefstroom case study were accordingly analysed using three analytical methods including the Analysis of Variance (ANOVA), the Kruskal–Wallis analysis and the Dependent T-test.

2.2. Data Acquisition Part B: Community Survey and Professional Planner Survey

As a refinement on the study conducted by Cilliers and Cilliers [12] and gain further insights on the findings derived from the quantitative investigation, two additional surveys were conducted. The data were collected through two structured questionnaires employing a Likert scale (1 = Fully agree, 2 = Agree, 3 = Not sure, 4 = Disagree and 5 = Fully disagree). The first questionnaire, referred to as the Potchefstroom resident survey, focussed on a sample of Potchefstroom residents and their perceptions and appreciation of green space benefits in Potchefstroom. A total of 74 residents completed the survey. The aim was to understand how communities perceive open spaces in Potchefstroom, as the primary users of these spaces. Data were statistically analysed using Cramer’s V test and cross-tabulations of selected questions. The second questionnaire focussed on the perspectives of a sample of Professional Planners relating to UGS planning in the context of South Africa. The Professional Planner questionnaire focused on green space aspects including the available financial resources (local budgeting) in green space management, community engagement in green space planning, environmental considerations in practice and green space typologies. A total of 26 planners completed the survey where 17 were Professional Planners, 8 were Candidate Planners and 1 was not registered as a planner, but did work in planning practice. Both questionnaires were distributed electronically, and consent was granted by virtue of completion of a questionnaire.

3. Data Analysis and Results

3.1. Data Results Part A: Proximity Principle in Potchefstroom

A verdict on the rejection or acceptance of the proximity principle can be made solely based on the mean ZAR per square meter values obtained for the 3 zones within each residential area; however, the statistical evidence provides credence. In observing the 2019 mean ZAR per square metre for each zone in each area the following could be identified. The mean ZAR per square meter values in four of the five residential areas (Grimbeek Park, Van der Hoff Park, Potchefstroom Dam Area and Heilige Akker) indicated that zone 1 represented the lowest value in ZAR per square meter compared to zone 2 and zone 3. Thus, zone 1 that is located closest to the UGS presented the lowest mean ZAR per square meter value instead of the highest value as suggested by the proximity principle. Zone 3 displayed the highest mean ZAR per square meter value in three of the five residential areas (Grimbeek Park, Van der Hoff Park and Potchefstroom Dam area), the zone furthest away from the green space.
By using the municipal property values of 2019, the mean ZAR per square meter values of each zone within each selected residential area were calculated as mentioned in the previous section. The latter values were used to complete the ANOVA (mean1 – mean 2/max SD, also referred to as the “standardized difference between the means” and Kruskal–Wallis analyses (Z/sqrt(N). The effect sizes presented by the ANOVA and Kruskal–Wallis analyses were used to verify the significance of the results, as the sample sizes did not provide enough power to test for normality, requiring both parametric and the non-parametric tests. Where results differ, the non-parametric test was preferred.
The effect sizes obtained determined whether a practically significant difference was present between zone 1 and zone 2, as well as between zone 1 and zone 3 within each residential area. The effect sizes obtained from analyses were interpreted. A small effect size of 0.2 indicated no practically significant difference, whereas a medium effect size of 0.5 indicated a practically visible difference. A large effect size of 0.8 indicated a practically significant difference [39].
The results showed that the comparison between zone 1 and zone 2 in the respective residential areas delivered an overall medium effect size, thus, a practically visible difference between the mean ZAR per square meter values (≈0.5), as seen in Table 3. Four of the five residential areas indicated a practically visible difference (≈0.5) (Van der Hoff Park, Potchefstroom Dam Area, Heilige Akker and Oewersig), while only one residential area indicated a practically significant difference (≈0.8) (Grimbeek Park). The effect sizes produced by comparing zone 1 and zone 3 in the respective residential areas delivered an overall visible (≈0.5) to a significant difference (≈0.8) (Table 3). Two residential areas presented a practically significant difference (≈0.8) (Grimbeek Park and Van der Hoff Park) and another two residential areas delivered a practically visible difference (≈0.5) (Potchefstroom Dam Area and Oewersig). Only one residential area presented no practically significant difference between zone 1 and zone 3 (≈0.2) (Heilige Akker).
The effect sizes indicated an overall medium to large effect size (≈0.5/≈0.8), indicating a visible difference to practical significant difference between the mean ZAR per square meter values of zone 1 and the zones further away from the green space. Zone 1 also presented values lower than the zones further away from the green space, refuting much of the existing research on the positive impact of UGS on property value. The proximity principle was thus rejected, with the statistical analyses supporting the data showing a medium to large differences between values. Thus, in the case study a more proximate location to a UGS did not indicate an increase in property value, but showed an inverse effect.
The data from Cilliers and Cilliers (2015) [12] were statistically compared to the data obtained in the 2019 Potchefstroom case study, as captured in Table 4. The effect sizes obtained from the Dependent T-test, once again, indicated whether a practically significant difference existed between the data. The effect sizes presented a practically significant difference between the mean ZAR per square meter values (effect size of ≈ 0.8/0.5). The latter was clear by observing the old and new mean ZAR per square meter values in Table 4. Property values increased between 2015 and 2019 by 68% in Grimbeek Park, 35% in Van der Hoff Park, 55% in the Potchefstroom Dam area, 46% in Heilige Akker and 45% in Oewersig, thus presenting an aggregate increase on average of almost 50%. Various potential factors could have led to the increase in property values identified from 2015 to 2019. Inflation was a potential factor as the Consumer Price Index (CPI) increased from 5.78% in 2013 to 6.59% in 2016 and decreased, thereafter, to 4.25% in 2019 [40]. Other factors influencing property value in South Africa, according to the Absa residential property market database, include migration trends, security issues, income levels, employment, monetary and fiscal policies, investment returns, the condition of the property and foreign property buying of South African properties [41].

3.2. Data Results Part B: Community Survey and Professional Planner Survey

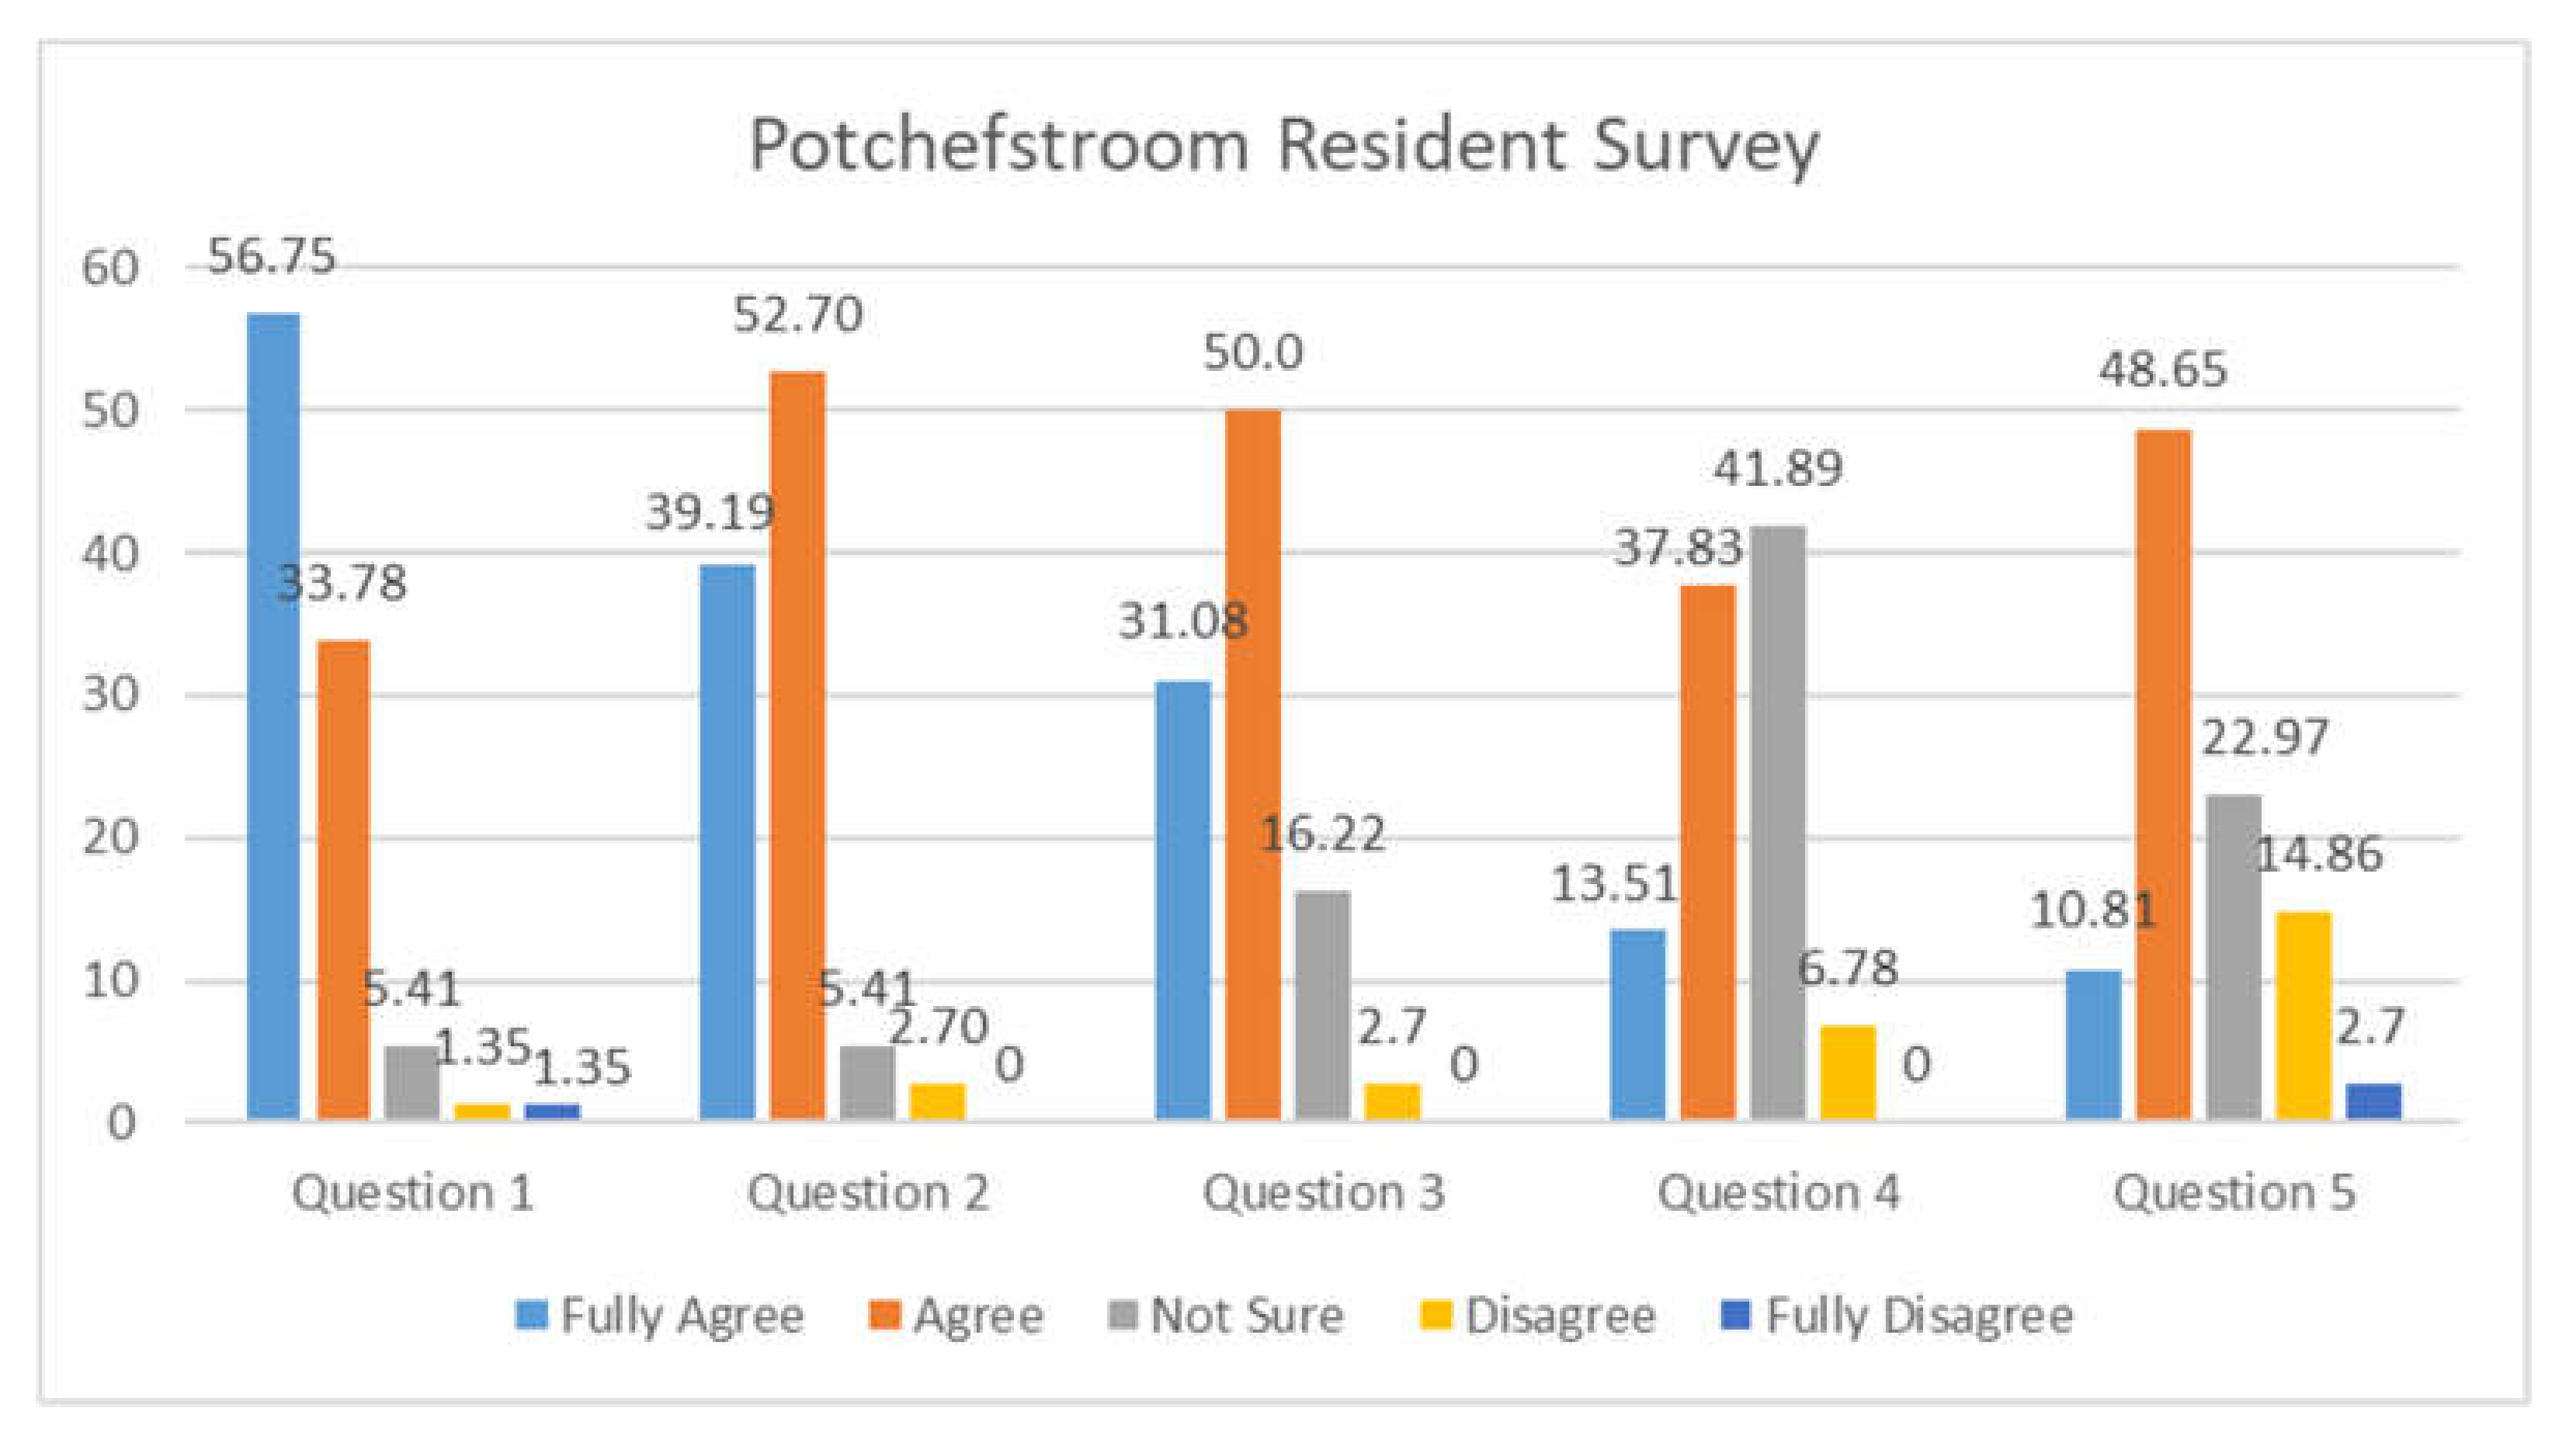
3.2.1. Potchefstroom Resident Survey

The results obtained from the survey indicated that the sample of Potchefstroom residents recognise the social, environmental and economic value of green spaces; however, fewer residents recognise the economic value of green spaces. Question 4 focused on the residents’ perceptions of green spaces in Potchefstroom, referring to safety matters. A total of 52% of respondents agreed that green spaces in Potchefstroom are perceived as crime hotspots, thus, contributing to unsafe neighbourhoods and indicating a related ecosystem disservice (cross-reference to Section 2.2). A total of 60% of respondents agreed that they would pay more for a property that is located next to a green space in Question 5; however, many residents were unsure or disagreed. Interestingly, some residents who perceived green spaces as crime hotspots in Question 4, still agreed that they would be willing to pay more for a property that is located next to green space (Figure 3).
As a result of the answers to Question 4 and 5, in recognition of the ecosystem disservices linked to the South African and Potchefstroom contexts, a cross-tabulation were conducted as part of the analysis, in an attempt to further clarify findings: Question 4 (Urban green spaces are perceived as crime hot spots) was cross-tabulated with Question 5 (I would pay more for a property because it is located next to an urban green space). The cross-tabulation was completed with 74 valid cases and a medium practical significant difference as the Cramer’s V test value was V = 0.287 (V≈0.3) was presented. Thus, findings supported the observation that although certain residents perceived UGSs as crime hotspots (ecosystem disservices), they residents are still willing to pay more for a property is located next to an UGS.

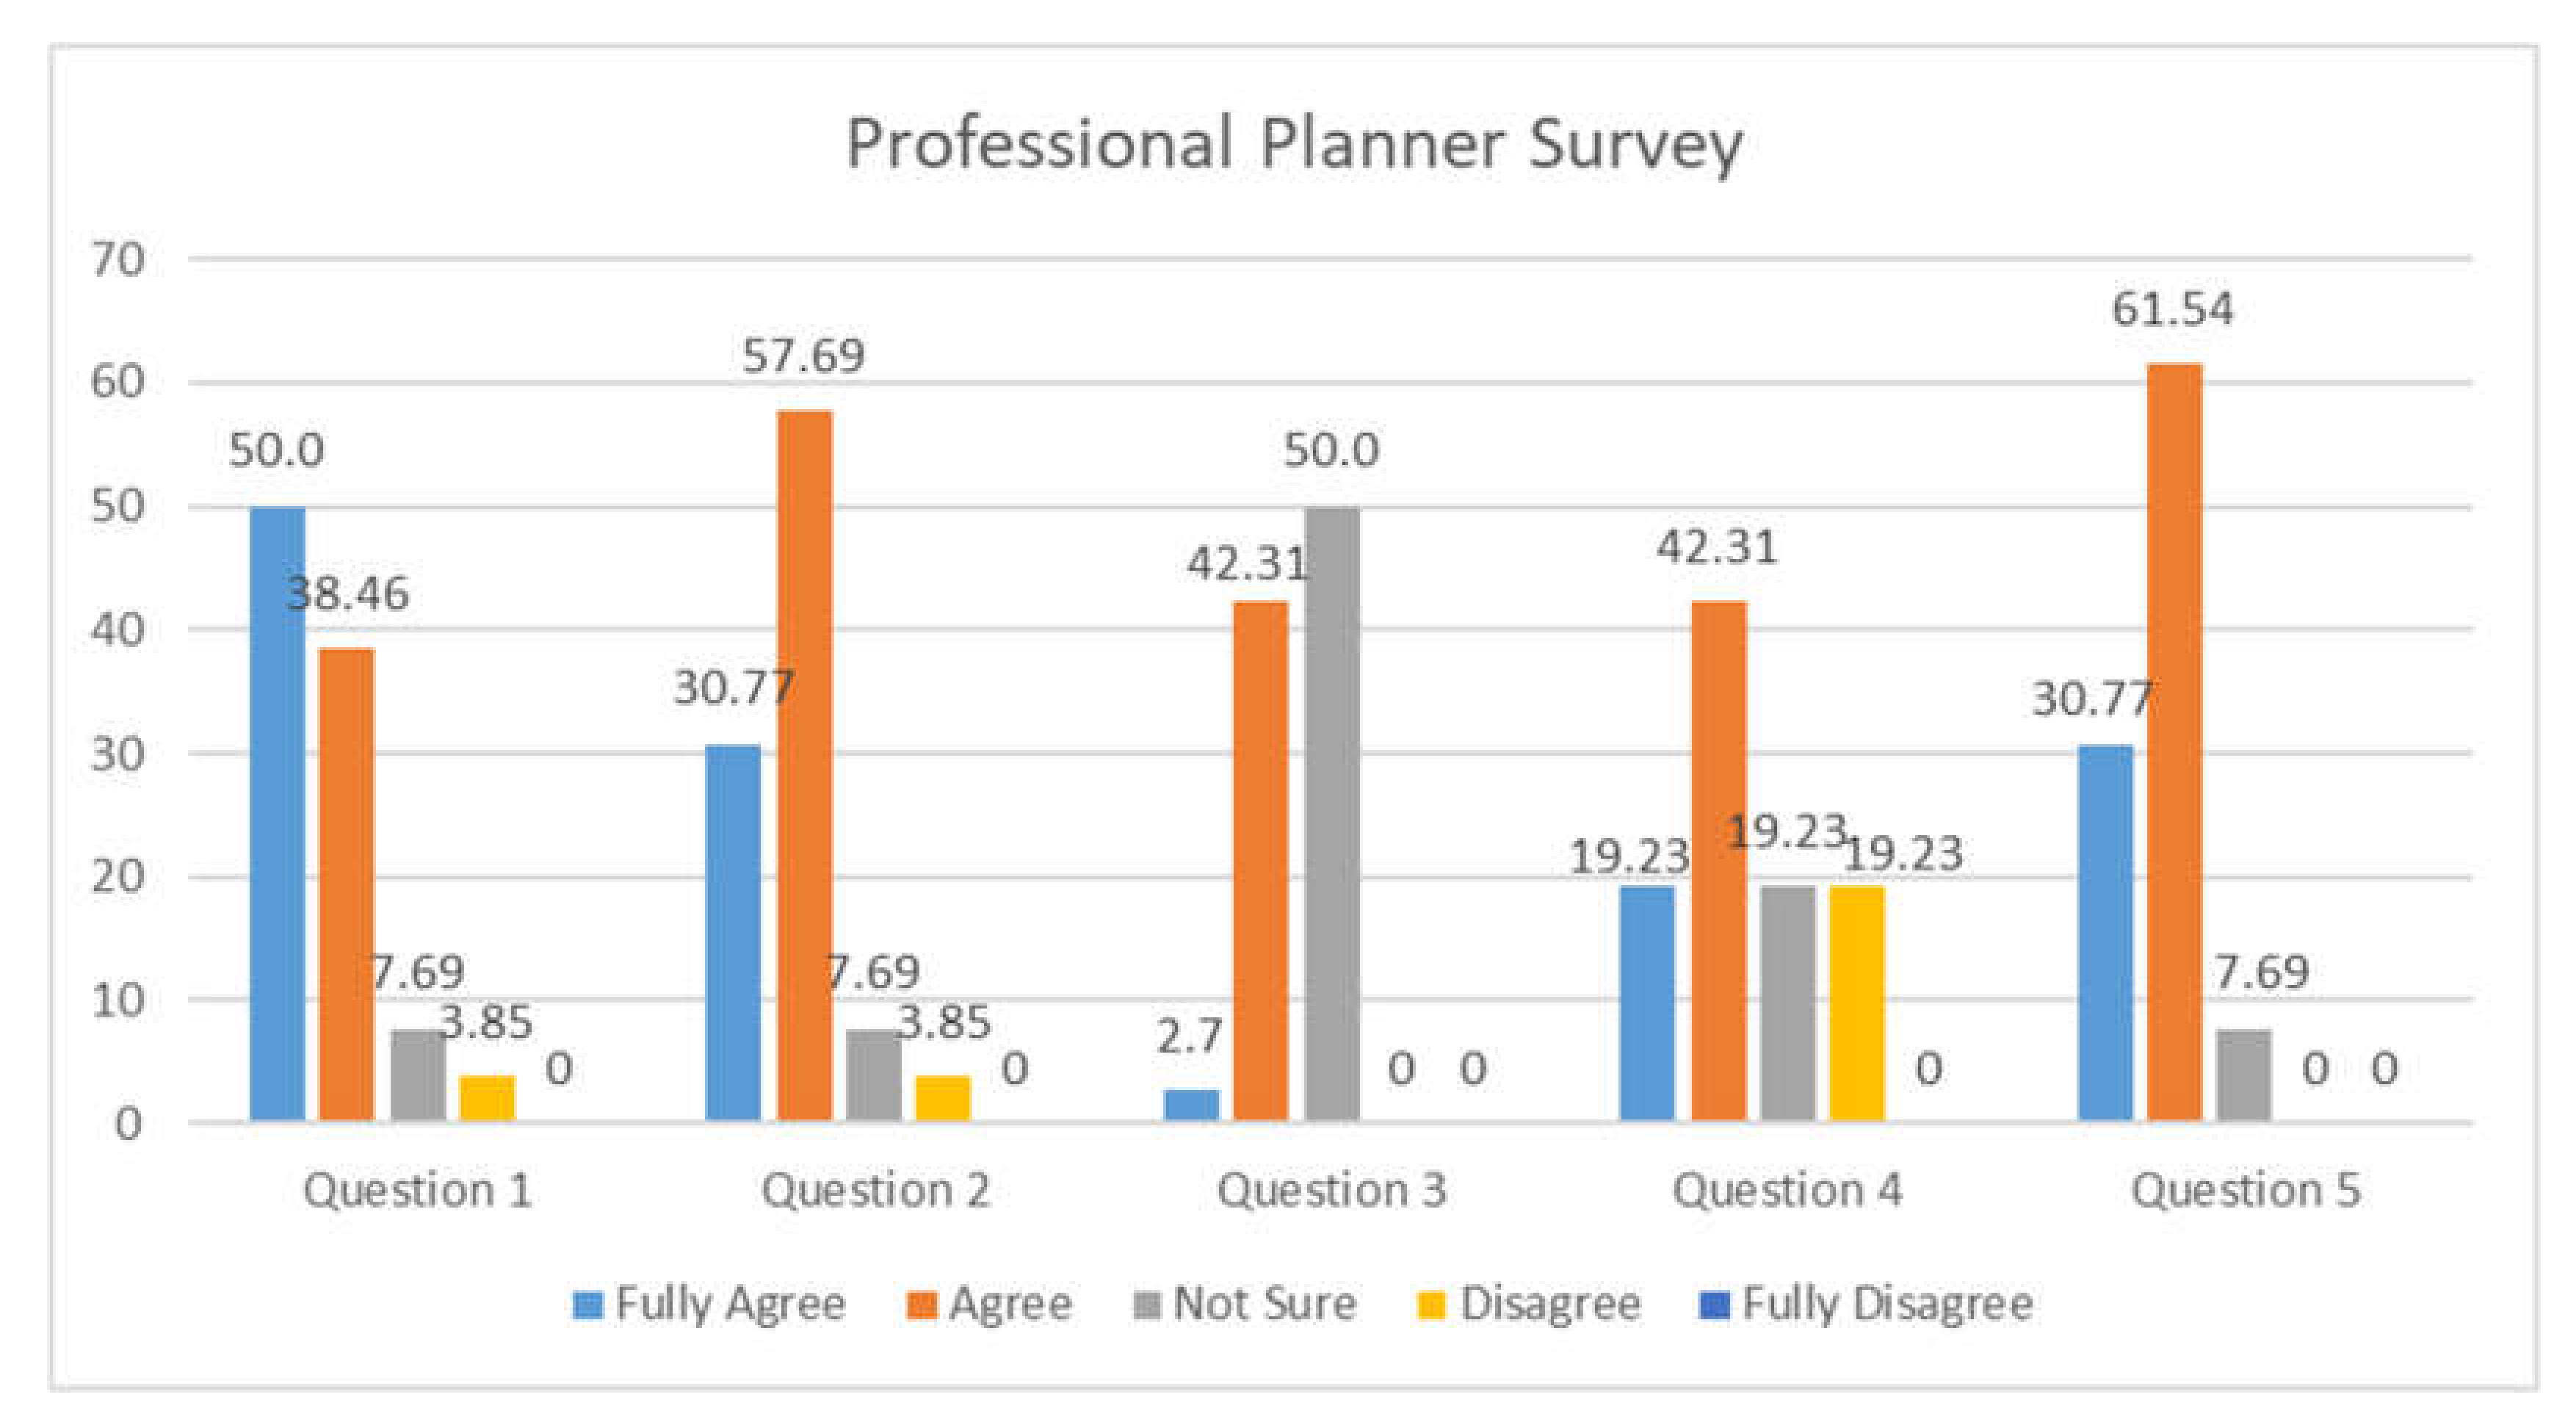
3.2.2. Professional Planner Survey

The results of Question 1 and Question 2, as shown in Figure 4, both indicated that 88% of the planners agreed that unattractive green spaces are due to a lack of maintenance by local authorities and a lack of community engagement. Question 3 delivered interesting results as 50% of respondent planners agreed that environmental considerations are not prioritised in the planning process; however, the other 50% were either unsure or disagreed that environmental considerations are not prioritised in the planning process Question 4 of the survey focussed on local budgeting for green space planning and indicated that only 62% of respondents agreed with the statement that green spaces are not prioritised in local budgeting. A total of 38% of the planners were either unsure or disagreed that green spaces are not prioritised in local budgeting. The majority of planner respondents reported being familiar with green space typologies (92%).

4. Conclusions

The challenges pertaining to green spaces within urban environments, as captured in the literature review, were also evident from the empirical investigation and local case study. Despite the theoretically recognised values and benefits linked to green spaces, the economic value thereof is still underestimated to a large extent in the South African context [16].
According to international case studies, as discussed in Section 1.3, UGSs can have a positive influence on proximate property value [6]. The proximity principle may hold true in the global North planning context, but was rejected in the Potchefstroom case study in 2015 [12] and 2019. In the Potchefstroom case most properties located further away from a UGS in the purposefully selected residential areas indicated a higher value in ZAR (South African Rand) per square meter in comparison to properties located adjacent to said UGS. Both the 2015 and 2019 case studies thus delivered contrasting results compared to the findings in international literature. From these findings it was evident that the proximity principle could not be applied to all contexts, indicating the need to consider context in the planning of UGSs.
The Professional Planner survey investigated perceptions of green spaces, from the perspective of a sample of South African Professional Planners, in attempt to gain insight into planning practice in the South African context. This survey indicated that a lack of maintenance, community engagement and efficient local budgeting are the core challenges inhibiting UGS planning approaches. Half of the planners included in the survey stated that environmental considerations are not prioritised in the planning process, even though Environmental Management is considered a crucial component of local Urban Planning approaches, policy and legislative frameworks. The latter findings questioned the extent to which the environment is prioritised in mainstream Urban Planning and emphasised the opportunities for more comprehensive, trans-disciplinary planning approaches going forward.
Even though the proximity principle was rejected for the Potchefstroom case study, and that Professional Planners indicated that environmental considerations are under-prioritized from a planning perspective, the local resident survey revealed a certain level of recognition of the importance of green spaces.
The Potchefstroom resident survey investigated local perceptions towards green spaces, in an attempt to further understand the challenges and needs pertaining to green space planning in Potchefstroom for a participatory perspective. The survey indicated that the majority of respondents recognise the environmental and social values of green spaces, and to a lesser extent the economic value of green spaces. The majority of residents are willing to pay more for a property that is located next to green space, indicating that the residents perceive green spaces benefits as valuable (willingness to pay), regardless of the ecosystem disservices associated with UGSs (poorly maintained green spaces and crime hotspots). Thus, from a community perspective, green space value should be prioritised. Preliminary results indicate a discrepancy between community perspectives, the provision of green spaces within the local context, and economic valuation to support such initiatives.

5. Recommendations

5.1. Future In-Depth Research Based on This Paper’s Preliminary Findings

As the 2019 data confirmed the trends established in 2015 regarding the rejection of the proximity principle in the Potchefstroom case study, it is recommended that comparable research be conducted in various locations around South Africa to provide further clarification on the generalisability of the research premise. Such investigations could consider the influence of specific UGS characteristics and differentiation in socio-economic gradients [19] on the proximity principle. The results of the Potchefstroom resident survey, in addition to the emphasis placed on stakeholder engagement in the literature, further call for future research on the proximity principle to include community surveys to deepen understanding. Such approaches could include qualitative investigations in the form of interviews and focus group discussions with proximate communities to triangulate findings. Participatory planning strategies can be crucial in ensuring long-term returns on investments in UGSs and should thus be included in both research and practice.

5.2. Municipal Valuations Should be Reviewed

If residents are indeed willing to pay more for properties located next to UGS as the preliminary survey data suggests, local authorities should consider investing in UGSs (following stakeholder engagement processes) and revise municipal valuation of proximate residential properties in accordance. Such adjustments could result in increases in property tax revenue to reinvest in UGSs to enhance indirect benefits derived from ecosystem services and address ecosystem disservices.
The latter may build a compelling argument to convince local municipalities, private investors and the community to invest in UGSs. This may influence decision-making processes regarding policy formulation to promote environmental protection, green space planning and environmental management within cities.

5.3. Enhance Both the Quality and Quantity of Green Spaces

The quality of green spaces could be enhanced by implementing green planning initiatives as part of broader green infrastructure planning approaches [35]. As dense urban centres do not have adequate space available for development, revitalisation may be considered. The quantity and quality of green spaces within dense urban centres may be increased and improved by compact city and mixed-use planning approaches where green spaces are prioritised as a land use requirement. Local budgeting, maintenance and public participation are also aspects that may ensure that the quality of green spaces is enhanced as the issues regarding ecosystem disservices of green spaces will be addressed. An increase in the quality of green spaces may result in more economic benefits. The latter aspects will be discussed in the next section. Further research may be conducted that investigate the quality and economic benefits of private open spaces, such as gardens in contrast with the quality and economic benefits of public open spaces. The approaches will include “willingness to pay” for amenities, services, green space benefits and properties close to a UGS (stated preference approach) and the impact of the UGS on property value (revealed preference approach). The results will determine whether functional green spaces with high quality have more economic benefits.

5.4. Prioritise Environmental Considerations in Mainstream Urban Planning

Green space planning should be emphasised in the local context and Professional Planners should collaborate with local authorities to prioritise green space planning in local budgeting. Planning practice should consider participatory planning approaches that include the active involvement of the public specifically in UGS planning. This calls for trans-disciplinary planning approaches. Ecosystem services and disservices should play a more prominent part within urban planning, in an attempt to enhance green space quality and increase the economic benefits. Land Use Schemes (LUS) of local municipal areas could be amended to accommodate, not only the minimum green space provision requirements in applications but also mixed-use zonings. Mixed-use developments may increase the quantity and enhance the quality of green spaces. Mixed-use developments ensure that various land uses similar to residential, business and green spaces are included in a single development [42]. Currently, local authorities follow an approach to development where green spaces are perceived as potential areas for development (cross-reference to Professional Planner survey). Local planning should follow an approach to development that encourages the protection of green spaces and natural systems, rather than the development of these areas.

5.5. A Broader Spatial Planning Approach

It is crucial to determine and provide evidence of the economic benefits of green spaces to ensure that green space planning is prioritised in the local context. Therefore, it should form part of a broader spatial planning approach. The Spatial Development Frameworks (SDF) of each local municipality should include a section that discusses green spaces in economic terms and what is aimed to be achieved in terms of environmental management and green space planning in the future and such should be supported by the Spatial Planning and Land Use Management Act (Act 16 of 2013) [43]. To measure the quality of green spaces, the stated preference and revealed preference approach may be considered. The stated preference approach includes “willingness to pay” that determines what residents are willing to pay for amenities, services, green space benefits and for properties that are located adjacent to green space. The revealed preference approach includes the proximity principle as a hedonic price analysis method, as employed in the 2019 Potchefstroom case study of this research paper (cross-reference to Section 2). The proximity principle may be used as an indicator of the economic benefits of green spaces by determining how green spaces influence property value in different urban areas including public open spaces, private open spaces and neighbourhoods of different social status (the socio-economic gradient). Areas that indicate a green space with a higher economic value (approved proximity principle) may indicate what functions and characteristics should be prioritised to increase the economic benefits of green spaces in other areas. When attempting to valuate green spaces in economic terms, six important aspects should be considered including market value (green space impact on property value), enhancement value (green space influence on adjacent land), production value (contribution to production referring to resources), natural systems value (urban biodiversity and ecosystems), direct and indirect value (social, environmental and economic benefits) and intangible value (how people perceive green spaces referring to ethics, knowledge and opinions) [44].

5.6. Focus on Context-Based Planning

Further research may be conducted on the impact of green spaces on property values along a socio-economic gradient as this may influence residents’ perceptions of the value of urban green areas, especially where environmental inequity is a reality [19]. Contrasting results may indicate the importance to plan in context. The current research mentioned the difference in planning contexts of Global North and Global South countries, as the proximity principle holds true in the Global North context, but is rejected in the local context of Potchefstroom, South Africa (cross-reference to Section 2). To plan according to context, a shift in planning approaches will be required. Local communities should participate in planning on a high and empowering level. For local municipalities to shift towards context-/community-based planning, legislative transformation will be required that will support planners in active community engagement and encourage planners to consider context-based planning. Nature and the environment, basic human rights, should be prioritised in urban planning approaches, in an attempt to reclaim nature in cities.

Author Contributions

All authors have read and agree to the published version of the manuscript. Supervision, E.J.C., L.L. and S.C.; Writing—original draft, Z.C.

Funding

This research was funded by National Research Foundation South Africa, grant number 116243.

Acknowledgments

This research is supported in part by the National Research Foundation of South Africa (Grant Numbers: 116243).

Conflicts of Interest

The authors declare no conflict of interest.

References

  1. Cilliers, E.J.; Timmermans, W. An Integrative Approach to Value-Added Planning: From Community Needs to Local Authority Revenue. Growth Chang. 2015, 46, 675–687. [Google Scholar] [CrossRef]
  2. Bolund, P.; Hunhammar, S. Ecosystem services in urban areas. Ecol. Econ. 1999, 29, 293–301. [Google Scholar] [CrossRef]
  3. Gómez-Baggethun, E.; Gren, A.; Barton, D.N.; Langemeyer, J.; McPhearson, T.; O’Farrell, P.; Andersson, E.; Hamstead, Z.; Kremer, P. Urbanization, Biodiversity and Ecosystem Services: Challenges and Opportunities; Springer: London, UK, 2013; pp. 175–251. [Google Scholar]
  4. O’Brien, E. Social housing and green space: A case study in Inner London. Forestry 2006, 79, 535. [Google Scholar] [CrossRef] [Green Version]
  5. Cilliers, J.; Timmermans, W. Approaching value added planning in the green environment. J. Place Manag. Dev. 2013, 6, 144–154. [Google Scholar] [CrossRef]
  6. Cilliers, E.J. Rethinking Sustainable Development: The Economic Value of Green Spaces. PhD. Thesis, North-West University, Potchefstroom, South Africa, 2010. [Google Scholar]
  7. Vandermeulen, V.; Verspecht, A.; Vermeire, B.; Van Huylenbroeck, G.; Gellynck, X. The use of economic valuation to create public support for green infrastructure investments in urban areas. Landsc. Urban Plan. 2011, 103, 198–206. [Google Scholar] [CrossRef]
  8. Melichar, J.; Vojáček, O.; Rieger, P.; Jedlička, K. Measuring the value of urban forest using the Hedonic price approach. Reg. Stud. 2009, 2, 13–20. [Google Scholar]
  9. Klimas, C.; Williams, A.; Hoff, M.; Lawrence, B.; Thompson, J.; Montgomery, J. Valuing ecosystem services and disservices across heterogeneous green spaces. Sustainability 2016, 8, 853. [Google Scholar] [CrossRef] [Green Version]
  10. Nicholls, S.; Crompton, J.L. The impact of greenways on property values: Evidence from Austin, Texas. J. Leis. Res. 2005, 37, 321–341. [Google Scholar] [CrossRef]
  11. Czembrowski, P.; Laszkiewicz, E.; Kronenberg, J.; Engström, G.; Andersson, E. Valuing individual characteristics and the multifunctionality of urban green spaces: The integration of sociotope mapping and hedonic pricing. PLoS ONE 2019, 14, 1–16. [Google Scholar] [CrossRef]
  12. Cilliers, S.; Cilliers, J. From green to gold: A South African example of valuing urban green spaces in some residential areas in Potchefstroom. Town Reg. Plan. 2015, 67, 1–12. [Google Scholar]
  13. Girma, Y.; Terefe, H.; Pauleit, S.; Kindu, M. Urban green spaces supply in rapidly urbanizing countries: The case of Sebeta Town, Ethiopia. Remote Sens. Appl. Soc. Environ. 2019, 13, 138–149. [Google Scholar] [CrossRef]
  14. Wolch, J.R.; Byrne, J.; Newell, J.P. Urban green space, public health, and environmental justice: The challenge of making cities ‘just green enough’. Landsc. Urban Plan. 2014, 125, 234–244. [Google Scholar] [CrossRef] [Green Version]
  15. du Toit, M.J.; Cilliers, S.S.; Dallimer, M.; Goddard, M.; Guenat, S.; Cornelius, S.F. Urban green infrastructure and ecosystem services in sub-Saharan Africa. Landsc. Urban Plan. 2018, 180, 249–261. [Google Scholar] [CrossRef]
  16. Schäffler, A.; Swilling, M. Valuing green infrastructure in an urban environment under pressure—The Johannesburg case. Ecol. Econ. 2013, 86, 246–257. [Google Scholar] [CrossRef]
  17. Cilliers, J. Economic value of green spaces: South Africa in contrast with Europe. Acta Acad. 2013, 45, 1–27. [Google Scholar]
  18. Lategan, L.G.; Cilliers, E.J. The value of public green spaces and the effects of South Africa’s informal backyard rental sector. WIT Trans. Ecol. Environ. 2014, 191, 427–438. [Google Scholar]
  19. Lubbe, C.S.; Siebert, S.J.; Cilliers, S.S. Political legacy of South Africa affects the plant diversity patterns of urban domestic gardens along a socioeconomic gradient. Sci. Res. Essays 2010, 5, 2900–2910. [Google Scholar]
  20. Kabisch, N.; Korn, H.; Stadler, J.; Bonn, A. Nature-based Solutions to Climate Change Adaptation in Urban Areas: Theory and Practice of Urban Sustainability Transitions; Springer: Cham, Switzerland, 2017; p. 215. [Google Scholar]
  21. Cilliers, E.J. Urban green compensation. Int. J. Green Econ. 2012, 6, 346–356. [Google Scholar] [CrossRef]
  22. Biao, Z.; Gaodi, X.; Bin, X.; Canqiang, Z. The effects of public green spaces on residential property value in Beijing. J. Resour. Ecol. 2012, 3, 243–253. [Google Scholar] [CrossRef]
  23. Funmilayo, O.A.; Adegboyega, S.A.; Orimoogunje, O.O.; Banjo, O.O. Population growth: Implications for environmental sustainability. IFE Psychol. Int. J. 2011, 19, 56–69. [Google Scholar]
  24. Simpeh, K.; Smallwood, J. Analysis of the benefits of green building in South Africa. J. Constr. Proj. Manag. Innov. 2018, 8, 1829–1851. [Google Scholar]
  25. Elmqvist, T.; Setälä, H.; Handel, S.N.; Van der Ploeg, S.; Aronson, J.; Blignaut, J.N.; Gömez-Baggethun, E.; Nowak, D.J.; Kronenberg, J.; De Groot, R. Benefits of restoring ecosystem services in urban areas. Curr. Opin. Environ. Sustain. 2015, 14, 101–108. [Google Scholar] [CrossRef] [Green Version]
  26. Silvennoinen, S.; Setälä, H.; Taka, M.; Koivusalo, H.; Yli-Elkonen, V.; Ollikainen, M. Monetary value of urban green space as an ecosystem service provider: A case study of urban runoff management in Finland. Ecosyst. Serv. 2017, 28, 17–27. [Google Scholar] [CrossRef] [Green Version]
  27. Tyrväinen, L.; Väänänen, H. The economic value of urban forest amenities: An application of the contingent valuation method. Landsc. Urban Plan. 1998, 43, 105–118. [Google Scholar] [CrossRef]
  28. Ives, C.D.; Oke, C.; Hehir, A.; Gordon, A.; Wang, Y.; Bekessy, S.A. Capturing residents’ values for urban green space: Mapping, analysis and guidance for practice. Landsc. Urban Plan. 2017, 161, 32–43. [Google Scholar] [CrossRef] [Green Version]
  29. de Wit, M.; van Zyl, H.; Crookes, D.; Blignaut, J.; Jayiya, T.; Goiset, V.; Mahumani, B. Including the economic value of well-functioning urban ecosystems in financial decisions: Evidence from a process in Cape Town. Ecosyst. Serv. 2012, 2, 38–44. [Google Scholar] [CrossRef]
  30. Lategan, L.; Cilliers, J. Considering urban green space and informal backyard rentals in South Africa: Disproving the compensation hypothesis. Town Reg. Plan. 2016, 69, 1–6. [Google Scholar] [CrossRef] [Green Version]
  31. Cilliers, S.; Cilliers, J.; Lubbe, R.; Siebert, S. Ecosystem services of urban green spaces in African countries—perspectives and challenges. Urban Ecosyst. 2013, 16, 681–702. [Google Scholar] [CrossRef]
  32. Van Leeuwen, E.; Nijkamp, P.; de Noronha Vaz, T. The multifunctional use of urban greenspace. Int. J. Agric. Sustain. 2010, 8, 20–25. [Google Scholar] [CrossRef] [Green Version]
  33. Panduro, T.E.; Veie, K.L. Classification and valuation of urban green spaces—A hedonic house price valuation. Landsc. Urban Plan. 2013, 120, 119–128. [Google Scholar] [CrossRef]
  34. Daams, M.N.; Sijtsma, F.J.; van der Vlist, A.J. The effect of natural space on nearby property prices: Accounting for perceived attractiveness. Land Econ. 2016, 92, 389–410. [Google Scholar] [CrossRef]
  35. Cilliers, E.J.; Timmermans, W.; Van den Goorbergh, F.; Slijkhuis, J. Green Place-making in Practice: From Temporary Spaces to Permanent Places. J. Urban Des. 2015, 20, 349–366. [Google Scholar] [CrossRef]
  36. Haaland, C.; Van den Bosch, C.K. Review: Challenges and strategies for urban green-space planning in cities undergoing densification: A review. Urban For. Urban Green. 2015, 14, 760–771. [Google Scholar] [CrossRef]
  37. Adegun, O.B. Residents’ relationship with green infrastructure in Cosmo City, Johannesburg. J. Urban 2018, 11, 329–346. [Google Scholar] [CrossRef]
  38. Dempsey, N.; Burton, M. Defining place-keeping: The long-term management of public spaces. UrbanForestry Urban Green. 2012, 11, 11–20. [Google Scholar] [CrossRef]
  39. Ellis, S.M.; Steyn, H.S. Practical significance (effect sizes) versus or in combination with statistical significance (p-values). Manag. Dyn. 2003, 12, 51–53. [Google Scholar]
  40. Inflation.eu. Available online: https://www.inflation.eu/inflation-rates/south-africa/historic-inflation/cpi-inflation-south-africa-2013.aspx (accessed on 29 August 2019).
  41. Luüs, C. The Absa Residential Property Market Database for South Africa - Key Data Trends and Implications. Available online: https://www.bis.org/publ/bppdf/bispap21l.pdf (accessed on 5 June 2020).
  42. Hill Country News. Available online: http://hillcountrynews.com/stories/new-mixed-use-development-planned-in-cedar-park,78057 (accessed on 10 October 2019).
  43. South Africa. Spatial Planning and Land Use Management Act; Act 16 of 2013, Gazette 36730 South Africa; South African Government: Cape Town, South Africa, 2013.
  44. Tekel, A.; Akbarishahabi, L. Determination of Open-green Space’s Effect on Around House Prices by Means of Hedonic Price Model; in Example of Ankara/Botanik Park. Gazi Univ. J. Sci. 2013, 26, 347–361. [Google Scholar]
Figure 1. The five selected residential areas in Potchefstroom.
Land 09 00235 g001
Figure 2. Zone 1 to 3 within area B, Van der Hoff Park.
Land 09 00235 g002
Figure 3. Potchefstroom resident survey results. Question 1: Urban green spaces have environmental value; Question 2: Urban green spaces have social value; Question 3: Urban green spaces have economic value; Question 4: Urban green spaces are perceived as crime hot spots in Potchefstroom; Question 5: I would pay more for a property because it is located next to an urban green space.
Land 09 00235 g003
Figure 4. Professional Planner survey results. Question 1: Unattractive urban green spaces are the result of a lack of maintenance by local authorities; Question 2: Unattractive urban green spaces are the result of a lack of community engagement; Question 3: Environmental considerations are not prioritised in the planning process; Question 4: Environmental considerations are not prioritised in local budgeting; Question 5: I am familiar with green space typologies.
Land 09 00235 g004
Table 1. Summary of green space benefits and related ecosystem services.
UGS Benefit CategoriesType of Ecosystem Service or BenefitsExamples of Benefits and Services
Environmental (indirect benefits)Regulating servicesImproved air and water quality, reduction of urban heat island effect, regulating urban temperature, moderating extreme events such as flooding, waste water treatment, erosion control, pollination, biological control
Supporting servicesEnhancing urban biodiversity (presence of suitable urban habitats), conservation of natural ecosystems
Provisioning servicesProtection and restoration of natural resources to provide water, food and medicine
Social (indirect benefits)Cultural servicesImproves mental and physical health, aesthetic value of dense urban centres, encourages social cohesion, promotes sense of place, strengthens historical and cultural values
Economic (direct benefits)Economic benefitsReplacement of expensive conventional and technical environmental management systems (e.g., storm water management), water retention, microclimate regulation through green spaces and areas of permeable surfaces, pollution reduction, physical and physiological health benefits, increase in property value (“willingness to pay” of property buyers), increase in property tax returns of municipalities, increases the marketability of a city
Sources. [3,5,6,12,15,24,25,26,27].
Table 2. Summary of ecosystem disservices.
CategoryGeneral ExampleSouth African Example
EcologicalInvasive species that outcompete indigenous species, change in species interactions and populations, change in abiotic species variables, decrease in air quality due to production on volatile organic compounds (VOC’s)Similar to general examples
Social (negative impact on human wellbeing)Security concerns, negative health impact (allergic reaction to VOC’s and pollen), high levels of noise, unpleasant due to exposure to the elements (excessive winds), safety hazard (tree falls), poisonous plants and pestsUnsafe (frequent criminal activity and drug trade), aesthetically unpleasing due to a lack of maintenance and littering, unappealing and nuisance, initial plan for land use not followed through (play area for children)
Economic and financialDamage to infrastructure (tree roots), maintenance costs, promoting accessibility to green spaceSensitive approaches to green space planning in low-income areas to address ecosystem disservices, fragmented town and cities due to apartheid era resulted in lower-income groups being located far away from green spaces with high transportation cost to access green spaces and child friendly areas.
Sources. [28,30,31].
Table 3. ANOVA and Kruskal–Wallis statistical analysis (2019).
AreaZoneN (188)R/m2ANOVA Effect SizesKruskal-Wallis Effect SizesANOVA p-ValuesKruskal-Wallis p-Values
a ≈ 0.2 small
(No practically sig. diff.)
b ≈ 0.5 medium
(Practically visible diff.)
c ≈ 0.8 large
(Practically sig. diff.)
a ≈ 0.1 small
(No practically sig. diff.)
b ≈ 0.3 medium
(Practically visible diff.)
c ≈ 0.5 large
(Practically sig. diff.)
Statistically significant difference between the means
(p ˂ 0.05)
Statistically significant difference between the groups
(p ˂ 0.05)
1 with…2 with…1 with…2 with…
Grimbeek Park1141260.700.00020.0006
2141611.671.19 c0.54 c
3131699.251.63 c0.30 a0.68 c0.23 b
Van der Hoff Park1151290.590.0150.005
2151472.430.53 b0.38 b
3131624.300.98 c0.54 b0.58 c0.27 b
Potchefstroom Dam Area191116.440.3960.237
291303.450.53 b0.43 c
391448.640.44 b0.19 a0.26 b0.09 a
Heilige Akker1101751.960.6410.640
2121904.150.42 b0.17 a
3141850.280.24 a0.13 a0.07 a0.15 a
Oewersig1141668.440.1050.052
2141852.150.44 b0.26 b
3131549.200.36 b0.72 c0.23 b0.45 c
Table 4. Dependent T-test statistical analysis.
AreaZoneN (188)R/m2
Old
R/m2
New
% Increase between Old and NewEffect SizesDependent T-Test
a ≈ 0.2 small
b ≈ 0.5 medium
c ≈ 0.8 large
Statistically significant difference between Old and New
(p ˂ 0.05)
Area A:
Grimbeek Park
114798.201260.7068%1.130.006
214953.121611.671.640.001
313974.761699.250.690.011
Area B:
Van der Hoff Park
115938.291290.5935%1.950.0001
2151105.071472.432.230.0001
3131202.561624.302.690.0001
Area C:
Potchefstroom Dam Area
19718.971116.4455%1.880.0001
29843.411303.451.360.0001
39925.291448.641.470.0001
Area D:
Heilige Akker
1101114.231751.9646%1.750.0001
2121413.521904.151.330.0001
3141238.361850.281.390.0001
Area E:
Oewersig
1141079.501668.4445%1.030.0001
2141292.091852.151.540.0001
3131120.301549.201.510.0001

