The Contemporary Economic Costs of Spatial Chaos: Evidence from Poland
by
 ,
,
Przemysław Śleszyński
1,* ,
,
Adam Kowalewski
2,
Tadeusz Markowski
3,
Paulina Legutko-Kobus
4 and
Maciej Nowak
5 1
Institute of Geography and Spatial Organization, Polish Academy of Sciences, 00-818 Warsaw, Poland
2
The Foundation in Support of Local Democracy (FSLD), 00-680 Warsaw, Poland
3
Department of City and Regional Management, University of Łódź, 90-237 Lodz, Poland
4
Department of Regional and Spatial Development, Warsaw School of Economics, 02-520 Warsaw, Poland
5
Departament of Real Estate, West Pomeranian University of Technology, 70-310 Szczecin, Poland
*
Author to whom correspondence should be addressed.
Land 2020, 9(7), 214; https://doi.org/10.3390/land9070214
Submission received: 8 June 2020
/
Revised: 28 June 2020
/
Accepted: 29 June 2020
/
Published: 1 July 2020
(This article belongs to the Special Issue Conditions, Effects and Costs of Spatial Chaos)
Abstract
:This paper is based on the results of an extensive (840-page) report of the Committee on National Spatial Development of the Polish Academy of Sciences, entitled Studies on Spatial Chaos (edited by A. Kowalewski, T, Markowski and P. Śleszyński—Studia KPZK PAN, vol. 182, Warsaw 2018—in Polish). Its aim was to conduct a comprehensive and detailed study on the problem of spatial chaos (spatial disorder), including an estimate of economic costs in Poland. For this purpose, literature was queried (articles and reports, etc.) and special analyses were prepared for this purpose. The total annual costs of spatial chaos were estimated at not less than 20 billion euros per year. The conclusions also proposed solutions and suggestions (for the government and local governments), which may reduce the acute costs of spatial chaos in society and economy.
1. Introduction
The entirety of economic and non-economic human activity takes place in a space that, as a key development factor, enables long-term quantitative and qualitative changes to meet human needs in the form of various types of benefits [1]. At the same time, human activities in spaces also generate costs (losses), and space itself is a non-constitutional resource (recognized in economic theory as a non-reproducible good). Space also has its value, on the one hand, given by its owners and/or users, while on the other, through market processes occurring in it. The measure of success (or failure) in the social, economic and environmental dimensions is the balance of costs and benefits associated with the use of space (as well as the preservation of its desired characteristics). In the case of spatial chaos as a negative effect of human activity, we can practically talk about losses (costs). Even if at some point in the wrongly planned location of investment it seems to be beneficial for the investor, in the long run it will bring disadvantages. Recent comparative studies in Europe show that the problem is not homogeneous in different countries [2].
Research on the phenomenon of sprawl corresponding to the approach taken in this paper was determined, among others, in work by Galster et al. [3], in which it was emphasized that chaos can be studied in the context of the causes or effects of adverse phenomena. It is also believed [4,5] that urban sprawl is primarily a chaotic change in the spatial structure of suburban municipalities, resulting from the intensification of suburbanization processes, with low control and insufficient planning regulation of these processes as part of spatial policy. Disorder can be treated both statically, i.e., as a development of space at a given moment, as well as a process, i.e., a change in the spatial structure of the area in time. In Poland, research on the suburbanization process was conducted, among others, by Beim [6], Czarnecki [7], Parysek [8], Parysek and Stryjakiwiecz [9] and Staszewska [10].
Although we can indicate many unfavorable phenomena accompanying the processes of sprawl (e.g., ghettoization, exclusion, lack of local identity, emergence of external effects and increase in environmental impact and loss of its values), we can consider it as a model objectifying in reality [3], which is most often a consequence of poor planning (or lack of it at the local level), and which leads to chaotic and thus low population and housing density, generating higher costs of providing public services, and thus increasing local expenditure [11]. Despite the research on the phenomenon of sprawl that has been carried out for many years, it is difficult to indicate one binding definition, and a large number of researchers quote the work carried out in the team of E.H. Wilson [12], in which it was pointed out that the phenomenon itself is described by both quantitative and qualitative indicators (regarding subjective assessment of the quality of life and aesthetic feelings associated with the assessment of the landscape, etc.).
Since the beginning of the research on the phenomena of sprawl, an assessment of the costs and consequences of managing dispersed areas has been also carried out [13,14]. Costs and losses are calculated in the literature in various ways regarding various components of geographical space and measures. A relatively good indicator of efficiency is, for example, ‘absorption’ of land: quantifying the amount (area) of land for development purposes (and not sprawl, because a positive or negative assessment of a phenomenon depends on a subjective interpretation) [15]. Such an approach, especially in areas far away from densely populated urban cores, seems to be useful for making decisions related to conducting spatial policy at the local, regional and national level. In their research, the authors cited analyzed in this way the metropolitan area of Barcelona, where in 1995–2003 there was an increase in occupied areas by about 50% (formerly rural, mainly on the outskirts of the metropolitan area), while decrease in all green areas and agricultural land (soil) occurred. A similar method using time-spatial analysis was used in the study of the ten-million agglomeration of Bangalore [16]. The land use analyses carried out showed a 584% increase in built-up areas in 1973–2010, with a 66% decrease in agricultural areas and 74% water areas. Similar analyses for 1976–2016 were carried out for Islamabad [17], where an indicator was proposed based on differences in the growth rate of built-up areas and population, and demonstrating on this basis that population growth was slower than the land loss.
This type of analysis allows the determination of the dynamics of processes, including the creation of maps and analysis of changes for individual time series (intervals) [4]. In the cited study by E.H. Wilson [12], an example of a method developed in the NASA Regional Earth Science Applications Centers (RESAC) program at the University of Connecticut, providing information for space management processes, including its planning. It is worth emphasizing that these types of losses related to spatial chaos strongly affect the loss of areas used for agriculture and performing natural functions. For example, in Pennsylvania in the years 1992–1997, there was a loss of 1 million acres of agricultural land, forests and open areas and about 17% of grassland; the area of sensitive areas such as wetlands, slopes (of valleys), area aquifers decreased by 12%–27%, and the estimated cost of maintaining open areas in the 1990s ranged from USD 22–89 per household [18]. In turn, research conducted on Penang Island in Malaysia indicated not only changes in the land use, but also changes in the island’s landscape: forest cover decreased by almost 17%, grassland by about 13%, and water areas increased by less than 1% [19].
Chaos costs also mean increased morbidity (incidence) for specific diseases and higher healthcare costs. Research conducted in the United States indicates that the effect of sprawl is a decrease in quality of life, and chronic physical diseases approximately similar to the aging of the population by 4 years (however, there was no increase in mental health disorders) [20]. This is superimposed on social segregation processes, i.e., frequent grouping in the less attractive suburban areas of the elderly (who may additionally experience the phenomenon of communication exclusion and closing down) and probably the poor. Sprawl also leads to greater air pollution, which can translate into upper respiratory tract disease and premature death. According to the latest report from the European Environment Agency [21] in 2016, the following number of people died due to dust pollution in the EU-28: PM2.5—370,000, NO2—68,000, and O3—14,000 people. As some studies indicate [22], it is also possible to indicate the relationship between sprawl and BMI (obesity index): creating dispersed areas reduces the possibility of walking and, as a consequence, generates higher medical costs associated with higher BMIs.
Higher public service costs are another category of chaos-related losses. One of the largest studies on the subject conducted in the USA for 283 metropolitan counties over the period of 1982–1992 showed that the population density and type of buildings have a key impact on the final cost of providing public services [23]. This concerned, in particular, services related to road construction and maintenance and waste collection, but also education and public safety. In a later publication, the same authors emphasized [24] that it is not only the cost that counts, but also the quality of public services that are offered.
In one of the largest studies to date in the area of Spain on this subject [25], carried out in over 3000 communes with over one thousand residents, have shown that the higher the population density, the lower the investment and current expenditure per capita related to the provision of public services. This was confirmed by studies from Germany [26], in which the explanatory variables were population density and infrastructure concentration. In these methodologically similar surveys related to two countries, the savings potential, which was calculated as the difference in monetary costs between the most efficient infrastructures and the most inefficient municipalities, averaged 85% for Munich and 57% for the Nagoya region for the following public services: wastewaters, primary schools and local roads.
Similarly, the example of Spanish Valencia has shown [27] that city sprawl results in increased spending on public services, such as safety, transport, quality of life (selection, collection and management of waste, sewage and water supply), road maintenance and public lighting. Research for 1085 Japanese municipalities [28] clearly confirms this regularity: even a 1% decrease in urban sprawl may reduce the marginal cost of public services by 0.05–0.11%. In turn, empirical research conducted in the suburban area of Miskolc (Hungary) shows that it is possible to provide high quality public services (at least part of them), e.g., health care and public transport services [29]. From the perspective of territorial development, suburbanization puts pressure on public facilities and technical infrastructure of individual suburban municipalities, due to which municipalities offer local public services to their residents, significantly increasing budget expenditure [30]. Although one can sometimes see the reverse tendency described in the literature, i.e., the use of public services in typical urban spinal areas [31].
Another very often indicated category of sprawl costs is related to excessive commutes to work and services. These are primarily net location costs and time lost [32]. Studies conducted for the Milan region have shown that the dispersion of the city’s structure and thus lower population density entails increased costs and inefficiency (especially public transport), which leads to a new lifestyle and other (based on individual transport) mobility models [33,34]. In addition, environmental costs through increased energy consumption (up to 20% when living 15 km from the center-core of the urban system) and increased CO2 emissions [35] also affect transport costs related to spatial chaos.
Practical application of chaos cost calculation methods can also be indicated. For example, in Flanders, when discussing a land use plan, it was calculated that in the perspective of 2050, it is possible to save EUR 1.7 to 2.8 billion per year depending on the three scenarios adopted, including in terms of mobility alone from 1.2 to 2 billion EUR. While preparing the calculations, costs for households were indicated based on international research and indicators recommended by the European Environment Agency depending on the type of buildings [36]. For extreme types of buildings (compact city and suburbs), the difference in the overall cost is significant. In this type of research for the Halifax region in Canada, it was shown [37] that in the first case, it was USD 1.416 and in the second, USD 3.462: i.e., the difference was almost 2.5-fold.
The above review of sample studies indicates that the sprawl problem is basically global and applies to all continents. Nevertheless, in individual countries, these problems have more or less clear specificity related in particular to the current approach to spatial planning and the settlement history of a given area.
To date, no more in-depth, comprehensive research has been carried out for Poland, but also for most of the world, which would inform about aggregate (i.e., occurring in various spheres of the broadly understood geographical environment: natural and anthropogenic) costs due to spatial chaos. The first such attempt was the “Report on social costs and economic losses of uncontrolled urbanization in Poland” prepared by a team of experts from The Foundation in Support of Local Democracy and Institute of Geography and Spatial Organization of the Polish Academy of Sciences, which consisted of about 50 pages: its abbreviation published in Polish [38]. A few years later, an initiative was created to prepare its most professional version possible, thus creating probably one of the most comprehensive studies of the conditions, causes and effects (including costs) of spatial chaos in the world, with a total of 841 pages in three volumes [39]. It was attended by nearly 30 experts from around the country operating within the Committee for Spatial Economy and Regional Planning of the Polish Academy of Sciences.
This study attempts to summarize the main results of this multi-themed and multi-threaded—and thus methodologically complex—report. In this way, the authors want to make a cognitive contribution to the current study of spatial chaos in the world. The case of Poland seems to be particularly important here, because as shown by recent comparative studies, this country is characterized by a particularly imperfect space management system [40], as well as an unfavorable settlement structure, conducive to sprawl.
Against this background, the main purpose of the study is to identify phenomena and processes leading to spatial chaos that cause various types of excessive costs in the economic, social, environmental and public expenditure (public utilities). The second but no less important and complementary goal is an attempt to estimate these costs in terms of their value according to various quantitative (money, time and surface losses, etc.) and qualitative measures. The third goal is to try to explain the sources and causes of the crisis, especially in the context of defective urban law.
Chaos contributes to many problems related to the economic side of human activity, including the emergence of various types of costs, classically referred to as external costs [41,42,43]. This study adopts their generic classification in four strategic groups regarding the economic, social, natural and public utilities. Costs caused by spatial chaos can be included in a given group many times depending on the type effect in a given category. Due to the possibilities and method of measurement, we are dealing with measurable and immeasurable effects. Measurable effects can be determined in quantitative categories, including financial (time, money, area or other indicators, e.g., effectiveness and efficiency), and immeasurable, in qualitative and descriptive categories (phenomenon occurs, lack, strong and weak, etc.). In addition, costs can be described in terms of direct/indirect and associated effects. The following categories of costs are accepted:
- Economic costs: concerning real value in money, possible losses and costs of lost benefits (alternative), significant especially from the point of view of conducting business activity. The economic dimension of spatial disorder means negative effects in the economic sphere, by reducing income or the need to incur higher costs than in the case of a condition that can be considered as spatial order.
- Strictly social costs (these are not external costs in the classic microeconomic understanding, because their source is not producers, but often the residents themselves): public and private burden borne by residents, usually difficult to measure, related to the features of social structure and processes, possible to calculate as, e.g., time losses, increased number of deaths, level of satisfaction and healthiness, as well as some monetary costs related to non-professional individual costs (to be demarcated from economic costs allocated to the public sector and enterprises).
- Environmental costs: related to disturbances and negative impact on the natural environment (condition, quality and naturalness of processes), as well as resulting from the limited space.
- Public utility costs: related to increased costs (expenses) of public finances, especially in the local system (municipal government). External costs cause above-average expenditure from public service maintenance budgets or cause underfunding of services, deterioration of their quality, abandonment of expenditure on restoration of assets and indebtedness of the economy at the expense of future generations. These costs have their financial, material, cultural, political, temporal and spatial dimensions.
2. Materials and Methods
The starting point for the research analysis was the assumption that spatial chaos causes various costs that can be analyzed in various aspects and cross-sections characteristic of development (mainly local ones: Table 1). First, several major thematic areas were adopted, in which the most uniform effects of spatial disorder were identified. The following categories were proposed: settlement, real estate market, economy and development (general), agriculture, transport, municipal infrastructure, natural environment (or natural resources), conditions and quality of life and public security. Then, each of them was subjected to a detailed and in-depth analysis in terms of causes, conditions and generated costs (Table S1). Efforts were made to exhaust the subject matter as completely as possible. Each topic has been prepared by authors’ teams representing various research specialties.
The paper presents results of such specific costs (in selected categories), and their analysis was associated with the conditions of spatial management and spatial planning in Poland, both historical (shaping a faulty settlement structure as a result of partitions, wars and the period of centrally controlled economy until 1989) as well as contemporary ones (economic liberalism, low social awareness: also among state and local elites, defective, including excessively complicated planning laws) (Figure 1). In the Polish legal order at the local level, there are the following legal documents (instruments) regarding spatial planning: (i) studies of conditions and directions of the spatial development of communes (including, among others, defining local development principles and direct binding guidelines for local spatial development plans); (ii) local spatial development plans (binding local legal acts of a generally regulatory nature: binding, i.e., in a legally guaranteed manner, land use and principles of its development. However, these are optional acts, binding only on about 30% of the country’s area; (iii) decisions on building and land development conditions: individual administrative acts most often concerning individual infrastructure investments, issued for areas without local plans [2,44]. This study has also been significantly updated compared to the original report. This applies to both a review of world literature and Polish items on the conditions, causes and effects (including costs) of spatial chaos.
3. Results
3.1. Settlement
Settlement, along with the transport network, is the main element of spatial development. Therefore, recognition of mechanisms and cause–effect relationships in these elements is crucial for the possibility of estimating losses resulting from faulty spatial management. The following challenges and problems can be identified [45,46]:
- (a)
- Unsatisfactory condition of public infrastructure service: This is due to a defective, extensive and irrational structure of land use and development. The commune is not able to lead and maintain roads, water supply, sewage system and energy networks to dispersed and chaotic buildings and housing estates. At the same time, ensuring an appropriate standard of communication and service support is impossible due to the high costs. In economic terms, this means higher expenses and lower investment attractiveness; in social terms, a low standard of living; and in environmental terms, environmental pollution. The problem of service mismatching always means higher costs for public finances.
- (b)
- Lack of utilities: In extreme cases, local governments are unable to provide access to buildings, especially housing, to basic utilities. In the case of public finances, the most serious threat is the high cost of buying a land for infrastructure construction, estimated at tens of billions of euros and threatening to bankrupt some municipal governments.
- (c)
- Morphological and functional chaos of chaotic buildings and urban and spatial disfunctions: Spatial disorder has also its sources in jurisprudence of law, official culture and everyday life. Communities are condemned to a low standard of living and have local identity issues. In natural systems, decomposition, defragmentation and disruption of the traditional rhythm of matter and energy circulation occur, and strong anthropopressure destroys the environment.
- (d)
- Excessive building placement in areas with agricultural functions: The so-called “urban” urban planning causes the loss of agricultural and nutritional areas (the so-called host zone). In newly built-up, functionally unrelated areas, too rapid social changes take place, preventing the formation of proper relationships, interpersonal relationships, local identity, etc.
- (e)
- Oversupply of investment plots with low location potential: This problem concerns the faulty structure of settlement areas: too small plot areas, disordered ownership and lack of consolidation and access to infrastructure. This gives rise to social conflicts, and for public finances it means enormous transformation costs (land purchase, plant and agricultural economy, including mergers, etc.).
- (f)
- Low economic efficiency of settlement: This results directly from the dispersion of buildings and the lack of harmony of settlement and functional systems: the distance between places of residence, work and services, as well as unnecessary intersections of relations, disorder and lack of hierarchy, etc. Higher market and public costs result here, in particular, from poor spatial accessibility in including transport costs and time needed for effective “binding” of various complementary functions that determine the proper functioning of territorial and social systems. Living costs are rising, operating costs are high, etc.
It is worth pointing out here important information regarding the financial forecasts of the effects of local plans. These data have been collected by the Central Statistical Office of Poland since 2012. These materials show that the planned spatial management is unbalanced and the balance of income and costs is negative, closing at the level of minus EUR 1.09 billion). At the same time, expenses related to the adoption of local plans amount to EUR 20.86 billion, including the purchase of land for investment construction: EUR 2.88 billion; construction of municipal roads: EUR 9.64 billion; construction of other infrastructure: EUR 5.88 billion; other expenses: EUR 2.43 billion). It can be expected that this is a financial perspective of over a dozen to a maximum twenty years.
So far, only part of this expenditure has been incurred. According to the latest available data, by 2015, municipalities spent EUR 3.36 billion (with revenues of EUR 2.27 billion), so the balance, as in the forecasts, is also negative. Importantly, these amounts are growing: forecast expenditure in 2013–2015 (increased by EUR 5.08 billion), i.e., by almost one third. However, this is not due to a drastic change of situation, but to more realistic forecasts, also in terms of statistics (not all local plans in Poland have a forecast of effects).
Among the presented calculations, data presented by P. Gibas and K. Heffner [45] are particularly quantifiable and convincing, according to which the cost of building and operating additional infrastructure may amount to EUR 15.36 billion per year. The authors conducted very detailed analyses of the layout of buildings according to the address point database, pointing to addresses located a large distance (over 280 m) from compact buildings and other buildings, and then calculated the costs of building and maintaining roads and making electrical connections (Figure 2). The cited study is currently the most comprehensive and documented, referring to the issues of the costs of spatial chaos and the problem of dispersal of buildings. Each additional 1 m above 280 m from the nearest neighboring building was estimated at EUR 360.9. The analyses show that sparsely populated areas of the Lakeland, Podlasie and Bieszczady are particularly ineffective and that the differences are several dozen times.
Among other analyses that indirectly illustrate the problem of spatial chaos, it is worth pointing out the high costs of water supply and sewage systems, related to dispersion and spatial chaos, not only in peripheral rural communes, where settlement is naturally poorly developed, but also in urbanized suburban areas. Across the country, in 152 zones of the largest cities (20,000 inhabitants and more), 52 communes (out of a total of 466) can be identified in which the population density was more than 150 apartments per 1 km2, and at the same time the length of the water supply network per capita was >10 m. At the same time, in as many as 68 suburban zones, the indicator of the length of the active water supply network per capita was five times higher than in core cities (Figure 3).
The above-mentioned problems are mostly not resolved by spatial policy. Quite the opposite–individual tools of this policy even deepen individual dilemmas [47,48,49], including Poland’s situation becoming problematic in comparison with other countries [50]. Both on the basis of the decision on building and land development conditions, as well as local spatial development plans, land is earmarked in such a way that its “planning” absorption exceeds both the current and the forecasted number of inhabitants many times. The authorities responsible for implementing spatial policy too often succumb to grassroots urban pressure (sometimes they even support it themselves), which results in the problems of settlement mentioned above. The main factors generating this state of affairs include:
- No binding features of the study of conditions and directions of spatial development in the perspective of the entire spatial management system; at the same time, there are no mechanisms that allow even under such defective documents to declare sufficient protection against uncontrolled buildings.
- Too broad criteria when issuing decisions on building conditions, enabling, in the absence of local plans, actual “forcing” investors by buildings detached from the functional features of the environment [51].
- Weaknesses of local plans, which on the one hand boils down to the lack of sufficient protection against urban pressure (which results in frequent adoption of plans expanding building options in isolation from actual conditions), and even disputable morphometric features of plans (associated with bypassing key areas from the perspective of providing, e.g., high public infrastructure standards).
In conclusion, the above-mentioned problems generate the current shape of spatial policy tools, the use of which is associated with too broadly understood freedom of development and a lack of factors that effectively protect and shape spatial order.
3.2. Technical Infrastructure
Technical infrastructure and its costs and losses are closely correlated with settlement (therefore, they have been jointly included in Table S2). Potential problems include broad social, economic, engineering and organizational issues. They also result, to a significant extent, from the conducted spatial policy. Appropriate distribution of technical infrastructure determines the socio-economic development, and also directly affects financial efficiency and meeting the needs of local development, especially the quality of life and business conditions. This applies to suitably diversified areas, both subject to the process of sprawl [52,53,54], as well as other typically agricultural ones, e.g., in connection with the location of wind farms [55].
Necessity of incurring the excessive expenditure on infrastructure undoubtedly hinders (and sometimes prevents) the obtaining of positive effects in this respect. This is reflected in, among others, the above-average expenditure of communes for purposes related to transport, municipal services, water and sewage management, public roads and real estate management, as well as the maintenance of infrastructure. In this context, the costs of technical facilities for the needs of households and enterprises, etc., are particularly high. In the case of detached houses, the cost of infrastructure construction is EUR 26.267 per house; for terraced houses, EUR 18.826 per house; and in the case of multi-family housing, EUR 14.409 per apartment [56].
Insufficient investment can be estimated on the basis of water, sewage and rainfall, etc. service indicators. According to the Central Statistical Office of Poland, at the end of 2018, 92.1% of residents were connected to the water supply system, and only 70.8% to the sewage system. There is therefore a very large inconsistency in both types of networks. As a result of the dispersion and chaotic arrangement of buildings, the infrastructure network is longer and inefficient. In some communes, this indicator exceeds even 35 m per person, including the length of the network per capita in the east of the country is even five times higher than in the west (Figure 4). To a large extent, this is due to the features of Poland’s historical development, including variation in urbanization rates [57].
Excessive investment needs to be associated with the dispersion of buildings which cause numerous local spatial conflicts related to the design and routing of line and point facilities, in particular road networks, in the field of water and sewage management (sewage treatment plants) and landfills [58,59]. Chaos is also the reason for the increase in mobility and transport intensity, because it increases the demand for transport. This is due to the fact that a poorly organized, random location of homes, workplaces and services, etc., extends the route. Disorder is not only the reason for the increase in transport intensity, but also generates the need to provide a larger area for transport needs [60]. In turn, the increase in traffic and the construction of new infrastructure is further contributing to this chaos.
From the perspective of spatial policy tools, there is no stronger link between planning documents and the consequences associated with the need to erect technical infrastructure devices. For some tools (municipal study), there is no such requirement; for others, they are formulated excessively in general or in a way referring to the individual perspective. There are also possibilities of omitting the indicated issues in spatial policy. In the analyzed context, the problem of implementing other types of buildings is also noticeable, which can be exemplified by wind energy and dilemmas related to its effective planning implementation in individual areas [55]. In such a state of affairs, it is not possible to ensure responsible verification of key technical infrastructure standards, such as accessibility (including spatial), performance, throughput, efficiency and security.
3.3. Transport and Mobility
Spatial chaos—in this case, the lack of good spatial organization—is the main reason for the increase in transport intensity in Poland [61]. In turn, the increase in traffic and the construction of new infrastructure contribute significantly to this chaos. This is therefore a very dangerous negative feedback. At the same time, there is an increase in daily mobility in Poland, which directly translates into transport needs. The size and structure of daily mobility depends on the place of residence, location of travel destinations (especially jobs) and the frequency of shipments of various purposes. Urban residents are more mobile.
Jobs and housing mismatches result from a strong imbalance in the supply and demand of the labor market [62,63]. The most attractive labor markets concern the most developed agglomerations, with Warsaw at the forefront. At the opposite end are backward peripheral areas, where there are no jobs, and residents follow employment either moving permanently or undertake long-distance commuting. Commuting to Warsaw reaches distances even over 100 km. Given the time it takes to move and the mass nature of this phenomenon, this causes very high external costs, including social costs, degrading family and social life, interpersonal relationships and civic activity, etc. Excessive commuting costs in 18 Polish agglomerations (around provincial capitals) were estimated at an average of EUR 75,000 per household in 2015–2030 [64]. The costs of excessive travel to Warsaw were estimated in the case of the 13 nearest poviats (Grodzisk, Grójec, Kozienice, Legionowo, Mińsk, Nowy Dwór, Otwock, Piaseczno, Pruszków, Sochaczew, west Warsaw, Wołomin and Wyszków) at EUR 151.65 million per year [38].
There are several reasons for the increase in mobility in Poland. The most important of these are relatively rapid development and structural changes in the economy, mismatching jobs and residence, and strong dispersion for European countries [65]. This causes an increase in traffic and transport performance, contributing to environmental problems [66]. In 2016, according to CSO data, 1.8 billion tons of cargo was transported, which, compared to 2005, was an increase of 33%. Transport performance increased even more strongly during this period—by 69%, of which as much as 254% was in road transport. Spatial chaos directly increases the demand for transport. This is due to the fact that the disordered locations of various functions and the lack of clear organizational and spatial structure extends the route. Therefore, disorder is the reason for the increase in transport intensity, but also generates the need to provide a larger area for transport needs.
The costs of spatial chaos in transport were calculated [61] based on the cost-benefit account, including improper implementation of investment processes and the so-called redundant infrastructure. This applies to gigantomania (construction of infrastructure facilities far above the needs of actual demand) and technical sublimation (using the latest, but unproven, usually expensive and often unreliable technical innovations). On the other hand, too careful planning of the technical and functional parameters of infrastructure causes traffic congestion. It is visible even on the highest-class roads, i.e., on some sections of the highway. A characteristic example is the Warsaw–Łódź section, on which traffic is concentrated not only from the latitudinal direction, but also between the Warsaw and Tri-City agglomeration, because this is the shortest route from the Polish capital to Gdańsk. For this reason, the planned and implemented two lanes each way turned out to be insufficient. Higher demand for transport due to spatial disorder results in correspondingly higher external costs. These are especially the costs of road accidents [67] as well as losses and environmental pollution. Transport costs in Poland are four times higher than the EU average. They amount to not less than EUR 4.96 billion a year.
There are also significant restrictions on spatial policies with this problem. Despite the application of special regulations (the so-called road special acts), when determining the location of some public roads, a serious barrier is the inability to plan the location of the road in advance and “reserve” the area for this purpose [68]. As a consequence, rational planning of the road network is hampered by bottom-up actions of individual stakeholders (sometimes boiling down to deliberate obtaining, in a given area of location, decisions informally planned for a public road). This extends to the entire investment process, which generates serious spatial conflicts and sometimes ultimately prevents a specific road location.
3.4. Land Use and Agricultural Activities
Land use and agricultural activities are further areas of spatial chaos [69]. Its main causes are fragmentation of lands and poor functional and spatial organization of rural areas, which are some of the major sources of financial losses. Generating high labor costs and, consequently, low income in agriculture is a key problem in this context in agriculture. The above is associated with spatial fragmentation of lands, including their extensive cadastral divisions [70] associated with usually successful attempts to change their purpose for non-forest ones. These are activities resulting from specific spatial policies.
Legal and planning conditions contribute significantly to the spatial fragmentation of lands. In the current formula, spatial policy tools—primarily local spatial development plans, instead of deliberately and rationally shaping functional entities in the form of villages—may (in the regulatory dimension) refer to very small areas. In 2015, as many as 216 rural communes were identified in which the average size of the plan was less than 10 ha. For example, in the Inowłódz commune (Łódź Voivodeship), 10 local plans were in force, with a total area of 50 ha (5 ha on average), and in the commune of Radzanowo (Mazowieckie Voivodeship), 44 plans with a total area of 397 ha (9 ha on average) were in force, but there were in total 24 communes, in which the average size of the plan oscillated around 1 ha. In the “record” commune of Sanok, there were as many as 280 plans (total area 402 ha); in the commune of Lubiewo, 153 plans (114 ha); and in the commune of Szaflary, 81 plans (54 ha). It has also been shown that a significant proportion of plans—about 30%—occur more than in one piece, and “record” documents in this respect have even 100 or more of these patches [71]. The value of such plans from the point of view of shaping the spatial order of villages and agro-rural areas is negligible or none [72].
The content of a significant part of local plans is also a problem, especially attempts to change the use of agricultural land for non-agricultural and non-forest purposes. It is even possible to distinguish (from the perspective of how to conduct spatial policy) a separate group of communes, for which the only function of local plans is changing the land use to non-agricultural one [51]. The effect of changes in the use of land from agricultural use for non-agricultural purposes, mainly residential, is a strong oversupply of investment land, resulting not only in the dispersion of buildings, but also with excessive exclusion of such land from agricultural use and failure, particularly disfiguring the landscape [73]. This reduces both the production potential and the efficiency of agricultural activity due to land parceling into smaller plots and increasing the service costs (mechanization and fertilization, etc.), including in particular the internal costs of transport on a farm. There is also a practice of separating arable land (for development) even before the plans are adopted. There is also a lack of mechanisms guaranteeing more common land parceling.
Another problem is too large distances between agricultural plots belonging to one owner. This results in significantly higher transport costs. The areas where this problem is particularly significant include western and partly eastern Poland (including the Bieszczady Mountains). There was a large-scale lease of real estate by individual farmers after 1989, very often living permanently far away from cultivated fields and meadows. Based on the agricultural census in 2010, 109 rural communes and rural areas were identified in urban-rural communes, in which arable land located at a distance of more than 10 km from the headquarters of the agricultural holding accounted for over 35% [74]. A specific problem of rural areas, which also contributes to the creation of spatial chaos, are the so-called second homes, often built in agricultural areas, contributing to the uncontrolled urbanization of rural areas and the change of use of previously agricultural areas [75].
3.5. Real Estate Market
The costs of spatial disorder that can be associated with the real estate market in the presented approach result primarily from the local spatial policy [76]. It is determined by legal and supra-local conditions, etc.; however, in the context of the characteristics of the indicated costs, reference has been made to the consequences of using specific spatial policy tools.
First of all, attention should be paid to the consequences of excessive use of individual areas for housing in local plans. The “hardest” data belongs to the category of “indirect” costs and relate to a strong oversupply of construction land, of which only in local plans (not including studies of conditions and directions of spatial development) there is 1.2 million ha, in over 90% of cases for single-family housing. Although we do not know exactly what part of this land is already invested, we can estimate the global demographic absorbency (capacity), which shows that 57–89 million people can live in these areas [38], with the latest and the most accurate estimates indicating a number of 59.6 million people [77] However, it should be noted that only one third of the country’s area is covered with local plans, and the remaining development is also possible based on location decisions in Poland for housing purposes is very large. Only for a small part of the communes’ needs, the reserves of land for investment purposes are balanced. There are regions of Poland in which the area of available land is several times higher than the inhabited population (Figure 5).
The above data about a strong oversupply of land are a serious argument in favor of raising various types of threats on the real estate market. The amounts of land that can be built up often exceed real needs. This happens in the situation of depopulation processes, in which the problem of developing abandoned infrastructure will be much more frequent than seeking new places for investment, especially in peripheral areas [78,79]. The most characteristic risk is the risk of a “speculative bubble bursting” on the land property market. It consists of the fact that if all owners of “free” construction land wanted to sell them, supply would exceed demand many times. Profits of land investors in Poland are therefore quite virtual. The problem of a “bursting bubble” on the real estate market would also have long-term effects and would significantly extend the time of recovery from recession. Potential panic would further deepen the expected losses.
In Poland, however, there is no drastic reduction in land prices due to the fact that the efforts made and investments, e.g., in the retraining of land in local plans, are a long-term type of securing income and families, etc. in the future. If these lands are not subject to a stronger exchange, the risk of speculative bubble bursting appears to be lower. However, if we assume that about three quarters of construction land in Poland is oversupplied, the difference between the value of agricultural and construction land would be, depending on the detailed methodological assumptions, EUR 39.9–64.7 billion [80]. However, according to the capitalized rent method, the value of this surplus was estimated at EUR 63.5 billion for agricultural land and EUR 142.4 billion for construction land [81]. These values are quite different, but they indicate that this problem should be perceived in Poland in the scope of tens of billions of euros. Economic consequences here also include investment uncertainty or land speculation. In the social dimension, this deepens the consequences in the form of growing conflicts and satisfying social needs less and less.
Therefore, it can be pointed out that, in the context of the consequences related to the real estate market, deficiencies in the area of development areas are particularly noticeable (this is not changed by the statutory requirement to prepare such a balance before preparing or changing the study), as well as detachment of the real possibilities of building out individual development tools areas. A personalized problem is the lack of connections between the sphere of spatial planning and the sphere of real estate valuation manifested, among others in legal discrepancies, as well as weaknesses in financial forecasts prepared in connection with the adoption of plans [82]. The potential compensation costs of adopting local plans are also a problem, which makes it difficult to change the current status quo, which is also the case in the systemic sphere. In the Polish spatial management system, the adoption of local spatial development plans in a given area, limiting previous land use options (even potential), leads to serious financial consequences for communes. Owners of such property may demand compensation from the communes (equal reduction in the value of their property related to the adoption of these plans). This deepens the reluctance of many communes to adopt local plans [83,84]. In the context of the effects on the real estate market, the consequences of suburbanization for the budgets of local government units [54,64] should also be included.
3.6. Environmental (Nature) Costs
Natural environment is the element of geographical space that reacts in a particularly complex way to human activity. At the same time, negative effects of anthropopressure are very difficult to neutralize, and often cause irreversible changes in ecological systems [85]. Therefore, environmental costs resulting from spatial disorder are very high, often impossible to incur by even the richest countries, and also have indelible technical and organizational restrictions.
The main factors degrading the structure and disturbing the functioning of the natural environment, including the national network of ecological corridors [86,87], are:
- Transformation of river valleys (regulation of riverbeds, drainage of hydrogenic habitats, clearing of alluvial forests and tree stands, development of floodplain terraces and location of sites harmful to the environment, etc.).
- Road network density, combined with a significant increase in traffic intensity and the encapsulation of busy routes with tunnels of noise barriers, causing strong landscape defragmentation on a local and regional scale (including even a change in the topology of natural systems on a macro scale).
- Expansion of dispersed buildings into natural and agricultural areas, combined with the liquidation of many local ecological corridors (the worst effect is the expansion of dispersed suburban buildings).
- The spread of large-scale, monocultural agricultural crops, resulting in a decrease in biodiversity and the elimination of many ecological corridors.
Against this background, the impact of spatial disorder on the natural environment can be considered in three basic groups of issues: (i) decline in the biologically active surface of ecosystems and fragmentation of ecological landscape systems; (ii) simplifying the internal structure, decreasing biodiversity and weakening the stability and resilience of ecosystems and landscapes; (iii) expansion of cities, development of urbanization processes and creation of various ecological barriers. These processes are identified in Poland in particular through changes in land cover [65], as well as indicator analyses, such as entropy measures and landscape metrics, etc. [88].
Against the background of the above complex conditions and cause–effect relationships in human–environment relations, estimating the costs of spatial disorder is quite difficult. This is due to the fact that it is not known exactly what part of the natural losses is the result of spatial chaos, and which is of human action in an environment that does not cause this chaos, i.e., creating a kind of “surplus”. There is no such human activity that would not be directly or at least indirectly related to the functioning of ecosystems [89]. For example, the location of the settlement along the coast of the water reservoir is associated not only with direct water pollution, but also with the evolution of use, bringing successive stages of anthropopressure, related to the development of urbanization and the size expansion of the settlement unit, etc. The final environmental cost is not always a simple sum of activity throughout the entire development history of the coast of this basin; throughout the entire period of urbanization, environmental protection activities are carried out on a smaller or larger scale.
Costs resulting from air pollution are recognized relatively well [90]. They are caused by human activity and contribute to various diseases and, as a consequence, deaths. Higher emissions result directly from dispersed buildings (increased transport needs and exhaust emissions and low emissions from domestic coal and wood-fired furnaces, etc.). Research on this subject is becoming more frequent. WHO estimates indicate that air pollution in Poland (one of the strongest in Europe) can cause losses of up to about EUR 25 billion per year [91]. This is, among others, approximately 19 million business days lost. In Warsaw, this impact was estimated at EUR 1.42–4.25 billion per year [92]. In the context of spatial disorder, it is worth mentioning, in particular, the smog phenomena that largely result from low emissions, caused by dispersed, inefficient buildings for heating networks, and, to a lesser extent than is believed to be, the growth of the automotive industry [93]. It is estimated that they may be the cause of an increase in deaths in Poland by up to several percent in the case of respiratory diseases, heart disease, cancer and others [94,95].
It is worth emphasizing that environmental costs are also largely determined by spatial policy in municipalities. Spatial policy tools (especially local plans) do not guarantee sufficient protection, deepening the negative tendencies indicated above [96,97,98]. There is no legal basis to include in these tools all relevant environmental and natural institutions, e.g., green infrastructure [99], and there is also insufficient protection of all environmental and natural values of the areas. To a limited extent, the most important tool in spatial policy in this context is implemented, i.e., the protection of biologically active surfaces [100]. To conclude considerations regarding the environmental costs of spatial chaos, it should be emphasized that although the presented estimates are the first such comprehensive approach in Poland, and probably also one of the few in the world, the listed/presented catalog of effects and costs is not complete; rather, it is the opposite. Particularly, an open way involves estimating environmental costs. On one hand, this is due to the problems of the economic valuation of the environment itself (or its individual elements) [101,102,103];on the other hand, methodology and research on ecosystem services is dynamically developing [104,105]. Knowledge in the field of environmental valuation and ecosystem services (in Poland, research in this field has been carried out, among others, since 1993 by the Warsaw Center for Ecological Economics (WOEE)), deepened by subsequent studies, will also allow to accurately estimate the costs of spatial chaos in the future. Many detailed costs are still included in Table S2 [106,107,108,109,110,111,112,113,114,115,116,117,118,119,120,121,122,123,124,125,126,127,128].
4. Discussion
The empirical section presents various approaches to estimating the costs of spatial chaos. Certainly, each of the methods used has some limitations and does not refer to the overall costs of spatial chaos, especially in terms of the environment and the possibility of renewing the resource, which is space. The basis for determining the benefits and costs of using space (including spatial chaos) should be an approach taking into account all elements (resources) and interaction.
Taking this into account, the total costs of spatial chaos in Poland are presented below. They are very large and amount to EUR 19.92 billion per year (Table 2). The largest part (EUR 7.44 billion) is costs related to transport service. Then, relatively high, other expensive items concerned settlement and technical infrastructure (EUR 4.48 billion). The other three categories (agriculture, the real estate market and natural environment) generated EUR 7.63 billion of costs. It appears that the amounts calculated represent the minimum threshold for disorder costs.
It should be noted that, in relation to the budgets of municipalities, these losses sometimes reach half of their annual expenditure. Of course, not all costs are borne by local governments. Some part is financed from the state budget, but ultimately the largest part is borne by all residents, because in the final analysis, the maintaining of irrational and inefficient spatial-socio-economic systems is mainly made of taxes. If the amount obtained were to be divided evenly into the number of residents registered, the value obtained would be EUR 520 per year. This gives an average family of four EUR 2079 per year for an average family of four. This contains both the tax cost and directly spent funds, e.g., for additional fuel.
Research conducted over 20 years indicates that in many countries in Europe (both western and eastern), built-up areas increased by 20%, and the population only by 6%. Such a space management system causes the costs, especially those related to mobility, to increase significantly (and even more, considering that the number of cars is expected to increase by 40% from 1995 to 2030) [36]. New built-up areas also cost public services, which are always higher in areas with low population densities. The process of urban expansion observed in Europe for 50 years is taking place particularly in countries such as Belgium, the Netherlands, Germany (southern and western), northern Italy and France (around Paris). In these countries, built-up area is increasing and cities are spreading, while the extent to which this results in costs related to spatial chaos largely depends on the weakness or strength of the spatial planning system. Countries such as France or Germany with an efficient criminal planning system are certainly less exposed to such costs.
5. Conclusions
The effects and costs of spatial chaos translate into quality of life (also for future generations) and therefore it is important to analyze whether the effects and costs are not and will not be too severe from the point of view of long-term social interest. In the discourse on the costs and effects of spatial chaos, obtaining social acceptance (which assumes information and education of various groups of stakeholders) becomes key, while the monetary dimension of the cost of spatial chaos becomes an argument that goes to the imagination of decision makers as well.
On the other hand, our knowledge about the value of well-managed space and the costs of harmful urbanization processes is increasing. If knowledge of the benefits of the reform reaches public awareness, development control and spatial order protection will be on the list of political goals. Then, it will be possible to clean up the law and institutions and to improve administrative habits. This study attempts to show that spatial chaos and the crisis in spatial management is one of the most serious barriers to sustainable socio-economic development of the country.
It should be remembered that the main starting point for making the necessary changes to the law is the political will of the rulers and the building of a rational space management system in Poland, which requires definition and agreement of the state’s spatial policy and establishing the principles of its effective implementation. However, if the “belated” political will appears under the influence of the economic downturn, then the multi-generational costs of repairing the functioning of the spatial economy will be even greater, and healing the foundations for rational space management, as the most important factor in building a competitive economy, will be even more difficult.
Supplementary Materials
The following are available online at https://www.mdpi.com/2073-445X/9/7/214/s1, Table S1: Detailed identification of phenomena, conditions, causes and related costs of spatial chaos. Table S2: Detailed list of the spatial chaos costs.
Author Contributions
Conceptualization, P.Ś., A.K. and T.M.; methodology, P.Ś., A.K. and T.M.; formal analysis P.Ś. and M.N.; investigation, P.Ś., A.K., T.M., P.L.-K. and M.N.; resources, P.Ś., P.L.-K. and M.N.; data curation, P.Ś.; writing—original draft preparation, P.Ś., A.K., T.M. and P.L.-K.; writing—review and editing, P.Ś., P.L.-K. and M.N.; visualization, P.Ś.; supervision, A.K. and T.M.; project administration, P.Ś., A.K., T.M. and M.N. All authors have read and agreed to the published version of the manuscript.
Funding
This research received no external funding.
Conflicts of Interest
The authors declare no conflict of interest.
References and Notes
- Rozas-Vásquez, D.; Fürst, C.; Geneletti, D.; Almendra, O. Integration of ecosystem services in strategic environmental assessment across spatial planning scales. Land Use Policy 2018, 71, 303–310. [Google Scholar] [CrossRef]
- Nadin, V.; Fernández Maldonado, A.; Zonneveld, W.; Stead, D.; Dąbrowski, M.; Piskorek, K.; Sarkar, A.; Schmitt, P.; Smas, L.; Cotella, G.; et al. COMPASS–Comparative Analysis of Territorial Governance and Spatial Planning Systems in Europe Applied Research 2016–2018 Final Report; ESPON: Luxembourg, 2018; Available online: https://www.espon.eu/planning-systems (accessed on 3 May 2018).
- Galster, G.; Hanson, R.; Wolman, H.; Coleman, S.; Freihage, J. Wrestling Sprawl to the Ground: Defining and Measuring an Elusive Concept. Hous. Policy Debate 2001, 12, 681–717. [Google Scholar] [CrossRef]
- Arribas-Bel, D.; Nijkamp, P.; Scholten, H. Multidimensional Urban Sprawl in Europe: A Self-Organizing Map Approach, ERSA 2010–50th Congress of the European Regional Science Association, Jonkoping 2010, Conference Papers, September, Publ. 2011. Available online: http://www-sre.wu.ac.at/ersa/ersaconfs/ersa10/ERSA2010finalpaper485.pdf (accessed on 2 May 2011).
- Perrsky, J.; Wiewel, J. Urban Decentralization, Suburbanization, and Sprawl: An Equity Perspective. In Urban Economics and Planning; Brooks, N., Donaghy, K., Knaap, G.J., Eds.; Oxford University Press: New York, NY, USA, 2012. [Google Scholar]
- Beim, M. Modelowanie Procesu Suburbanizacji w Aglomeracji Poznańskiej; Bogucki Wydawnictwo Naukowe: Poznań, Poland, 2009. [Google Scholar]
- Czarnecki, A. Obszary wiejskie, urbanizacja wsi, rozwój wielofunkcyjny, rolnictwo wielofunkcyjne–przegląd pojęć. In Uwarunkowania i Kierunki Przemian Społeczno-Gospodarczych na Obszarach Wiejskich; Rosner, A., Ed.; IRWiR PAN: Warszawa, Poland, 2005; pp. 233–254. [Google Scholar]
- Parysek, J. Współczesna polska suburbanizacja i polityka miejska (aktualność hipotez C. Colby’ego po 80 latach). In Koncepcje i Problemy Badawcze Geografii; Marciniak, K., Sikora, K., Sokołowski, D., Eds.; Bydgoszcz, Wyższa Szkoła Gospodarki w Bydgoszczy: Bydgoszcz, Poland, 2011; pp. 313–330. [Google Scholar]
- Parysek, J.; Stryjakiewicz, T. (Eds.) Region Społeczno-Ekonomiczny i Rozwój Regionalny; Bogucki Wydawnictwo Naukowe: Poznań, Poland, 2008. [Google Scholar]
- Staszewska, S. Urbanizacja Przestrzenna Strefy Podmiejskiej Polskiego Miasta; Bogucki Wydawnictwo Naukowe: Poznań, Poland, 2013. [Google Scholar]
- Gorczyca, K. Analysis of Relationships between Distribution of Population and Spatial Economy of Communes in the Kraków Metropolitan Area. Bull. Geogr. Socioecon. Ser. 2008, 10, 37–48. Available online: https://apcz.umk.pl/czasopisma/index.php/BGSS/article/view/v10089-008-0011-9 (accessed on 2 May 2020). [CrossRef] [Green Version]
- Wilson, E.H.; Hurd, J.D.; Civco, D.L.; Prisloe, M.P.; Arnold, H. Development of a geospatial model to quantify, describe and map urban growth. Remote Sens. Environ. 2003, 86, 275–285. [Google Scholar] [CrossRef]
- Ewing, R.; Pendall, R.; Chen, D. Measuring Sprawl and Its Impact: The Character and Consequences of Metropolitan Expansion; Smart Growth America: Washington, DC, USA, 2002; Available online: https://smartgrowthamerica.org/app/legacy/documents/MeasuringSprawlTechnical.pdf (accessed on 2 May 2020).
- Alberti, M. The effects of urban patterns on ecosystem function. Int. Reg. Sci. Rev. 2005, 28, 168–192. [Google Scholar] [CrossRef]
- Roca, J.; Burns, M.C.; Carreras, J.M. Monitoring Urban Sprawl around Barcelona‘s Metropolitan Area; CPSV: Barcelona, Spain, 2004; Available online: https://www.researchgate.net/profile/Josep_Roca3/publication/228912339_Monitoring_urban_sprawl_around_Barcelona’s_Metropolitan_Area_with_the_aid_of_satellite_imagery/links/54e2d5680cf296663797a7d0.pdf (accessed on 2 May 2020).
- Aithal, B.H.; Sanna, D.D. Insights to urban dynamics through landscape spatial pattern analysis. Int. J. Appl. Earth Obs. Geoinf. 2012, 18, 329–343. [Google Scholar] [CrossRef]
- Gilani, H.; Ahmad, S.; Qazi, W.A.; Abubakar, S.M.; Khalid, M. Monitoring of Urban Landscape Ecology Dynamics of Islamabad Capital Territory (ICT), Pakistan, Over Four Decades (1976–2016). Land 2020, 9, 123. [Google Scholar] [CrossRef] [Green Version]
- Clarion Associates, The Cost of Sprawl in Pennsylvania, Executive Summary of the Study on the Cost of Sprawl in Pennsylvania Conucted by Clarion Associates Inc., Prepared for 10,000 Friends of Pensylvania and Sponsoring Organizations 2000. Available online: https://www.sustainablepittsburgh.org/pdf/Costs_of_Sprawl_in_Pennsylvania.pdf (accessed on 1 May 2020).
- Tan, K.; Lim, H.; MatJafri, M.; Abdullah, K. Landsat data to evaluate urban expansion and determine land use/land cover changes in Penang Island, Malaysia. Environ. Earth Sci. 2010, 60, 1509–1521. Available online: https://link.springer.com/article/10.1007/s12665-009-0286-z (accessed on 1 May 2020). [CrossRef]
- Sturm, R.; Cohen, D.A. Suburban sprawl and Physical and Mental Health. Public Health 2004, 118, 488–496. Available online: https://www.researchgate.net/publication/8363040_Suburban_Sprawl_and_Physical_and_Mental_Health (accessed on 1 May 2020). [CrossRef]
- Air Quality in Europe–2019 Report; EEA: Luxembourg, 2019; Available online: http://www.eea.europa.eu/publications/air-quality-in-europe-2019,%20EEA%20Report%20No%2010/2019 (accessed on 1 May 2020).
- Cho, S.-H.; Chen, Z.; Eastwood, D.B.; Yen, S.T. The Effects of Urban Sprawl on Body Mass Index: Where People Live Does Matter? Cust. Interests Annu. 2006, 52, 159–169. Available online: https://www.consumerinterests.org/assets/docs/CIA/CIA2006/cho_theeffectsofurbansprawlonbodymassindexwherepeoplelivedoe.pdf (accessed on 25 April 2020).
- Caruuthers, J.; Ulfarsson, G.F. Urban Sprawl and the Cost of Public Services. Environ. Plan. B Plan. Des. 2003, 30, 503–522. [Google Scholar] [CrossRef]
- Caruuthers, J.; Ulfarsson, G.F. Does ‘Smart Growth’ Matter to Public Finance? Urban Stud. 2008, 45, 1791–1820. [Google Scholar] [CrossRef] [Green Version]
- Benito, B.; Bastida, B.; Guillamon, M.-D. Urban sprawl and the cost of public service: An evaluation of Spanish local governments, Lex–Localis. J. Local Self Gov. 2010, 8, 245–264. [Google Scholar] [CrossRef]
- Klug, S.; Hayashi, Y. Urban Sprawl and Local Infrastructure in Japan and Germany. J. Infrastruct. Syst. 2012, 18. [Google Scholar] [CrossRef]
- Gielen, E.; Riutort-Mayol, G.; Miralles i Garcia, J.L.; Palencia Jiménez, J.S. Cost assessment of urban sprawl on municipal services using hierarchical regression. Environ. Plan. B Urban Anal City Sci. 2019. [Google Scholar] [CrossRef]
- Ida, T.; Ono, H. Urban Sprawl and Local Public Service Cost in Japan. In Advances in Local Public Economics. New Frontiers in Regional Science: Asian Perspective; Kuzinaki, M., Nakamura, K., Sugahara, K., Yanagihara, M., Eds.; Springer: Singapore, 2019; pp. 195–215. [Google Scholar] [CrossRef]
- Andrea, K. The impact of suburbanization on social differentiation in Hungary: A case study of the Miskolc agglomeration. Geogr. Pannon. 2018, 22, 176–188. [Google Scholar] [CrossRef]
- Varela-Candamio, L.F.; Morollon, R.; Sedrakyan, G. Urban sprawl and local fiscal burden; analysing the Spanish case. Empirica 2019, 46, 177–203. [Google Scholar] [CrossRef]
- Wu, J.J. How does Suburbanization Affect Local Public Finance and Communities? RAE 2007, 29, 561–564. [Google Scholar] [CrossRef]
- Wassmer, R.W. An Economic Perspective on Urban Sprawl: With an Application to the American West and a Test of the Efficiency of Urban Growth Boundaries. California State University, Long Beach, CA, USA, 2002. Available online: http://www.researchgate.net/profile/Robert_Wassmer/publication/237490768_AN_ECONOMIST’S_PRESPECTIVE_ON_URBAN_SPRAWL_With_an_Application_to_Metropolitan_areas_in_the_america_West/links/54b436b10cf26833efd00aca.pdf (accessed on 23 April 2020).
- Camagni, R.; Gibelli, M.C.; Rigamonti, P. Urban mobility and urban form: The social and environmental costs of different patterns of urban expansion. Ecol. Econ. 2002, 40, 199–216. Available online: http://www.mopt.org.pt/uploads/1/8/5/5/1855409/camagni_ecol_econ.pdf (accessed on 23 April 2020). [CrossRef]
- Deep, S.; Kushwaha, S.P.S. Urbanization, Urban Sprawl and Environment in Dehradun. In Energy, Environment and Globalization; Gupta, A., Dalei, N., Eds.; Springer: Singapore, 2010. [Google Scholar] [CrossRef]
- Gitundu, B.H. Urban Environment, Sustainability and Climate Change, Critical Review of the Interaction between Urban Sprawl and Sustainable Transportation in Cities. February 2020. Available online: https://s3.amazonaws.com/academia.edu.documents/62952196/Sustainable_Urban_Transport_and_Urban_Morphology20200414-9170-15s75mk.pdf?response-content-disposition=inline%3B%20filename%3DSustainable_Urban_Transport_and_Urban_Mo.pdf (accessed on 23 April 2020).
- Publications Office of the European Union. Urban Sprawl in Europe-Join EEA-FOEN Report. In EEA Report, 11; Publications Office of the European Union: Luxembourg, 2016. [Google Scholar]
- Thompson, D. Suburban Sprawl: Exposing Hidden Costs, Identifying Innovations. Sustainable Prosperity Report. University of Ottawa, 2013. Available online: https://institute.smartprosperity.ca/sites/default/files/publications/files/SP_SuburbanSprawl_Oct2013_opt.pdf (accessed on 25 April 2020).
- Kowalewski, A.; Mordasewicz, J.; Osiatyński, J.; Regulski, J.; Stępień, J.; Śleszyński, P. Ekonomiczne straty i społeczne koszty niekontrolowanej urbanizacji w Polsce–wybrane fragmenty raportu. Samorz. Teryt. 2014, 25, 5–21. [Google Scholar]
- Kowalewski, A.; Markowski, T.; Śleszyński, P. Studia nad chaosem przestrzennym. Studia KPZK PAN 2018, 182, 1–3. [Google Scholar]
- Komornicki, T.; Szejgiec-Kolenda, B.; Degórska, B.; Goch, K.; Śleszyński, P.; Bednarek-Szczepańska, M.; Siłka, P. Spatial planning determinants of cohesion policy implementation in Polish regions. Europa XXI 2018, 35, 69–87. Available online: http://bazekon.icm.edu.pl/bazekon/element/bwmeta1.element.ekon-element-000171576700 (accessed on 24 April 2020). [CrossRef]
- Henderson, V. Urban primacy, external costs, and quality of life. Resour. Energy Econ. 2002, 24, 95–106. Available online: http://www.sciencedirect.com/science/article/pii/S0928-7655(01)00052-5 (accessed on 27 April 2020). [CrossRef]
- Maibach, M.; Schreyer, C.; Sutter, D.; Van Essen, H.P.; Boon, B.H.; Smokers, R.; Schroten, A.; Doll, C.; Pawłowska, B.; Bąk, M. Handbook on Estimation of External Cost in the Transport Sector Internalisation Measures and Policies for All External Cost of Transport (IMPACT), Delft, CE. 2007. Available online: https://ec.europa.eu/transport/sites/transport/files/studies/internalisation-handbook-isbn-978-92-79-96917-1.pdf (accessed on 28 April 2020).
- Jeroen, C.; Van den Bergh, J.M. Externality or sustainability economics? Ecol. Econ. 2010, 69, 2047–2052. Available online: http://www.uvm.edu/~jfarley/EEseminar/readings/externality%20and%20sustainability.pdf (accessed on 29 April 2020). [CrossRef]
- Nowak, M. Planowanie i Zagospodarowanie Przestrzenne. Komentarz do Ustawy i Przepisów Powiązanych; Wydawnictwo C.H. Beck: Warszawa, Poland, 2020. [Google Scholar]
- Gibas, P.; Heffner, K. Społeczne i ekonomiczne koszy bezładu przestrzeni–osadnictwo obszarów wiejskich. In Koszty Chaosu Przestrzennego, Studia KPZK PAN; Kowalewski, A., Markowski, T., Śleszyński, P., Eds.; Committee for Spatial Economy and Regional Planning Polish Academy of Sciences: Warszawa, Poland, 2018; Volume 182, Pt 2, pp. 163–195. Available online: http://www.czasopisma.pan.pl/dlibra/publication/123408/edition/107637/content/spoleczne-i-ekonomiczne-koszty-bezladu-przestrzeni-osadnictwo-obszarow-wiejskich-gibas-piotr-heffner-krystian (accessed on 27 April 2020).
- Śleszyński, P. Społeczno-ekonomiczne skutki chaosu przestrzennego dla osadnictwa i struktury funkcjonalnej terenów. In Koszty Chaosu Przestrzennego, Studia KPZK PAN; Kowalewski, A., Markowski, T., Śleszyński, P., Eds.; Committee for Spatial Economy and Regional Planning Polish Academy of Sciences: Warszawa, Poland, 2018; Volume 182, Pt 2, pp. 29–80. Available online: http://journals.pan.pl/dlibra/publication/123405/edition/107634/content/spoleczno-ekonomiczne-skutki-chaosu-przestrzennego-dla-osadnictwa-i-struktury-funkcjonalnej-terenow-sleszynski-przemyslaw?language=pl (accessed on 27 April 2020).
- Lityński, P. Suburban vs. urban fringes entities’ willingness to pay for amenities: Empirical research in Cracow city, Poland. JURA 2015, 1, 21–34. Available online: https://www.researchgate.net/publication/282744471_Suburban_vs_Urban_fringes_entities’_willingness_to_pay_for_amenities_Empirical_research_in_Cracow_city_Poland (accessed on 22 April 2020).
- Lorens, P. Trends and problems of contemporary urbanization processes in Poland. In Spatial Planning and Urban Development in the New EU Member States; Altrock, U., Ed.; Routledge: Abingdon, UK, 2017; pp. 109–126. Available online: https://www.routledge.com/Spatial-Planning-and-Urban-Development-in-the-New-EU-Member-States-From/Altrock-Guntner-Peters/p/book/9780754646846 (accessed on 22 April 2020).
- Mantey, D.; Sudra, P. Types of suburbs in post-socialist Poland and their potential for creating public spaces. Cities 2019, 88, 209–221. [Google Scholar] [CrossRef]
- Halleux, J.M.; Marcinczak, S.; Van der Krabben, E. The adaptive efficiency of land use planning measured by the control of urban sprawl. The cases of the Netherlands, Belgium and Poland. Land Use Policy 2012, 29, 887–898. [Google Scholar] [CrossRef]
- Nowak, M. The Stakeholders and Municipal Authorities in the Spatial Competition. Biuletyn KPZK PAN 2017, 265, 22–35. Available online: http://www.czasopisma.pan.pl/dlibra/publication/115942/edition/100772/content/the-stakeholders-and-municipal-authoritiesin-the-spatial-competition-maciej-j-nowak (accessed on 22 April 2020).
- Gutry-Korycka, M. (Ed.) Urban Sprawl. Warsaw Agglomeration Case Study; Warsaw Uniwersity Press: Warsaw, Poland, 2005. [Google Scholar]
- Marszał, T. Łódź Metropolitan Area: Delimitation, planning and development. Geogr. Pol. 2017, 90, 281–300. [Google Scholar] [CrossRef] [Green Version]
- Lityński, P. The correlation between urban sprawl and the local economy in Poland. Urban Izziv 2016, 27, 86–96. [Google Scholar] [CrossRef]
- Łaguna, D. Finansowe skutki lokalizacji elektrowni wiatrowych w przestrzeni rolniczej. Ekon. Środowisko 2015, 3, 67–80. Available online: http://ekonomiaisrodowisko.pl/uploads/05%20laguna.pdf (accessed on 23 April 2020).
- Olbrysz, A.; Zachariasz, I. Raport o finansowych skutkach polskiego systemu gospodarowania przestrzenią. In Sprawne Państwo. Samorządowa Służba Cywilna. Obszary Metropolitalne. Zagospodarowanie Przestrzenne. Badania nad Kierunkami Zmian w Funkcjonowaniu Samorządu Terytorialnego w Polsce; Kopyciński, P., Ed.; Uniwersytet Ekonomiczny w Krakowie, Małopolska Szkoła Administracji Publicznej: Kraków, Poland, 2015; pp. 183–326. Available online: http://www.pri.msap.pl/doki/publ/SWPZ_Samorzadowa_sluzba_2015.pdf (accessed on 20 April 2020).
- Węcławowicz, G. Contemporary Poland. Space and Society; UCL Press: London, UK, 1996. [Google Scholar]
- Dmochowska-Dudek, K.; Bednarek-Szczepańska, M. A profile of the Polish rural NIMBY ist. J. Rural Stud. 2018, 58, 52–66. [Google Scholar] [CrossRef]
- Karwińska, A.; Böhm, A.; Kudłacz, M. The phenomenon of urban sprawl in modern Poland: Causes, effects and remedies. Zarządzanie Publiczne/Public Gov. 2018, 3, 26–43. [Google Scholar] [CrossRef] [Green Version]
- Wolny, A.; Źróbek, R. The interdependence between suburban enclaves and the road network in the development process: A case study in Poland. Geogr. Pol. 2017, 90, 41–57. [Google Scholar] [CrossRef] [Green Version]
- Borkowski, P.; Burnewicz, J.; Koźlak, A.; Pawłowska, B.; Ważna, A. Transport a organizacja przestrzeni w życiu społeczno-gospodarczym. In Koszty Chaosu Przestrzennego; Kowalewski, A., Markowski, T., Śleszyński, P., Eds.; Committee for Spatial Economy and Regional Planning Polish Academy of Sciences: Warszawa, Poland, 2018; pp. 81–113. Available online: http://journals.pan.pl/dlibra/publication/123406/edition/107635/content (accessed on 2 May 2020).
- Niedzielski, M.; Śleszyński, P. Analyzing accessibility by transport mode in Warsaw, Poland. Geogr. Pol. 2008, 81, 61–78. Available online: http://rcin.org.pl/igipz/Content/151/GP_81_2_2008_i.pdf#page=61 (accessed on 1 May 2020).
- Krzysztofik, R.; Kantor-Pietraga, I.; Runge, A.; Spórna, T. Is the suburbanisation stage always important in the transformation of large urban agglomerations? The case of the Katowice conurbation. Geogr. Pol. 2017, 90, 5–24. [Google Scholar] [CrossRef]
- Lityński, P.; Hołuj, A. Urban sprawl costs: The valuation of households’ losses in Poland. JSSP 2017, 8, 11–35. [Google Scholar] [CrossRef]
- Korcelli, P.; Grochowski, M.; Kozubek, E.; Korcelli-Olejniczak, E.; Werner, P. Development of Urban-Rural Regions: From European to Local Perspective; Monografie, 14; IGiPZ PAN: Warszawa, Poland, 2012. [Google Scholar]
- Solon, J. Spatial context of urbanization: Landscape pattern and changes between 1950 and 1990 in the Warsaw metropolitan area, Poland. Landsc. Urban Plan. 2009, 93, 250–261. [Google Scholar] [CrossRef] [Green Version]
- Jaździk-Osmólska, A. Wycena kosztów wypadków i kolizji drogowych na sieci dróg w Polsce na koniec roku 2015, z wyodrębnieniem średnich kosztów społeczno-ekonomicznych wypadków na transeuropejskiej sieci transportowej. Krajowa Rada Bezpieczeństwa Ruchu Drogowego. Listopad 2016. Available online: https://www.krbrd.gov.pl/files/file_add/download/393_wycena-kosztow-wypadkow-i-kolizji-drogowych-2015.pdf (accessed on 1 May 2020).
- Mickiewicz, P.; Nowak, M. Instrumenty zarządzania przestrzenią w kształtowaniu zrównoważonego rozwoju w kontekście planowania i budowy dróg. Studia KPZK PAN 2013, 152, 207–219. Available online: http://journals.pan.pl/skpzk/110378 (accessed on 25 April 2020).
- Kołodziejczak, A.; Głębocki, B.; Kacprzak, E.; Maćkiewicz, B.; Szczepańska, M. Społeczne i ekonomiczne koszty bezładu przestrzennego w rolnictwie. In Koszty Chaosu Przestrzennego; Kowalewski, A., Markowski, T., Śleszyński, P., Eds.; Committee for Spatial Economy and Regional Planning Polish Academy of Sciences: Warszawa, Poland, 2018; pp. 239–279. [Google Scholar]
- Nowak, M.; Łaźniewska, E. Decyzje o podziałach nieruchomości gminnych jako czynnik wspierający konkurencyjność Szczecińskiego Obszaru Metropolitalnego. Studia Reg. Lokalne 2009, 4, 67–85. Available online: http://www.studreg.uw.edu.pl/pdf/2009_4_nowak_lazniewska.pdf (accessed on 22 April 2020).
- Izdebski, W.; Śleszyński, P.; Malinowski, Z.; Kursa, M. Analiza morfometryczna planów miejscowych w Polsce. Infrastrukt. Ekol. Teren. Wiej. 2018, II/1, 331–347. [Google Scholar] [CrossRef]
- Solecka, I.; Sylla, M.; Świąder, M. Urban sprawl impact on farmland conversion in suburban area of Wroclaw, Poland. In IOP Conference Series: Materials Science and Engineering, 245, Session, V. Integrated Coastal Zone Planning, Urban Space and Green Design, Teaching method and Education in Civil Engineering and Architecture, City and Regional Planning Education; WMCAUS: Prague, Czech Republic, 2017. [Google Scholar] [CrossRef]
- Maćkiewicz, B.; Karalus-Wiatr, C. Agricultural land on built–up housing lots and incomes of communes: An example of Rokietnica commune in Poznań agglomeration. Quaest. Geogr. 2017, 36, 95–106. [Google Scholar] [CrossRef] [Green Version]
- Głębocki, B. Zmiany w strukturze agrarnej polskiego rolnictwa w latach 2002–2012. In Zróżnicowanie Przestrzenne Rolnictwa; Głębocki, B., Ed.; Zakład Wydawnictw Statystycznych GUS: Warszawa, Poland, 2014; pp. 14–51. [Google Scholar]
- Heffner, K.; Czarnecki, A. Wpływ zjawiska drugich domów na rozwój obszarów wiejskich. In Drugie Domy w Rozwoju Obszarów Wiejskich; Heffner, K., Czarnecki, A., Eds.; Instytut Rozwoju Wsi i Rolnictwa PAN: Warszawa, Poland, 2011; pp. 131–162. [Google Scholar]
- Maćkiewicz, B.; Andrzejewski, A.; Kacprzak, E. Koszty bezładu przestrzennego na rynku nieruchomości. In Koszty Chaosu Przestrzennego, Studia KPZK PAN; Kowalewski, A., Markowski, T., Śleszyński, P., Eds.; Committee for Spatial Economy and Regional Planning Polish Academy of Sciences: Warszawa, Poland, 2018; Volume 182, Pt 2, pp. 280–316. Available online: http://journals.pan.pl/dlibra/publication/123412/edition/107641/content (accessed on 20 April 2020).
- Śleszyński, P.; Andrzejewska, M.; Cerić, D.; Deręgowska, A.; Komornicki, T.; Rusztecka, M.; Solon, J.; Sudra, P.; Zielińska, B. Analiza stanu i uwarunkowań prac planistycznych w gminach w 2014 roku. In IGiPZ PAN, na Zlecenie Ministerstwa Infrastruktury i Rozwoju; MIiR: Warszawa, Poland, 2016. [Google Scholar]
- Wiśniewski, R.; Szejgiec-Kolenda, B.; Śleszyński, P. Population changes and population ageing in Poland between 1960 and 2011. Geogr. Pol. 2016, 89, 259–265. [Google Scholar] [CrossRef]
- Heffner, K.; Klemens, B.; Solga, B. Challenges of Regional Development in the Context of Population Ageing. Analysis Based on the Example of Opolskie Voivodeship. Sustainability 2019, 11, 5207. [Google Scholar] [CrossRef] [Green Version]
- Śleszyński, P. Potencjalne koszty odszkodowawcze związane z niewłaściwym planowaniem przestrzennym w gminach. In Koszty Chaosu Przestrzennego, Studia KPZK PAN; Kowalewski, A., Markowski, T., Śleszyński, P., Eds.; Committee for Spatial Economy and Regional Planning Polish Academy of Sciences: Warszawa, Poland, 2018; pp. 404–424. Available online: http://www.czasopisma.pan.pl/dlibra/publication/123416/edition/107645/content/potencjalne-koszty-odszkodowawcze-zwiazane-z-niewlasciwym-planowaniem-przestrzennym-w-gminach-sleszynski-przemyslaw (accessed on 25 April 2020).
- Koziński, J. Doktryna swobody budowlanej, aspekty ekonomiczne i planistyczne. Probl. Planistyczne Wiosna 2012, 1, 5–24. [Google Scholar]
- Krajewska, M.; Pawłowski, K. Coherent Land Policy and Land Value. Geomat. Environ. Eng. 2019, 13, 33–48. [Google Scholar] [CrossRef]
- Kiełducki, J.; Blaszke, M. Przeznaczenie i renta planistyczna w miejscowych planach zagospodarowania przestrzennego. Świat Nieruchom. 2019, 107, 17–24. [Google Scholar] [CrossRef]
- Nowak, M. Ustawa o Planowaniu i Zagospodarowaniu Przestrzennym. Komentarz; Wydawnictwo C.H. Beck: Warszawa, Poland, 2012. [Google Scholar]
- Chmielewski, T.; Chmielewski, S.; Kułak, A. Wpływ bezładu przestrzennego na krajobrazowe systemy ekologiczne. In Koszty Chaosu Przestrzennego, Studia KPZK PAN; Kowalewski, A., Markowski, T., Śleszyński, P., Eds.; Committee for Spatial Economy and Regional Planning Polish Academy of Sciences: Warszawa, Poland, 2018; Volume 182, Pt 2, pp. 317–340. Available online: http://journals.pan.pl/dlibra/publication/123413/edition/107642/content (accessed on 23 April 2020).
- Bucała-Hrabia, A. Land use changes and their catchment-scale environmental impact in the Polish Western Carpathians during transition from centrally planned to free-market economics. Geogr. Pol. 2018, 91, 171–196. [Google Scholar] [CrossRef]
- Pukowiec-Kurda, K. Landscape texture in anthropogenically transformed regions: The example of Upper Silesia and the Dąbrowa Coal Basin (southern Poland). Geogr. Pol. 2018, 91, 489–500. [Google Scholar] [CrossRef] [Green Version]
- Śleszyński, P.; Solon, J. A map of the landscape diversity of Poland. Geogr. Pol. 2017, 90, 369–377. [Google Scholar] [CrossRef] [Green Version]
- Naveh, Z.; Lieberman, A.S. Landscape Ecology: Theory and Application, 7th ed.; Springer: Berlin/Heidelberg, Germany, 2013; Available online: https://www.springer.com/gp/book/9780387940595 (accessed on 5 May 2020).
- Kuchcik, M.; Milewski, P. Zanieczyszczenie powietrza w Polsce–stan, przyczyny i skutki. In Koszty Chaosu Przestrzennego, Studia KPZK PAN; Kowalewski, A., Markowski, T., Śleszyński, P., Eds.; Committee for Spatial Economy and Regional Planning Polish Academy of Sciences: Warszawa, Poland, 2018; Volume 182, Pt 2, pp. 341–364. Available online: http://journals.pan.pl/dlibra/publication/123414/edition/107643/content (accessed on 4 May 2020).
- Annex. Economic Cost of Deaths from Air Pollution (Outdoor and Indoor) per Country, as a Percentage of GDP WHO European Region, 2010; World Health Organization. Regional Office in Europe: Copenhagen, Denmark, 2010; Available online: http://www.euro.who.int/__data/assets/pdf_file/0008/276956/PR_Economics-Annex_en.pdf?ua=1 (accessed on 25 April 2020).
- Badyda, A. Analiza i Ocena Efektów Oddziaływania Wybranych Uciążliwości Ruchu Drogowego na Środowisko Miejskie w Warszawie. Ph.D. Thesis, Warsaw University of Technology, Faculty of Environmental Engineering, Warszawa, Poland, 2016. manuscript. [Google Scholar]
- Łowicki, D. Variability of the particulate matter air pollution of Polish cities with a prediction until 2020. Geogr. Pol. 2019, 92, 161–171. [Google Scholar] [CrossRef]
- Badyda, A.; Dąbrowiecki, P. Cardiopulmonary diseases and lung cancer mortality due to PM2.5 exposure in 11 Polish Agglomerations in 2006–2015. Eur. Respir. J. 2018, 52, PA4501. [Google Scholar] [CrossRef]
- Czechowski, P.O.; Dąbrowiecki, P.; Oniszczuk-Jastrząbek, A.; Bielawska, M.; Czermański, E.; Owczarek, T.; Rogula-Kopiec, P.; Badyda, A. A Preliminary Attempt at the Identification and Financial Estimation of the Negative Health Effects of Urban and Industrial Air Pollution Based on the Agglomeration of Gdańsk. Sustainability 2020, 12, 42. [Google Scholar] [CrossRef] [Green Version]
- Giedych, R.; Szulczewska, B.; Dobson, S.; Halounova, L.; Doygun, H. Green Infrastructure as a Tool of Urban Areas Sustainable Development. Understanding Cities: Advances in Integrated Assessment of Urban Sustainability; Centre for Earth System Engineering Research: Newcastle, UK, 2014; pp. 94–108. [Google Scholar]
- Baran-Zgłobicka, B. The Problem of Protecting the Natural Environment in Spatial Planning in Rural Areas in South–Eastern Poland. Inż. Ekolog. 2015, 45, 114–123. [Google Scholar] [CrossRef] [Green Version]
- Nowak, M.J.; Kiepas-Kokot, A. Ograniczenia środowiskowe w instrumentach zarządzania przestrzenią na szczeblu gminnym w województwie zachodniopomorskim ze szczególnym uwzględnieniem gmin cennych przyrodniczo. Studia Reg. Lokalne 2014, 4, 144–163. Available online: http://yadda.icm.edu.pl/yadda/element/bwmeta1.element.ekon-element-000171336033 (accessed on 23 April 2020).
- Szczepańska, A.; Wasilewicz-Pszczółkowska, M. Green infrastructure as a determinant of the quality of urban life and a barrier to the development of a city: A case study. Geogr. Pol. 2018, 91, 469–487. [Google Scholar] [CrossRef]
- Szulczewska, B.; Giedych, R.; Borowski, J.; Kuchcik, M.; Sikorski, P.; Mazurkiewicz, A.; Stańczyk, T. How much green is needed for a vital neighbourhood? In search for empirical evidence. Land Use Policy 2014, 38, 330–345. [Google Scholar] [CrossRef]
- Bartczak, A.; Żylicz, T. Willingness to pay for forest cleaning in Poland: Results from a Contingent Valuation survey. Ekon. Środowisko 2014, 4, 137–145. [Google Scholar]
- Sabyrbekov, R.; Dallimer, M.; Navrud, S. Nature affinity and willingness to pay for urban green spaces in a developing country. Landsc. Urban Plan. 2020, 194. [Google Scholar] [CrossRef]
- Ives, C.D.; Kendal, D. The role of social values in the management of ecological systems. J. Environ. Manag. 2014, 144, 67–72. [Google Scholar] [CrossRef]
- Edlund, F. The Function and Perception of Urban Ecosystem Services in the Society. Probl. Ekorozw. Probl. Sustain. Dev. 2020, 1, 15–23. [Google Scholar]
- Kourdounouli, C.; Jönsson, A.M. Urban ecosystem conditions and ecosystem services–a comparison between large urban zones and city cores in the EU. J. Environ. Plan. Manag. 2020, 63, 798–817. [Google Scholar] [CrossRef]
- Śleszyński, P.; Komornicki, T.; Górczyńska, M.; Deręgowska, A.; Zielińska, B. Analiza Stanu i Uwarunkowań Prac Planistycznych w Gminach na Koniec 2011 Roku. IGiPZ PAN, na Zlecenie Ministerstwa Transportu; Budownictwa i Gospodarki Morskiej: Warszawa, Poland, 2013. [Google Scholar]
- Śleszyński, P.; Deręgowska, A.; Mazurek, D.; Stępniak, M.; Sudra, P.; Zielińska, B. Analiza Stanu i Uwarunkowań prac Planistycznych w Gminach w 2015 Roku; IGiPZ PAN na Zlecenie Ministerstwa Infrastruktury i Budownictwa: Warszawa, Poland, 2017. [Google Scholar]
- Wojtczuk, M. 100 mln zł kary grozi stołecznemu ratuszowi. Za uchylanie się od wykupu gruntów pod drogi w Miasteczku Wilanów. Gazeta Stołeczna, 11 August 2017
- Kisiel, B.; Fertsch, K. Nad Miastem Wisi Groźba Wypłaty 760 mln zł Odszkodowań; Głos Wielkopolski: Poznań, Poland, 2017. [Google Scholar]
- Mikuła, Ł. Polityka przestrzenna a rozwój aglomeracji: Pomiędzy konkurencją a integracją. In Kształtowanie Współczesnej Przestrzeni Miejskiej; Madurowicz, M., Ed.; Instytut Geografii Społeczno-Ekonomicznej i Gospodarki Przestrzennej, WGiSR, UW: Warszawa, Poland, 2014; pp. 526–537. [Google Scholar]
- Jeżak, J. Ekonomiczne Aspekty Rozpraszania Zabudowy w Regionach Miejskich na Przykładzie Aglomeracji Krakowa. Ph.D. Thesis, Cracow University of Economics, Kraków, Poland, 2011. [Google Scholar]
- Śleszyński, P. Warszawa i Obszar Metropolitalny Warszawy a Rozwój Mazowsza; Trendy Rozwojowe Mazowsza, MBPR: Warszawa, Poland, 2012. [Google Scholar]
- Rzepnikowska, M.; Mikolajczak, R.; Antczak, A.; Bracik, A.; Wójcik, M. Raport o Korkach w 7 Największych Miastach Polski. Warszawa, Wrocław, Kraków, Poznań, Gdańsk, Łódź, Katowice; Dane za rok 2015; Deloitte, targeo.pl: Warszawa, Poland, 2016; Available online: https://www2.deloitte.com/content/dam/Deloitte/pl/Documents/Reports/pl_korki_raport_2016_2marca.pdf (accessed on 1 May 2020).
- Olbrysz, A.; Koziński, J. Raport o finansowych efektach polskiego systemu gospodarowania przestrzenią. Opracowany w ramach prac badawczych zespołu Finanse w urbanizacji, przy wsparciu FIO oraz Związku Gmin Wiejskich 2011, manuscript.
- Kuboń, M. Koszty oraz formy obsługi transportowej gospodarstw rolniczych. Inżynieria Rol. 2006, 13, 233–240. [Google Scholar]
- Janku, K.; Matczak, P.; Pińskwar, I.; Weyssenhoff, H. Assessment of Costs and Benefits of Shelterbelts Implementation as an Adaptation Option to Climate Changes; Raport Climate Changes–Appendix 8.3, ADAM Adaptation And Mitigation Strategies: Supporting European climate policy; Institute for Agricultural and Forest Environment of Polish Academy of Sciences: Poznań, Poland, 2010. [Google Scholar]
- Weyssenhoff, H.; Janku, K.; Ziomek, K. Materiały Niepublikowane Zakładu Biologii Środowiska Instytutu Środowiska Rolniczego i Leśnego; PAN: Poznań, Poland, 2016. [Google Scholar]
- Powszechny Spis Rolny, GUS. 2010. Available online: https://stat.gov.pl/spisy-powszechne/powszechny-spis-rolny-2010/psr2010-wyniki-spisu-rolnego/ (accessed on 1 May 2020).
- Ochrona Środowiska 2019; GUS: Warszawa, Poland, 2019. Available online: https://stat.gov.pl/obszary-tematyczne/srodowisko-energia/srodowisko/ochrona-srodowiska-2019,1,20.html (accessed on 1 May 2020).
- Ekonomiczne Aspekty Ochrony Środowiska 2019; Warszawa, Poland, 2019. Available online: https://stat.gov.pl/obszary-tematyczne/srodowisko-energia/srodowisko/ekonomiczne-aspekty-ochrony-srodowiska-2019,14,1.html (accessed on 1 May 2020).
- Ochrona Środowiska 2015; GUS: Warszawa, Poland, 2016.
- Matuszkiewicz, J.M. Potencjalna Roślinność Naturalna Polski; IGiPZ PAN: Warszawa, Poland, 2008. [Google Scholar]
- Matuszkiewicz, W.; Faliński, J.B.; Kostrowicki, A.S.; Matuszkiewicz, J.M.; Olaczek, R.; Wojterski, T. Potencjalna Roślinność Naturalna Polski; Mapa przeglądowa 1:300 000, Arkusze 1-12; IGiPZ, PAN: Warszawa, Poland, 1995. [Google Scholar]
- Koncepcja Przestrzennego Zagospodarowania Kraju 2030; Uchwała Nr 239, Rady Ministrów z 13 grudnia 2001 r. w sprawie przyjęcia Koncepcji Przestrzennego Zagospodarowania Kraju 2030, Dz. U. 2003 nr 80, poz; 2012. Available online: http://isap.sejm.gov.pl/isap.nsf/DocDetails.xsp?id=WMP20120000252 (accessed on 1 May 2020).
- Grela, J.; Słota, H.; Zieliński, J. (Eds.) Dorzecze Wisły. Monografia Powodzi Lipiec 1997; Instytut Meteorologii i Gospodarki Wodnej: Warszawa, Poland, 1997. [Google Scholar]
- Informacja o Wynikach Kontroli “Planowanie i Realizacja Inwestycji na Terenach Zagrożonych Powodzią”; Najwyższa Izba Kontroli: Warszawa, Poland, 2013. Available online: https://www.nik.gov.pl/plik/id,6180,vp,7927.pdf (accessed on 1 May 2020).
- Rabczenko, D.; Wojtyniak, B.; Wysocki, M.; Goryński, P. Krótkookresowy wpływ zanieczyszczeń powietrza atmosferycznego dwutlenkiem siarki, pyłami zawieszonymi i dwutlenkiem azotu na umieralność mieszkańców miast w Polsce. Przegląd Epidemiol. 2005, 59, 969–979. [Google Scholar]
- Sadlok, R. (Ed.) Przeciwdziałanie Niskiej Emisji na Terenach Zwartej Zabudowy Mieszkalnej. Stowarzyszenie na rzecz Efektywności Energetycznej i Rozwoju Odnawialnych Źródeł Energii “HELIOS”; 2014; Available online: https://www.researchgate.net/publication/275658632_Przeciwdzialanie_niskiej_emisji_na_terenach_zwartej_zabudowy_mieszkalnej (accessed on 1 May 2020).
Figure 1.
Classification of the causes of spatial chaos. Source: own study.

Figure 2.
Costs of excessive dispersion of buildings per capita in Poland in 2015 by communes. Source: [45].
Figure 2.
Costs of excessive dispersion of buildings per capita in Poland in 2015 by communes. Source: [45].

Figure 3.
Indicator comparing the effectiveness of the water supply network in cities and their suburban areas. The higher the multiplicity, the efficiency of suburban areas is correspondingly lower than in the main city. Source: [46].
Figure 3.
Indicator comparing the effectiveness of the water supply network in cities and their suburban areas. The higher the multiplicity, the efficiency of suburban areas is correspondingly lower than in the main city. Source: [46].
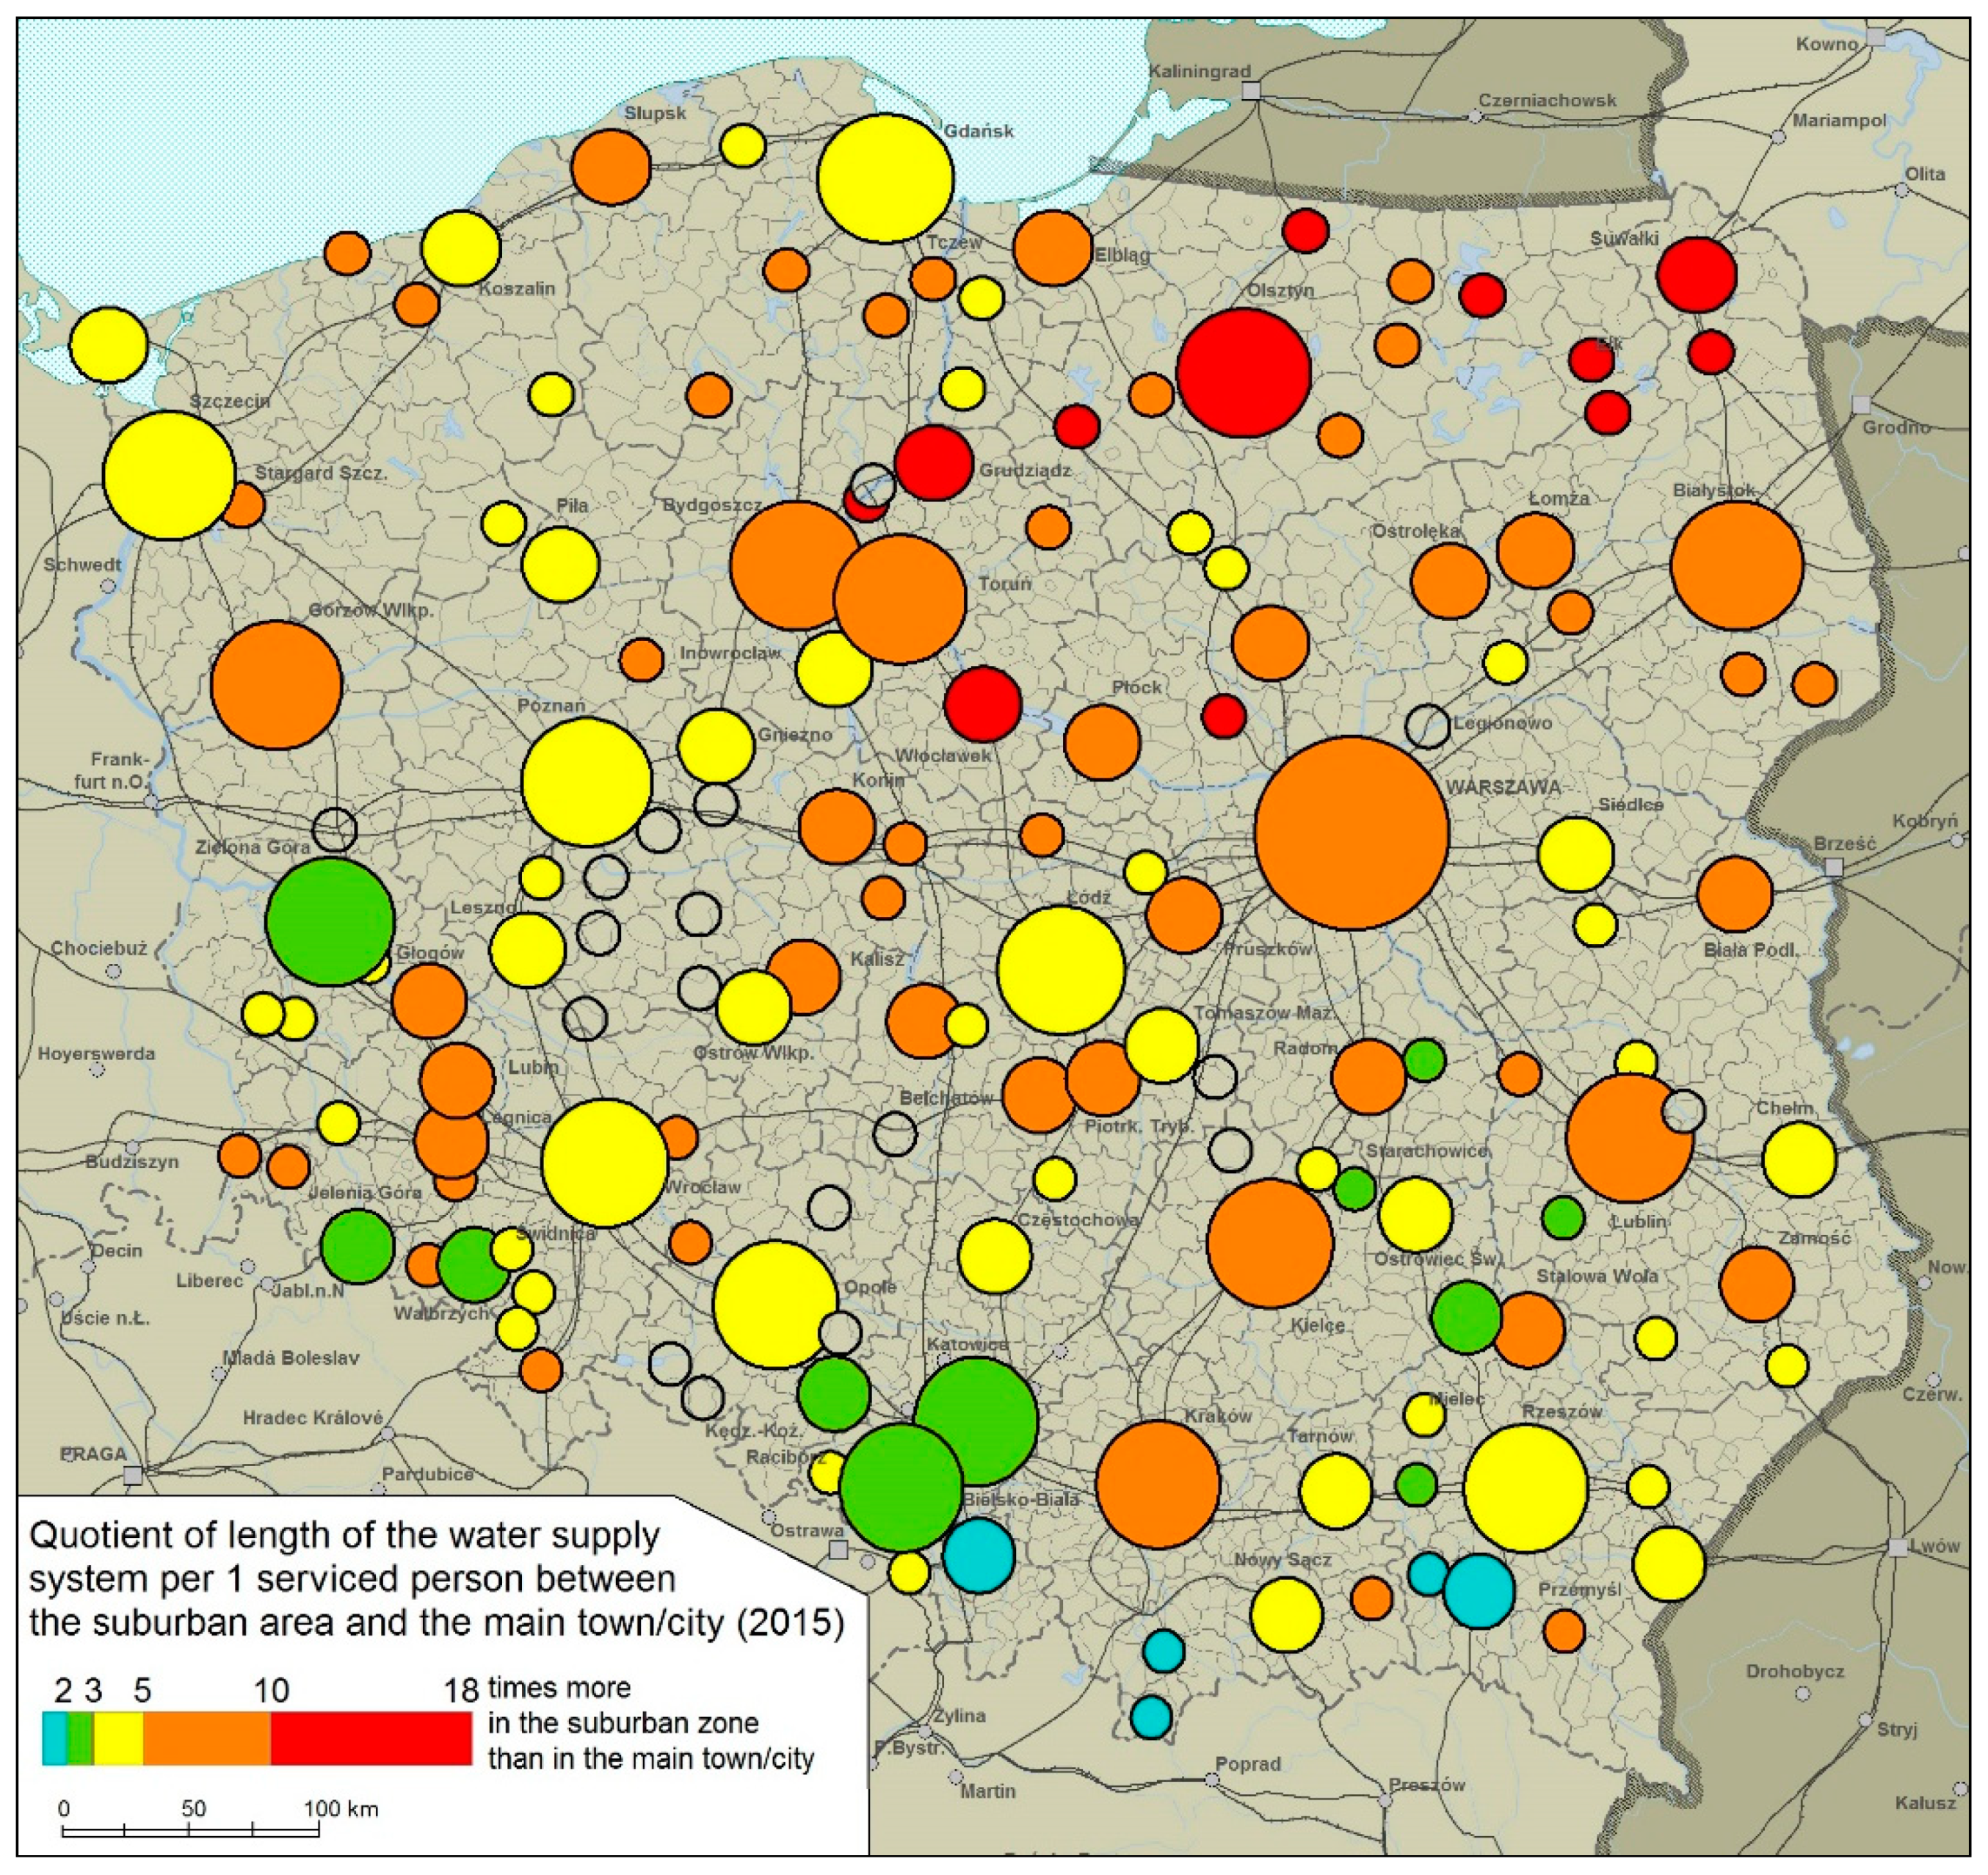
Figure 4.
Length of water supply network per capita as a measure of socio-economic efficiency and costs of spatial chaos. Source: based on Central Statistical of Poland data.
Figure 4.
Length of water supply network per capita as a measure of socio-economic efficiency and costs of spatial chaos. Source: based on Central Statistical of Poland data.
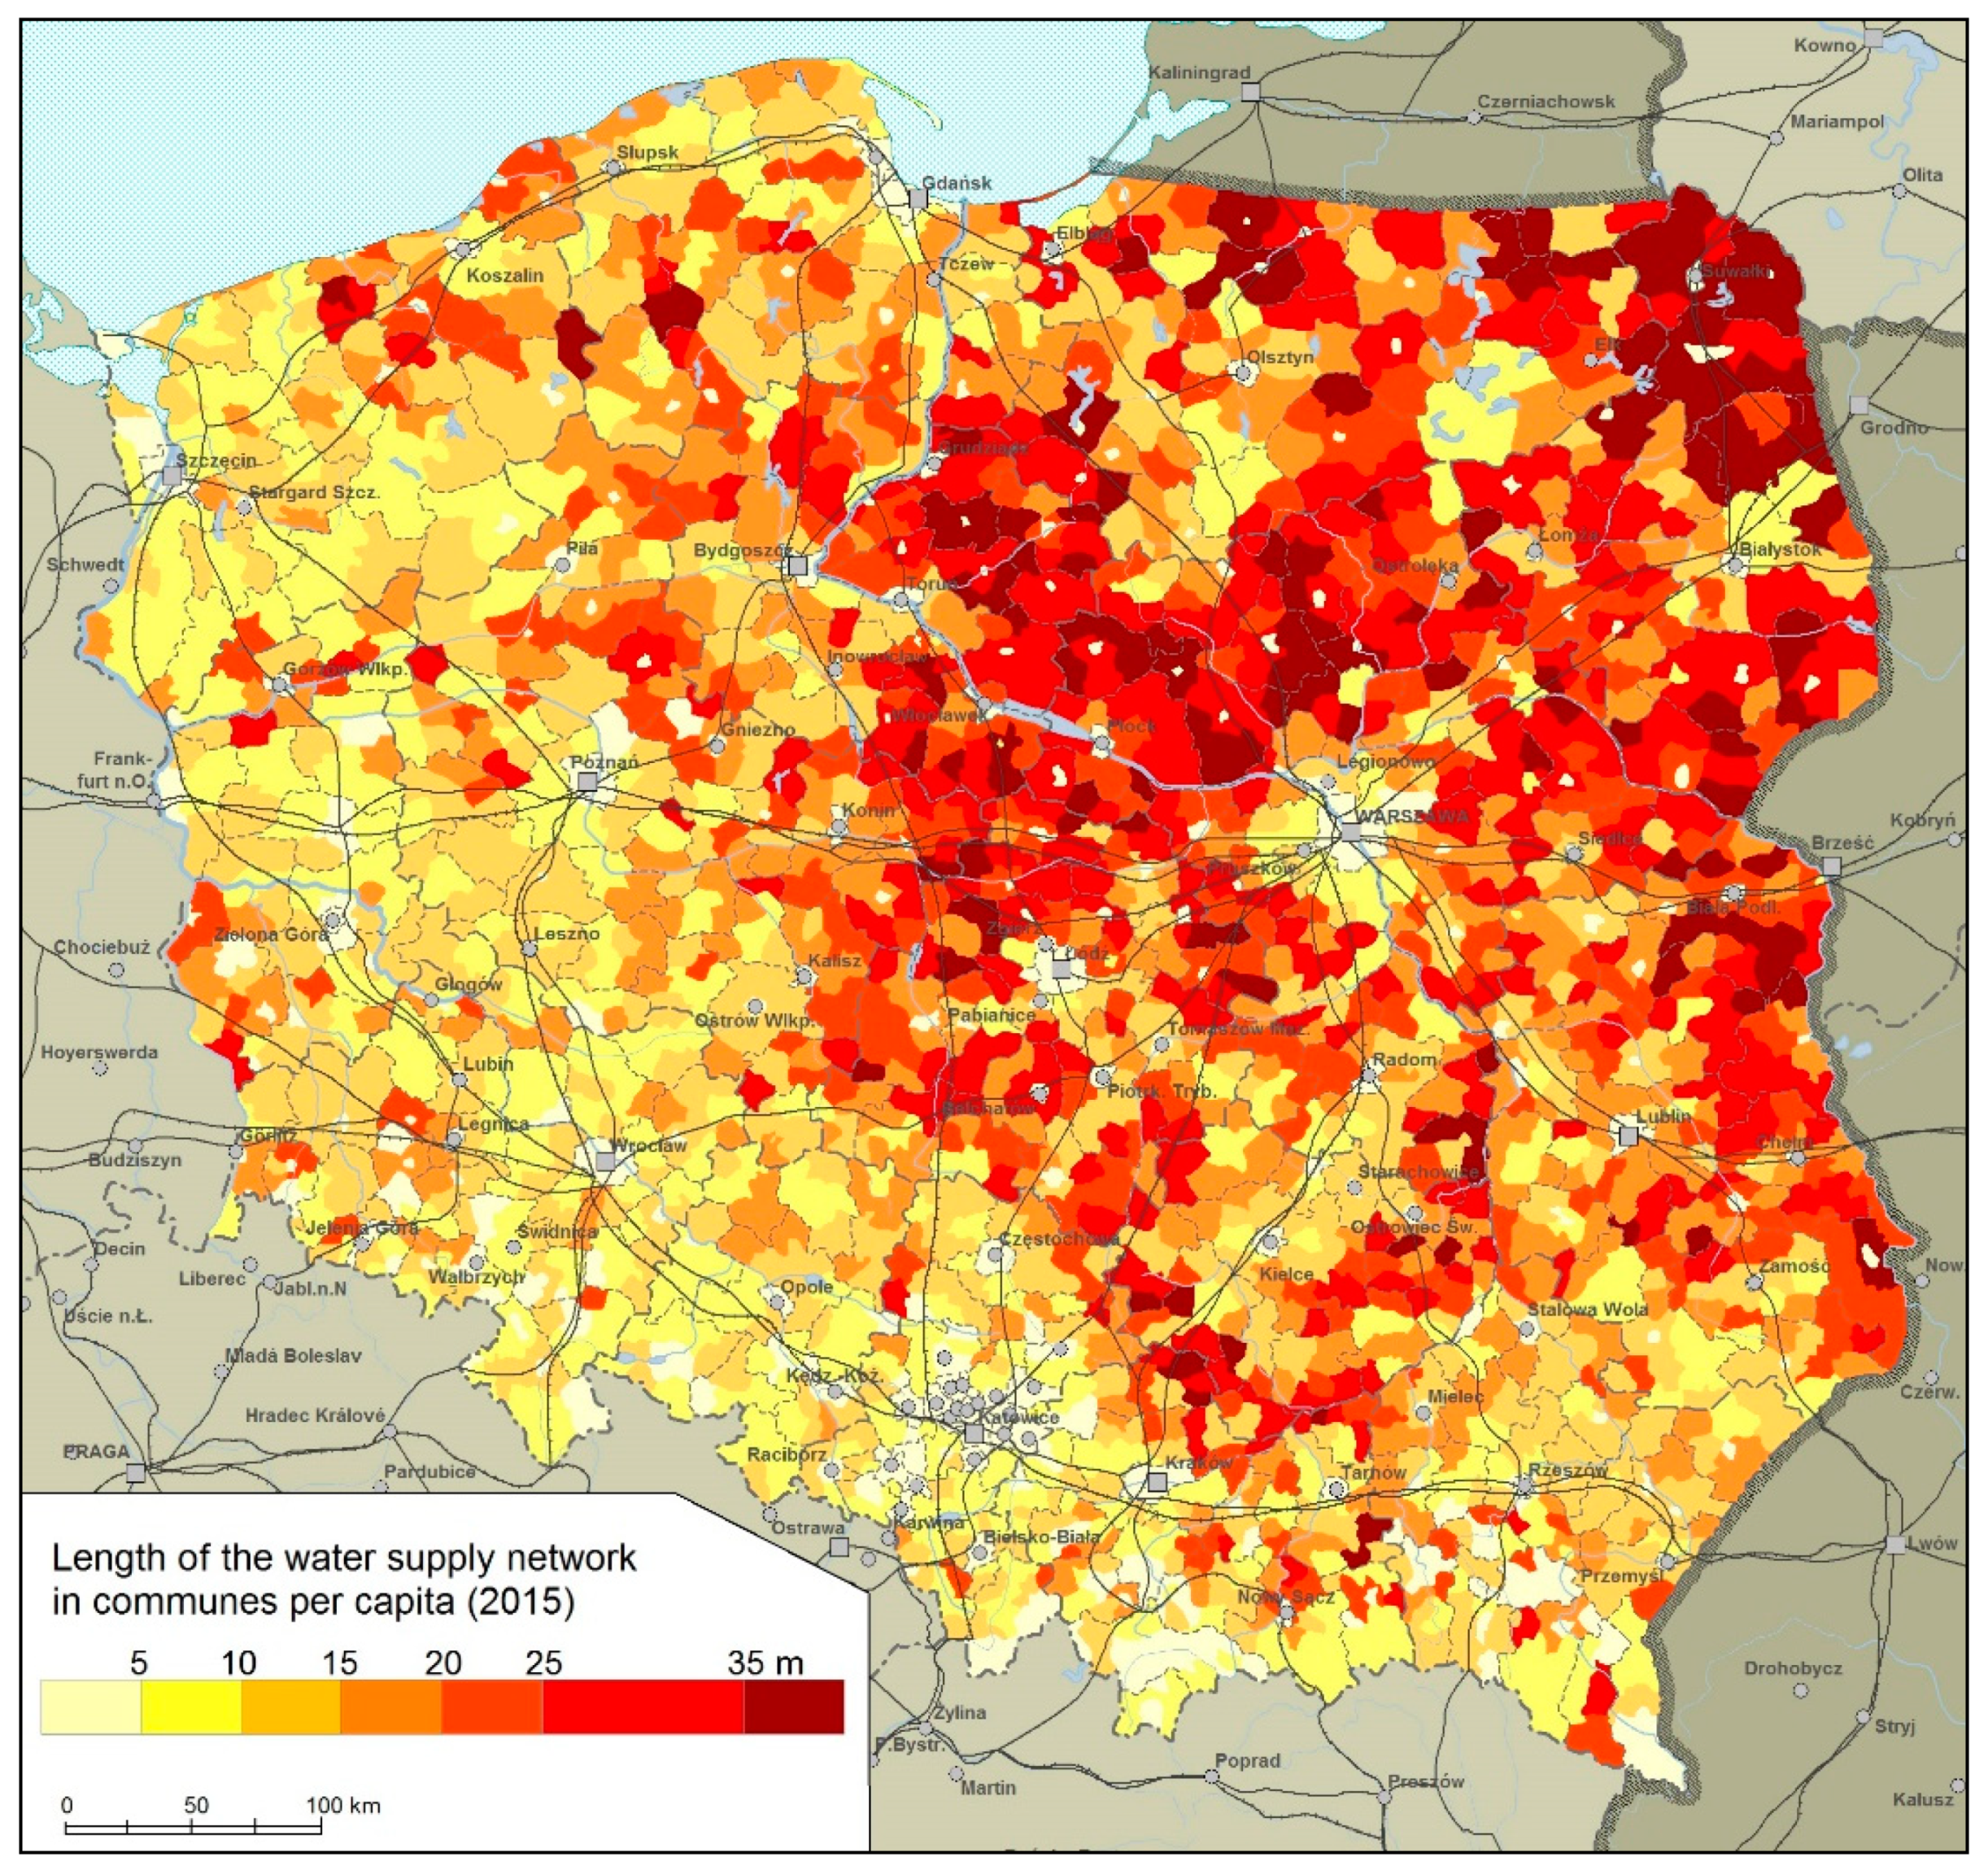
Figure 5.
Multiplicity of demographic absorbency according to the local plans in relation to the registered number of inhabitants. Source: [77].
Figure 5.
Multiplicity of demographic absorbency according to the local plans in relation to the registered number of inhabitants. Source: [77].


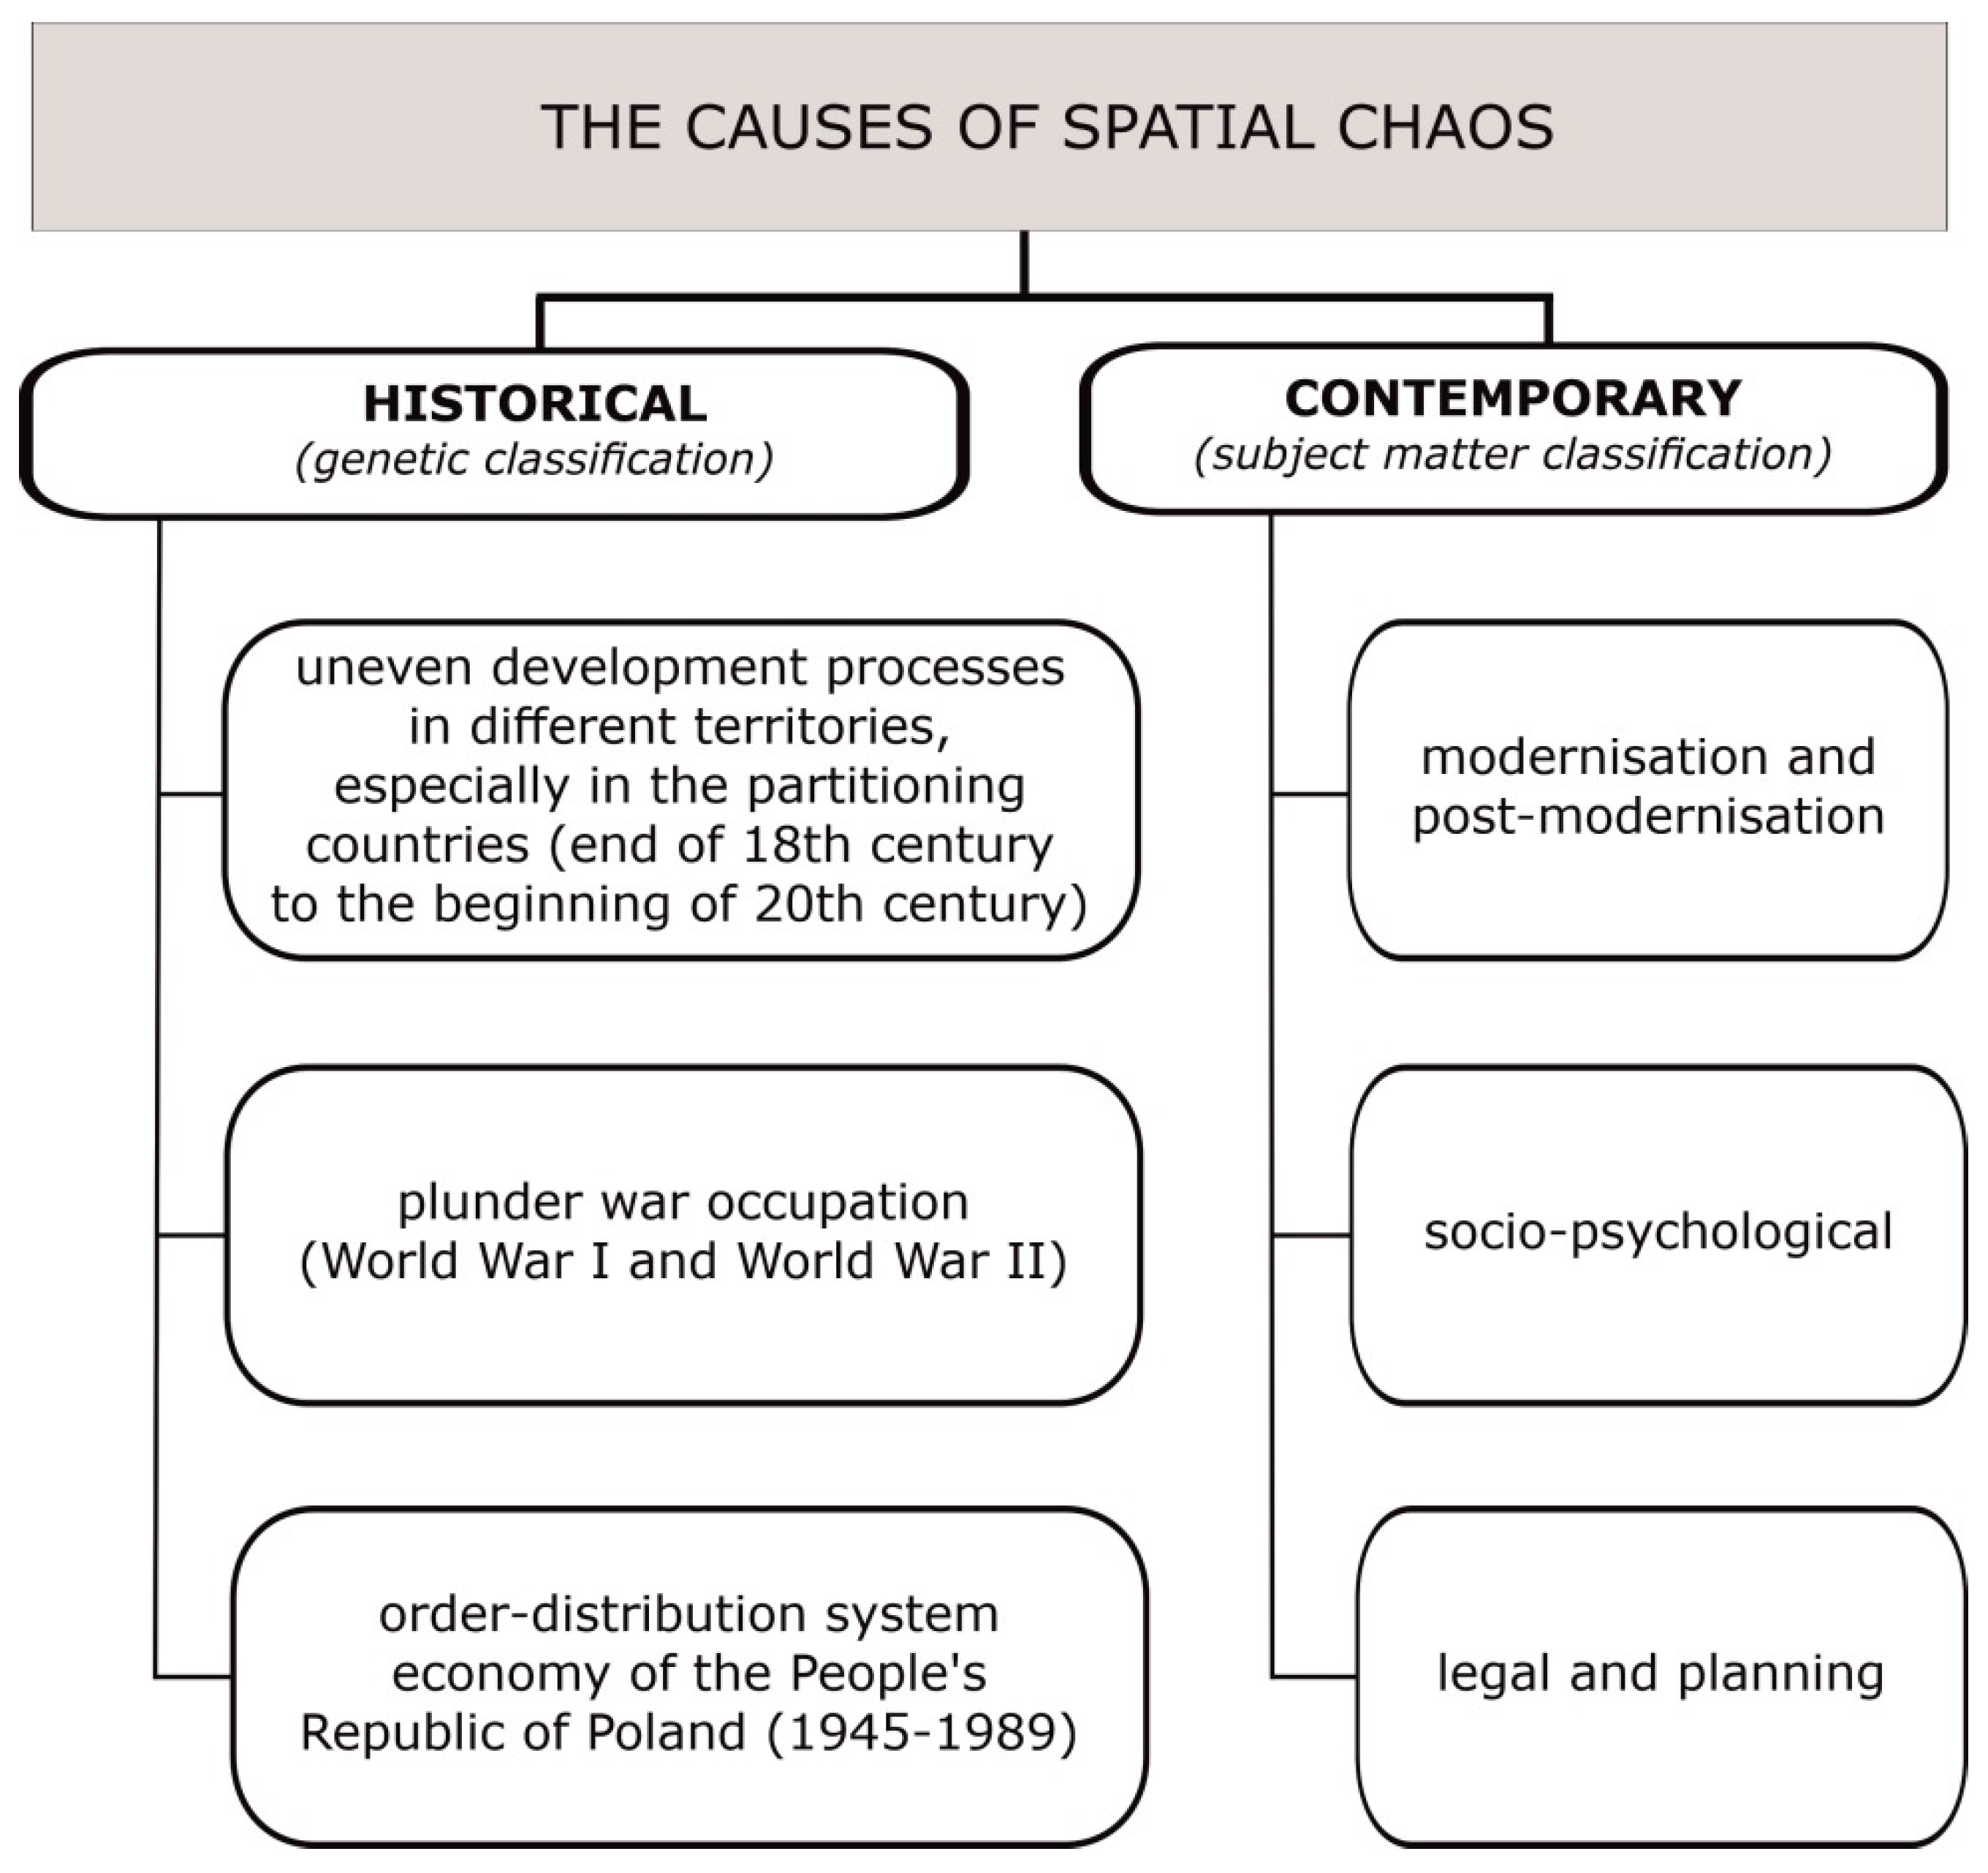
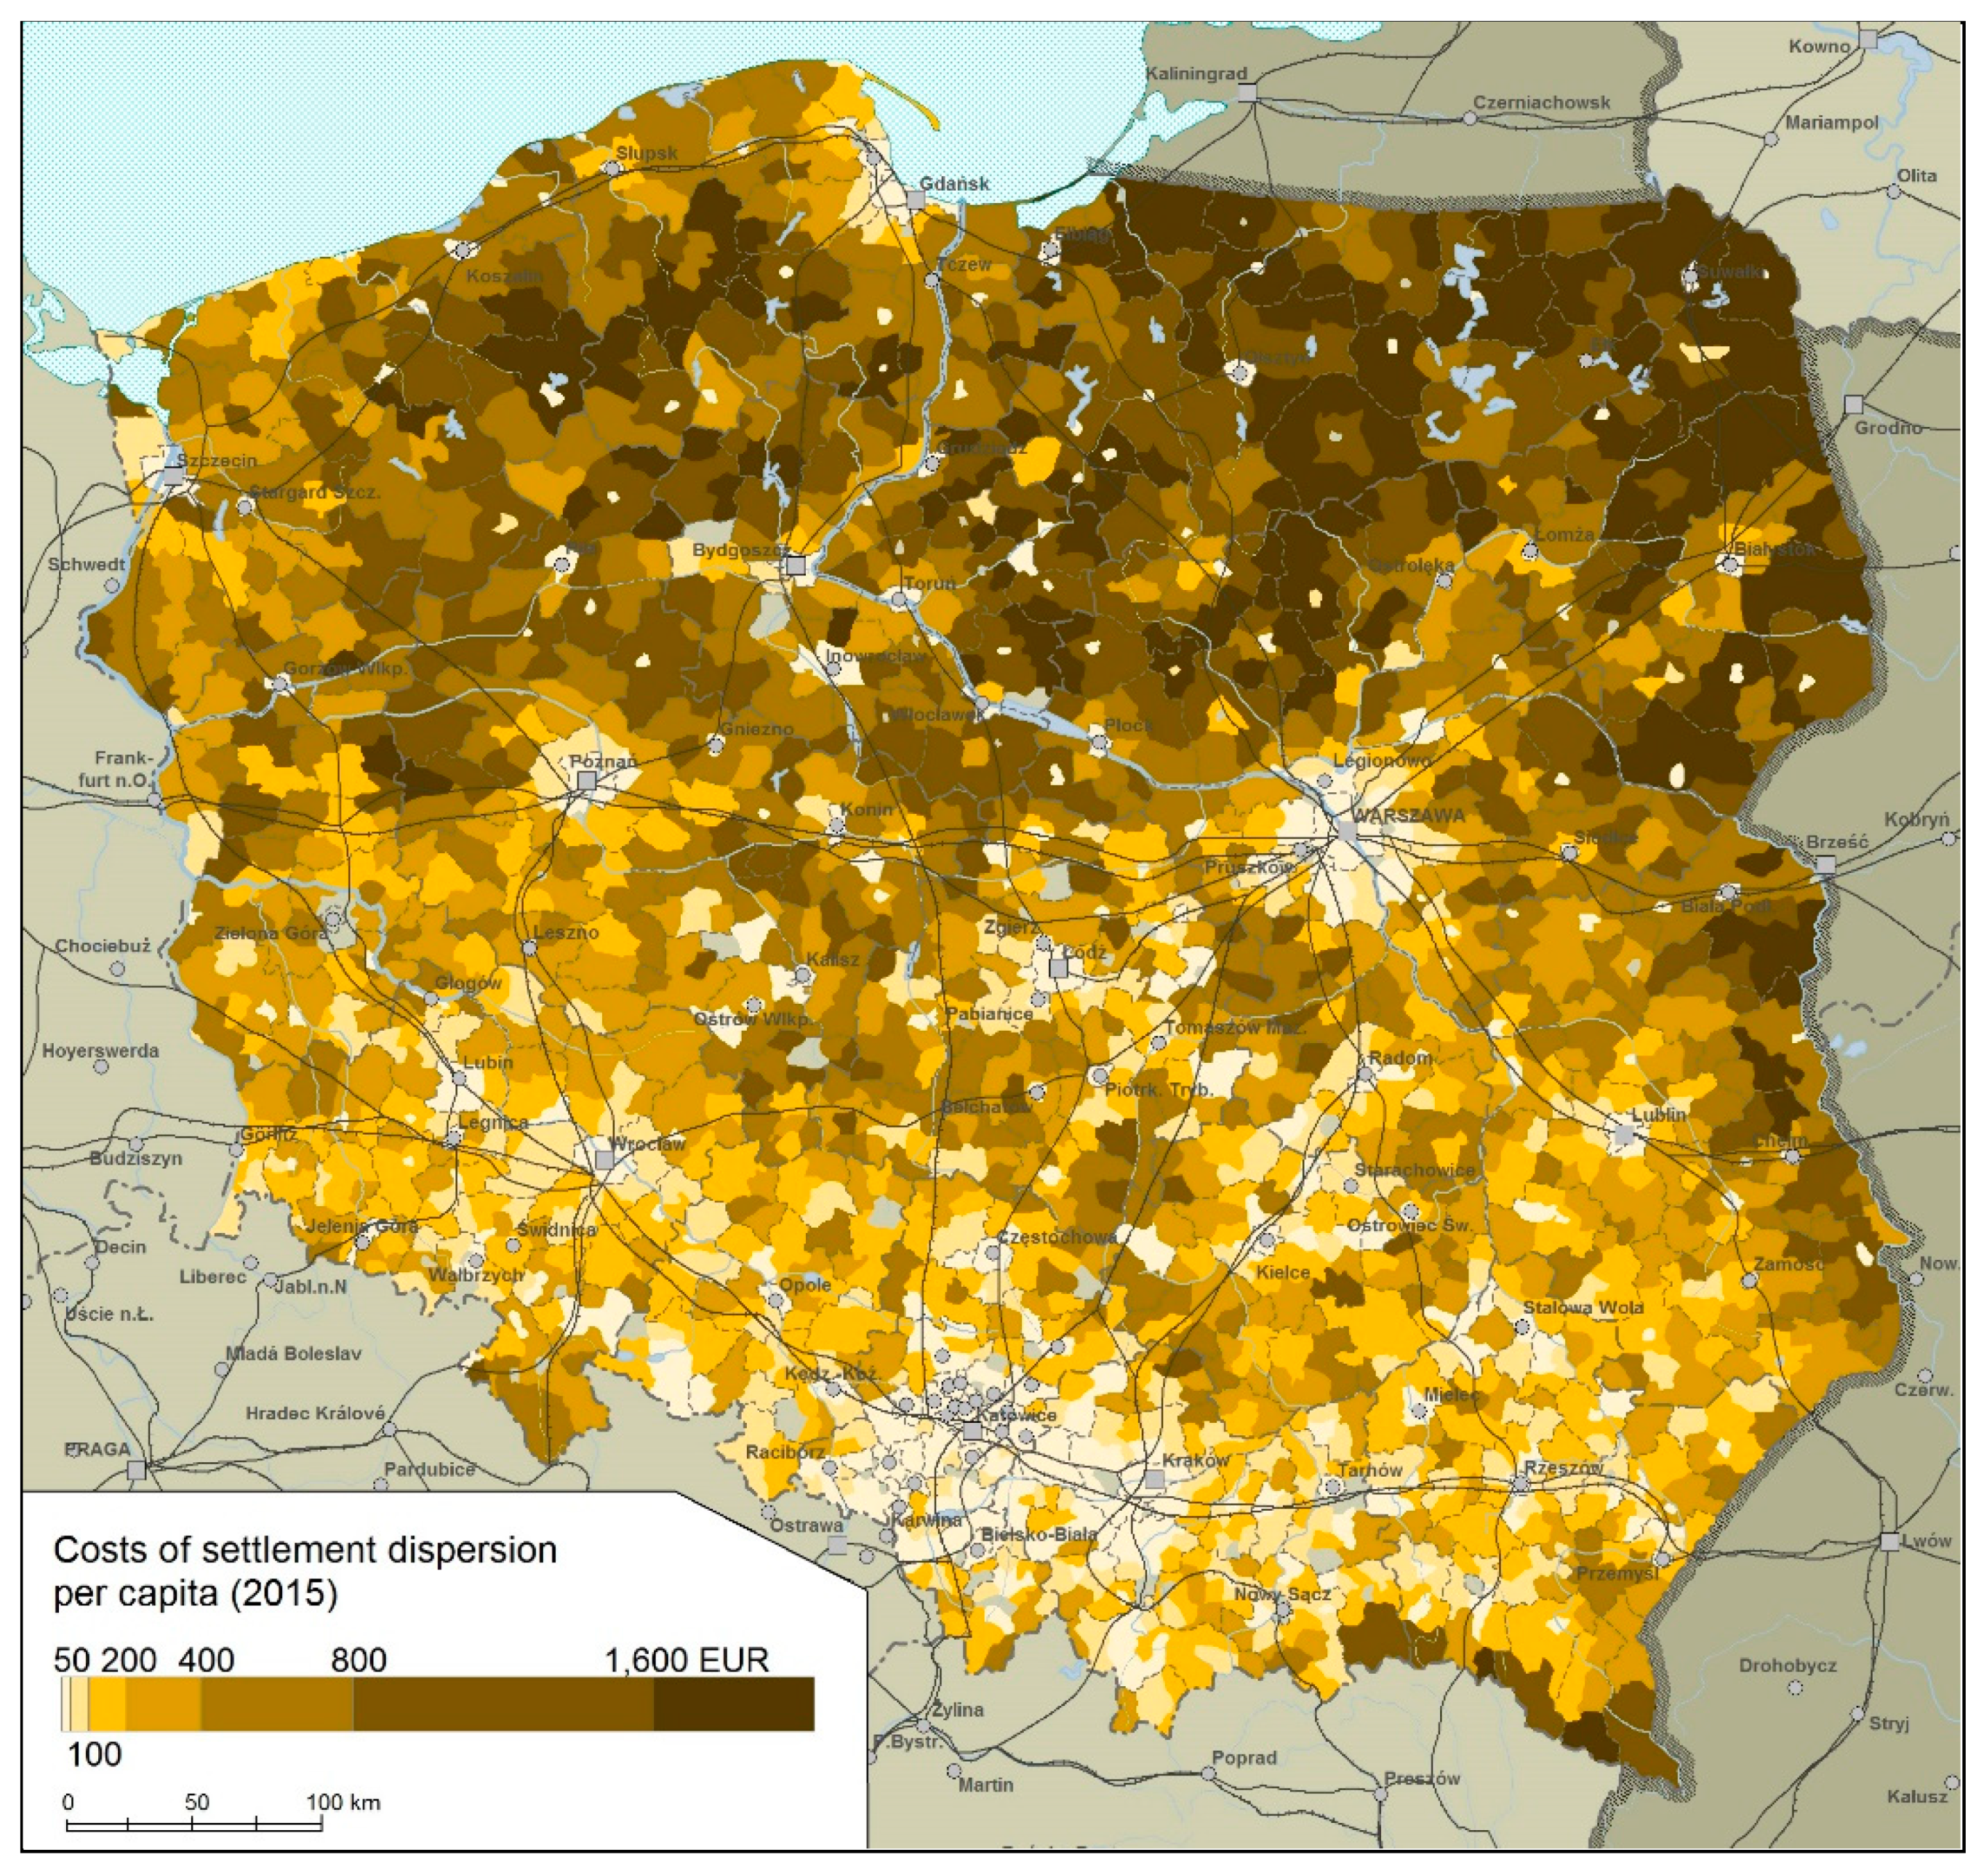
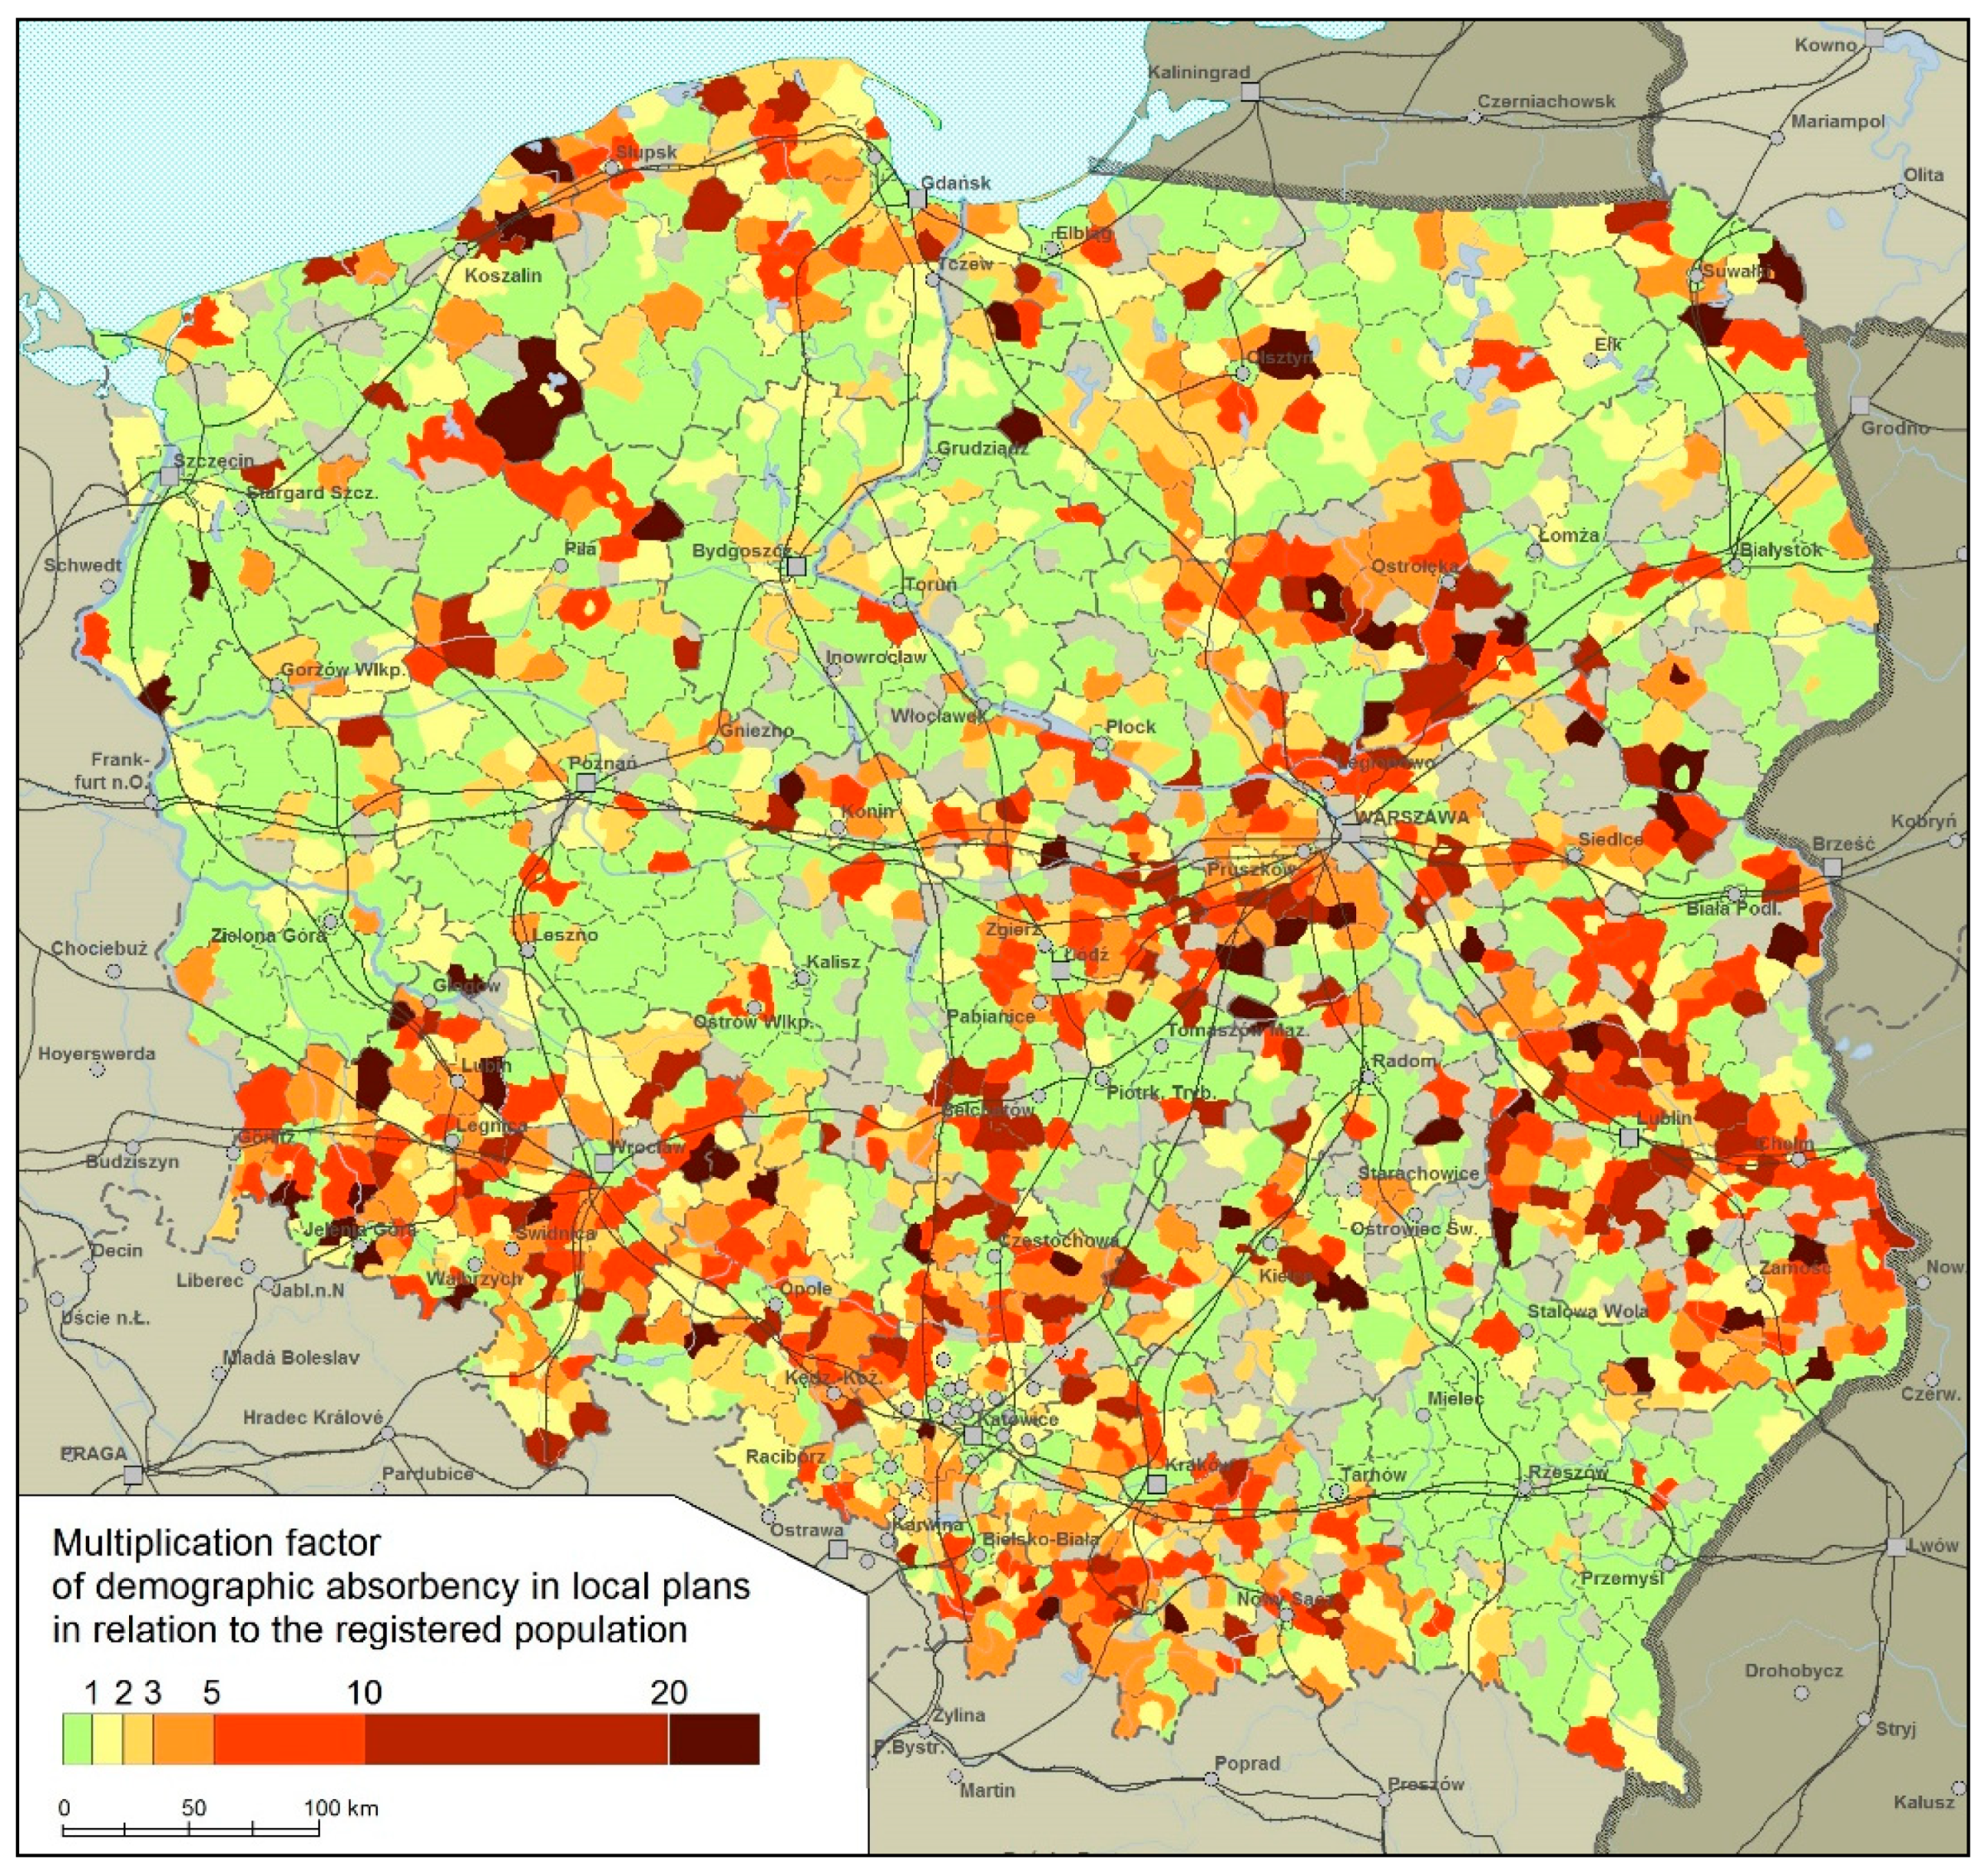
Table 1.
General identification of phenomena, conditions, causes and related costs of spatial chaos.
Table 1.
General identification of phenomena, conditions, causes and related costs of spatial chaos.
| Phenomenon | Main Causes and Conditions | Cost Size | Phenomenon | Main Causes and Conditions | Cost Size |
|---|---|---|---|---|---|
| in Economic Sector | in Economic Sector | ||||
| Diffusion of single-family housing in agricultural areas. | Possibility of building without a local plan (wz). | Low productivity and competitiveness of economies at various geographical and territorial levels. | Lower standard of living. | Environmental pollution with higher emissions (higher energy consumption, automotive, etc.). | Higher costs of building and operating settlement systems. |
| Expansion of construction to areas threatened by floods, landslides, raw materials, etc. | Bad structure and fragmentation of local plans. | Higher costs of functioning of socio-economic systems, including transport of goods. | High economic costs (e.g., individual motorization, costs of establishing relationships). | Landscape devastation. | Lower efficiency of technical infrastructure, e.g., sewage system. |
| Devastation of the natural and cultural landscape. | No regulation of areas for housing in the national regulation system (including the lack of dependence of investment land supply on demographic forecasts). | Losses due to lowering the value of space (tourism, real estate market). | Waste of time (commuting, services, education, etc.) at the expense of family and socio-social life. | Ecological imbalance and stability of natural systems. | Higher investment in restoration and environmental protection. |
| Excessive de-farming of land for construction purposes. | No economic connection between private and social costs (including no property tax). | Losses in the economy of raw materials, irrational use of natural resources. | Accidents and collisions. | Negative feedback in terms of environmental degradation. | Higher social service costs (location of the network of health care and educational facilities, commuting, e.g., transporting children through local governments). |
| Land and real estate speculation related to corruption. | Faulty technical infrastructure financing system. | Civilization diseases. | Lower efficiency of public transport (high subsidies). | ||
| Chaotic development (housing) of roads. | No obligation to parcel land for construction purposes. | Compensation and medical expenses. | |||
| The development of motorization and terrain consumption during devastation of public roads. | Competing for the development of housing and taxpayers by the municipalities surrounding large cities by excessive “agricultural removal” of land for construction purposes beyond needs. | ||||
| Low service standards in social infrastructure in new development areas, especially in suburban areas. | Primacy of property rights over the common good (constitutional right to build). | ||||
| Appropriation of public areas for private purposes (green areas, squares). | Low public education in the field of spatial order. | ||||
| Degradation of urban, rural and agricultural infrastructure. | Institutional weaknesses, shortage and poor education of staff. | ||||
| Waste of space. | Historical conditions (policy of partitioning powers, the legacy of the People’s Republic of Poland). | ||||
| Landscape ugliness. | |||||
| Ecological structure and systems upset. |
Source: own study.
Table 2.
Costs of spatial chaos in Poland by type of activity.
| Issue | Description of Costs | Estimated Amount in Poland (EUR Billion Annually) | Comments |
|---|---|---|---|
| Settlement and technical infrastructure | infrastructure construction, service of overly dispersed settlement, negative balance of spatial management | 4.48 | in the case of long-term costs, a depreciation period of 10 years was adopted. The amount does not include claims for damages |
| Transport and mobility | excessive commuting, traffic congestion, time losses, external costs | 7.44 | in the case of several different estimates of the same phenomenon, the amounts were averaged. In the case of external costs, 20% of the total costs were assumed |
| Agriculture | mechanization, transport, excessive exclusion of land from agricultural production, protection from trees | 2.08 | data from communes and voivodeships were interpolated to typically rural communes in Poland |
| Real estate market | land purchase, compensation claims, reduced property tax receipts | 2.58 | without the speculative bubble and potential compensation costs associated with the possible repeal of local plans |
| External costs in the natural environment | expenditure on environmental protection, health costs, removal of the effects of natural disasters | 2.98 | minimum amount, WHO estimated the cost of severe air pollution at USD 102 billion |
| Total | 19.92 |
© 2020 by the authors. Licensee MDPI, Basel, Switzerland. This article is an open access article distributed under the terms and conditions of the Creative Commons Attribution (CC BY) license (http://creativecommons.org/licenses/by/4.0/).
Share and Cite
MDPI and ACS Style
Śleszyński, P.; Kowalewski, A.; Markowski, T.; Legutko-Kobus, P.; Nowak, M. The Contemporary Economic Costs of Spatial Chaos: Evidence from Poland. Land 2020, 9, 214. https://doi.org/10.3390/land9070214
AMA Style
Śleszyński P, Kowalewski A, Markowski T, Legutko-Kobus P, Nowak M. The Contemporary Economic Costs of Spatial Chaos: Evidence from Poland. Land. 2020; 9(7):214. https://doi.org/10.3390/land9070214
Chicago/Turabian StyleŚleszyński, Przemysław, Adam Kowalewski, Tadeusz Markowski, Paulina Legutko-Kobus, and Maciej Nowak. 2020. "The Contemporary Economic Costs of Spatial Chaos: Evidence from Poland" Land 9, no. 7: 214. https://doi.org/10.3390/land9070214
Note that from the first issue of 2016, this journal uses article numbers instead of page numbers. See further details here.