Article

From Rural Spaces to Peri-Urban Districts: Metropolitan Growth, Sparse Settlements and Demographic Dynamics in a Mediterranean Region

by
Rosanna Salvia
1,
Rares Halbac-Cotoara-Zamfir
2,*,
Sirio Cividino
3,
Luca Salvati
4 and
Giovanni Quaranta
1
1
Department of Mathematics, Computer Science and Economics, University of Basilicata, Via del’Ateneo Lucano 10, I-85100 Potenza, Italy
2
Department of Overland Communication Ways, Foundation and Cadastral Survey, Polytechnic University of Timisoara, 1A I. Curea Street, 300224 Timisoara, Romania
3
Department of Agriculture, University of Udine, Via del Cotonificio 114, I-33100 Udine, Italy
4
Department of Economics and Law, University of Macerata, Via Armaroli 43, I-62100 Macerata, Italy
*
Author to whom correspondence should be addressed.
Land 2020, 9(6), 200; https://doi.org/10.3390/land9060200
Submission received: 26 April 2020 / Revised: 8 June 2020 / Accepted: 16 June 2020 / Published: 17 June 2020

Abstract

:
Considering settlement characteristics and population dynamics together over multiple spatio-temporal scales, the present study analyzes the spatial distribution of sparse settlements and population surrounding a large city in Southern Europe (Athens, Greece), in relation with long-term metropolitan growth and recent economic downturns. Results of the analysis identify regional-scale processes of urban compaction during economic expansion (2000s) with incorporation of scattered settlements in a high-density urban fabric, and moderate urban dispersion affecting low-density, peripheral areas in the subsequent period of recession (2010s). However, more heterogeneous dynamics were observed at the local scale. With economic expansion, a slight increase in the number of settlements was observed in local districts experiencing intense sprawl in earlier decades. With recession, a slight decrease in the number of settlements was, in turn, recorded in some rural districts surrounding compact urban centers, likely acting as local hotspots of urban re-densification. Given the multiplicity of socioeconomic factors involved, our findings highlight how urban development follows sequential phases of compaction and dispersion, based on locally differentiated spatial regimes characterizing settlement expansion and population growth. Sustainable urban management should face more actively with increasingly fragmented settlement dynamics at the fringe, prefiguring an appropriate spatial balance between urban centers and sparse settlements in light of recent demographic trends.

1. Introduction

In the last decades, a shift from radio-centric urban growth toward spatial delocalization of population and settlements over larger metropolitan regions has been observed at the global scale, and especially in advanced economies [1]. Making the intrinsic linkage between urban and rural areas particularly complex [2,3,4], sprawl was (and still is) the most characteristic form of urban expansion all over Europe, affecting the morphology and functions of both compact and dispersed settlements [5,6,7,8]. Consolidation of density divides across regions and formation of metropolitan continuums and polycentric settlements are at the base of contemporary socioeconomic transformations in urban regions. Such challenging issues require specific investigations integrating disciplinary approaches, analysis perspectives, territorial contexts, and policy frameworks [9,10,11,12].
With the decline of strictly mono-centric models, population dynamics in rural districts surrounding large cities contributed to urban growth in various ways depending on regional and local factors [13,14,15]. At the same time, limitations still exist when delineating and classifying urban, rural, and peri-urban contexts. The notion of “rural space” was (and still is) contested, because many operational criteria can be proposed and applied to identify and border rural districts with respect to urban areas [16,17]. Additionally, delineating and bordering “peri-urban spaces” mostly depends on criteria whose definition is strongly influenced by country and regional settings, the characteristics of pre-existing settlements, and recent dynamics toward population densification or scattering [18,19,20,21]. These limitations suggest the importance of a comprehensive investigation of metropolitan regions, going beyond the traditional divide in urban and rural districts. Studies investigating the spatial distribution of settlements and population dynamics in urban regions should focus on the so called “metropolitan continuums”, considering together consolidated cities, the surrounding rural “ring”, and peri-urban spaces in-between [8,13,14].
Estimating the population of urban agglomerations over long time periods is a major challenge due to the inherent complexity of urban growth processes. According to the World Urbanization Prospects (https://population.un.org/wup/General/DefinitionIssues.aspx), “(…) villages can become towns, towns can grow into cities, and cities can be transformed into urban agglomerations in a number of ways: they may increase due to natural population growth—that is as a result of a larger number of births than deaths; they may grow due to rural–urban or urban–urban migration. (…) These changes can also involve several different processes: they may include the incorporation of sub-urban areas or neighboring towns into a larger city or the foundation of a completely new city”. Figure 1 tries to highlight some of these processes.
By disclosing the role of agglomeration and scale factors, natural population growth and immigration fuelled urban expansion in most European cities, despite important differences arising at both the regional and local scale [6,7,8,9,14,21]. However, the intrinsic relationship between urban growth and population dynamics in peri-urban spaces was poorly explored in countries with traditional agricultural landscapes preserved—more or less integrally—around large cities, as frequently observed in Southern and Eastern Europe [22,23,24]. Contributing to the forming (or consolidating) of mixed peri-urban spaces, a refined analysis of demographic dynamics in fringe districts is increasingly required when delineating complex processes of growth in contemporary cities and metropolitan regions [25]. Empirical knowledge will pave design of policies mitigating the negative effects of sprawl, and secure a better understanding of the intimate mechanisms of urban expansion [26,27].
Mediterranean Europe has experienced sequential waves of economic expansion and recession, often grounded on mechanisms of deregulated urban growth. The (partial or total) abandonment of fringe land undergoing progressive conversion from cultivated fields and sparse villages to (more or less compact) urban fabric also fueled urban expansion [28,29,30]. At the same time, this region underwent demographic changes, experiencing population shrinkage as a joint result of fertility decline, mortality at older ages, and an unexpected reduction of international immigration with recession [31,32,33]. The progressive mismatch between settlement expansion and population growth makes understanding of the mechanisms governing metropolitan development a particularly hard task in Mediterranean cities [34,35,36]. In most cases, peri-urban development has been reported as a random process driven by a spatial spillover of enterprises and local population into neighboring (rural) districts [36,37,38]. In this line of thinking, urban growth has been frequently regarded as one of the most powerful mechanisms shaping rural spaces around metropolitan regions [39,40,41]. On the contrary, by looking at “the other side of the fringe”, rural spaces surrounding large cities may play a role promoting or containing sprawled urban expansion [42]. In Mediterranean contexts, these dynamics seem to be more intensively regulated by market forces than spatial planning [43,44]. Linked with recent demographic trends (e.g., population growth fueled by natural balance and migration), the spatial organization of rural settlements and the dynamic relationship with the closest urban centers are becoming a basic issue of investigation when identifying complex spatial cycles that oversee metropolitan development [45,46,47].
This work hypothesizes a variable influence of urban cycles on the growth of rural settlements close to large cities, depending on sequential phases of compact expansion and settlement dispersion that characterize the overall development of peri-urban areas. Based on this statement, we assume that demographic dynamics in peri-urban areas should not be interpreted as a direct result of central cities’ dynamics, rather being influenced by specific local contexts, which make settlement expansion a much more heterogeneous phenomenon over space. With this in mind, an exploratory analysis of the spatial structure of rural settlements and the related population dynamics over sufficiently long time intervals allows a refined comprehension of the mechanisms regulating urbanization in Southern Europe, in relation with economic downturns (expansion vs. recession) and changes in the spatial organization of peri-urban spaces [48]. Complexity of recent processes of urban growth in contemporary cities justifies an exploratory approach based on morphological and demographic indicators of settlement and population expansion at two (regional and local) spatial levels [49]. Exploratory analysis of an appropriate set of statistical indicators may provide the necessary base for more sophisticated models of urban growth [50].
Our empirical study assumes the Athens metropolitan region (Attica, Greece) as a paradigmatic example of traditional rural districts interacting, more or less subordinately, with the main city. Similarly to other Mediterranean cities (Barcelona, Naples, Palermo, Salonika and, in part, Rome, Istanbul, and Valencia), urban growth in this area was basically radio-centric in the aftermath of World War II, shifting to a more dispersed settlement model in the last decades [51]. Population dynamics in the rural districts of Attica are hypothesized to shape urban growth toward more compact or dispersed models depending on the differential contribution of socioeconomic forces and local contexts. In these regards, our study is aimed at identifying changes over time in the spatial regime that characterizes the recent expansion of peri-urban settlements in the Athens region, defining sequential waves of densification and de-concentration on the base of the related demographic dynamics.
A comprehensive analysis of settlement and demographic dynamics over a sufficiently long time interval requires the integration of multiple data sources. Census data allowed a long-term analysis of settlement dynamics in the study area. However, censuses were realized every ten years, between 1951 and 2011, and no data were available after 2011. We also used a more recent (official) data source, the national register of settlements in Greece, providing full data on a regular temporal base since 1991, with the last update in 2019. However, data concerning settlements were rather different from the census database, justifying a separate analysis of the data. Demographic dynamics (total population, annual rates of growth) were studied over the same time interval (1991–2019). Finally, based on data availability, natural balance and migration balance were assessed over the last two decades (1999–2018), in relation with economic expansion (2000s) and recession (2010s). These data were put in relation with the most recent settlement dynamics in the study area.
The article is organized as follows: Section 2 describes the investigated area and the methodology, with specific reference to data sources, indicators and statistical techniques adopted in this study. Section 3 illustrates the main results of the work, delineating long-term settlement dynamics (1951–2011) on the basis of census data, and then focusing on short-term settlement dynamics (1991–2019), highlighting the possible role of economic downturns in the past decades’ urban expansion. This section links settlement expansion with demographic trends (1999–2018) at the regional and local levels in the study area, highlighting the intrinsic relationship between population dynamics, urban growth, and the territorial-socioeconomic context, on the basis of appropriate indicators on a municipal scale. In these regards, the study was grounded on a multivariate statistical analysis of quantitative information derived from multiple data sources at a disaggregated spatial scale [51,52]. Evaluating together the role of biophysical factors (topography, land availability, soil, climate) and background variables (socioeconomic structure, natural balance and migration) in peri-urban settlement expansion contributed to the formulation of reliable scenarios of short- and medium-term population dynamics in large metropolitan regions [53,54,55]. Section 4 debates the originality of the empirical results, delineating normative implications of this study at wider observation scales. Offering food for thought on strategies for sprawl containment in peri-urban spaces, results of this study are finally discussed (Section 5) in light of the debate on future urbanization and rural development in Southern Europe [56,57,58].

2. Methodology

2.1. Study Area

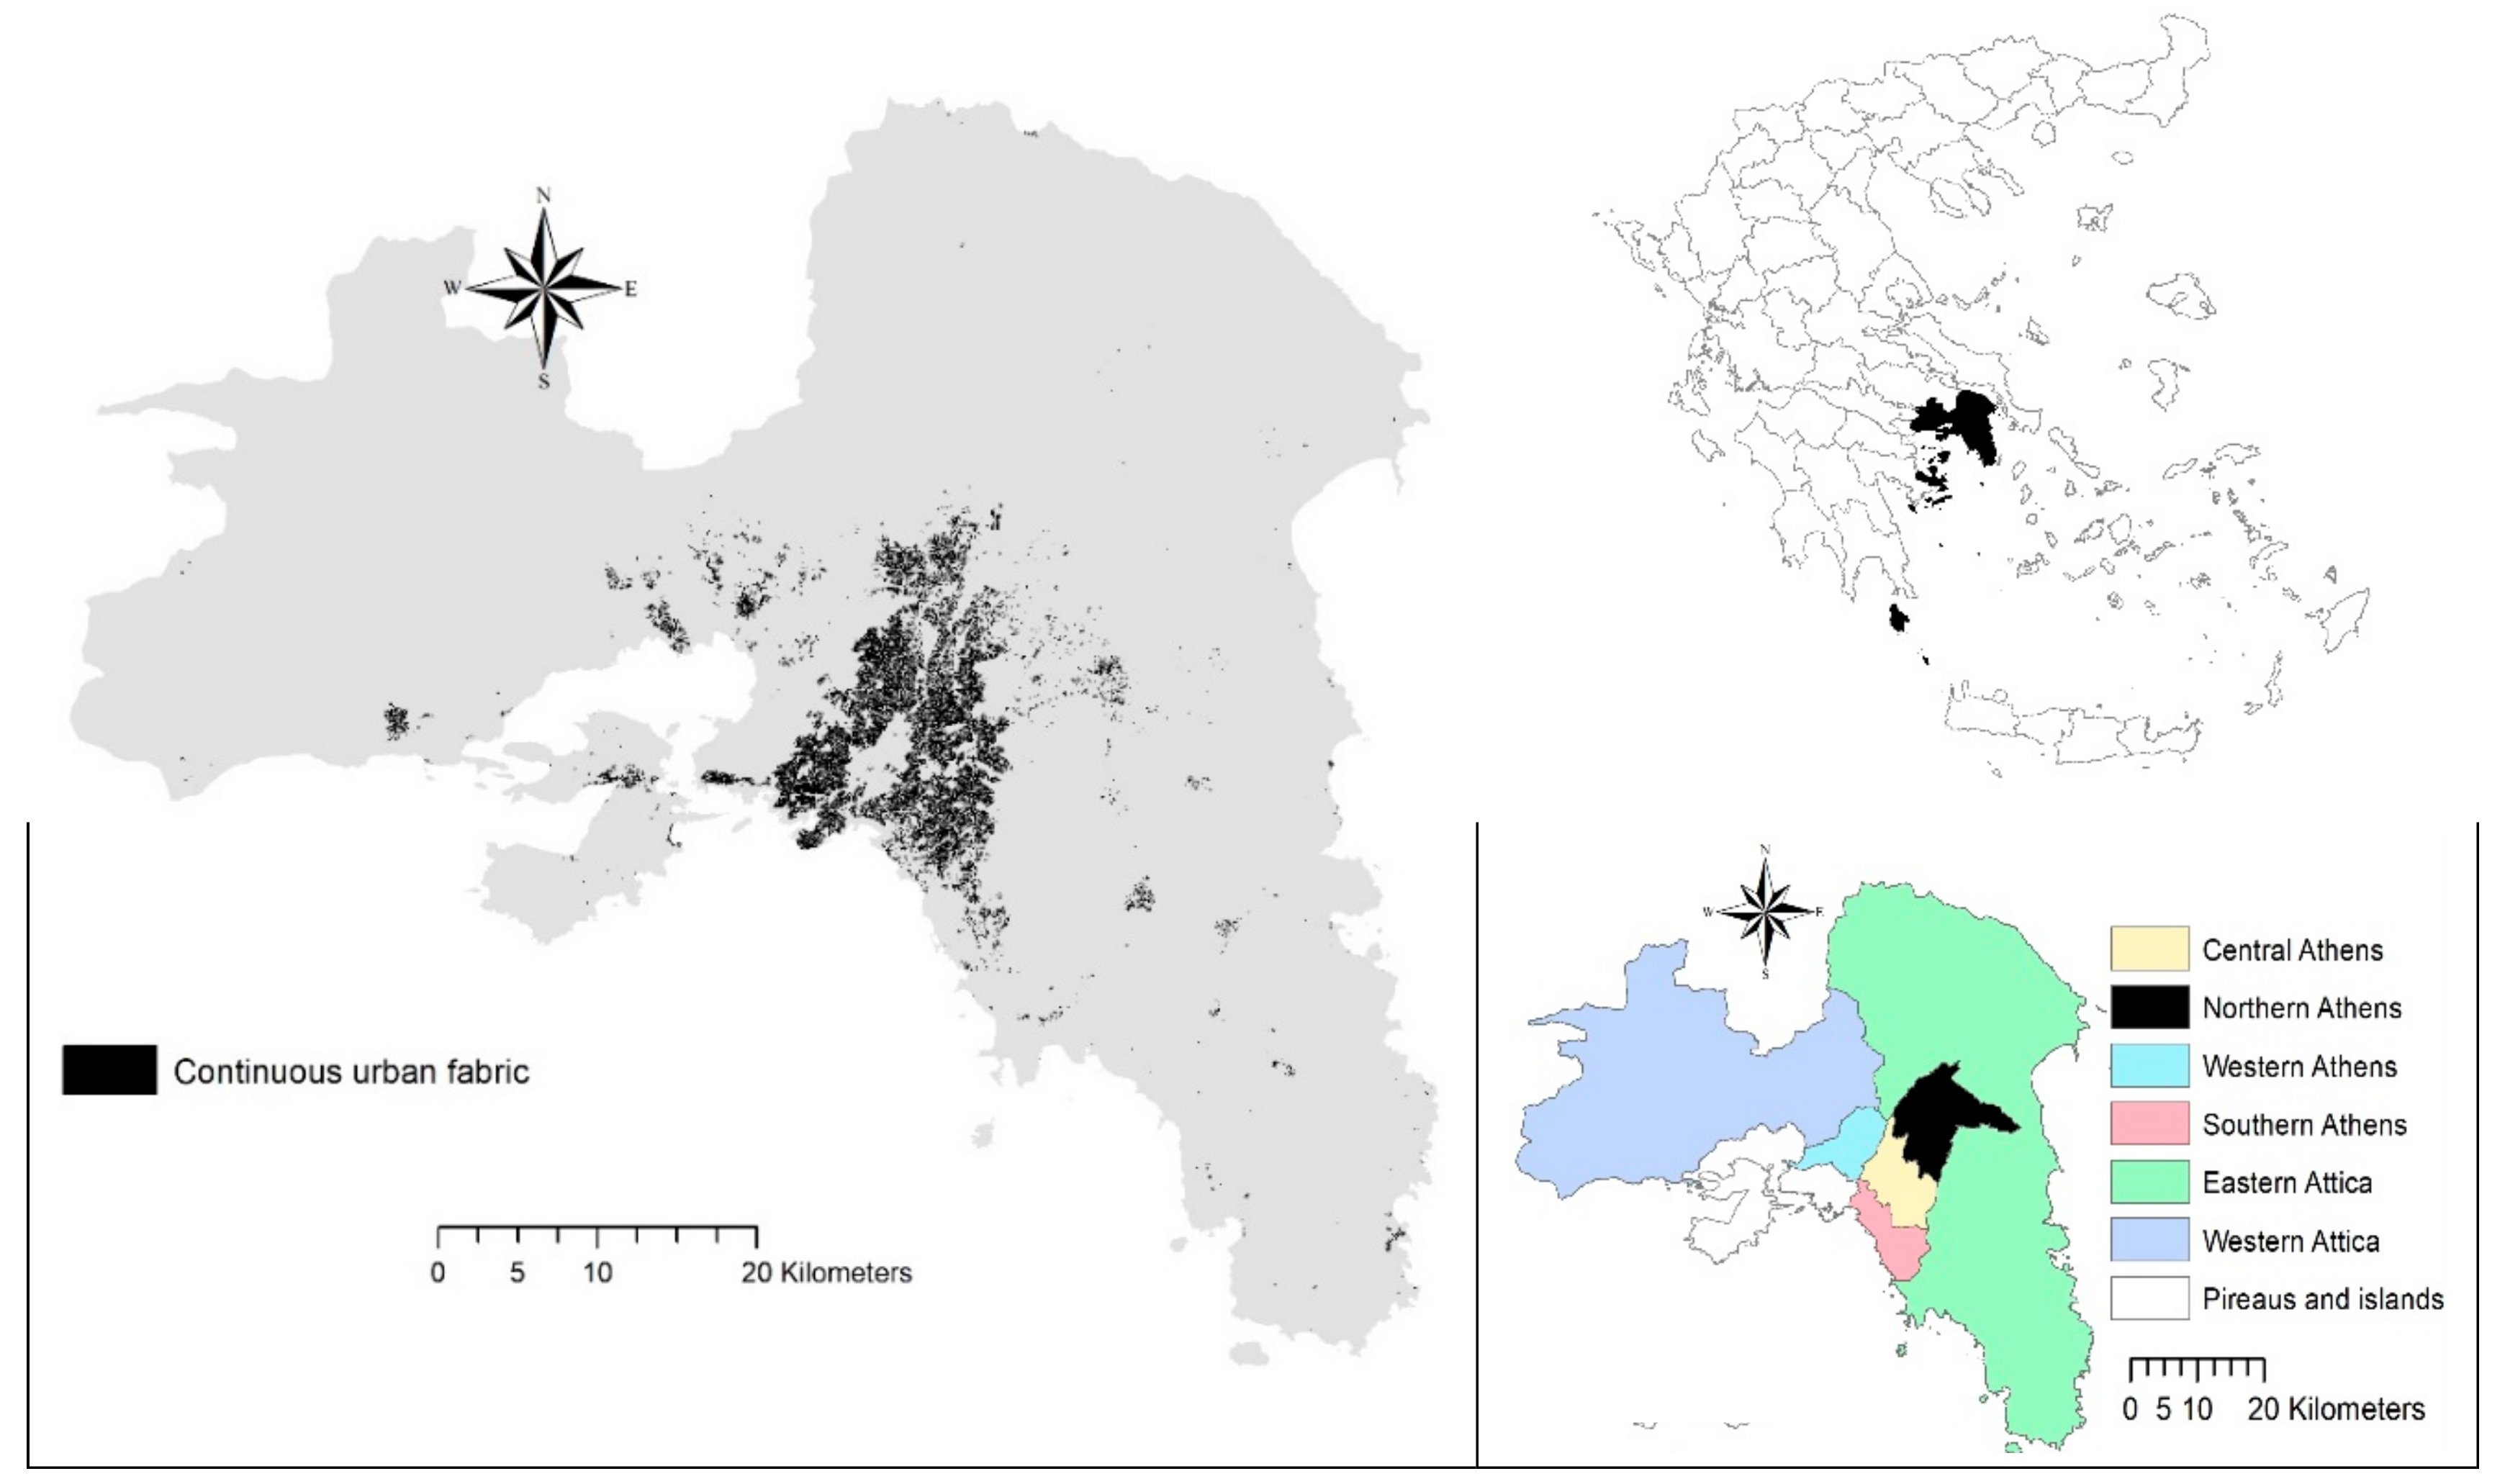
The area investigated in this study includes a large part of the administrative region of Attica (Central Greece), which coincides with the metropolitan region of Athens, the Greek capital. This area was identified following the Urban Atlas (UA) definition; UA is a program promoted by the European Environment Agency, covering nearly 700 cities in Europe (https://land.copernicus.eu/local/urban-atlas/urban-atlas-2018). The area encompasses mainland Attica and Salamina Island. According to the “Kallikratis” reform of the structure of local authorities in Greece (National Law no. 3852/2010), the area is administered by 59 municipalities and 115 municipal units, resembling almost precisely the dimoi-koinotites level of the previous Kapodistrian asset of local municipalities and communes (Figure 2). The study area covers approximately 3000 km2 [59] and is administered by seven regional units (Central, Western, Northern and Southern Athens, Piraeus, and Western and Eastern Attica). Salamina and the surrounding islands in the Argosaronic Gulf were administered by a separate regional unit. The study area is characterized by undulated morphology that alternates coastal and inland plains (the largest is the “Lekanopedio Attikis” hosting the Athens urban area) and mountain ranges (Parnitha, Pendeli, Imitos) that frequently exceed 1000 m in elevation. Athens displays an economic base oriented towards traditional and advanced services and public administration, although manufacturing and construction industries have represented (and still represent) an important economic sector promoting local development. Population density of urban municipalities exceeds 5000 inhabitants/km2 while ranging, on average, between 200 and 500 inhabitants/km2 in rural municipalities [60]. Settlement growth in the study area has been particularly intense since World War I and the highest population density in downtown Athens (more than 15,000 inhabitants/km2 in the municipality of Athens) has been observed in the early 1970s [61].
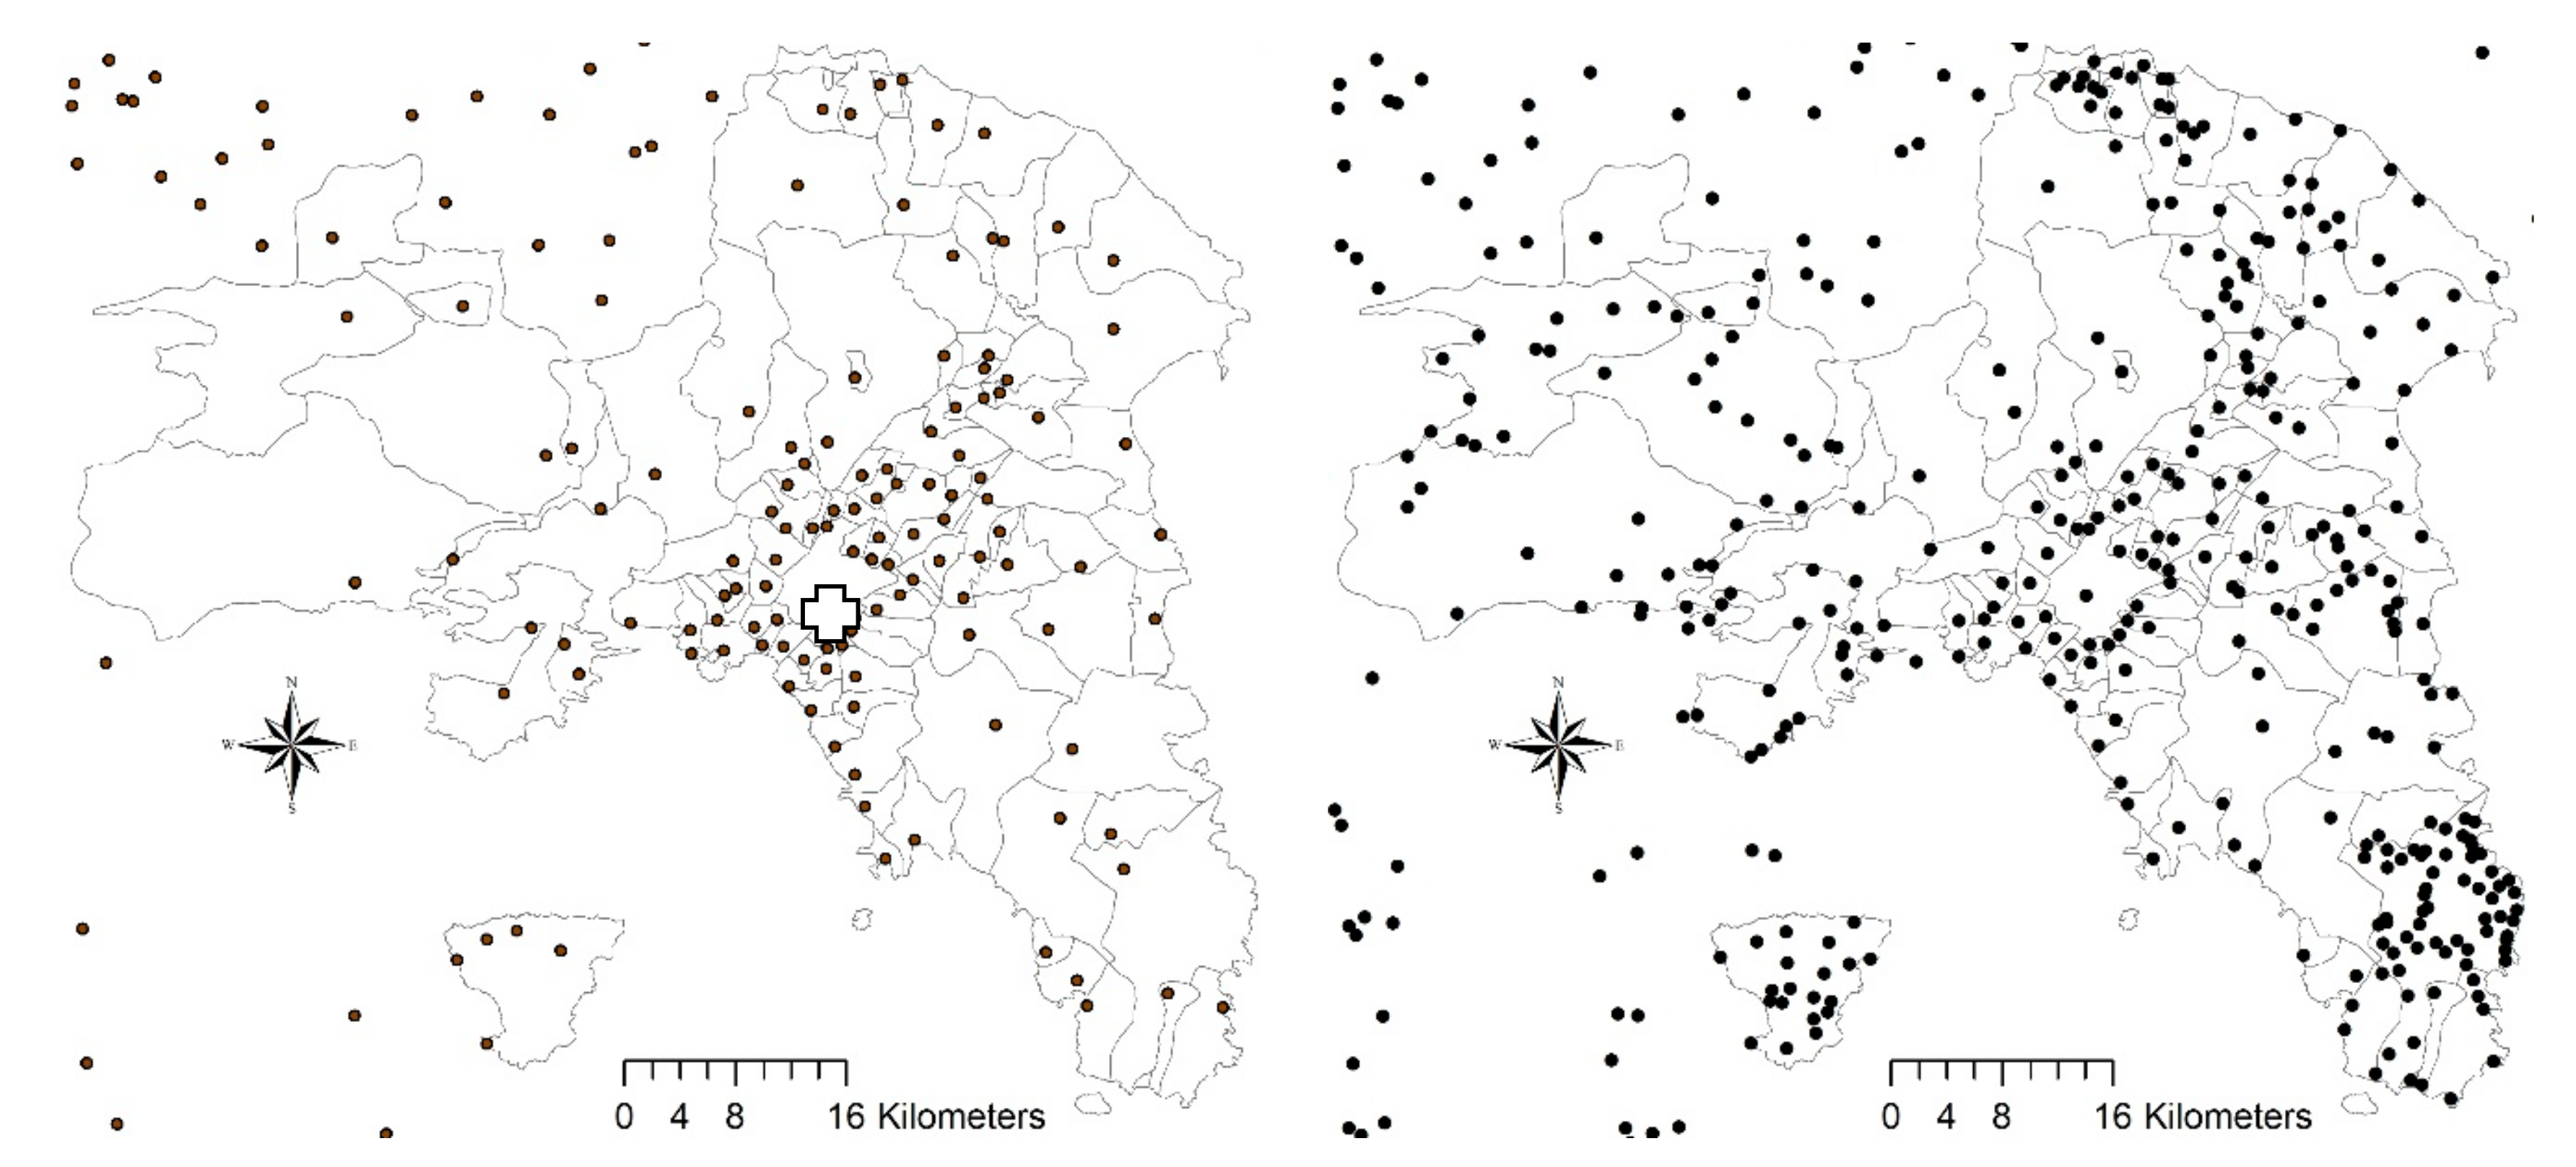
In the following decades, suburbanization has stimulated the consolidation of loose settlements along the seacoast and in accessible lowlands at considerable distances from the central city [62]. The rural areas surrounding the city showed traditional characteristics as far as landscape and human settlements are concerned [63]. However, many of these areas have undergone intense transformations following urbanization (Figure 3).

2.2. Data and Variables

The present study elaborated official statistics from multiple data sources with the aim of providing a refined analysis of long-term and short-term settlement and demographic dynamics in the study area [64,65]. Use of data derived from multiple statistical sources brings with it some limitations and difficulties of standardization, due to heterogeneous time series and different spatial definitions [66,67,68]. For these reasons, our study was sequentially organized in distinct steps (Table 1): (i) analysis of long-term settlement dynamics (1951–2011) based on a specific investigation of the spatial distribution of sparse settlements and population residing therein; (ii) investigation of more recent urban dynamics (1991–2019) based on the analysis of total population growth and the spatial distribution of registered settlements in the study area; and (iii) a specific analysis of short-term demographic dynamics (1999–2018) based on distinct population growth rates derived from natural and migration balances at the regional unit scale. A focus on the spatial distribution of natural population growth rates at the municipal scale was finally provided with the aim of complementing the empirical findings of steps (ii) and (iii). In this way, the analysis delineates the (apparent and latent) mechanisms of formation, consolidation, and disappearance of sparse settlements as a function of radio-centric urbanization and peri-urbanization. These findings may contribute to a better knowledge of long-term urban dynamics in the study area.
Data used for the analysis step (i) derive from population censuses in Greece carried out by the national statistical office (ESYE, now ELSTAT) every ten years (https://www.statistics.gr/el/statistics/pop). By encompassing a rather long time interval, this data source accounted for the number of settlements and the relative population for each municipality of the study area, while distinguishing the main urban center (e.g., the capital town of each municipality) from the surrounding sparse settlements. Analysis illustrated in section (ii) made use of disaggregated information derived from the register of settlements (“oikismoi”) and other territorial partitions created and maintained by ELSTAT for the whole country and updated on an annual basis.
The basic data of this official survey include the number of settlements but not the resident population. The estimated total population was derived from the ELSTAT register, whose results are also disseminated by the European Statistical Office (Eurostat) in a more comprehensive form. The analysis of section (iii) benefited from aggregated demographic data (natural and migration balance) disseminated by Eurostat at the level 3 of the Nomenclature of Territorial Statistical Units (NUTS) (i.e., regional units in Greece) for each year between 1999 and 2018 (https://ec.europa.eu/eurostat/data/database). A refined analysis was carried out with the aim of delineating the specific contribution of natural balance to population growth on a municipal scale over longer time windows (five years). This information was derived from vital statistics collected by ELSTAT and disseminated annually at the same spatial scale. For this analysis, 115 municipal units were considered [59].

2.3. Contextual Indicators

A total of 11 variables were adopted to investigate the intrinsic correlation between the natural population growth rates and the socioeconomic profile of each municipality in the study area. These variables evaluate basic forces of (and constraints to) urban expansion, including territorial and topographic factors (elevation, “Ele”; proximity to the sea coast, “Sea”; and the linear distance from six locations in the study area: downtown Athens, “dAth”; downtown Piraeus, hosting the largest harbor in Greece “dPir”; Maroussi Olympic Stadium in the new business district of Northern Athens, “dMar”; International “E. Venizelos” airport in Messoghia district, “dMak”; downtown Aspropyrgos in Thriasio industrial district, “dAsp”; and Oropos settlement, a rural area in Northern Attica, “dOro”), environmental conditions and natural amenities (soil quality index: “Sqi”; and climate quality index: “Cqi”), and a classification of economically disadvantaged municipalities based on the East–West gradient in the study area [14,33,43,50]. These variables were successfully used in earlier studies with the aim of delineating a socioeconomic profile of each municipality in the study area [62,63,64,65]. The six places mentioned above were selected according to earlier studies [33,43,61], with the aim of identifying significant relationships between settlement distribution (or population dynamics) and basic geographical gradients (e.g., urban–rural) or territorial attractors (e.g., international airport).

2.4. Statistical Analysis

Based on the multiplicity of data sources reflected in complex variables and indicators, our work adopted a multidimensional exploratory analysis strategy based on an integrated set of statistical techniques aimed at identifying apparent and latent patterns in data structures. More specifically, a descriptive analysis based on graphical representations and maps was associated with a Principal Component Analysis (PCA) assessing the spatial complexity in settlement processes on a local scale vis à vis the socioeconomic profile of each municipality. A hierarchical clustering ensured a refined assessment of temporal homogeneity or heterogeneity in local-scale urban growth processes based on similarity (or dissimilarity) in the spatial structure of the natural rate of population growth. Finally, a non-parametric Spearman correlation analysis identified significant relationships between the spatial variation in the natural rate of population growth and contextual indicators (Section 2.3) at the same spatial scale (Table 2).

2.4.1. Descriptive Statistics

Tables and maps were used to illustrate the distribution of sparse settlements and the relative population in the study area. Average population by sparse settlement was calculated for the entire study area by census year. On the basis of the new register of settlements and territorial partitions of Greece, the total number of settlements in the last three decades (1990s: between 1991 and 2000; 2000s: between 2001 and 2010; 2010s: between 2011 and 2019) has also been mapped for each municipality of the study area, calculating the percent growth (or decrease) in the number of settlements in the relative two consecutive decades (1990–2000s and 2000–2010s) as well. In line with earlier studies [55,59,60,62], these findings contribute to delineate the evolution of settlements and population during economic expansion (2000s) or recession (2010s) in the study area.

2.4.2. Principal Component Analysis

By exploring the contextual indicators described above (Section 2.3), a principal component analysis was developed to decompose settlement dynamics in few relevant dimensions possibly reflecting the latent mechanisms of urban growth in the study area. Settlement dynamics were studied using three indicators: the density of settlements on a municipal scale at the beginning of the study period (“1990%”) and the percent growth rate of settlements over two time intervals (1990–2000s, “ip%”; and 2000–2010s, “iip%”). Components with eigenvalues >1 were analyzed considering together the distribution of loadings (variables) and scores (municipalities).

2.4.3. Hierarchical Clustering

Population growth rates (based on natural and migration balances) were finally mapped at the regional unit scale separately for the last two decades (2000–2009 and 2010–2018). Additionally, natural population growth rates were calculated for all the municipalities in the study area by year and mapped at the same spatial scale as an aggregate indicator over four time periods of 5 years each (1999–2003, 2004–2008, 2009–2013, 2014–2018). This approach was aimed at investigating the contribution of natural balance to total population growth, evidencing demographic trends of fertility and mortality in the study area. The spatial distribution of the natural growth rate of population by year was subjected to hierarchical clustering (Ward’s agglomeration rule, Euclidean distance metric). Using dendrograms, cluster analysis verifies similarities in the spatial regime of this demographic indicator during the study period.

2.4.4. Correlation Analysis

To identify linear (or non-linear) relationships between demographic dynamics and local socioeconomic contexts, a non-parametric Spearman rank analysis was run with the aim of testing pair-wise correlations between each of the 11 background variables and the natural growth rate of population calculated at the municipal scale and over four sequential time intervals of 5 years each. The statistical significance of each correlation coefficient was tested at p < 0.05, applying Bonferroni’s correction for multiple comparisons.

3. Results

3.1. Long-Term Settlement Dynamics

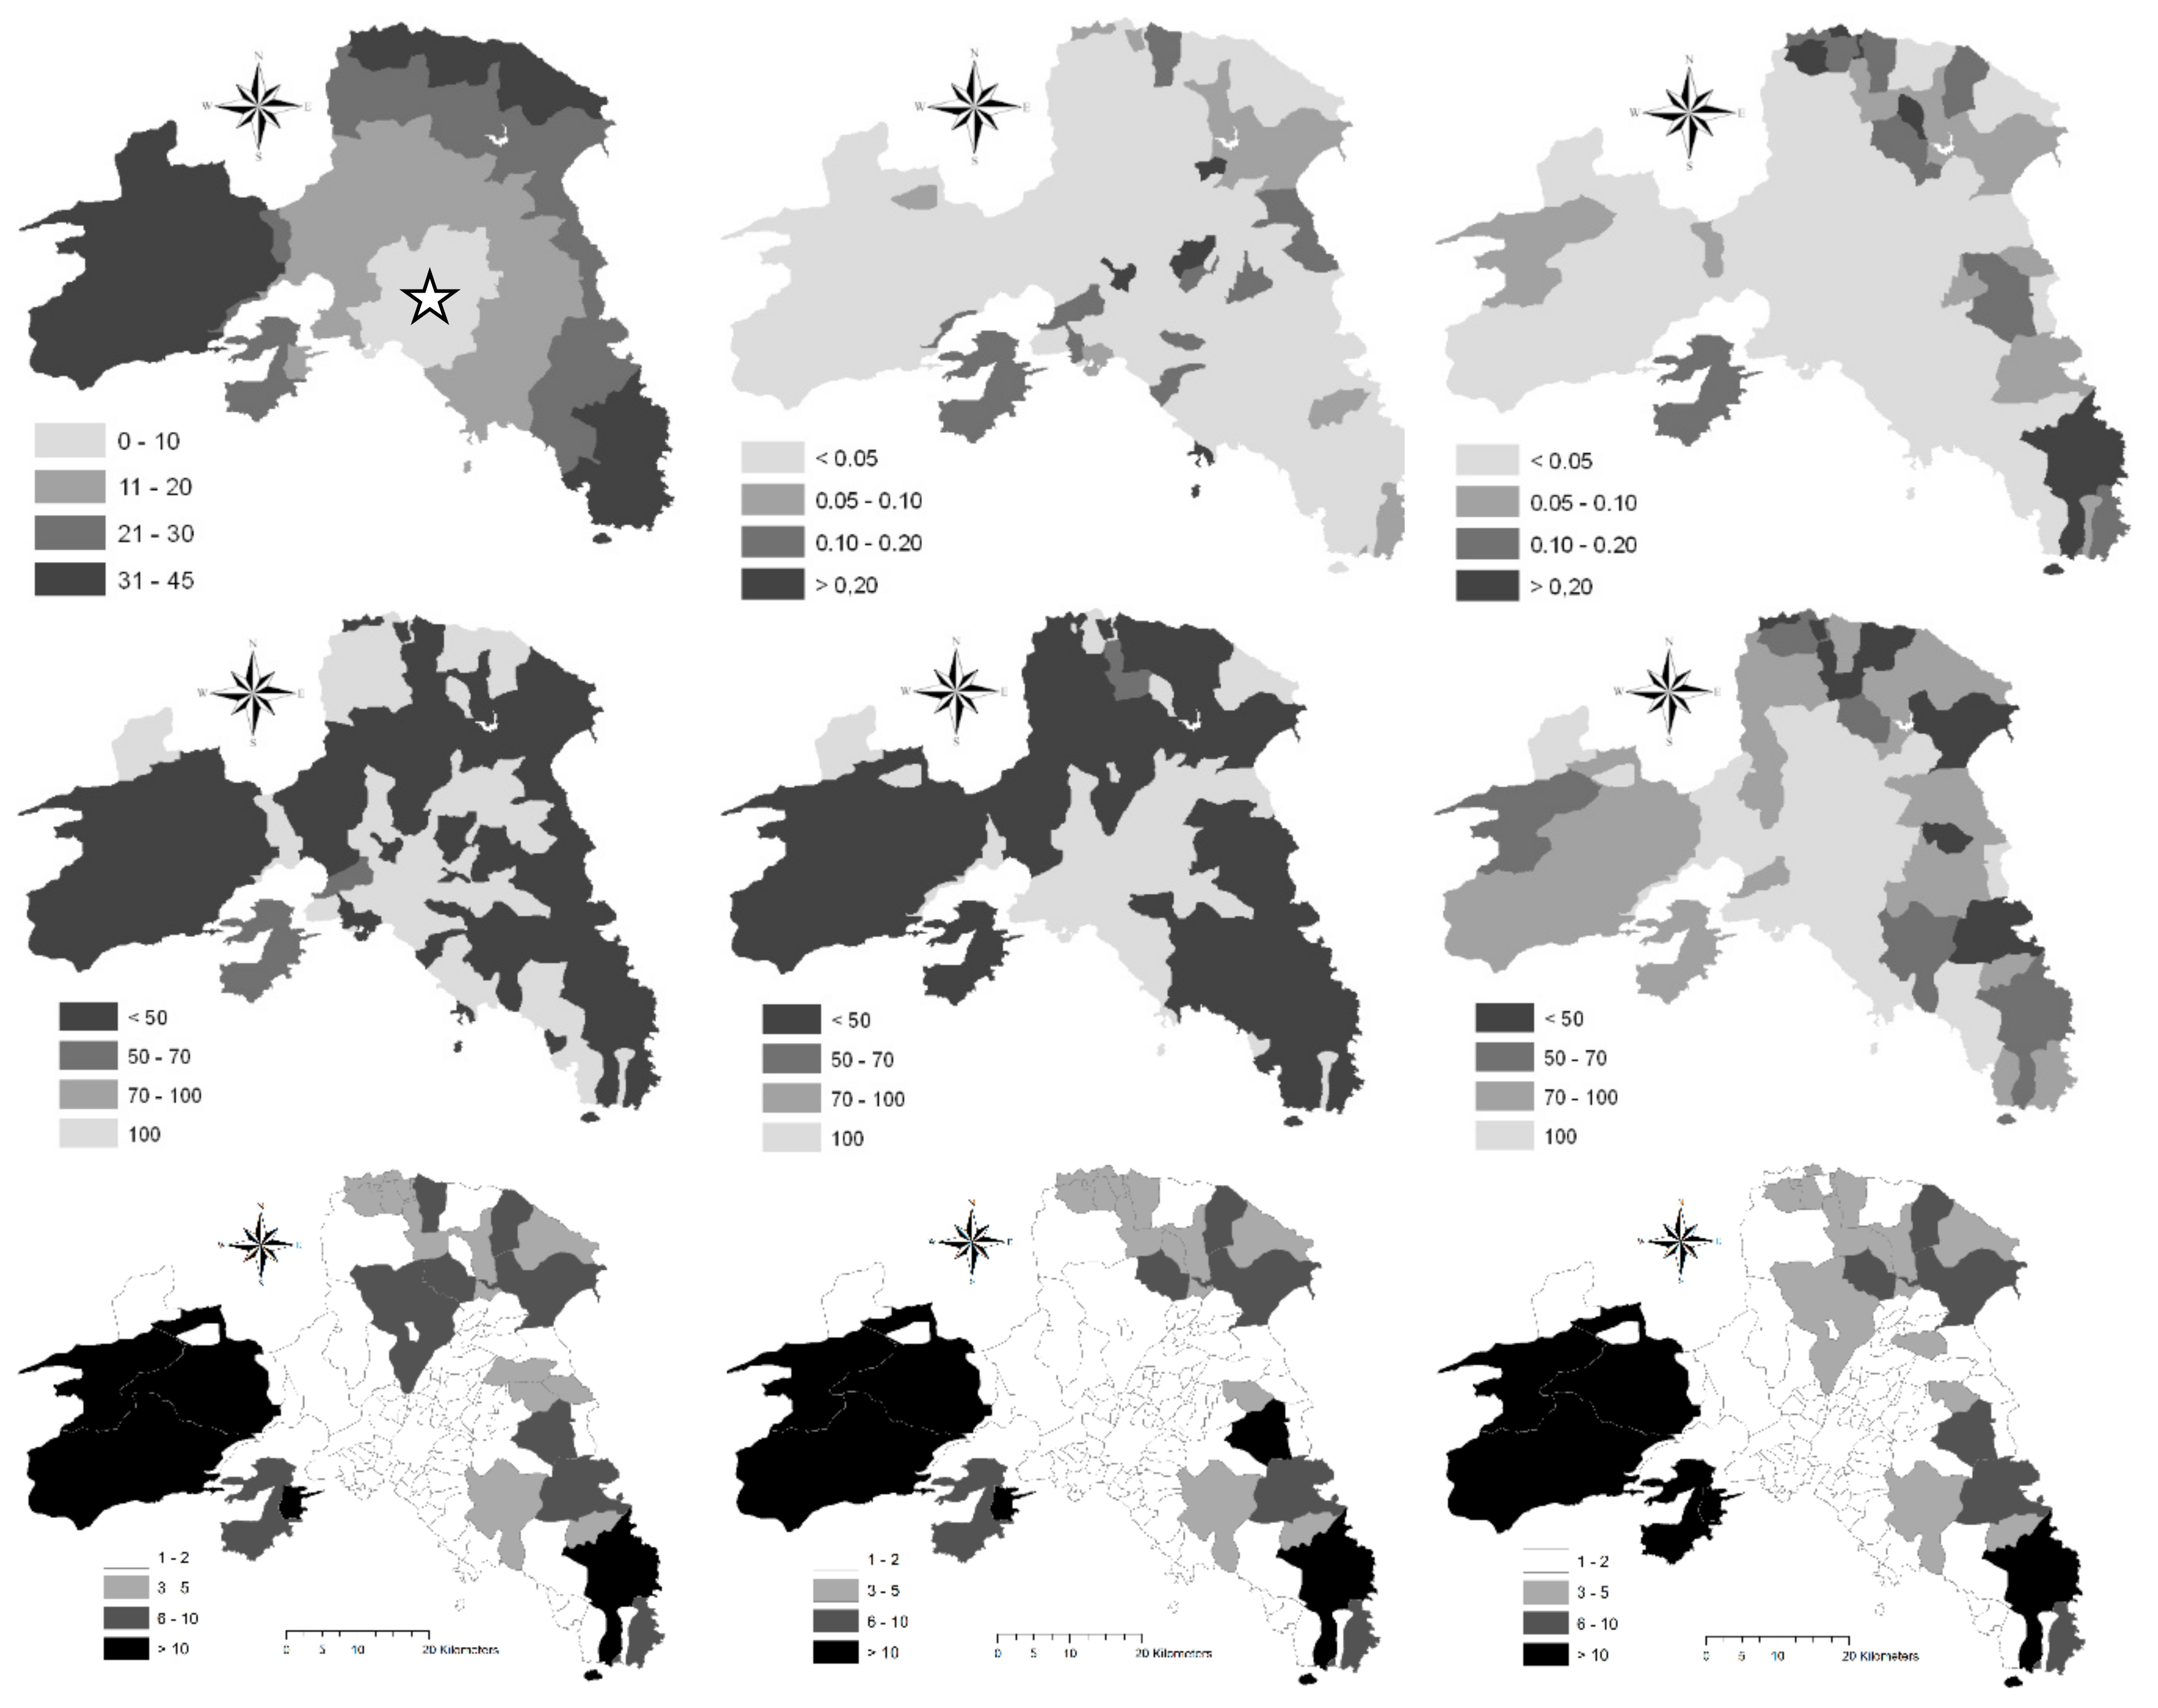
Total population in the study area increased rapidly over time, stabilizing in the last two decades (Figure 4, left). Population residing in sparse locations decreased consistently. Density of settlements (excluding urban centers) increased from two settlements/100 km2 (1951) to nearly 10 settlements/100 km2 (2011). The mean size of population residing in such settlements showed a U-shape trend over time (Figure 4, right): it decreased sharply between 1951 and 1981, growing again—albeit more slowly—between 1981 and 2011. The lowest value (recorded in 1981) was in line with the highest concentration in urban centers observed in the 1970s in the study area. The spatial distribution of settlements in the study area followed a markedly asymmetric trend over time (Figure 5, upper line). Settlement density in 1951 was, on average, high in two areas: at the Athens fringe and in more peripheral, rural districts north-east of Athens. This spatial structure reflected leapfrog urban growth in the 1950s, with population concentrating in central municipalities around Athens and Piraeus. Results for the following time interval (1960–1980s) indicate that rural settlements were gradually incorporated into more consolidated urban fabrics. Scattered settlements expanded in peripheral rural areas, indicating a low-density urban expansion, as illustrated in the 1991 map. Population residing in urban centers (Figure 5, central line) followed a similar trend. In 1951, population residing in urban centers and sparse settlements was fairly balanced: more than 50% of the population resided in settlements outside urban centers.
This spatial structure changed significantly in 1971, with the incorporation of inhabited areas scattered around Athens. In 1991, the largest percentage of the population living in scattered settlements was observed in Northern and Eastern Attica. The spatial distribution of settlements in the study area followed a peri-urban structure (Figure 5, lower line). The largest number of settlements was observed in Western Attica (e.g., in the traditional rural district of Megara). The number of settlements in South-eastern Attica (Lavrio-Keratea district, a location experiencing late suburbanization, with huge diffusion of second homes) was also quite high.

3.2. The Increase of Scattered Settlements in the Last Decades

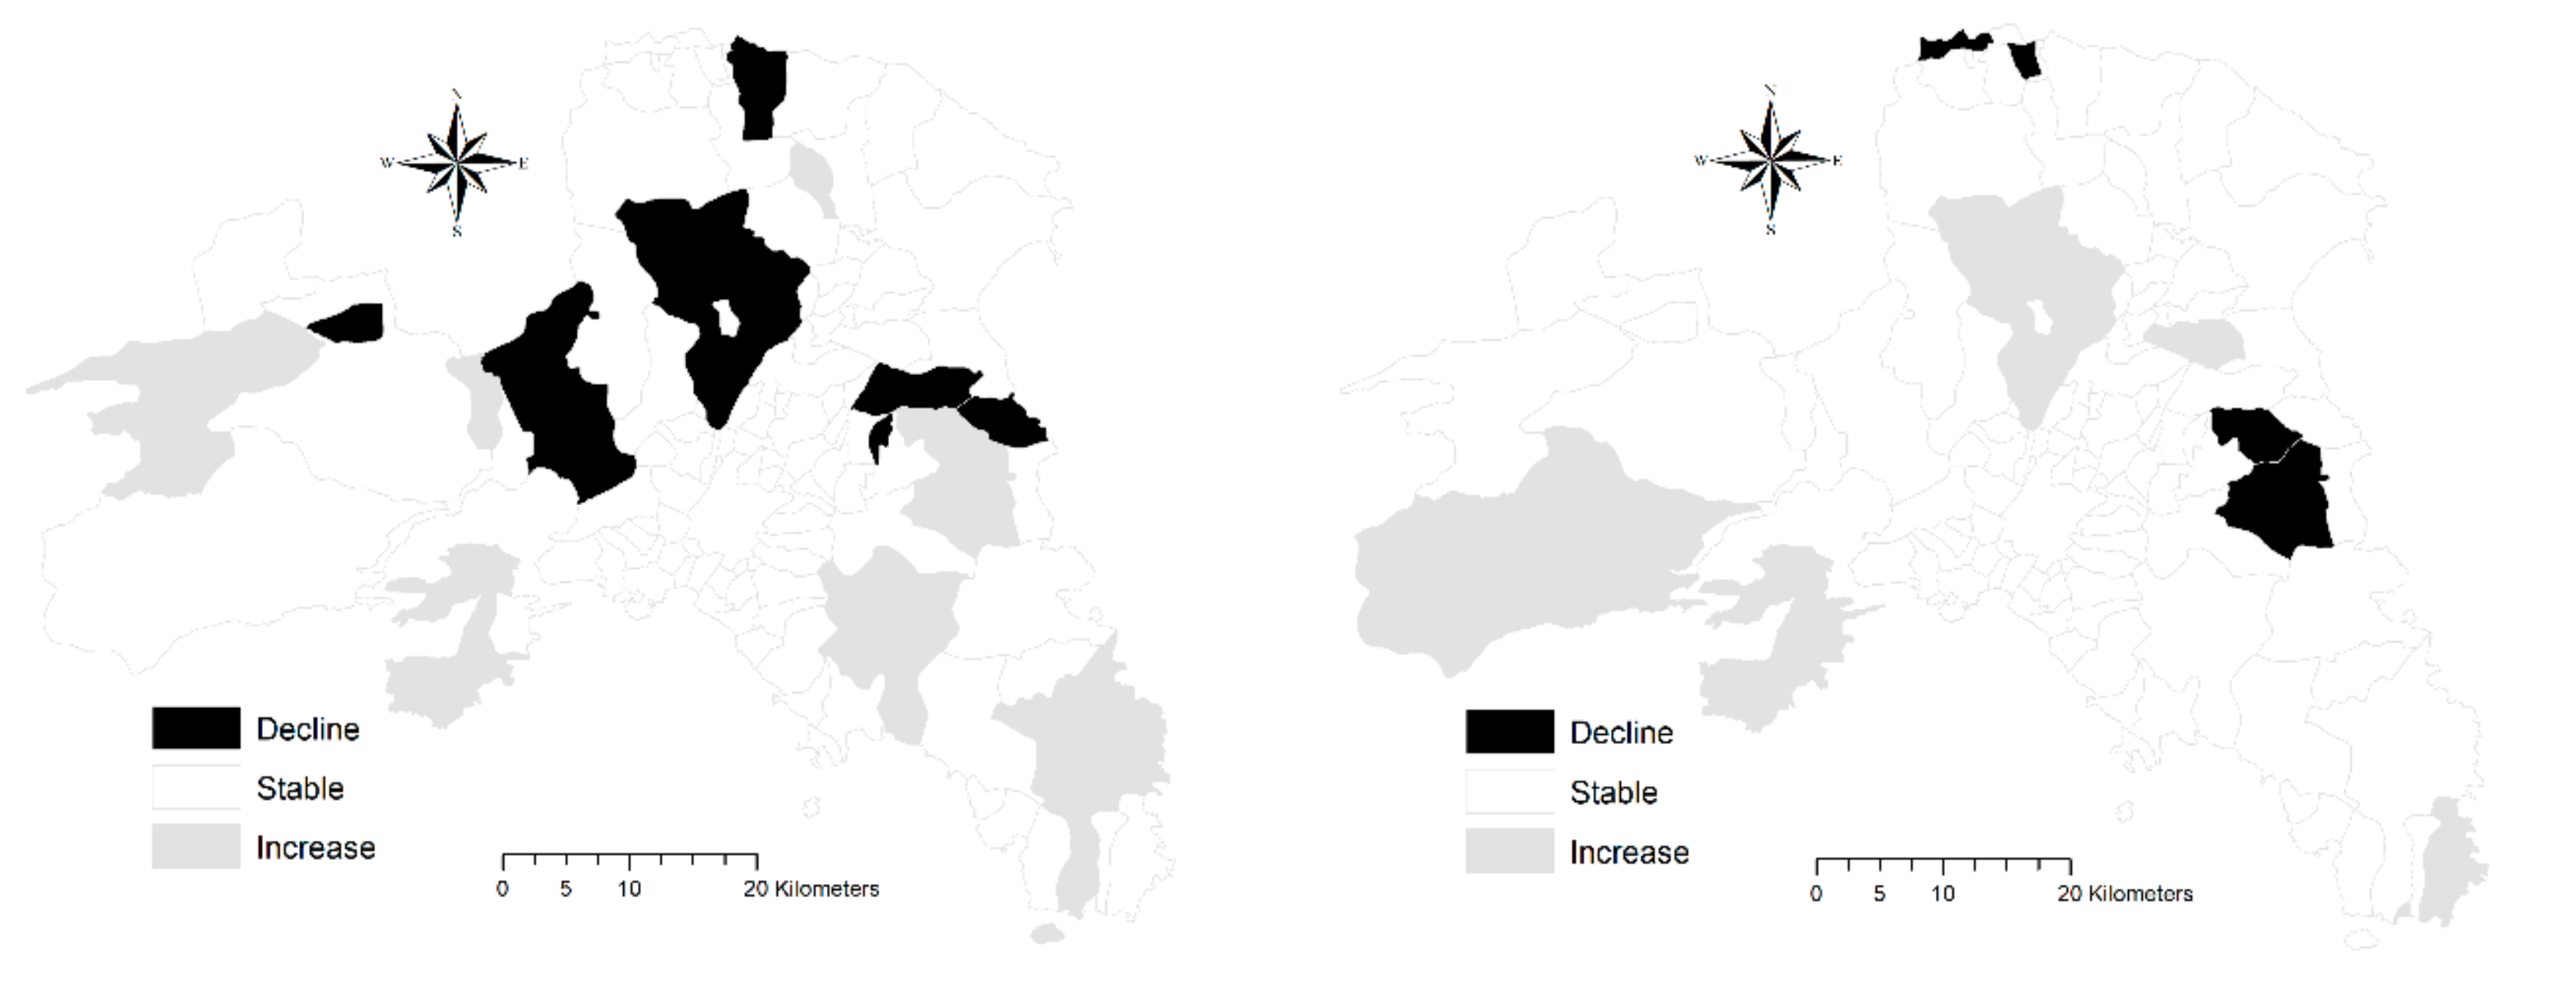
Comparing the spatial distribution of settlements in two consecutive decades (Figure 6), the number of settlements decreased in peri-urban municipalities between the 1990s and the 2000s, while increasing in peripheral rural municipalities between the 2000s and the 2010s. Overall, this trend suggests a slow process of urban compaction during economic expansion (2000s), with an incorporation of sparse settlements in continuous-dense urban fabric, and a moderate settlement dispersion in rural areas during the recession (2010s). In some districts, such as Messoghia, which experienced intense sprawl and a slight increase in the number of settlements in the 2000s, the reverse pattern was observed in the 2010s.
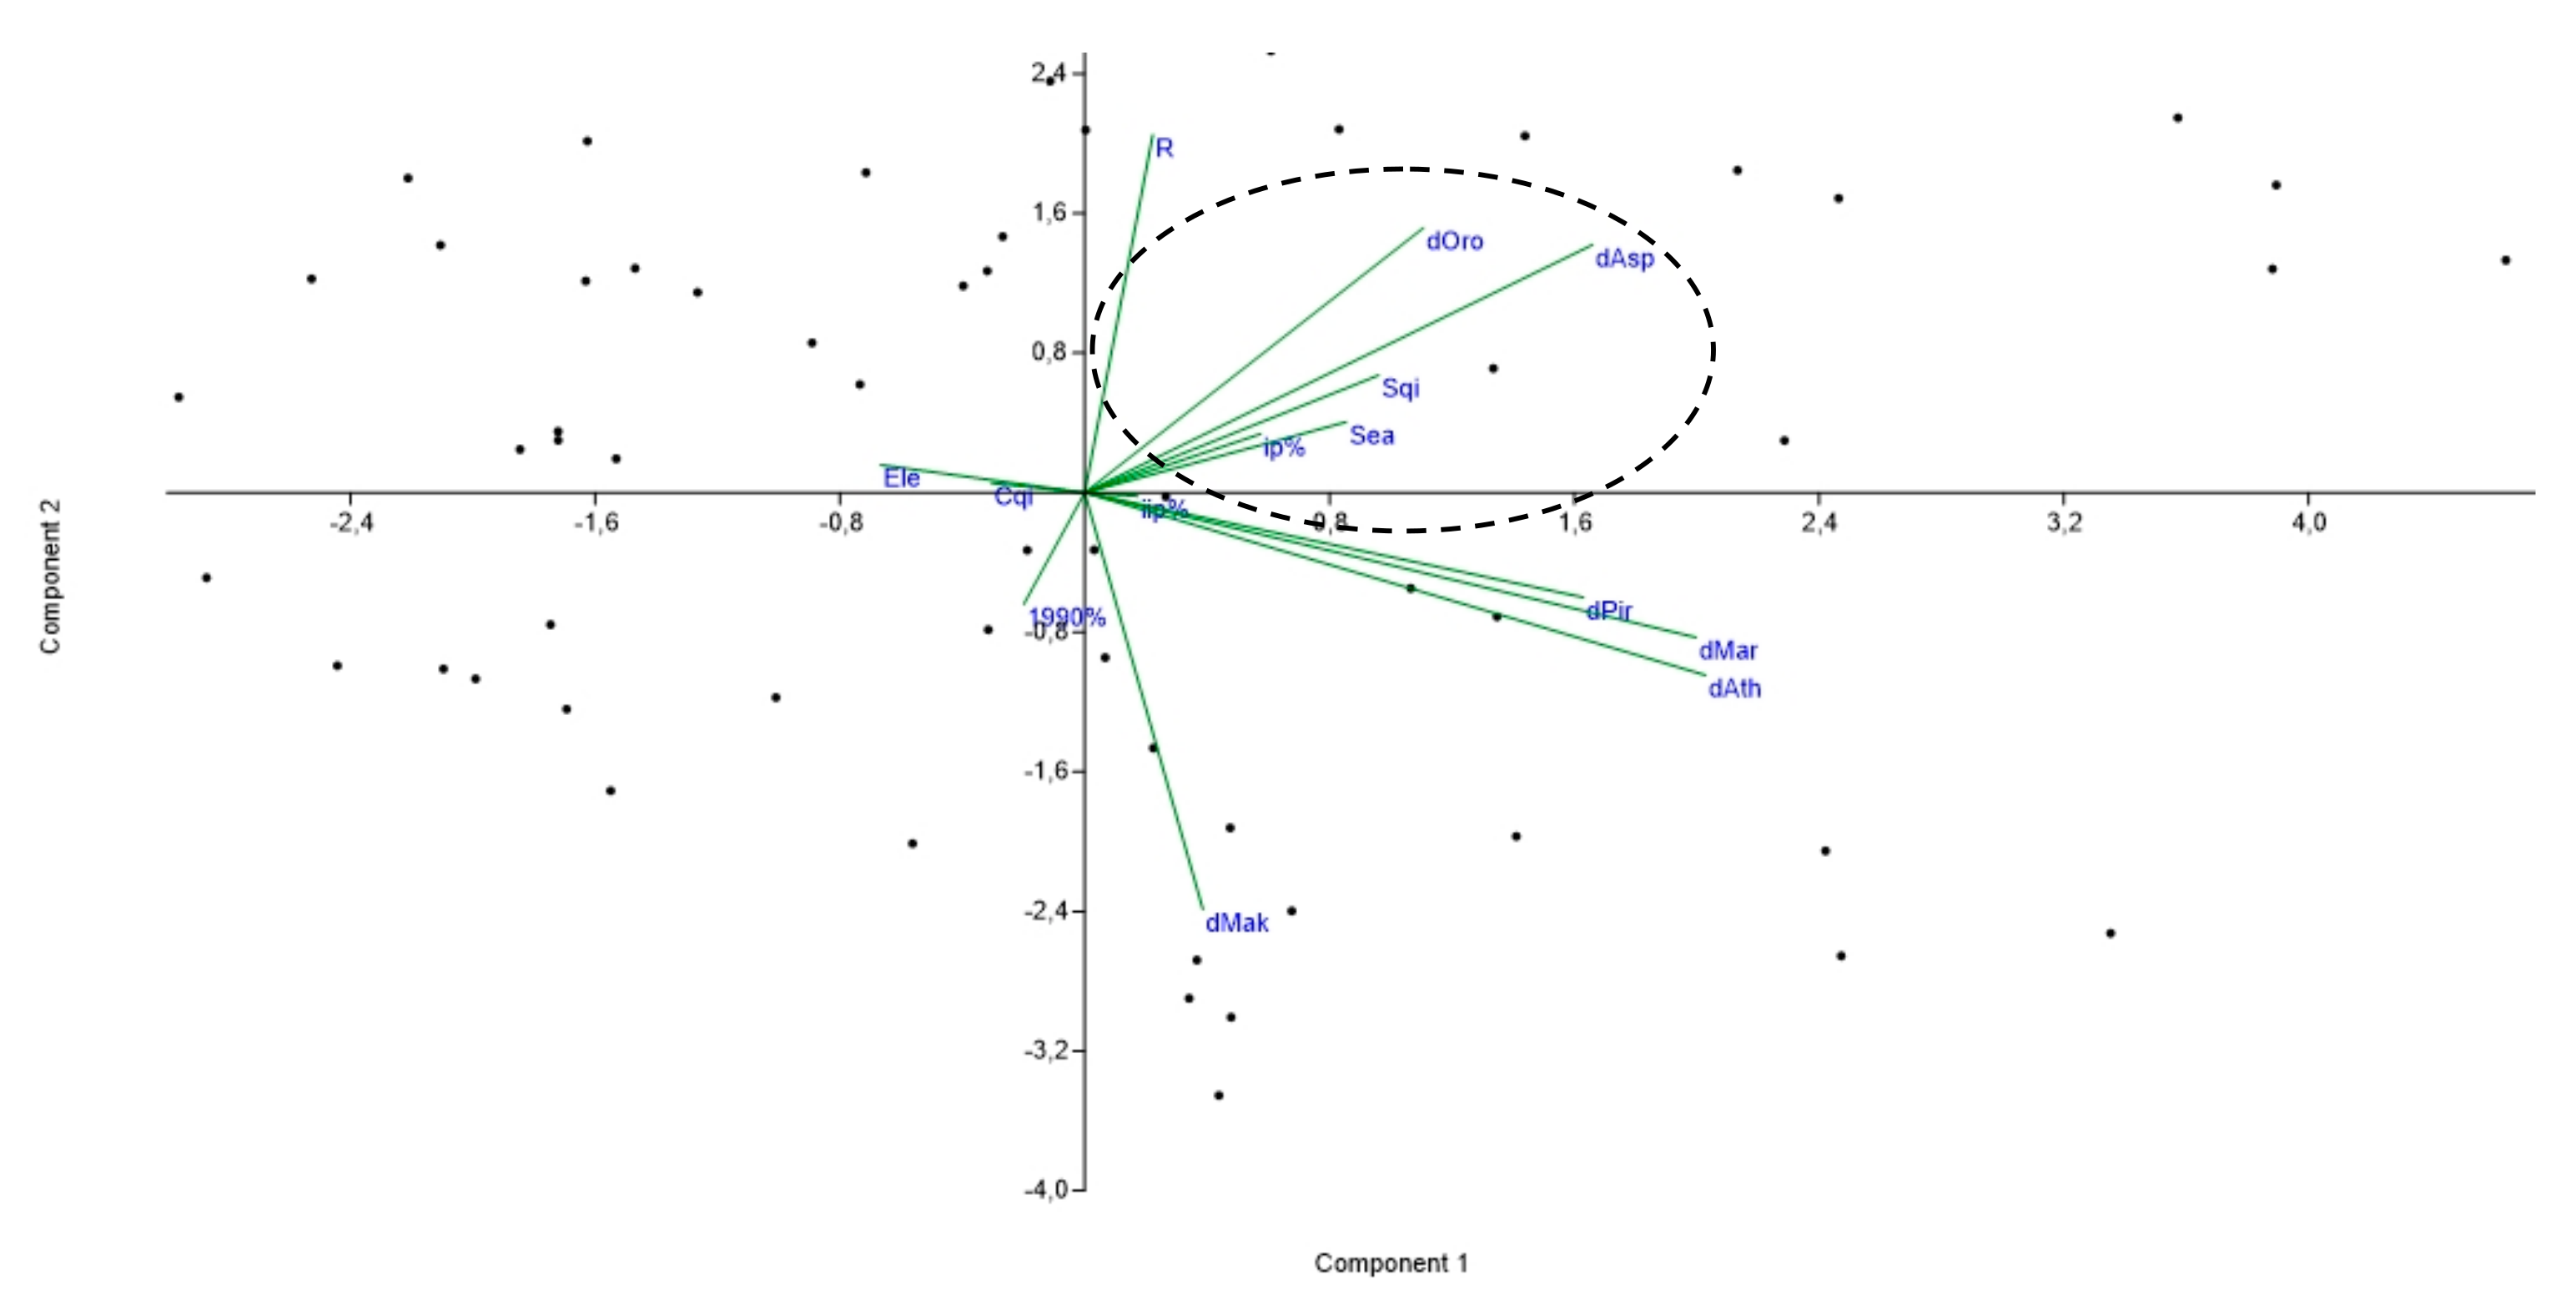
Principal Component Analysis (Figure 7) extracted two axes explaining 24.4% and 19.3% of the overall variance, respectively. Increases (or decreases) in the number of settlements were associated with Component 1. This variable (ip%) was more strongly associated with Component 1 in the first time interval (1990s–2000s), when the percent rate of change in the number of settlements (see Figure 7, dashed circle) grew in coastal municipalities (Sea) with higher soil quality (Sqi), and in locations at a greater distance from peripheral rural districts such as Aspropyrgos (Asp), and Oropos (Oro). The percent increase of settlements in the second decade (iip%) was only weakly associated with Component 1. At the same time, density of settlements at the beginning of the study period (1990%) was weakly associated with Component 2. This component illustrates the urban–rural gradient (distance from Messoghia district, “dMak”) distinguishing affluent from disadvantaged municipalities (“R”). Based on the structure of Component 2 (opposing “1990%” and “R” variables), results suggest how the highest settlement density was more frequently observed in economically disadvantaged municipalities.

3.3. Demographic Dynamics

Trends over time in total population and population growth rates were illustrated in Figure 8 by regional unit considering the last three decades (1991–2019). Population decreased rapidly in Central Athens, stabilizing to nearly 900,000 inhabitants in the mid-2010s from an initial figure of more than 1.2 million inhabitants in the early 1990s. Population in the regional units of Western, Southern and Northern Athens increased moderately in the 1990s and the 2000s, reaching a peak at the end of the economic expansion (2000s) and declining slightly in the last decade. The Piraeus unit followed a similar trend. Eastern and Western Attica were the only units growing continuously over the whole time interval. Central Athens (corresponding with downtown Athens and the neighboring municipalities) was the only district with negative growth rates for the same time interval. By contrast, Eastern and Western Attica were the only districts displaying positive rates of population growth for the entire study period.
Table 3 illustrates the evolution of natural and migratory growth rates of population in the study area. All growth rates show a spatial polarization in demographically dynamic and shrinking areas. Crude rates of net migration and the natural change of population had similar dynamics over time, albeit with different intensity. Crude rates of natural change of population are a powerful indicator of recent urban trends, outlining a more intense population shrinkage in the central districts and a residual growth in peripheral areas. However, contrasting demographic dynamics were observed in Eastern and Western Attica. In Eastern Attica, population growth was basically a consequence of immigration (mainly short-range residential mobility). In Western Attica, the contribution of natural balance was still important, because of a relatively young population and high fertility rates compared with the other peri-urban districts in the study area.
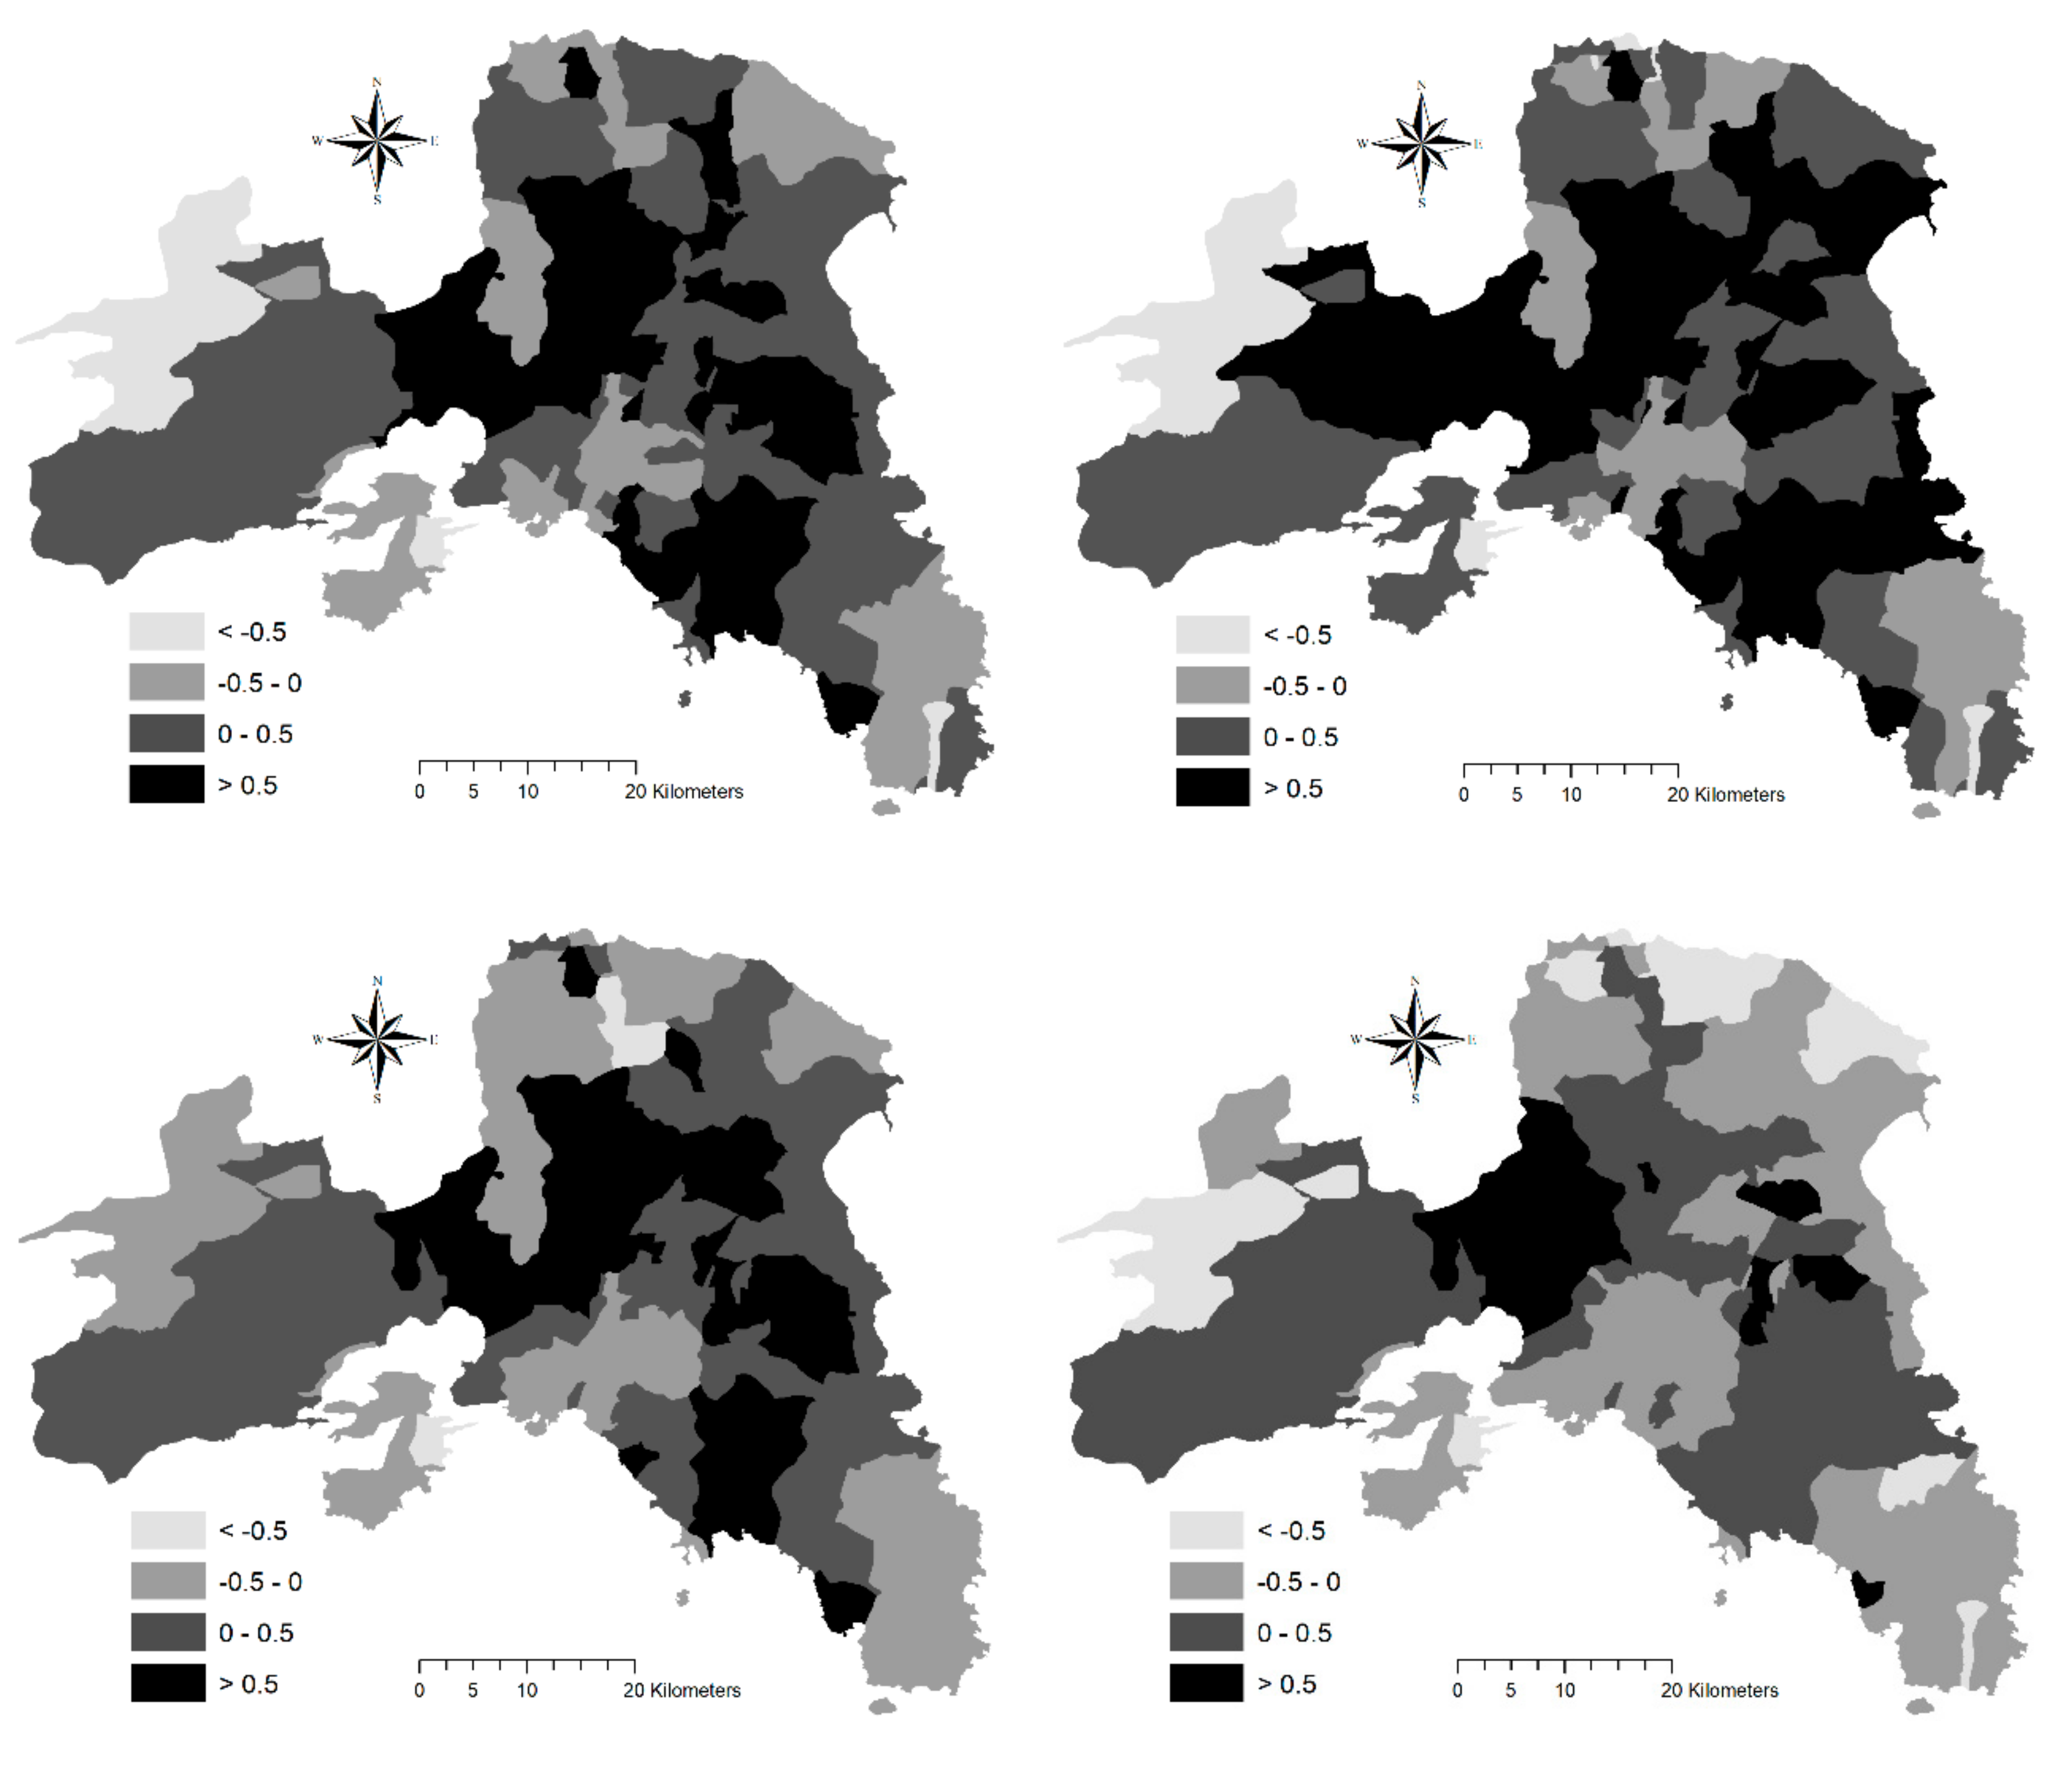
Crude rates of natural change of population (Figure 9) were rather persistent over space during the study period, with positive values (net population growth) in the peri-urban belt of Athens and negative values (net population decline) in both central and marginal districts, leading to a demographic polarization in urban, suburban, and rural districts. As the spatial analysis of population growth rates documents (see above), a positive natural balance was observed during economic expansion, reverting with recession. The highest contribution of the natural balance to population growth in Attica was observed between 2004 and 2008. Most peri-urban municipalities displayed a positive crude rate of natural change of population of above 0.5% per year. At the end of the recession (2014–2018), only five municipalities had an equally intense natural growth rate, and marginal rural municipalities with a negative growth rate (<−0.5%) increased substantially.
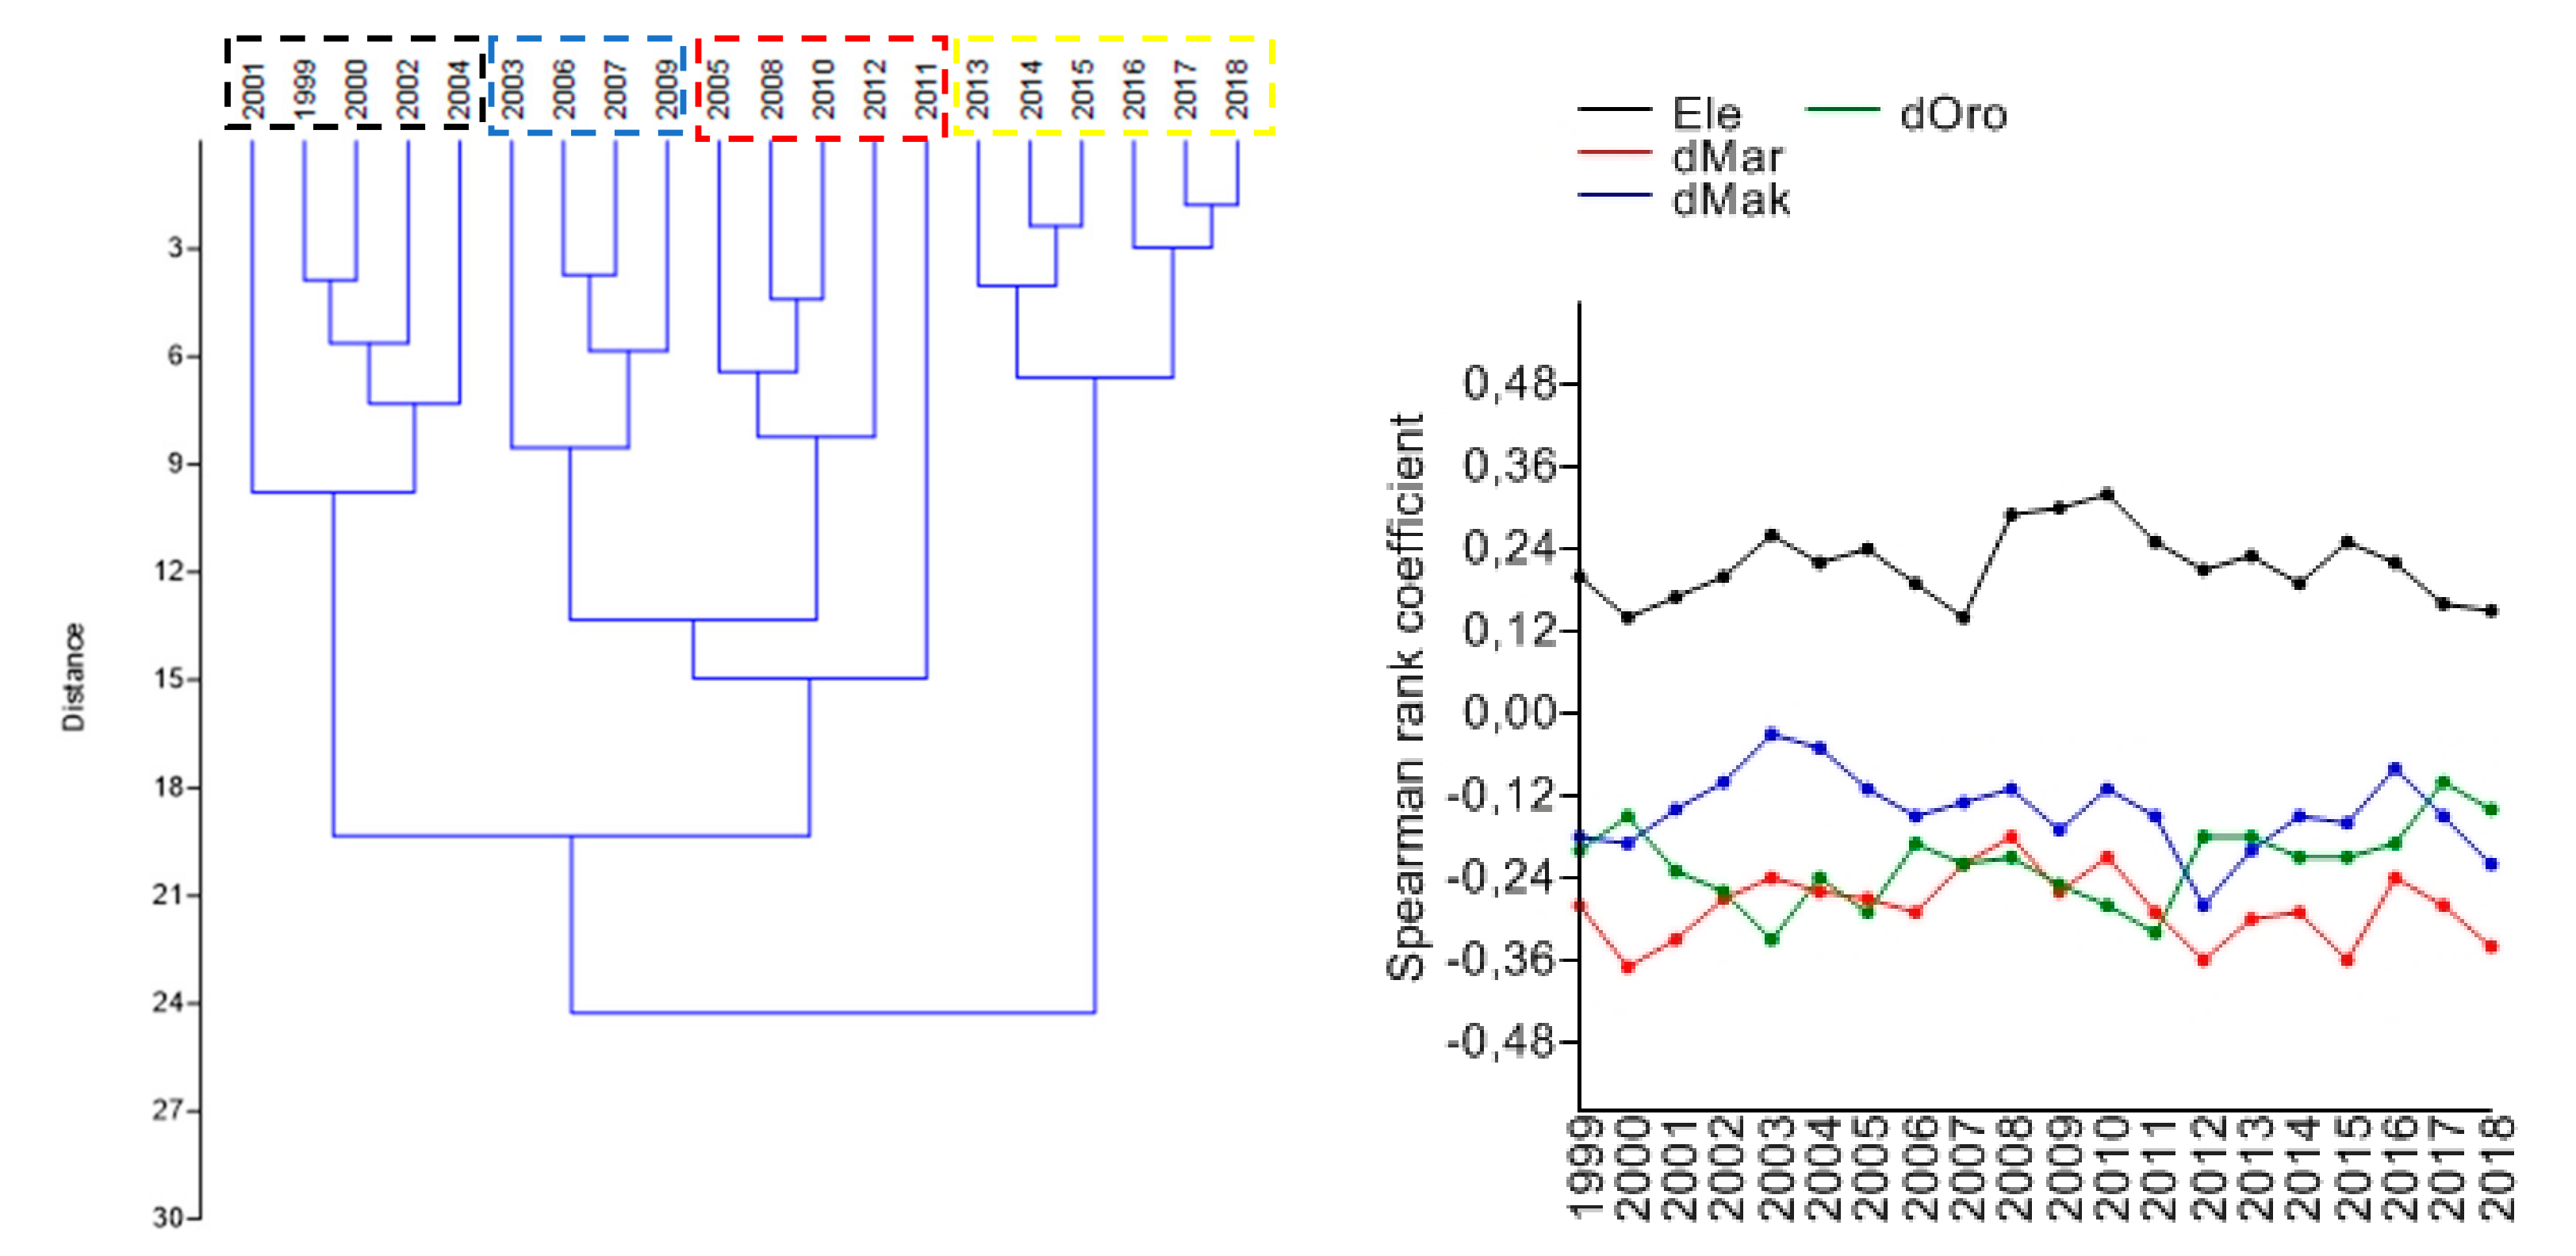
A similarity analysis of the spatial distribution of natural population growth rates per year was also carried out via hierarchical clustering (Figure 10, left). The related dendrogram outlines the existence of four distinct time periods (illustrated with different colors: black, blue, red and yellow), which are supposed to reflect different spatial regimes of natural population growth. The analysis distinguishes the early 2000s (1999–2003) and the most recent years (2014–2018) from a consistent group of years with intermediate demographic characteristics at the end of the expansion wave (2004–2008) and at the beginning of recession (2009–2013). The first cluster (black) was characterized by overall population expansion at the regional scale. The second cluster (yellow) was in turn characterized by overall population shrinkage at the regional scale.
The spatial distribution of crude rates of natural change of population was also correlated with the socioeconomic profile of each municipality in the study area using Spearman’s non-parametric analysis (Figure 10, right). Using the five-year temporal aggregation, crude rates decreased with the distance from the Athens business district in Maroussi (rs = −0.37, −0.29, −0.34, −0.31, respectively in 1999–2003, 2004–2008, 2009–2013 and 2014–2018, all coefficients significant at p < 0.05, n = 115). Considering the same demographic rate on a disaggregated temporal scale (n = 20 years), slightly different trends were observed, and four territorial variables out of 12 were found significantly correlated with the natural balance of population in at least one year out of 20. In particular, crude rates of natural change of population were correlated positively with elevation in the last years of the 2000s and negatively with the distance from three locations (the central business district, the international airport, and the rural district of Oropos). The distance from the Maroussi business district was negatively correlated with the natural population growth rate during the entire study period, being more intense during the recession. The distance from the other two urban nodes was significantly correlated with the same rate only in some years of economic expansion.

4. Discussion

Spatial diffusion of population has intrinsically modified traditional settlements in Mediterranean Europe, shaping functional relationships between coastal and inland districts, urban and rural areas, and central and peripheral zones [69,70,71]. A wealth of studies have documented the shift from compact and continuous urban fabric to discontinuous and dispersed settlements in many cities of the region, from Barcelona [5,23,30,61,64] to Rome [17,29], from Toulouse [8] to Athens [14,33,35,48], from Naples [56] to Adana [45], and from Istanbul [4] to Venice [10]. Similar studies were also carried out at the national scale (e.g., in Italy, Spain, and Israel [18,21,69,70]) and continental scale [7,12,37,38,41,42,49], providing comparable findings. Trends toward urban sprawl have been documented for other socioeconomic contexts outside Europe, both in affluent economies [6,9,34] and in emerging countries [27,40].
By illustrating an emblematic case for large cities in between settlement informality and planning (de)regulation [72], the most recent development in Athens encompasses sequential waves of economic expansion and recession. This may reveal complex form–function relationships at the base of recent urbanization, going beyond scale and agglomeration economies [73,74]. Results of the present study suggest a relatively slow process of urban compaction associated with economic expansion (early 2000s), with physical incorporation of scattered settlements in a continuous urban fabric, and a slower settlement dispersion affecting the surrounding rural areas. However, in Eastern Attica, a district affected by intense sprawl in earlier decades, the reverse pattern was observed [14,33]. In line with late suburbanization, a slight increase in the number of settlements was recorded in the 2000s. Conversely, a slight decrease of settlements was observed in the 2010s following a progressive densification of population [35,43]. Given the multiplicity of socioeconomic drivers [4], these results highlight how urban development can be associated with sequential phases of compaction and dispersion, leading to differentiated spatial regimes of settlement expansion and population growth [75,76]. Sequential waves of settlement dispersion (suburbanization) and re-densification (re-urbanization) shaped the spatial distribution of settlements, alimenting a subtle divide in consolidated urban fabrics and more entropic peri-urban spaces [77,78]. Following settlement dispersion and population re-densification, rural spaces were in turn transformed into chaotic systems with uncertain, short-term development paths [79].
Such dynamics should be more effectively interpreted and governed in a holistic perspective, by regulating the intrinsic relationship between location factors, land-use and demographic trends [80,81]. As a result of economic change [82], heterogeneous socio-demographic dynamics in recent times were associated with new family relationships, resulting in a decline of total fertility and aging [83,84]. Demographic dynamics have had an influential effect on the evolution of central cities, suburbs and rural districts re-densifying and, in some ways, diversifying those areas [31,85,86]. Understanding fertility and mortality dynamics (i.e., the components of natural balance) allows the delineation of socioeconomic factors typically oriented along density gradients [14], likely evidencing the latest trends in urban growth better than other indicators [33]. Individual fertility preferences have been demonstrated to decline with population density [65]. While an inverted U-shaped trend in rural fertility was hypothesized for developing regions, the lowest fertility levels in advanced economies have been usually observed in central cities [87]. The main causes of this trend include differences in the cost of living combined with income constraints in cities compared with rural areas [28].
Although urban–suburban–rural divides in fertility may have decreased over time, significant differences among various types of settlements persist [31], in agreement with the negative relationship between human fertility and population density at the global scale [83]. In this context, economic downturns led to more heterogeneous demographic processes over space [51]. For instance, while contributing significantly to these dynamics, fertility recovery typical of the Mediterranean countries in the 2000s has been little explored on a local scale. At the same time, economic downturns have led to a more latent change in housing preferences [64], since today many younger people prefer to live in smaller households than in the past. Taken as a signal of re-urbanization, young population segments concentrated in central areas or in high-density districts with public transportation connections expanding into the suburbs. This reveals a preference for urban lifestyles, with an indirect effect on demography and household composition, and more variable economic prospects [32]. Inner cities offer more work opportunities, better public transport, cheaper housing and easier networking [84]. Since demographic changes are intimately linked to lifestyle variations, these conditions may impact local fertility rates, consolidating marriage and childbearing postponement [2]. More flexible work arrangements with temporary jobs and lower income may exalt these processes [34]. At the same time, the arrival of labor-related foreign immigrants settling in core cities, especially in low-quality neighborhoods, contributed to the reshaping of local fertility trends impacting labor markets [9].
The most recent demographic dynamics in Central Athens are going in this direction, since the annual rate of population growth in this regional unit moved from negative values (around −3%) until 2015 to values close to zero (or weakly positive) in the most recent years. Socioeconomic implications of re-urbanization are manifold and require a more accurate investigation that integrates quantitative and qualitative data (field surveys). Our study suggests how re-urbanization is not exclusive to central areas, sometimes involving peripheral areas experiencing a prolonged demographic shrinkage and then re-attracting population thanks to local initiatives or broader redevelopment strategies. Ensuring a metropolitan vision of spatial planning is especially necessary in de-regulated contexts with heterogeneous local communities.
Taken together, this study jointly considered quantitative information from multiple official statistical sources. The integrated use of statistical data from census and administrative sources (registers) allows the linkage of accurate spatial information (with low temporal frequency) with less accurate spatial information, which is more frequent over time and completely updated. The exploratory analysis strategy developed in this study reflects the multiplicity of data sources and adapts to the complexity of the variables considered. The strategy provides operational support to the working hypothesis, giving comprehensible results at the various observation scales. This scheme definitely provides a new interpretative key to the latent phenomena of urban growth in peri-urban spaces, giving value to statistical information contained in different data sources available both in advanced contexts and in emerging economies.

5. Conclusions

Settlement re-densification is regarded as land-saving urban growth, providing measurable environmental benefits as far as soil depletion, land quality, landscape fragmentation, and water consumption are concerned [13,15,18]. Generally speaking, settlement densification was often associated with a lower rate of natural resource use in surrounding rural areas [20,27], although further research is necessary in this direction. As a matter of fact, understanding socio-environmental impacts of residential urban expansion requires a thorough investigation of dispersion and compaction processes, focusing on the role of specific territorial contexts [88,89]. Analysis of population dynamics contributes to a refined understanding of the latent re-organization of peri-urban spaces, as demonstrated in the present study. While having intrinsic limitations associated with the use of official statistics (e.g., missing data in census surveys, sampling errors in non-census surveys), demographic indicators seem to be reliable and robust statistical aggregates addressing complexity in urban growth development. More specifically, our work highlights how urban development follows sequential phases of compaction and dispersion, based on locally differentiated population trends. Demographic dynamics in the study area followed similar spatio-temporal trends over both expansion and recession times. Based on these findings, integrating responses of urban agents and rural communities to metropolitan growth and change appears to be a pivotal issue for an integrated strategy addressing urban containment and sustainable development of peri-urban spaces together. Sustainable urban management should actively face the increasingly fragmented settlement dynamics at the fringe, preceding informal and deregulated growth of settlements and prefiguring a spatial balance between central cities and peri-urban settlements in light of recent demographic trends.

Author Contributions

Conceptualization, L.S. and R.H.-C.-Z.; methodology, S.C.; software, R.S.; validation, G.Q.; formal analysis, L.S. and S.C.; investigation, S.C. and G.Q.; resources, G.Q. and R.S.; data curation, S.C.; writing—original draft preparation, L.S. and R.H.-C.-Z.; writing—review and editing, R.S. and G.Q.; visualization, S.C.; supervision, R.S.; project administration, G.Q.; funding acquisition, R.H.-C.-Z., G.Q. and R.S. All authors have read and agreed to the published version of the manuscript.

Funding

This research received no external funding.

Conflicts of Interest

The authors declare no conflict of interest.

References

  1. Nüssli, R.; Schmid, C. Beyond the urban–suburban divide: Urbanization and the production of the urban in Zurich North. Int. J. Urban Reg. Res. 2016, 40, 679–701. [Google Scholar] [CrossRef]
  2. Couch, C.; Petschel-Held, G.; Leontidou, L. Urban Sprawl in Europe: Landscapes, Land-Use Change and Policy; Blackwell: Oxford, UK, 2007. [Google Scholar]
  3. European Environment Agency. Urban Sprawl in Europe—The Ignored Challenge; EEA: Copenhagen, Denmark, 2006. [Google Scholar]
  4. Terzi, F.; Bolen, F. Urban sprawl measurement of Istanbul. Eur. Plan. Stud. 2009, 17, 1559–1570. [Google Scholar] [CrossRef]
  5. Muñoz, F. Lock living: Urban sprawl in Mediterranean cities. Cities 2003, 20, 381–385. [Google Scholar] [CrossRef]
  6. Bruegmann, R. Sprawl: A Compact History; University of Chicago Press: Chicago, IL, USA, 2005. [Google Scholar]
  7. Nijkamp, P.; Kourtit, K. The “new urban Europe”: Global challenges and local responses in the urban century. Eur. Plan. Stud. 2013, 21, 291–315. [Google Scholar] [CrossRef]
  8. Duvernoy, I.; Zambon, I.; Sateriano, A.; Salvati, L. Pictures from the other side of the fringe: Urban growth and peri-urban agriculture in a post-industrial city (Toulouse, France). J. Rural Stud. 2018, 57, 25–35. [Google Scholar] [CrossRef]
  9. Ewing, R. Is Los Angeles-style sprawl desirable? J. Am. Plan. Assoc. 1997, 63, 107–126. [Google Scholar] [CrossRef]
  10. Vaz, E.; Nijkamp, P. Gravitational forces in the spatial impacts of urban sprawl: An investigation of the region of Veneto, Italy. Habitat Int. 2015, 45, 99–105. [Google Scholar] [CrossRef]
  11. Phelps, N.A. Suburbs for nations? Some interdisciplinary connections on the suburban economy. Cities 2010, 27, 68–76. [Google Scholar] [CrossRef]
  12. Arribas-Bel, D.; Nijkamp, P.; Scholten, H. Multidimensional urban sprawl in Europe: A self-organizing map approach. Comput. Environ. Urban Syst. 2011, 35, 263–275. [Google Scholar] [CrossRef] [Green Version]
  13. Prishchepov, A.V.; Müller, D.; Dubinin, M.; Baumann, M.; Radeloff, V.C. Determinants of agricultural land abandonment in post-Soviet European Russia. Land Use Policy 2013, 30, 873–884. [Google Scholar] [CrossRef] [Green Version]
  14. Salvia, R.; Serra, P.; Zambon, I.; Cecchini, M.; Salvati, L. In-Between Sprawl and Neo-Rurality: Sparse Settlements and the Evolution of Socio-Demographic Local Context in a Mediterranean Region. Sustainability 2018, 10, 3670. [Google Scholar] [CrossRef] [Green Version]
  15. European Environment Agency. Landscape Fragmentation in Europe; EEA: Copenhagen, Denmark, 2011. [Google Scholar]
  16. Wehrwein, G.S. The rural-urban fringe. Econ. Geogr. 1942, 18, 217–228. [Google Scholar] [CrossRef]
  17. Biasi, R.; Colantoni, A.; Ferrara, C.; Ranalli, F.; Salvati, L. In-between sprawl and fires: Long-term forest expansion and settlement dynamics at the wildland–urban interface in Rome, Italy. Int. J. Sustain. Dev. World Ecol. 2015, 22, 467–475. [Google Scholar] [CrossRef]
  18. Barbero-Sierra, C.; Marques, M.J.; Ruíz-Pérez, M. The case of urban sprawl in Spain as an active and irreversible driving force for desertification. J. Arid Environ. 2013, 90, 95–102. [Google Scholar] [CrossRef]
  19. Garcia, X.; Ribas, A.; Llausàs, A.; Saurí, D. Socio-demographic profiles in suburban developments: Implications for water-related attitudes and behaviors along the Mediterranean coast. Appl. Geogr. 2013, 41, 46–54. [Google Scholar] [CrossRef]
  20. McDonnell, M.J.; Hahs, A.K. The use of gradient analysis studies in advancing our understanding of the ecology of urbanizing landscapes: Current status and future directions. Landsc. Ecol. 2008, 23, 1143–1155. [Google Scholar] [CrossRef]
  21. Munafò, M.; Salvati, L.; Zitti, M. Estimating soil sealing rate at national level—Italy as a case study. Ecol. Indic. 2013, 26, 137–140. [Google Scholar] [CrossRef]
  22. Elmqvist, T.; Fragkias, M.; Goodness, J.; Güneralp, B.; Marcotullio, P.J.; McDonald, R.I.; Parnell, S.; Schewenius, M.; Sendstad, M.; Seto, K.C.; et al. Urbanization, Biodiversity and Ecosystem Services: Challenges and Opportunities; Springer: Utrecht, The Netherlands, 2013. [Google Scholar]
  23. Cuadrado-Ciuraneta, S.; Durà-Guimerà, A.; Salvati, L. Not only tourism: Unravelling suburbanization, second-home expansion and “rural” sprawl in Catalonia, Spain. Urban Geogr. 2017, 38, 66–89. [Google Scholar] [CrossRef]
  24. Parés, M.; March, H.; Saurí, D. Atlantic gardens in Mediterranean climates: Understanding the production of suburban natures in Barcelona. Int. J. Urban Reg. Res. 2013, 37, 328–347. [Google Scholar] [CrossRef]
  25. Phelps, N.A.; Parsons, N.; Ballas, D.; Dowling, A. Post-Suburban Europe: Planning and Politics at the Margins of Europe’s Capital Cities; Palgrave Macmillan: Basingstoke, UK, 2006. [Google Scholar]
  26. Serra, P.; Vera, A.; Tulla, A.F.; Salvati, L. Beyond urban–rural dichotomy: Exploring socioeconomic and land-use processes of change in Spain (1991–2011). Appl. Geogr. 2014, 55, 71–81. [Google Scholar] [CrossRef]
  27. Aguilar, A.G. Peri-urbanization, illegal settlements and environmental impact in Mexico City. Cities 2008, 25, 133–145. [Google Scholar] [CrossRef]
  28. Gkartzios, M.; Scott, M. Countering counter-urbanisation: Spatial planning challenges in a dispersed city-region, the greater Dublin area. Town Plan. Rev. 2017, 81, 23–52. [Google Scholar] [CrossRef]
  29. Colantoni, A.; Mavrakis, A.; Sorgi, T.; Salvati, L. Towards a ‘polycentric’ landscape? Reconnecting fragments into an integrated network of coastal forests in Rome. Rend. Lincei 2015, 26, 615–624. [Google Scholar] [CrossRef]
  30. Dura-Guimera, A. Population deconcentration and social restructuring in Barcelona, a European Mediterranean city. Cities 2003, 20, 387–394. [Google Scholar] [CrossRef]
  31. Kabisch, N.; Haase, D. Diversifying European agglomerations: Evidence of urban population trends for the 21st century. Popul. Space Place 2011, 17, 236–253. [Google Scholar] [CrossRef]
  32. Buzar, S.; Ogden, P.E.; Hall, R.; Haase, A.; Kabisch, S.; Steinführer, A. Splintering urban populations: Emergent landscapes of reurbanisation in four European cities. Urban Stud. 2007, 44, 651–677. [Google Scholar] [CrossRef]
  33. Pili, S.; Grigoriadis, E.; Carlucci, M.; Clemente, M.; Salvati, L. Towards sustainable growth? A multi-criteria assessment of (changing) urban forms. Ecol. Indic. 2017, 76, 71–80. [Google Scholar] [CrossRef]
  34. Galster, G.; Hanson, R.; Ratcliffe, M.R.; Wolman, H.; Coleman, S.; Freihage, J. Wrestling sprawl to the ground: Defining and measuring an elusive concept. Hous. Policy Debate 2001, 12, 681–717. [Google Scholar] [CrossRef]
  35. Chorianopoulos, I.; Pagonis, T.; Koukoulas, S.; Drymoniti, S. Planning, competitiveness and sprawl in the Mediterranean city: The case of Athens. Cities 2010, 27, 249–259. [Google Scholar] [CrossRef]
  36. Krueger, R.; Gibbs, D.; Carr, C. Examining regional competitiveness and the pressures of rapid growth: An interpretive institutionalist account of policy responses in three city regions. Environ. Plan. C Politics Space 2018, 36, 965–986. [Google Scholar] [CrossRef] [Green Version]
  37. Longhi, C.; Musolesi, A. European cities in the process of economic integration: Towards structural convergence. Ann. Reg. Sci. 2007, 41, 333–351. [Google Scholar] [CrossRef]
  38. Turok, I.; Mykhnenko, V. The trajectories of European cities, 1960–2005. Cities 2007, 24, 165–182. [Google Scholar] [CrossRef]
  39. Haase, D.; Nuissl, H. The urban-to-rural gradient of land use change and impervious cover: A long-term trajectory for the city of Leipzig. Land Use Sci 2010, 5, 123–142. [Google Scholar] [CrossRef]
  40. Schneider, A.; Woodcock, C.E. Compact, dispersed, fragmented, extensive? A comparison of urban growth in twenty-five global cities using remotely sensed data, pattern metrics and census information. Urban Stud. 2008, 45, 659–692. [Google Scholar] [CrossRef]
  41. Kasanko, M.; Barredo, J.I.; Lavalle, C.; McCormick, N.; Demicheli, L.; Sagris, V.; Brezger, A. Are European Cities Becoming Dispersed? A Comparative Analysis of Fifteen European Urban Areas. Landsc. Urban Plan. 2006, 77, 111–130. [Google Scholar] [CrossRef]
  42. Carlucci, M.; Grigoriadis, E.; Rontos, K.; Salvati, L. Revisiting a hegemonic concept: Long-term ‘Mediterranean urbanization’ in between city re-polarization and metropolitan decline. Appl. Spat. Anal. Policy 2017, 10, 347–362. [Google Scholar] [CrossRef]
  43. Rontos, K.; Grigoriadis, E.; Sateriano, A.; Syrmali, M.; Vavouras, I.; Salvati, L. Lost in protest, found in segregation: Divided cities in the light of the 2015 “Oχι” referendum in Greece. City Cult. Soc. 2016, 7, 139–148. [Google Scholar] [CrossRef]
  44. Camagni, R.; Capello, R.; Nijkamp, P. Toward Sustainable City Policy: An Economy-Environment-Technology Nexus. Ecol. Econ. 1998, 24, 103–118. [Google Scholar] [CrossRef]
  45. Alphan, H. Land use change and urbanisation of Adana, Turkey. Land Degrad. Dev. 2003, 14, 575–586. [Google Scholar] [CrossRef]
  46. Salvati, L.; Perini, L.; Sabbi, A.; Bajocco, S. Climate aridity and land use changes: A regional-scale analysis. Geogr. Res. 2012, 50, 193–203. [Google Scholar] [CrossRef]
  47. Zasada, I.; Loibl, W.; Köstl, M.; Piorr, A. Agriculture under human influence: A spatial analysis of farming systems and land use in European rural-urban-regions. Eur. Countrys. 2013, 5, 71–88. [Google Scholar] [CrossRef]
  48. Zitti, M.; Ferrara, C.; Perini, L.; Carlucci, M.; Salvati, L. Long-term urban growth and land use efficiency in Southern Europe: Implications for sustainable land management. Sustainability 2015, 7, 3359–3385. [Google Scholar] [CrossRef] [Green Version]
  49. Salvati, L.; Zambon, I.; Chelli, F.M.; Serra, P. Do spatial patterns of urbanization and land consumption reflect different socioeconomic contexts in Europe? Sci. Total Environ. 2018, 625, 722–730. [Google Scholar] [CrossRef] [PubMed]
  50. Cecchini, M.; Zambon, I.; Pontrandolfi, A.; Turco, R.; Colantoni, A.; Mavrakis, A.; Salvati, L. Urban sprawl and the ‘olive’ landscape: Sustainable land management for ‘crisis’ cities. GeoJournal 2019, 84, 237–255. [Google Scholar] [CrossRef]
  51. Delladetsima, P.M. The emerging property development pattern in Greece and its impact on spatial development. Eur. Urban Reg. Stud. 2006, 13, 245–278. [Google Scholar] [CrossRef]
  52. Salvati, L.; Carlucci, M. A composite index of sustainable development at the local scale: Italy as a case study. Ecol. Indic. 2014, 43, 162–171. [Google Scholar] [CrossRef]
  53. Garcia-López, M.À. Population suburbanization in Barcelona, 1991–2005: Is its spatial structure changing? J. Hous. Econ. 2010, 19, 119–132. [Google Scholar] [CrossRef]
  54. Leontidou, L. The Mediterranean City in Transition; Cambridge University Press: Cambridge, UK, 1990. [Google Scholar]
  55. Zambon, I.; Benedetti, A.; Ferrara, C.; Salvati, L. Soil matters? A multivariate analysis of socioeconomic constraints to urban expansion in Mediterranean Europe. Ecol. Econ. 2018, 146, 173–183. [Google Scholar] [CrossRef]
  56. De Rosa, S.; Salvati, L. Beyond a ‘side street story’? Naples from spontaneous centrality to entropic polycentricism, towards a ‘crisis city’. Cities 2016, 51, 74–83. [Google Scholar] [CrossRef]
  57. Gosnell, H.; Abrams, J. Amenity migration: Diverse conceptualizations of drivers, socioeconomic dimensions, and emerging challenges. GeoJournal 2011, 76, 303–322. [Google Scholar] [CrossRef]
  58. Costa, F. Urban planning in Rome from 1870 to the first world war. Geojournal 1991, 24, 269–276. [Google Scholar] [CrossRef]
  59. Salvati, L.; Sateriano, A.; Grigoriadis, E. Crisis and the city: Profiling urban growth under economic expansion and stagnation. Lett. Spat. Resour. Sci. 2016, 9, 329–342. [Google Scholar] [CrossRef]
  60. Salvati, L. The dark side of the crisis: Disparities in per-capita income (2000–2012) and the urban-rural gradient in Greece. Tijdschr. Voor Econ. En Soc. Geogr. 2016, 107, 628–641. [Google Scholar] [CrossRef]
  61. Di Feliciantonio, C.; Salvati, L. ‘Southern’ alternatives of urban diffusion: investigating settlement characteristics and socio-economic patterns in three mediterranean regions. Tijdschr. Voor Econ. Soc. Geogr. 2015, 106, 453–470. [Google Scholar] [CrossRef]
  62. Morelli, G.V.; Rontos, K.; Salvati, L. Between suburbanisation and re-urbanisation? Revisiting the urban life cycle in a mediterranean compact city. Urban Res. Pract. 2014, 7, 74–88. [Google Scholar] [CrossRef]
  63. Salvati, L.; Serra, P. Estimating rapidity of change in complex urban systems: A multidimensional, local-scale approach. Geogr. Anal. 2016, 48, 132–156. [Google Scholar] [CrossRef]
  64. Zambon, I.; Serra, P.; Sauri, D.; Carlucci, M.; Salvati, L. Beyond the ‘Mediterranean city’: Socioeconomic disparities and urban sprawl in three Southern European cities. Geogr. Ann. Ser. BHum. Geogr. 2017, 99, 319–337. [Google Scholar] [CrossRef]
  65. Hennig, E.I.; Schwick, C.; Soukup, T.; Orlitová, E.; Kienast, F.; Jaeger, J.A. Multi-scale analysis of urban sprawl in Europe: Towards a European de-sprawling strategy. Land Use Policy 2015, 49, 483–498. [Google Scholar] [CrossRef] [Green Version]
  66. Bajocco, S.; Ceccarelli, T.; Smiraglia, D.; Salvati, L.; Ricotta, C. Modeling the ecological niche of long-term land use changes: The role of biophysical factors. Ecol. Indic. 2016, 60, 231–236. [Google Scholar] [CrossRef]
  67. Bajocco, S.; De Angelis, A.; Salvati, L. A satellite-based green index as a proxy for vegetation cover quality in a Mediterranean region. Ecol. Indic. 2012, 23, 578–587. [Google Scholar] [CrossRef]
  68. Triantakonstantis, D.; Stathakis, D. Examining urban sprawl in Europe using spatial metrics. Geocarto Int. 2015, 30, 1092–1112. [Google Scholar] [CrossRef]
  69. Frenkel, A.; Ashkenazi, M. The integrated sprawl index: Measuring the urban landscape in Israel. Ann. Reg. Sci. 2007, 42, 99–121. [Google Scholar] [CrossRef]
  70. Frenkel, A.; Ashkenazi, M. Measuring Urban Sprawl: How can We Deal With It? Environ. Plan. B 2008, 35, 56–79. [Google Scholar] [CrossRef] [Green Version]
  71. Scott, A.J.; Storper, M. The nature of cities: The scope and limits of urban theory. Int. J. Urban Reg. Res. 2015, 39, 1–15. [Google Scholar] [CrossRef] [Green Version]
  72. Martinez-Fernandez, C.; Audirac, I.; Fol, S. Cunningham-Sabot, E. Shrinking cities: Urban challenges of globalization. Int. J. Urban Reg. Res. 2012, 36, 213–225. [Google Scholar] [CrossRef] [PubMed]
  73. Robinson, J. Cities in a world of cities: The comparative gesture. Int. J. Urban Reg. Res. 2017, 35, 1–23. [Google Scholar] [CrossRef]
  74. Sevilla-Buitrago, A. Debating contemporary urban conflicts: A survey of selected scholars. Cities 2013, 31, 454–468. [Google Scholar] [CrossRef] [Green Version]
  75. Berry, B.J.L. Urbanization and Counterurbanization; Sage: New York, NY, USA, 1976. [Google Scholar]
  76. Seto, K.C.; Sánchez-Rodríguez, R.; Fragkias, M. The new geography of contemporary urbanization and the environment. Annu. Rev. Environ. Resour. 2010, 35, 167–194. [Google Scholar] [CrossRef] [Green Version]
  77. Moroni, S.; Minola, L. Unnatural sprawl: Reconsidering public responsibility for suburban development in Italy, and the desirability and possibility of changing the rules of the game. Land Use Policy 2019, 86, 104–112. [Google Scholar] [CrossRef]
  78. Morote, Á.F.; Hernández, M. Urban sprawl and its effects on water demand: A case study of Alicante, Spain. Land Use Policy 2016, 50, 352–362. [Google Scholar] [CrossRef] [Green Version]
  79. Veneri, P.; Burgalassi, D. Questioning polycentric development and its effects. Issues of definition and measurement for the Italian NUTS-2 regions. Eur. Plan. Stud. 2012, 20, 1017–1037. [Google Scholar] [CrossRef] [Green Version]
  80. Rauhut, D. Polycentricity–one concept or many? Eur. Plan. Stud. 2017, 25, 332–348. [Google Scholar] [CrossRef]
  81. Schmitt, P. Planning for polycentricity in European metropolitan areas—Challenges, expectations and practices. Plan. Pract. Res. 2013, 28, 400–419. [Google Scholar] [CrossRef]
  82. Montgomery, M.R. The urban transformation of the developing world. Science 2008, 319, 761–764. [Google Scholar] [CrossRef] [Green Version]
  83. Lutz, W.; Testa, M.R.; Penn, D.J. Population density is a key factor in declining human fertility. Popul. Environ. 2006, 28, 69–81. [Google Scholar] [CrossRef]
  84. Liu, L. Fertility trends in China’s more developed urban districts: The case of four cities. Popul. Space Place 2005, 11, 411–424. [Google Scholar] [CrossRef]
  85. Modica, G.; Vizzari, M.; Pollino, M.; Fichera, C.R.; Zoccali, P.; Di Fazio, S. Spatio-temporal analysis of the urban–rural gradient structure: An application in a Mediterranean mountainous landscape. Earth Syst. Dyn. 2012, 3, 263–279. [Google Scholar] [CrossRef] [Green Version]
  86. Dierwechter, Y. Metropolitan geographies of US climate action: Cities, suburbs, and the local divide in global responsibilities. J. Environ. Policy Plan. 2010, 12, 59–82. [Google Scholar] [CrossRef]
  87. Van Den Berg, L.; Drewett, L.; Klaassen, L.H. Urban Europe: A Study of Growth and Decline; Pergamon Press: Oxford, UK, 1982. [Google Scholar]
  88. Ahrens, A.; Lyons, S. Changes in land cover and urban sprawl in Ireland from a comparative perspective over 1990–2012. Land 2019, 8, 16. [Google Scholar] [CrossRef] [Green Version]
  89. Aurambout, J.P.; Barranco, R.; Lavalle, C. Towards a simpler characterization of urban sprawl across urban areas in Europe. Land 2018, 7, 33. [Google Scholar] [CrossRef] [Green Version]
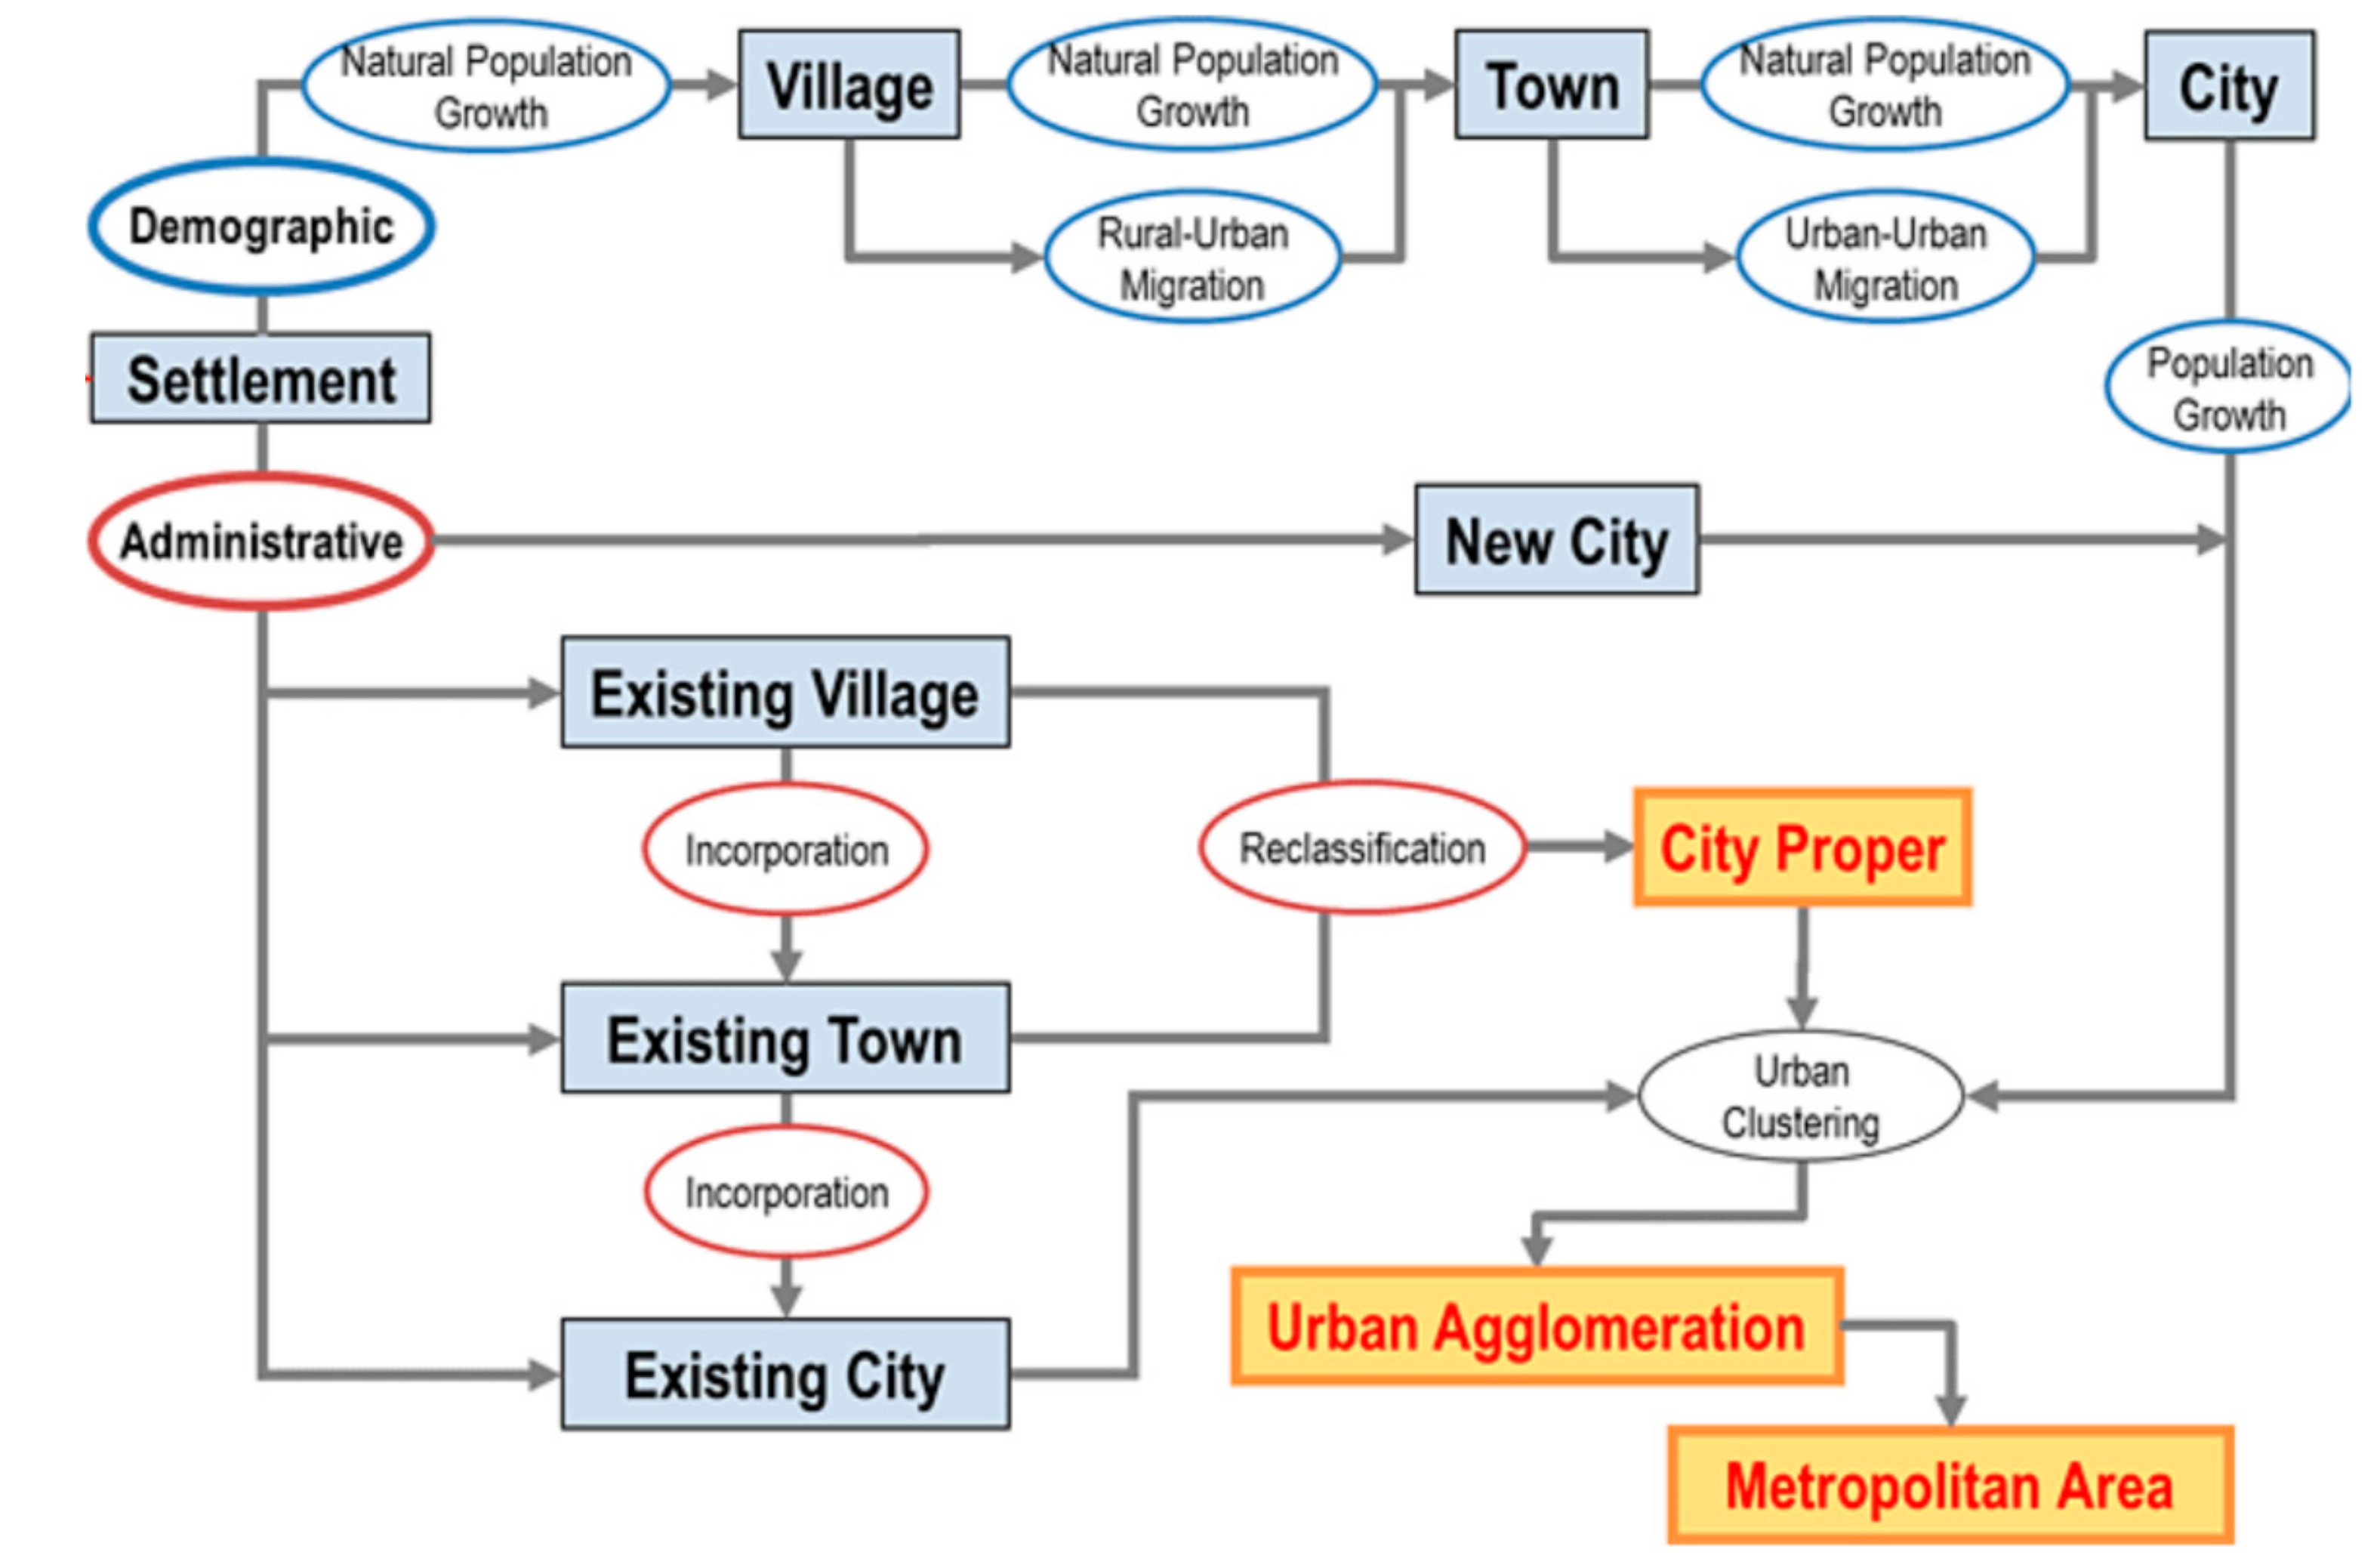
Figure 1. Selected mechanisms of urban growth based on population dynamics according to the World Urbanization Prospects (https://population.un.org/wup/General/DefinitionIssues.aspx).
Land 09 00200 g001
Figure 2. A map illustrating the extent of the study area and the spatial distribution of continuous urban fabric therein (left); the position of the study area in Greece (upper right) and the regional units of the study area (lower right); drawn from Urban Atlas and Greek Statistical Office (ELSTAT) shapefiles.
Land 09 00200 g002
Figure 3. Municipal boundaries and spatial distribution of urban centers in 2011 (dots), with a cross indicating downtown Athens (left); spatial distribution of registered settlements (dots) in the Athens metropolitan region and surroundings in 2011 (right). (Source: elaboration on ELSTAT data and shapefiles).
Land 09 00200 g003
Figure 4. Total population and the percent share of population residing in sparse locations in total population in the study area (left); density of settlements (excluding urban centers) and the relative mean population size (inhabitants) by year (right).
Land 09 00200 g004
Figure 5. Upper line: (left) distance (km) from downtown Athens (star), and density of sparse settlements (per km2) in 1951 (middle) and 1991 (right); central line: percent share of resident inhabitants in urban centers in 1951 (left), 1971 (middle) and 1991 (right); lower line: number of settlements in the study area at three sequential decades (left: 1990s; middle: 2000s; right: 2010s).
Land 09 00200 g005
Figure 6. Changes over time in the absolute number of settlements in the study area between the 1990s and the 2000s (left) and between the 2000s and the 2010s (right).
Land 09 00200 g006
Figure 7. Biplot of a principal component analysis of the increase (or decrease) in the number of settlements supplemented with contextual indicators in the study area (acronyms in Section 2.3).
Land 09 00200 g007
Figure 8. Total population (inhabitants) (left) and annual percent rate of population growth (right) by regional unit in the study area (1991–2019).
Land 09 00200 g008
Figure 9. Annual natural rate of population growth (%) by municipality and time interval. upper line: (left) 1999–2003 and (right) 2004–2008; lower line (left) 2009–2013 and (right) 2014–2018.
Land 09 00200 g009
Figure 10. Hierarchical clustering (Ward’s agglomeration; Euclidean distance) assessing similarity in the temporal distribution of crude rates of natural change of population (annual percent rate by municipality) in the study area; color boxes indicate years belonging to four homogeneous groups (left) and pair-wise Spearman rank correlation coefficients between natural population balance and selected predictors of the socioeconomic profile of municipalities (significance at p < 0.05 with rs > |0.27|, n = 115) (right).
Land 09 00200 g010
Table 1. A summary of analysis dimensions, data sources and technical details (spatial domain indicates the elementary analysis unit, from the regional level (study area) to the local level (municipal unit)).
Dimension/IndicatorSpatial DomainTime IntervalTime FrequencyData Source
Total population and resident population in sparse locationsStudy area1951–2011DecadalPopulation census
Density of rural settlementsStudy area
Number of settlements 1991–2019AnnualSettlement register
Estimated total populationRegional unit AnnualPopulation register
Natural population balance 1999–2018Annual
Migration balance
Natural population growth rateMunicipal unit AnnualVital statistics
Table 2. A summary of statistical techniques run on the specific dimensions and indicators illustrated in Table 1 (descriptive statistics include tables, graphs and maps).
Dimension/IndicatorTime AggregationStatistical Technique
Total population and resident population in sparse locationsDecadalDescriptive statistics
Density of settlements outside urban centers
Number of settlementsThree decades (1990s, 2000s, 2010s)Descriptive statistics and PCA (Principal Component Analysis) with contextual indicators (see Section 2.3)
Estimated total populationAnnualDescriptive statistics
Natural population balanceTwo periods (2000–2009; 2010–2018)
Migration balance
Natural population growth rateAnnual Hierarchical clustering
Natural population growth rateFour intervals (1999–2003, 2004–2008, 2009–2013, 2014–2018)Non-parametric Spearman correlations with contextual indicators (Section 2.3)
Table 3. Population growth rates in the study area by time window (2000–2009 or 2010–2018) and regional unit (Piraeus and surrounding islands were considered together).
DistrictPopulation
Density (Inhabitants/km2)
Crude Rate of Natural Change of PopulationCrude Rate of Net MigrationCrude Rate of Total Population Change
2000–20092010–20182000–20092010–20182000–20092010–2018
Central Athens10,436−1.0−3.4−7.7−15.8−8.7−19.2
Northern Athens43202.80.64.1−8.46.9−7.8
Western Athens71142.9−0.30.4−6.03.3−6.3
Southern Athens74981.2−1.01.8−5.73.0−6.7
Eastern Attica3754.32.526.78.931.111.4
Western Attica1805.33.68.24.913.58.6
Piraeus and islands3332−0.7−2.90.4−8.6−0.3−11.6
Study area9901.3−0.82.1−6.73.3−7.5
Greece820.3−1.82.9−2.23.2−4.0