Glacial Rock Flour as Soil Amendment in Subarctic Farming in South Greenland


1
Department of Geosciences and Natural Resource Management, Center for Permafrost (CENPERM), University of Copenhagen, Øster Voldgade 10, 1350 Copenhagen K, Denmark
2
Geological Survey of Denmark and Greenland, 1350 Copenhagen K, Denmark
*
Author to whom correspondence should be addressed.
Land 2020, 9(6), 198; https://doi.org/10.3390/land9060198
Submission received: 14 April 2020
/
Revised: 3 June 2020
/
Accepted: 12 June 2020
/
Published: 15 June 2020
(This article belongs to the Section Soil-Sediment-Water Systems)
Abstract
:Agriculture in subarctic regions is limited by a short and cold growing season. With warming in the region, the number of growing days and, consequently, the potential for agricultural intensification and expansion may increase. However, subarctic soils are typically acidic, low in plant-available nutrients, and coarsely textured, so they require soil amendment prior to intensification. This is the case in South Greenland, where we tested the use of glacial rock flour (GRF) produced by glaciers as a soil amendment. An experiment was made on a farm in South Greenland during the 2019 summer to quantify the short-term effect of applying GRF to a field dominated by perennial timothy grass. Three treatments were compared to control sites (n = 5): 20 t GRF ha−1 without conventional NPK-fertilizer, as well as 20 and 40 t GRF ha−1 in combination with 25% NPK-fertilizer. The experiment showed no significant response in biomass production (aboveground and belowground) for the plots treated with GRF only. The low rate of GRF combined with 25% NKP showed a marked and significant increase in yield in contrast to a high GRF rate with NPK, which resulted in a significant reduction in yields. The chemical composition of the plants versus soil and GRF showed that the plant uptake of nutrients was significantly higher for NPK-fertilized plots, as expected, but no differences were found between GRF-treated plots and the control plots with respect to nutrient availability or pH in the soil. We conclude that adding water and fertilizer has the potential to increase yields in South Greenland, but applying glacial rock flour as a short-term agricultural supplement needs to be further investigated before it can be recommended.

1. Introduction
The intensification of agricultural soils requires a continuous replenishment of supplements that can be conventional nitrogen, phosphorus and potassium (NPK)-fertilizers, organic (manure, compost, etc.) and inorganic (limestone, ground silicate rocks, etc.). Hamaker & Weaver [1] were among the first to propose to apply crushed rocks to agricultural soils to avoid malnutrition due to the degrading soils and diminishing nutrient contents of crops. Several studies have since quantified the effects of using rock powder, especially in the highly weathered soils of the tropics, by using by-products of mining and quarry work [2,3,4,5,6] to sustain agricultural development. In theory, rock powder has several advantages over conventional agricultural supplements, e.g., the capacity to neutralize soil acidity and a continuous supply of both macro- and micronutrients such as K, Ca, Mg, Mn, and Fe, as well as an assortment of trace minerals and increase soil water retention in coarsely textured soils [7,8,9]. However, the positive effects of rock powder are highly dependent on the soil to which they are applied, the climate (influencing weathering and thus nutrient release), and the mineralogical composition of the rock powder [10,11]. Consequently, contrasting findings have been reported. Several studies have observed a substantial supply of K, Ca, and Mg to plants from rock powder, while some have also exhibited a liming effect [12,13,14,15,16]. Most studies, however, have only shown negligible effects from experiments with rock powder or even negative effects on yields [17,18,19]. Not surprisingly, glacial rock flour (GRF) cannot replace the need for applying regular NPK fertilizers and lime to keep agricultural yields high [15,20,21,22]. One form of rock powder that has not received much attention is so-called glacial rock flour produced by glaciers eroding the underlying bedrock as they move over terrain. The rock flour is transported by subglacial and proglacial meltwater underneath the glaciers and deposited in thick successions in lakes and fjords [23]. This study aimed to quantify the use of GRF as a way of sustainably amending the agricultural soils in South Greenland since it can be locally sourced and is found in abundance in many parts of Greenland. South Greenland is known to be an important area for sheep grazing with potential for both intensification and expansion [24] controlled by vegetation response to recent warming today [25] and towards the end of the 21st century. However, it has also recently been shown that such improvements for agriculture rely on both water and plant-available nutrients, which appear to be limited in many cases in South Greenland [26]. The underlying hypothesis of this work is that the addition of GRF may improve soil texture, neutralize soil acidity, and release a range of macro- and micronutrients, thereby raising yields from fields receiving GRF. However, careful soil type-specific investigations are needed to verify the short-term measures of biomass and yields following GRF test plots before GRF can be recommended as a soil amendment in South Greenland.
2. Materials and Methods
2.1. Study Site
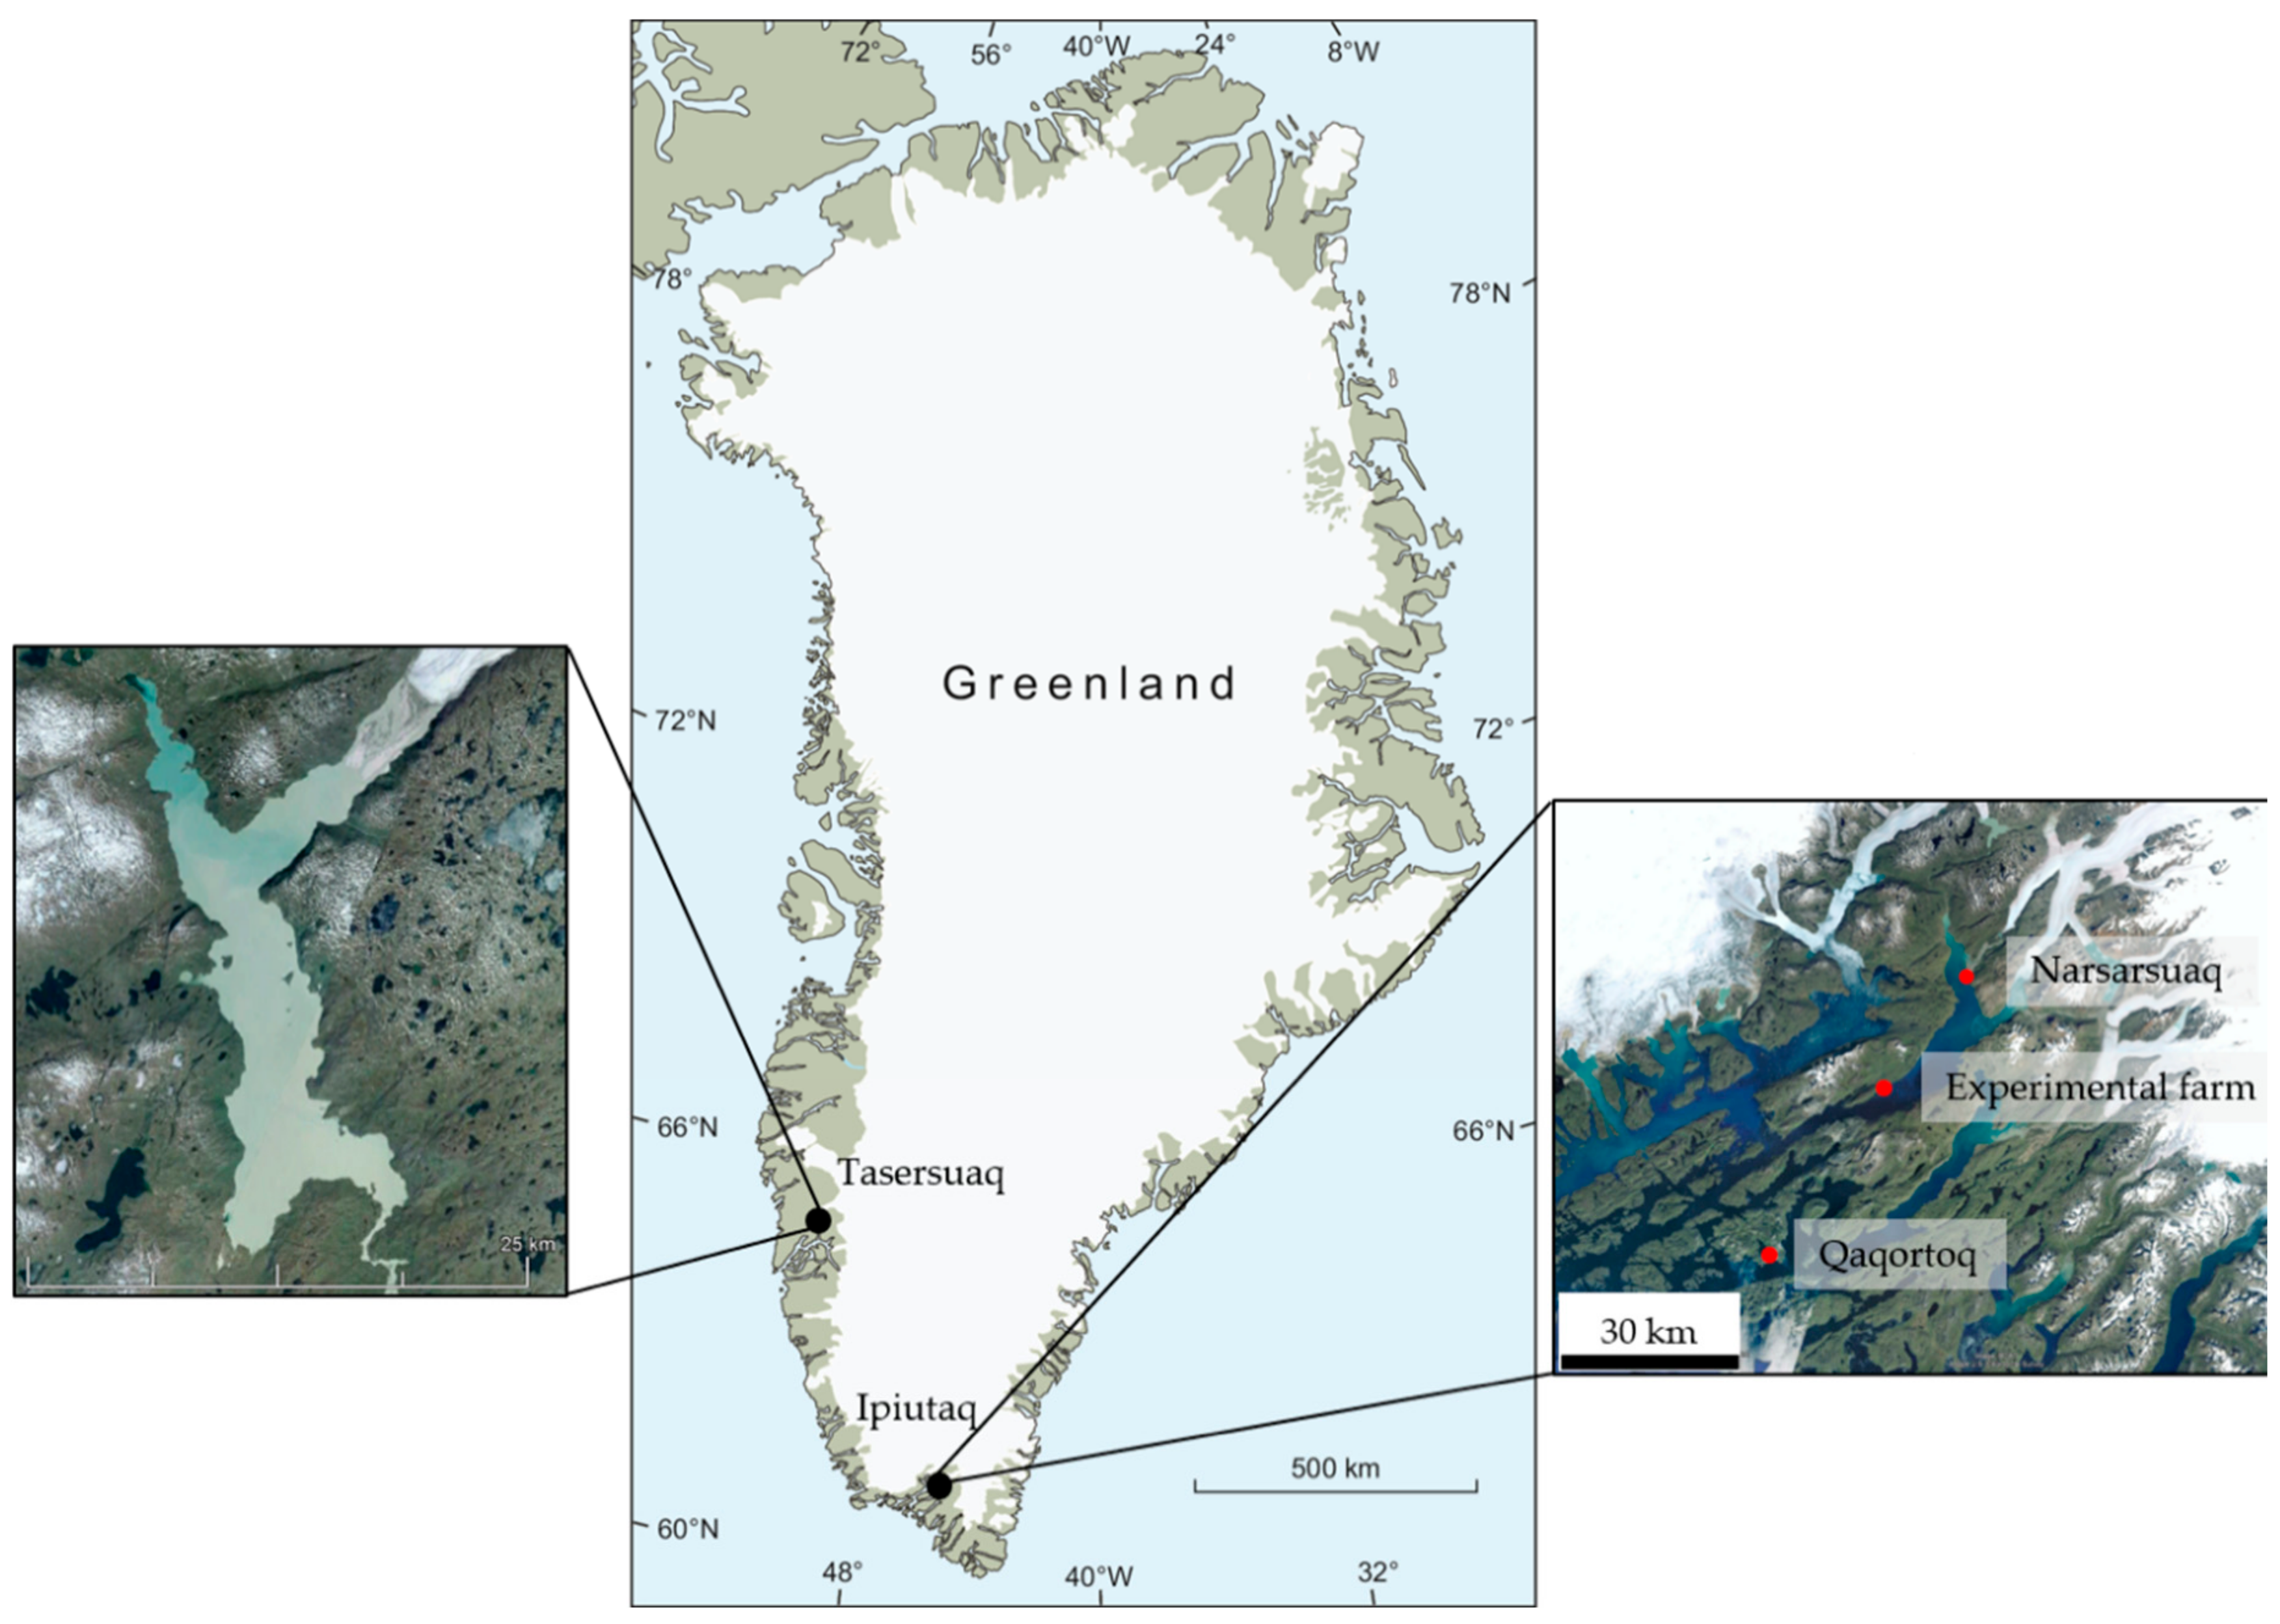
Two field campaigns were carried out in June and August 2019 with the objective to test the effect of applying GRF to an agricultural field in southern Greenland. The field work took place on a sheep farm in Ipiutaq (60.9°N, 45.7°W) halfway between Qaqortoq and Narsarsuaq (Figure 1). This farm was chosen as a representative farm in terms of farming intensity, the use of fertilizer, and accessibility to nearby towns.
The climatic regime of the study area is subarctic. Climate records from Narsarsuaq 25 km to the northeast of Ipiutaq show an average annual air temperature of 1.1 °C, an average air temperature of the warmest month of 10.8 °C (July), and an annual accumulated precipitation of 651 mm during the climatologically normal 1981–2010 [27]. Qaqortoq, lying approximately 60 km southwest of Narsarsuaq, close to the open ocean, has an average air temperature in July of 7.6 °C and a total annual precipitation of 985 mm [27]. The Greenland Ice Sheet occasionally gives rise to katabatic flows of air from the ice sheet towards the coast. This may lead to prolonged dry spells during the growing season [28] and a lowered primary production.
Soil classification maps suggest that soils in the study area are umbrisols and, in some places, podzols [29]. The actual farmland soil is considered an umbrisol.
The farm livestock comprises approximately 250 ewes and lambs foraging on natural vegetation in the surrounding area during the summer season. The sheep are gathered during September, and the majority of the lambs are sent to the slaughterhouse, while the ewes are kept in stables during winter and feed on locally produced hay supplemented by some imported coarse fodder. The hay for feeding is produced on the farm’s approximately 11 ha of land, with the crops being a combination of cereals (mainly oat) and a mixture of grasses (both perennial and annual). The farmland has a gently southward slope with fields from 0.02 to 1 ha. A common characteristic of the farmland is a large amount of rocks, from pebbles to boulders. Thus, ploughing is not possible everywhere, and tillage may be limited to harrowing.
The typical fertilizing scheme for perennial grass on the farm consists of applying regularly granulated NPK fertilizer in the early summer, aiming for 110 kg N ha−1, corresponding to approximately 650 kg NPK ha−1. Fertilizers of varying compositions are applied, the most common being 17:7:14, which was also the fertilizer used in the field experiment. The field used in the experiment has received typical treatments in the years prior to the start of the experiment. Liming has been applied every second year, with the last time being in 2018.
2.2. Experimental Design
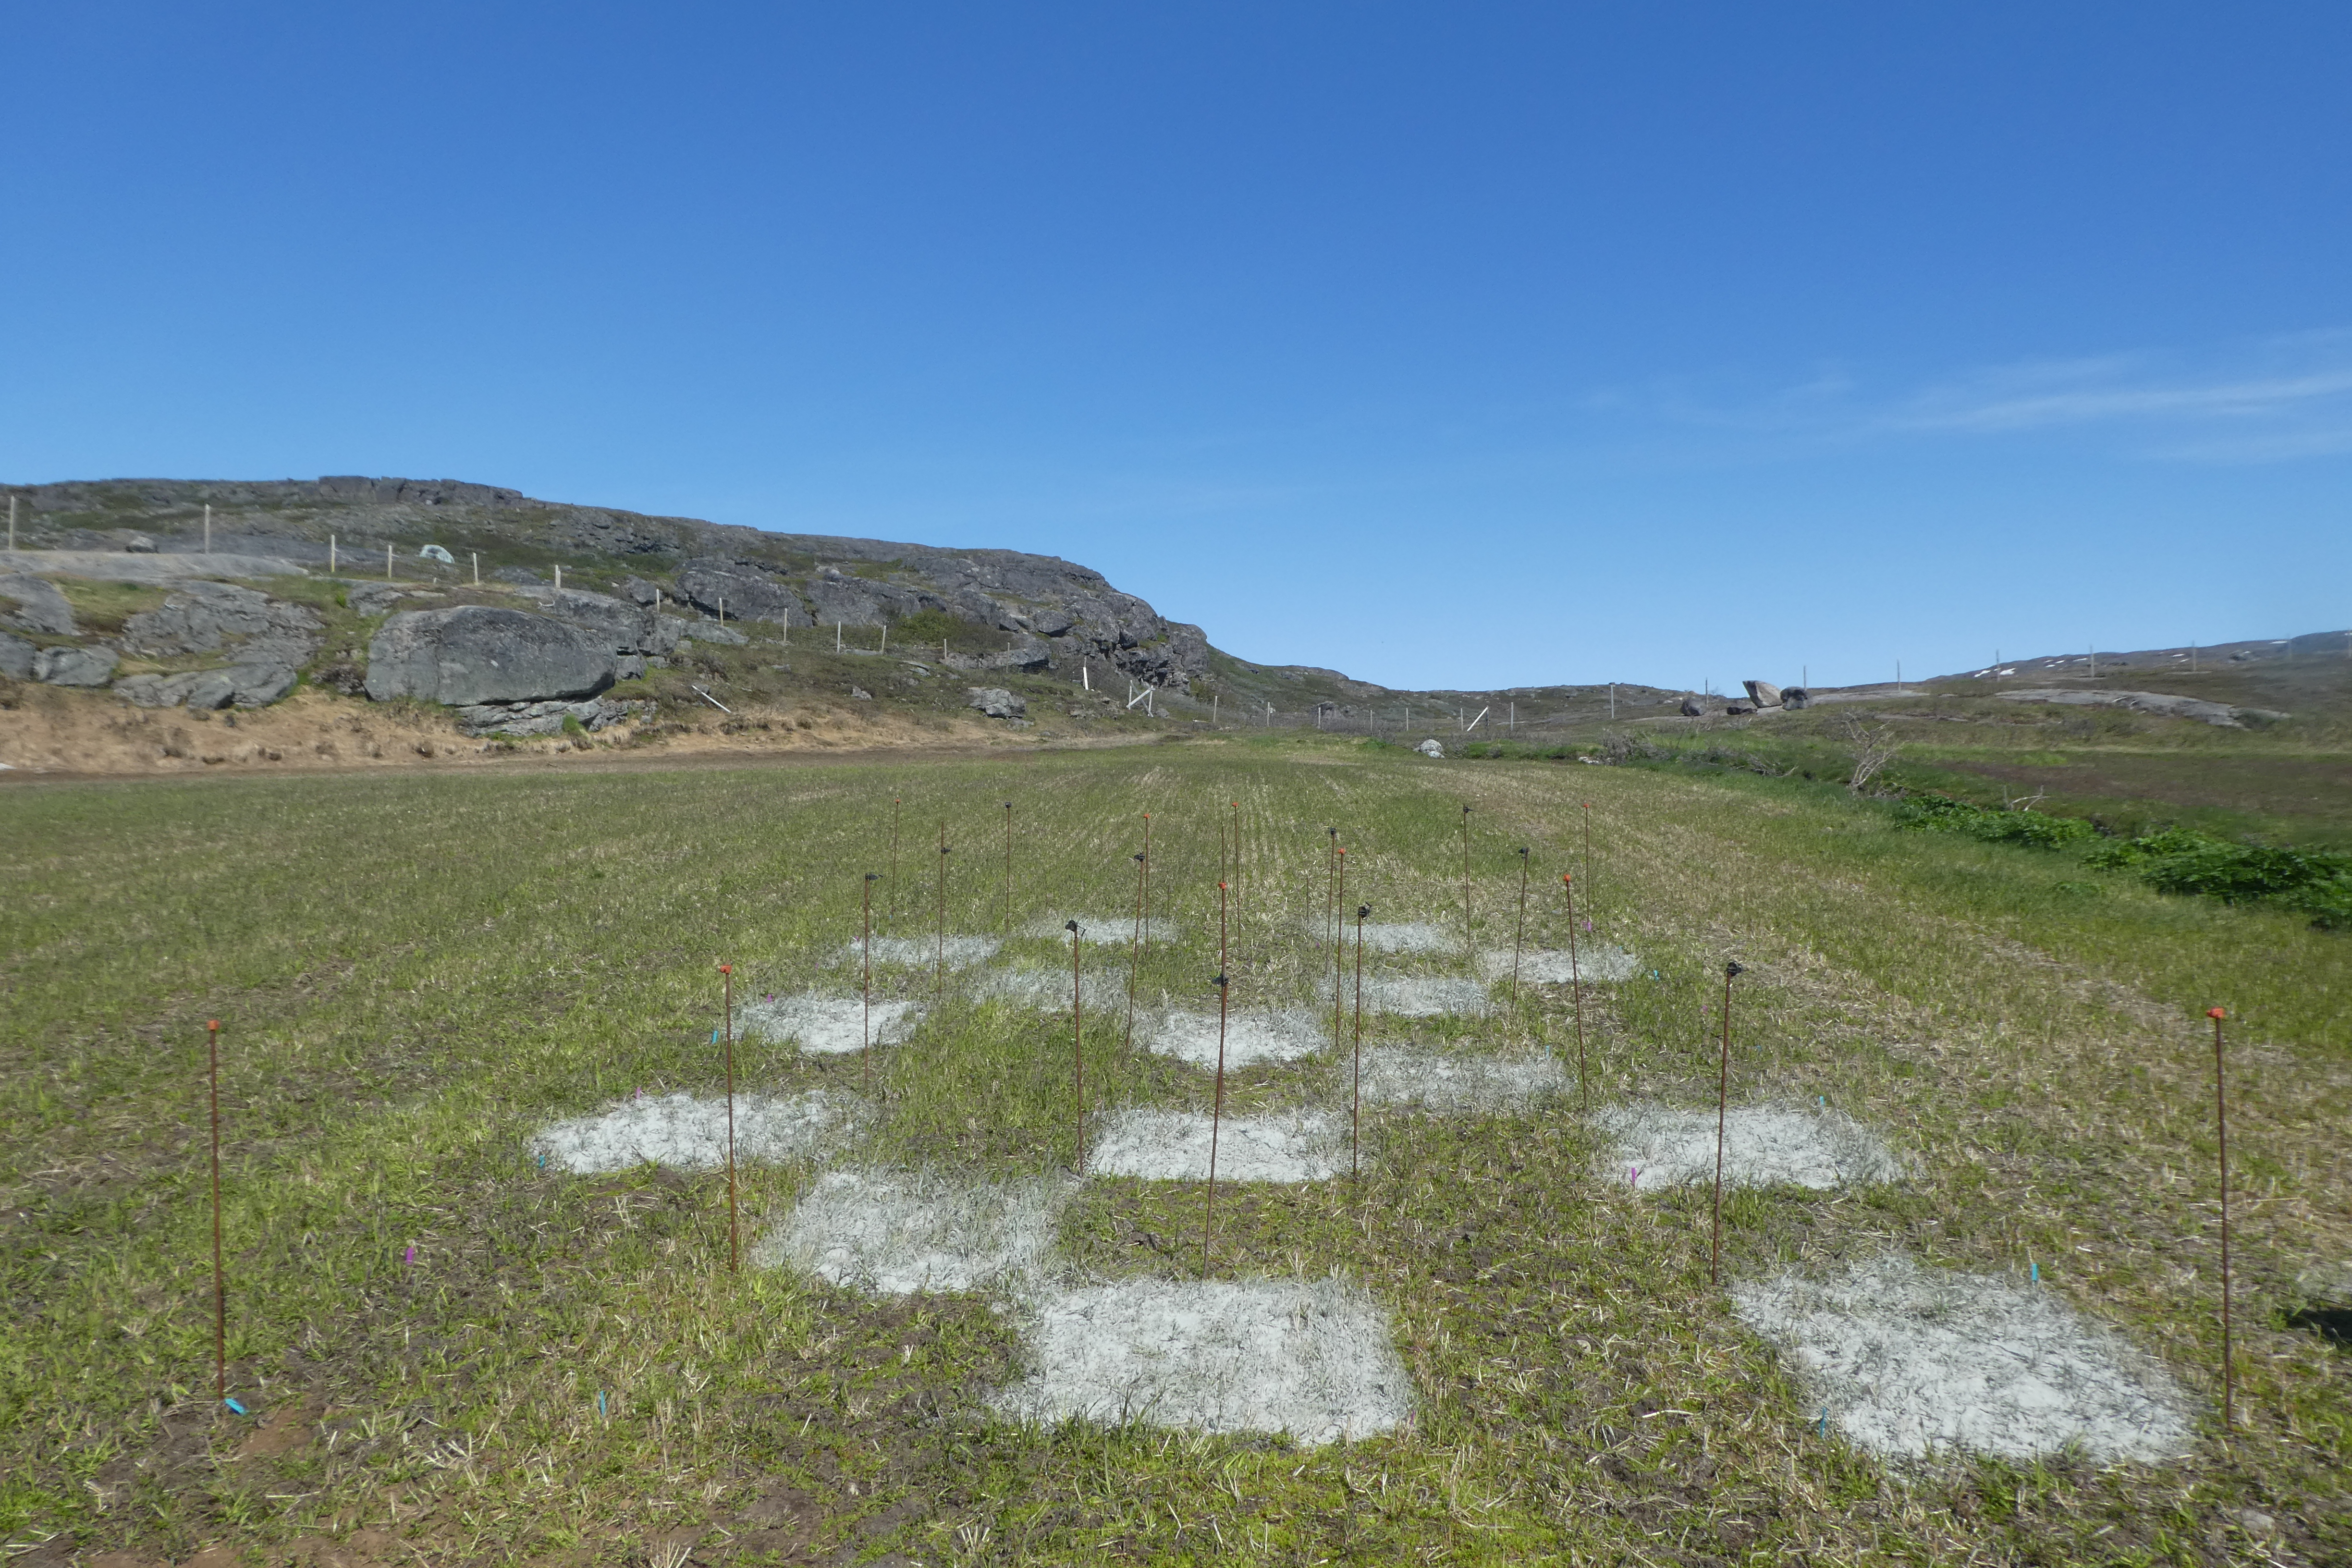
The field experiment was established on the northernmost field of the farm—a gently south sloping field sowed with a mixture of perennial grasses, mainly timothy grass (Phleum pratense) and red fescue (Festuca rubra) in the spring of 2018. Additional details are provided in Supporting Information. A rectangular area of 8 x 5 meters was divided into 40 one m2 plots. To minimize the rim effects between plots, the treated plots were arranged with only corners touching, and five replicates of four treatments were randomly distributed across twenty plots. The experiment consisted of a control (T1) and three treatments (T2–4) of different combinations of glacial rock flour and fertilizer additions in five replicates. Treatment 1 (T1) was a control treatment, without added supplements; in treatment 2 (T2), a high amount of GRF (40 t ha−1) was added. In treatment 3 (T3), 25% NPK fertilizer plus 20 t GRF per hectare were added. In treatment 4 (T4), 40 t GRF were added per hectare, plus an addition of 25% NPK fertilizer. The 25% NPK application was calculated based on the standard application rate of 650 kg NKP ha−1, thus amounting to 162.5 kg ha−1. A reduced amount of fertilizer was applied to test the effect of rock flour application as an abundant fertilization expected to overrule any effect of glacial rock flour addition.
The plots were treated on 4 June, a day with weak wind (in average 2.2 m s−1 from SW), minimizing the loss of fine-grained particles. The glacial rock flour and fertilizer were spread by hand a few cm above the surface to ensure an even distribution. To promote the dissipation and percolation of the applied GRF particles and fertilizer, a sprinkler irrigation system and a rain gauge were established on the field after the GRF and fertilizers were distributed evenly in the plots. After three hours of irrigation, the plots had received roughly 10 mm of irrigation.
2.3. Rock Flour Sampling and Treatment
The GRF applied in the experiment came from a glaciolacustrine deposit in Lake Tasersuaq (65.1°N, 50.8°W) located approximately 100 km northeast of Nuuk (Figure 1). Because the sediment was deposited in freshwater, it was assumed to be free of any marine input. The sediment source was a 25 km long outlet glacier (Saqqap Sermersua) that terminates near the NE corner of the lake. The melting of the glacier supplies both meltwater and sediments, resulting in the lake water being highly turbid. The bedrock in the area consists mainly of Archaean granite and gneiss that is primarily composed of quartz, plagioclase, and hornblende, with varying contents of accessory minerals such as biotite and K-feldspars [30] The sediment was sampled during field work in August 2018. We used a vibrocorer (VibeCore-D, developed by SDI Specialty Devices) to retrieve seven sediment cores ranging in length from 0.5 to 2 m with a diameter of 7.6 cm. All sediment sampling was conducted from a coring platform equipped with a 4 m-high tripod with a winch.
The cores were shipped to Copenhagen, where they were split, and the material was oven-dried at 105 °C for 24 hours, yielding a total dry weight of 61 kg. The material was coarsely broken down, after which small portions were crushed using a mortar and sieved through a 2 mm sieve. Five subsamples were analyzed for particle size, exchangeable nutrients, and soil pH. Homogenizing was done by mixing the GRF on a large plastic tarp and continuously halving the pile until 30 stacks of 2 kg each was attained.
2.4. Biomass Sampling
Aboveground biomass (AGB) was determined by cutting all biomass in each plot within 70 x 70 cm, as previously described [31,32], and placed in open paper bags to dry for a week. In the laboratory, biomass samples were clipped, weighed, and oven-dried for 24 hours at 60 °C. Approximately 10 g from each sample comprising all plant parts, i.e., stems, leaves, and flowers, were milled for 45 minutes using zirconium oxide grinding balls. Plant samples were not washed prior to being analyzed for elemental composition.
Belowground biomass (BGB) samples were collected in each plot after the plot was harvested. Sampling was done by vertically inserting a cylindrical sample ring (v = 86 cm3) into the soil, retrieving samples of 0–4 and 4–8 cm intervals. Root matter was separated from the soil by wet sieving under running tap water on a 1 mm sieve, as previously described [33,34]. The separated root matter was then dried at 60 °C for 24 hours, and the dry weight biomass was recorded. The dried roots were pulverized in an agate ball mill to enable the analysis of total C and N contents in the sample.
2.5. Soil Sampling
Soil sampling was performed similarly to the BGB sampling. Samples were kept cool and stored in closed plastic bags until they were dried at 60 °C for 24 hours. A small subsample of approximately 2 g from all the soil samples was milled using an agate ball before analyzed for total C and N contents, and the remainder of each sample was then dry-sieved on a 2 mm sieve to obtain material for chemical analysis. A soil pit was dug in the experimental field, and soil samples were retrieved in order to evaluate the soil characteristics of the entire soil profile down to 40 cm. Samples were taken by horizontally inserting a cylindrical sample ring into the soil profile at four depths: 3, 11, 19, and 32 cm below the surface. See the supplementary file (Figures S1–S8, and Tables S1–S4) for additional information.
2.6. Laboratory Procedure
The analysis of particle size and specific surface area (SSA) was done by laser diffraction using a Malvern Mastersizer™ 2000. Approximately 0.5 g of rock flour or soil was suspended in two parts of distilled water to one part sodium pyrophosphate (Na4P2O7), followed by two minutes of ultrasounding. Each measurement was repeated five times for each sample, so the resulting particle size distribution was an average of five measurements. The estimate of particle surface area by laser diffraction was underestimated as compared to BET (Brunauer, Emmett and Teller) gas adsorption surface area. Hence, the measured values were converted using a linear relationship (R2 = 0.99) between laser diffraction SSA and BET-SSA [35].
Soil and GRF pH were determined by mixing ten grams of sediment or soil with 25 ml 0.01 M CaCl2 and shaking the extraction for 1 hour. After waiting for 15 minutes (allowing sediment to settle), pH was directly measured in the vial using a glass electrode, which had been calibrated beforehand.
The total contents of C and N in the samples were analyzed by the method of Dumas combustion, as described in [36]. For the analysis, 2–3 mg of highly homogenized plant material and approximately 20 mg of milled soil and GRF were weighed into tin cups and combusted at 1700 °C. The produced gasses were then measured in an elemental analyzer (Flash 2000, Thermo Scientific). An isotope mass spectrometer (Thermo Delta V, Thermo Scientific) simultaneously measured the ratio of 15N/14N and 13C/12C, respectively. Prior to sample analysis, the elemental analyzer was calibrated with standards of known C and N composition (peach leaves for plant material and soil standards from Elemental Microanalysis, Okehampton, UK, for soil samples).
The estimation of the plant-available fraction of P (Pavail) in the soil and GRF was done by the Olsen-P method [37,38]. One hundred milliliters of NaHCO3 (pH 8.5) were added to 5.0 g of soil or GRF and shaken for exactly 30 minutes, after which the solution was filtered through Whatman filter paper. Five milliliters of the obtained extract were mixed with 7.5 ml of an ascorbic acid phosphate reagent, and the solution was subjected to ultrasound to drive out CO2. The phosphate reagent reacted with the phosphorus in the extract, producing a blue hue, the intensity of which correlated with the P-content in the extract. A small amount of the extract was transferred to a cuvette, and the concentration of P was spectrophotometrically measured as the intensity of light absorption at a wavelength of 890 nm.
The pulverized biomass samples were digested in an Anton Paar Multiwave GO microwave system using concentrated HNO3 as a digestion agent. The samples were subjected to 45 minutes of microwave heating to completely dissolve the plant material, and the concentration of 11 elements was measured on an ICP-MS (inductively coupled plasma-mass spectrometry) system along with two standards (maple and pine).
For the soil and GRF samples, the concentration of the following elements were measured, i.e., Mg, K, Ca, and Na, and since the content of these ions in the colloidal fraction was desired, the samples were not milled prior to the analysis; 5.0 g of the sample was mixed with 20 ml of 1.0 M ammonium acetate (C2H7NO2), and the solution was placed on a shaking table for two hours. Then, the mixture was filtered through Whatman paper filters while continuously adding ammonium acetate until 200 ml of extraction were attained. The extractions were stored in a refrigerator for one week before base cations were measured by the technique of inductively coupled plasma optical emission spectrometry (ICP-EOS).
2.7. Statistical Analysis
All data were found to comply with the assumption of normality [39], and an ANOVA followed by a Tukey–Kramer post-hoc test were subsequently applied to test for significant differences between treatments using the Microsoft Excel add-in Analysis ToolPak. Descriptive statistical measures for the particle size distributions were calculated by the Microsoft Excel-based program GRADISTAT [40].
3. Results
3.1. Site Characteristics
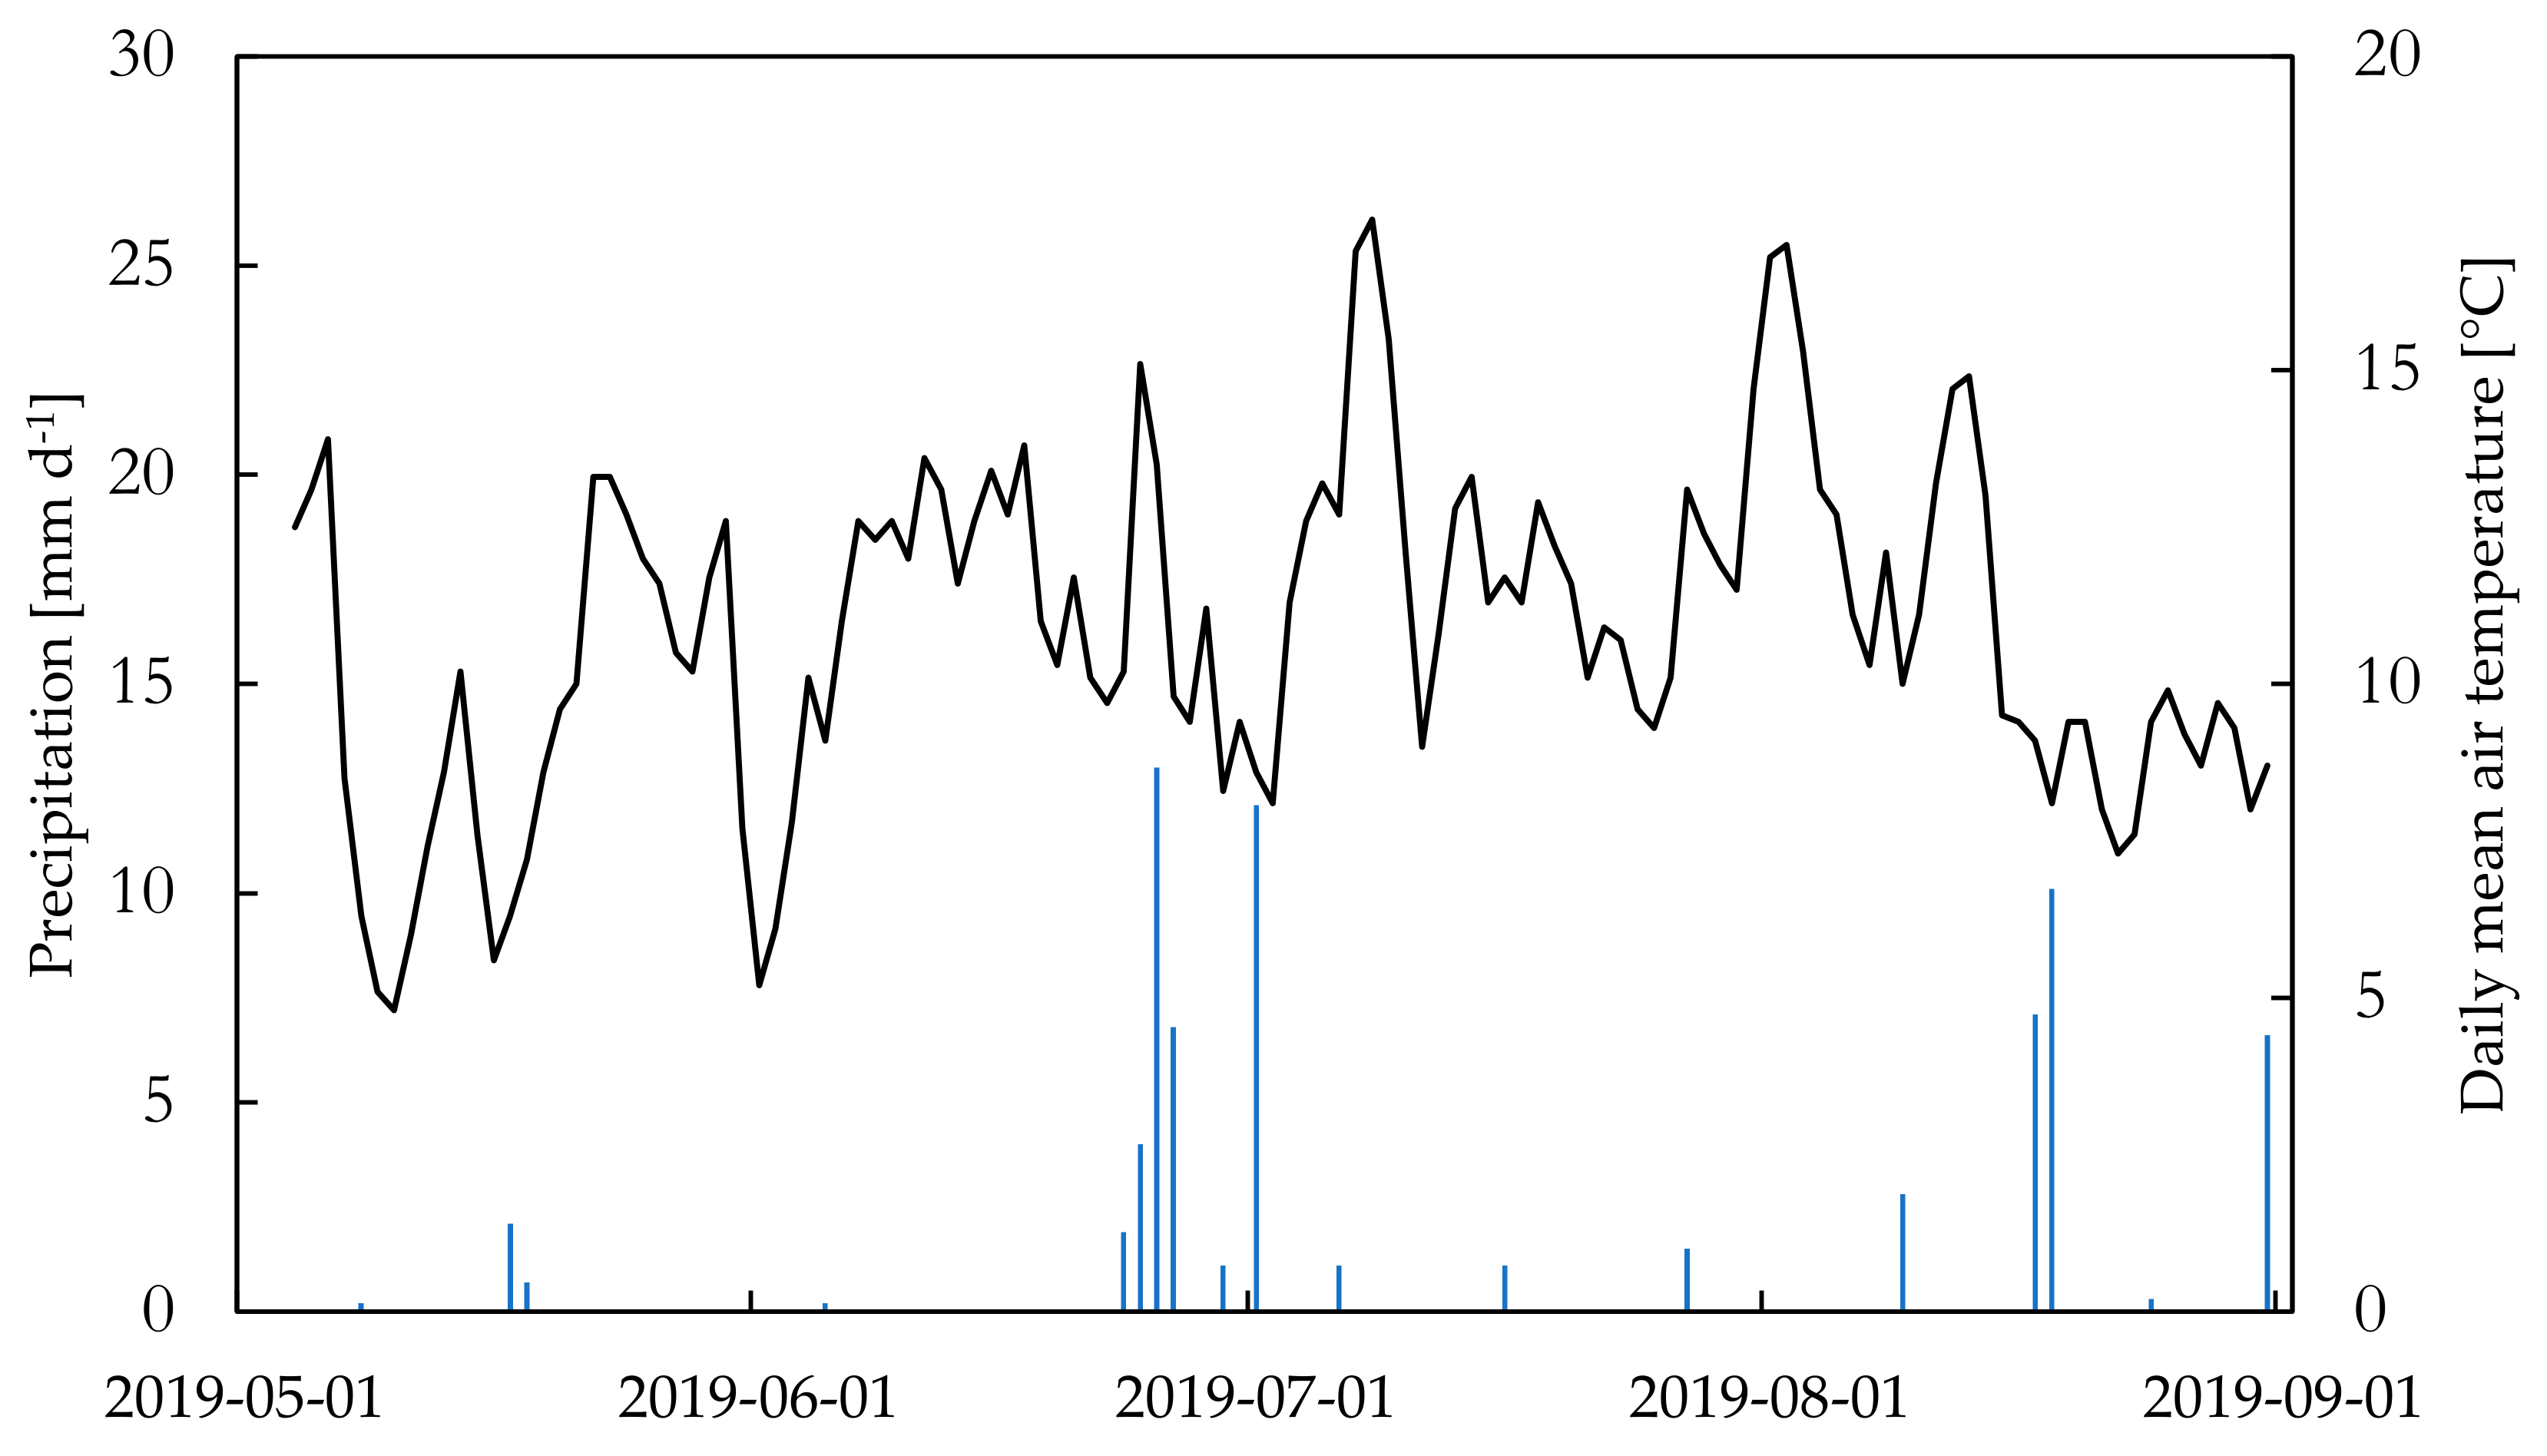
Some of the primary controlling factors for agricultural productivity and the possibilities for increasing production are the general climate and the year-to-year variations in, mainly, temperature, precipitation, and evapotranspiration, i.e., the net water balance. In the present study site, the growing season is between 1 May and 31 August. The temperature and precipitation data for the growing season at Narsarsuaq, approximately 25 km in-fjord from Ipiutaq (Figure 2), showed an average air temperature of 10.8 °C and 73 mm of accumulated precipitation.
The growing degree days (GDD) is calculated as the sum of degrees above 5 °C per day and was 773 for the growing season of 2019, as compared to 418 as the average for 1981–2010. As timothy grass requires between 400 and 500 GDD to reach maturity, the growing season of 2019 cannot be considered ideal for growth of timothy grass [41]. A water balance for the growing season 2019 was constructed to establish the environmental conditions under which the experiment took place. During the growing season, the accumulated precipitation was 73 mm—plus 10 mm added as irrigation. As evapotranspiration (ET) data for southern Greenland are not available, numbers were based on literature [28], suggesting a daily ET of 1–3 mm, though with a high variability through the growing season, as katabatic foehn winds may increase ET up to 16 mm d−1. A conservative estimate of ET for the 120 days of the growing season in 2019 would be 210 mm, yielding a water balance of minus 137 mm. Given the general rise in air temperature since 1988 and the higher than average temperatures of the growing season 2019, this value may have been underestimated but still served the purpose of exemplifying the prevailing moisture conditions during the growing season. However, as water becomes a limiting factor, plant growth prediction by GDD becomes inadequate [42].
3.2. Background Soil Properties
Grain size distribution showed that the two upper layers (8–14 and 16–22 cm) were similar and consisted of 41% and 34% particles below 63 µm and a negligible content of particles above 2 mm (less than 1%). The bottom layer (below 30 cm and below the root zone) was coarse grained with 34% of the particles > 2 mm and 88% > 0.5 mm. Figure 3 shows the chemical and physical properties for the soil profile. Elevated concentrations of Mg, K, Ca, and Pavail were seen in the top layer, as well as further down in the soil profile. The high values in the top were due to the repeated application of fertilizers and lime. The bulk density in the top three layers varied between 0.75 g cm−3 in the top to 0.6 g cm−3 at 19 cm below the surface and reached 1.2 g cm−3 in the deepest layer. Soil pH was highest in the top layer at 5.3 due to regular liming, reaching the lowest value at 19 cm below the surface at 4.6, after which a small increase to 4.9 was observed in the bottom layer. As such, the soil was overall slightly acidic, even under the application of lime every two years. The content of C peaked at 10.1% in the sample at 19 cm below the surface, while the lowest percentage of C was found in the deepest sample with 1.5%. In the top, C content decreased from 7.2% to 4.3% at 11 cm below the surface. The C/N ratios showed small variation across the profile, ranging from 15.1 at 11 cm to 13.0 at 19 cm below the surface. The cation exchange capacity (CEC), which was calculated as the sum of Ca, Mg, K, and Na, was markedly higher in the top layer than in the underlying layers due to the substantial amount of Ca, which greatly diminished with depth. The CEC in the soil was thus essentially dictated by the Ca concentration, as the other cations were only present in small concentrations.
Table 1 shows depth-integrated stocks of the measured range of elements in the soil profile. The stocks in each of the four layers were calculated based on the bulk density, the layer thickness, and elemental concentrations, yielding the stock of the top 40 cm of soil.
Mg, K and Pavail were present in bulks of almost equal amount of approximately 250 kg ha−1. The soil contained a stock of almost five tons of Ca per hectare and 55 kg of Na per hectare. N and C were present in copious amounts of 13 t N and 173 t C ha−1, respectively.
The soil profile was divided into four horizons according to the standard definitions [29]: The top 6 cm Ap horizon was lightly tilled but never plowed and coarser than the two underlying horizons due to the transport of finer grains by percolating water and erosion (by wind or water) at the surface. Concentrations of, especially, Ca and Pavail were elevated in the A horizon as compared to the underlying layers as a result of fertilization and liming. An underlying E horizon was distinctively lighter colored, slightly leached with a minimum of exchangeable Mg, K, and Ca, as well as lower amounts of Pavail and C. Further down in the profile, the boundary between the E and the B horizon exhibited a wavy pattern, and the boundary was more gradual than between the A and E horizons. The B horizon (~15 cm) exhibited a darker brown color than the above-lying layer, an indicator of its elevated C-levels. Furthermore, the B horizon showed elevated concentrations of Mg, K, and Pavail elements consistent with the E horizon above. The C horizon was distinct from the above-lying horizons and characterized by a coarser grain size and low C and nutrient levels.
3.3. GRF Characteristics
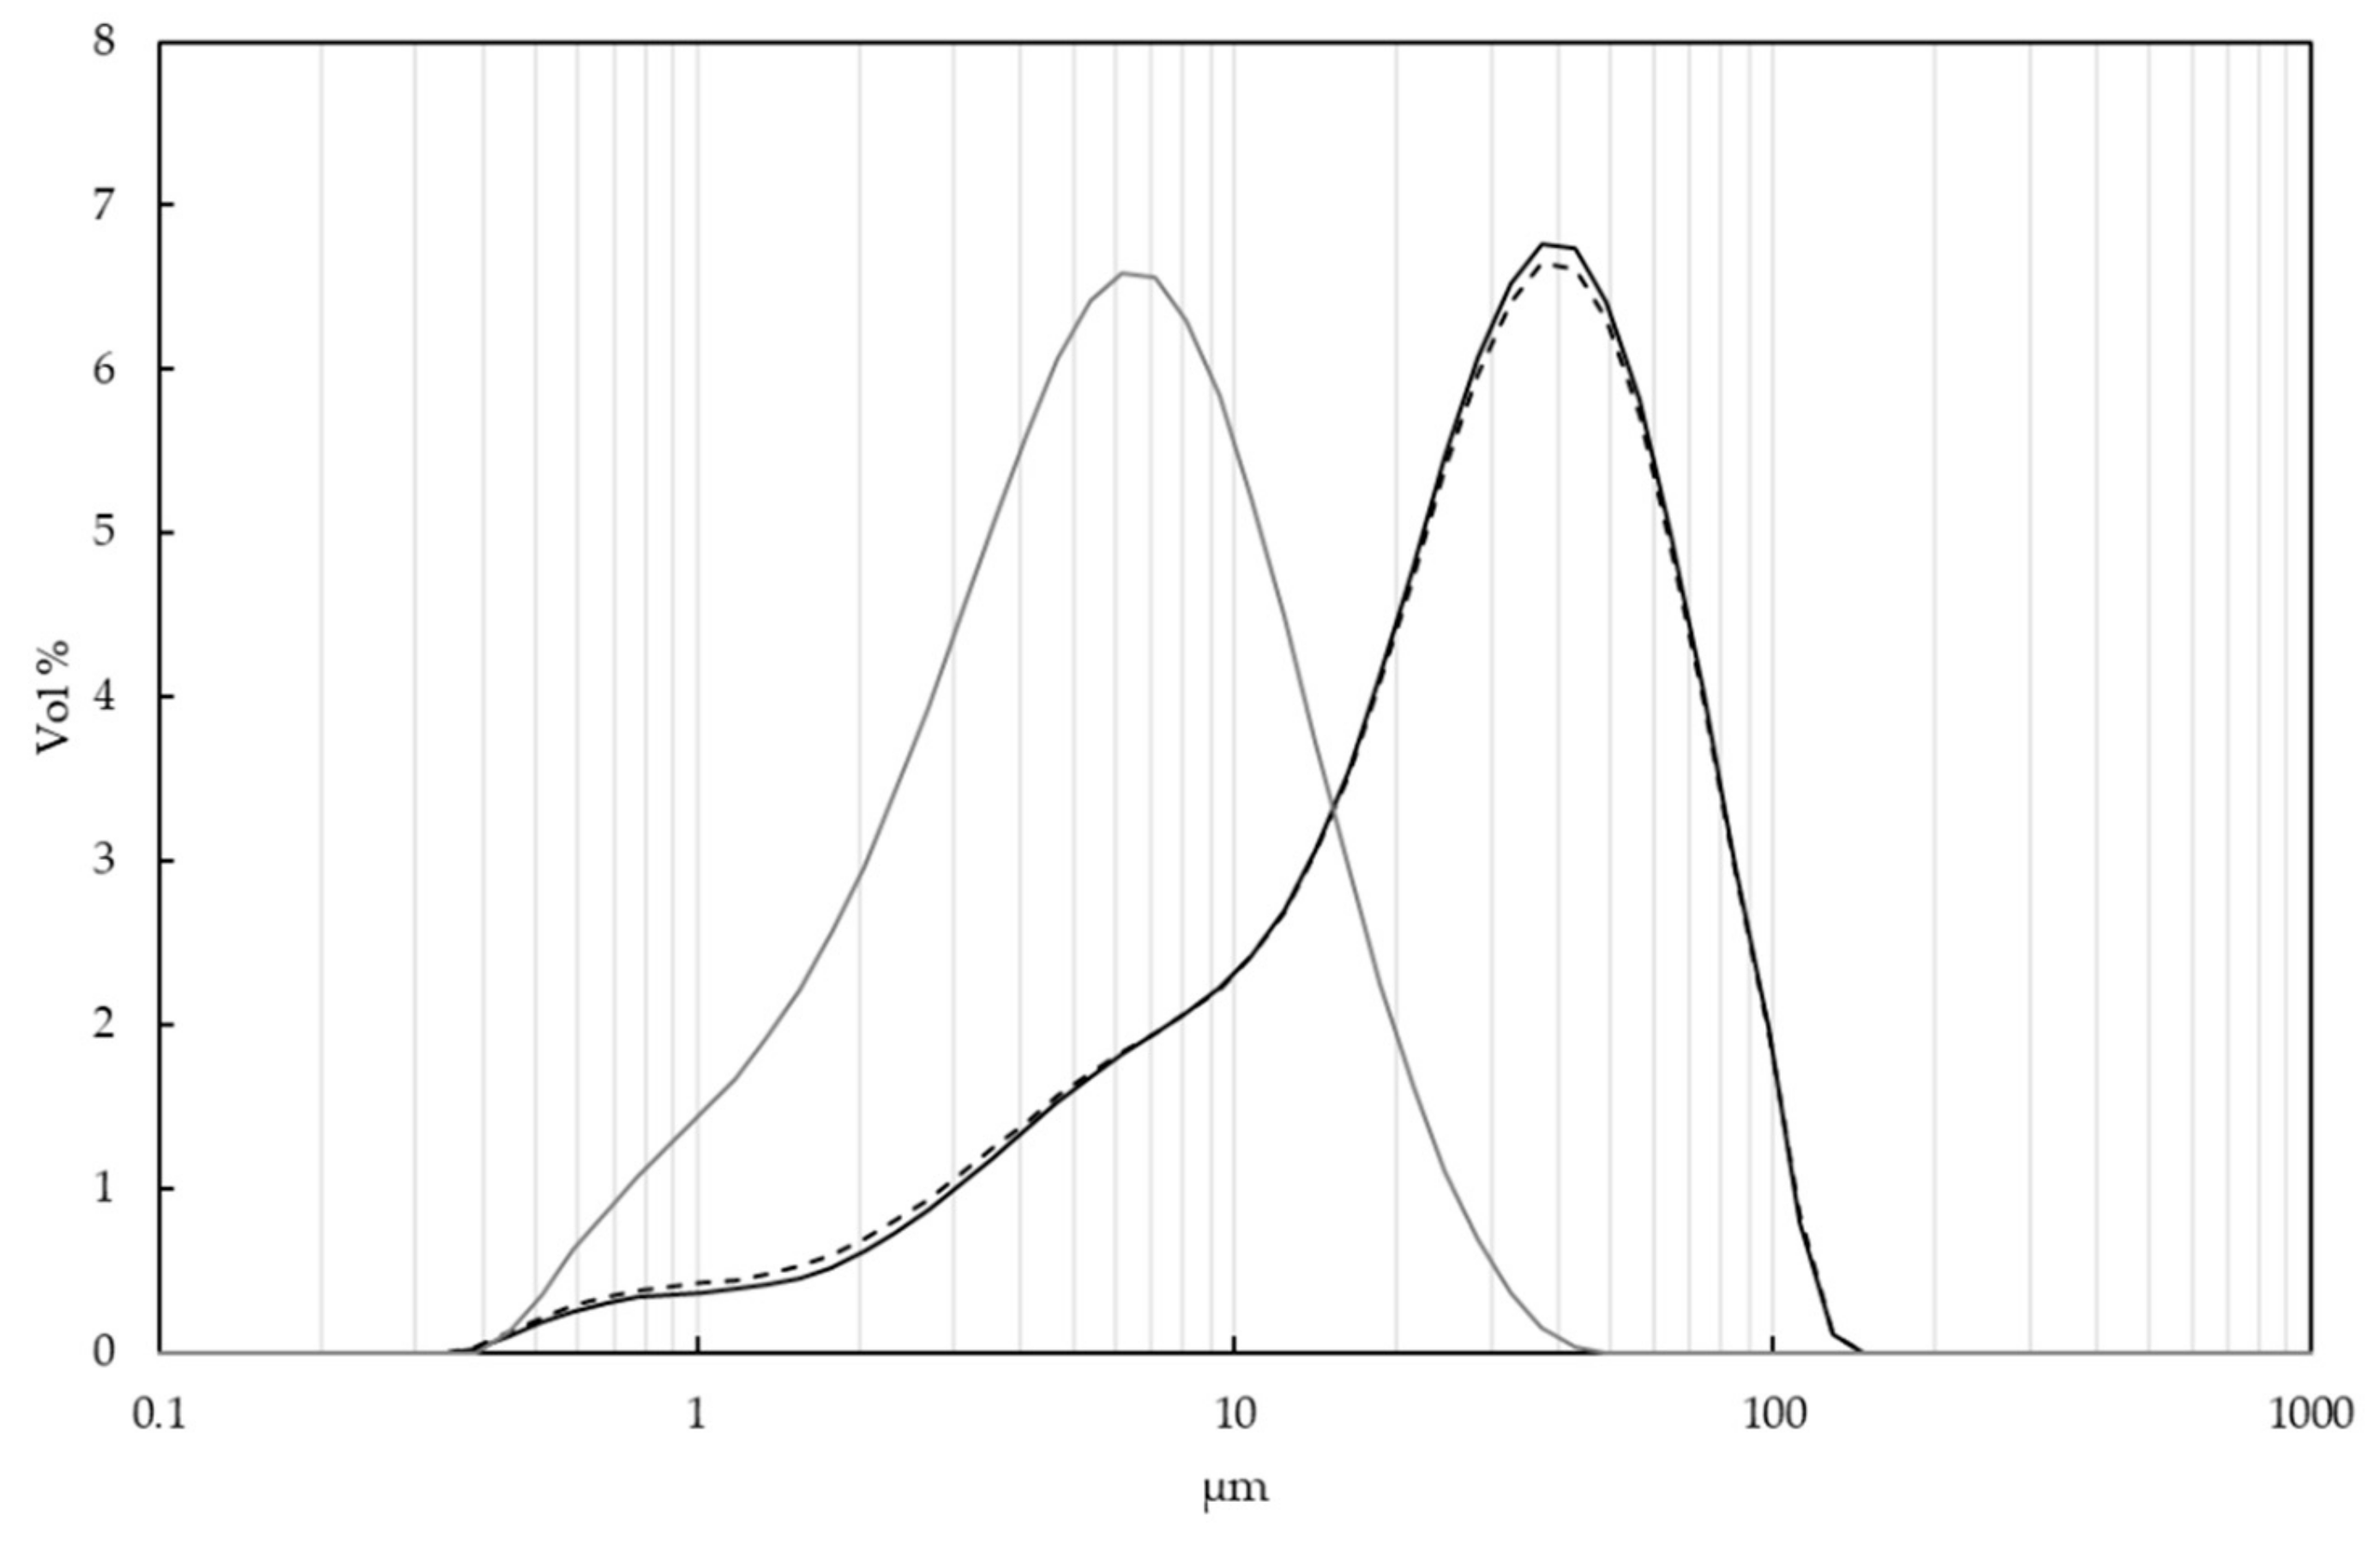
Laboratory analyses of the glacial rock flour GRF (Table 2) showed that it contains a range of exchangeable nutrients (except nitrogen), albeit mainly in small concentrations. The concentration of exchangeable Ca was relatively high (576 mg kg−1), while Pavail, K, Mg, and Na were present in low concentrations of between 22 and 82 mg kg−1. The material had a surface area of 11.1 m2 g−1, the median particle size (D50) was 5.5 µm, and soil pH (CaCl2) was nearly neutral at 6.9. A detailed particle size distribution of the material is presented in Figure S1. The particle size distribution was relatively narrow, with particles ranging in size from 0.4 to 43 µm (σ = 2.4 µm ± 0.02). Though approximately 15% of the particles (volume-wise) were below 2 µm and thus characterized as clay particles, it is unlikely that these particles consisted of clay minerals because the glacially abraded bedrock had not been subject to chemical and physical alterations involved in the formation of clay minerals [43].
3.4. The Influence of GRF on Soil Properties
The particle size distributions (PSDs) of the fine fraction (< 63 µm) of soil samples from T1 (control) and T2 (GRF only) showed a mean particle size of 35.1 ± 2.0 µm for T1 compared to 35.5 ± 1.5 µm for T2, a difference which was non-significant (p < 0.05) according to a t-test that assumed an equal variance. Distribution sorting (σ) and skewness were also tested and showed a similar response of non-significance. Only the deeper samples (4–8 cm) were considered since the abundance of GRF in the T2 top samples would obscure the measurements. In Figure 4, the PSDs of T1 and T2 are plotted together with the PSD of Tasersuaq GRF. The PSD of T2 was similar to that of T1, having the same overall shape, with a slight decrease in the peak for T2, as well as an increase in particles smaller than 5 µm of approximately one percentage-point. However, these differences were not significant.
The concentrations of the four main cations, Pavail, and C/N ratios for soil samples from T1 and T2 are shown in Figure 5. Mg concentrations in the top samples ranged from 181 ± 35 mg kg−1 in T1 to 165 ± 26 mg kg−1 for T2, diminishing with depth for both the treated and untreated samples, though differences were minor and non-significant. K showed the same tendency with higher concentrations in the topsoil and little variation between treatments (155 ± 29 and 150 ± 27 mg kg −1 for T1 and T2, respectively). Concentration diminished significantly in the deeper part of T1 as compared to the top, which was not the case for T2. Na showed a lower overall concentration of 25.8 ± 1.7 and 27.4 ± 3.8 mg kg−1 for T1 and T2, respectively, diminishing to 21.3 ± 1.4 and 21.7 ± 2.0 mg kg−1 further down. No significant difference between treatments was observed, but within treatments, a significant decline was seen. Ca concentrations vastly outweighed the other base cations ranging between 4882 ± 2150 and 4174 ± 1065 mg kg−1, showing little variation with depth and between treatments, though the deeper section of T2 showed large standard variations.
Plant-available P concentrations were higher (but non-significant) in both depths for T2 (224 ± 30 and 196 ± 33 mg kg−1) compared to T1 (192 ± 11 and 171 ± 18 mg kg−1). The C/N ratios showed little variation with depth and between treatments, ranging from 13.9 (T1 0–4) to 13.1 (T2 0–4), suggesting that the addition of GRF did not influence the soil carbon to nitrogen ratio.
Variations in soil pH (Table 3) were small and non-significant, with an average soil pH slightly higher in the untreated plots than the GRF-treated plots ay both depths. The content of carbon (Table 3) in the soil was likewise not affected by the application of GRF, being slightly higher in the top for the untreated plots and slightly higher further down for the GRF-treated plots, though with no significant difference. The CEC showed a similar pattern of elevated values in the top samples for T1 as compared to T2, while the lower samples showed a higher CEC for T2. Again, however, the differences were non-significant (Table 3).
Depth-integrated nutrient stocks for the top 10 cm of the soil in plots belonging to T1 and T2 showed marginally higher stocks of Mg, Ca, N, and C while the RF-treated plots of T2 exhibit slightly elevated levels of K, Na, and Pavail but no significant differences between the RF-treated and untreated plots.
3.5. Biomass Response to Treatments
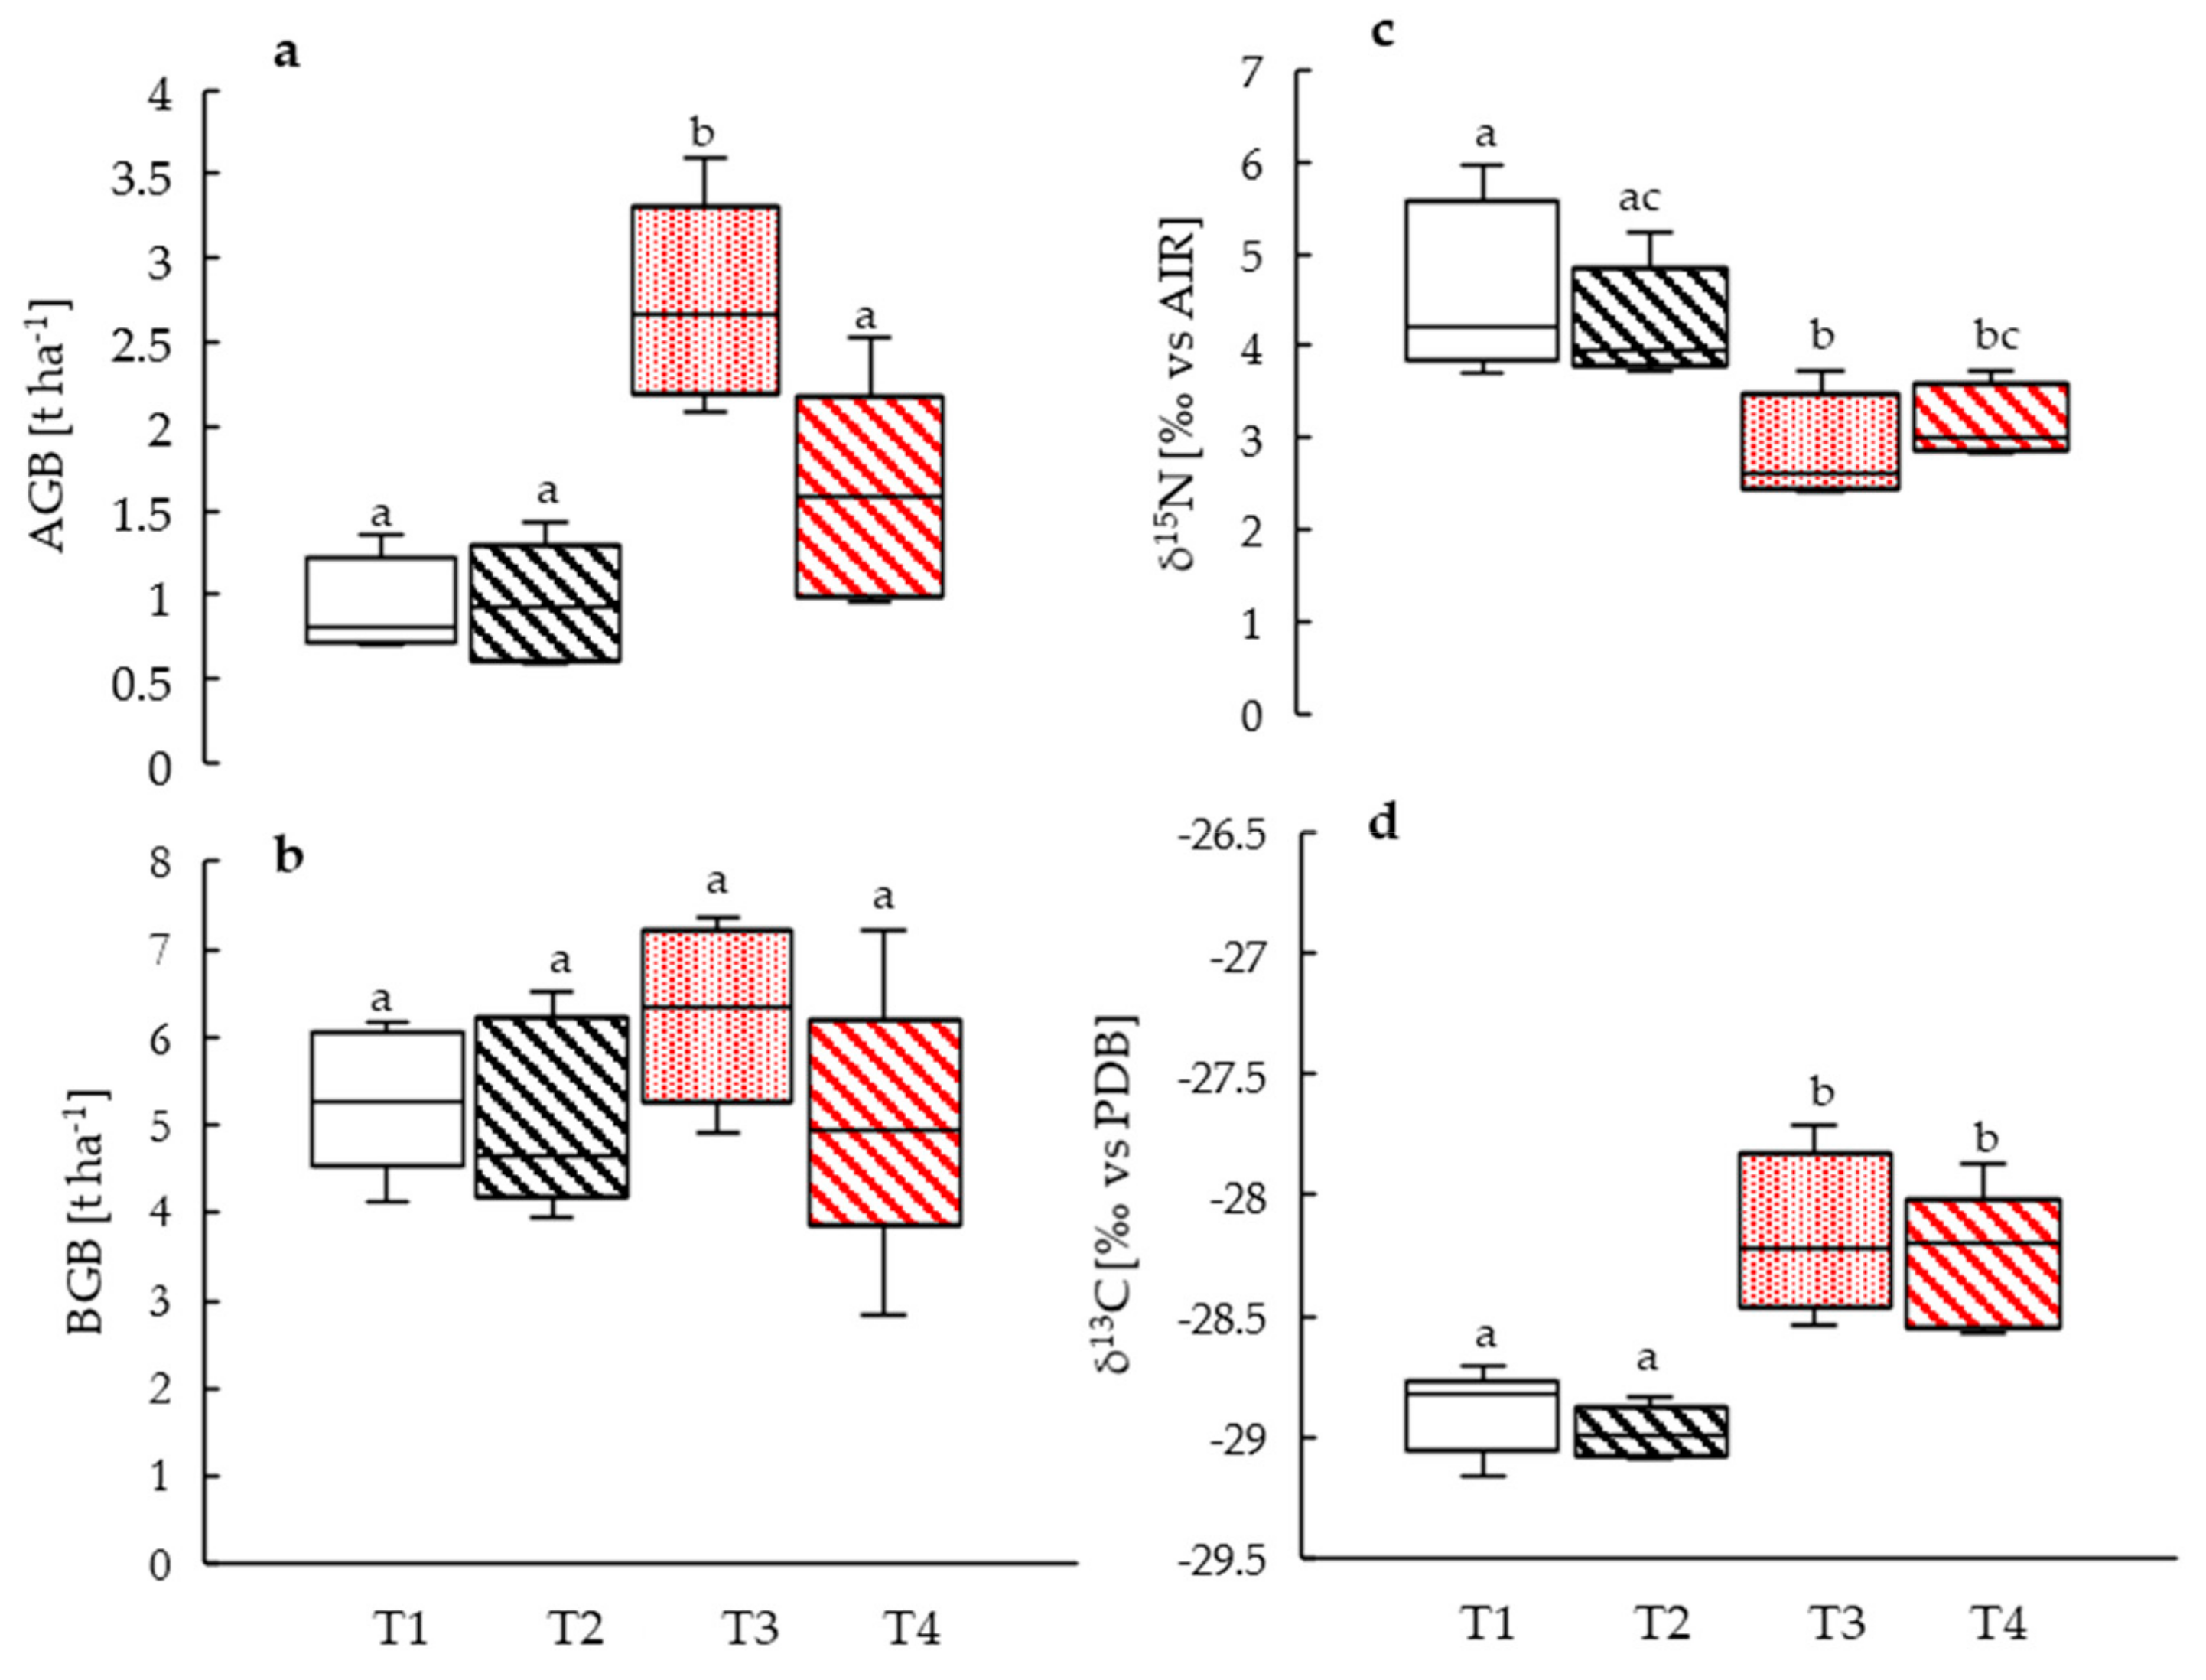
The dry-weight AGB and BGB (Figure 6a,b) were scaled to ton per hectare. Treatments 1 and 2 showed little variation between treatments, with an average AGB of 0.93 ± 0.28 and 0.95 ± 0.35 t ha−1, respectively. The GRF-treated plots of T2 showed a slightly higher average AGB but also higher within-treatment variation. A marked increase in AGB production was observed for T3. The average AGB of 2.73 ± 0.60 t ha−1 for T3 was significantly higher than the remaining three treatments. Site T4, having received the same amount of fertilizer as T3 but double the amount of GRF, revealed a significant decrease in the AGB of 42% as compared to T3, yielding 1.58 ± 0.64 t AGB ha−1.
No significant response of the BGB was observed from either GRF or any combination of GRF and fertilizer, partly due to the large within-treatment variance. T3 showed a slightly higher BGB with a mean of 6.3 ± 1.0 t ha−1, though the increase was insignificant. The lowest BGB was found at T4 with a mean of 5.0 ± 1.1 t ha−1. Comparing BGB to AGB showed that the root biomass, in general, outweighed the AGB by a factor of 2.5 to 6.
The average C content of the AGB showed small and non-significant variation between treatments, ranging between 44.8% ± 1.1% in T1 and 43.3% ± 2.6% in T3. AGB C/N ratio also exhibited non-significant differences between treatments. The C content of the BGB was markedly lower than in the AGB and also showed no significant responses to the treatments.
The δ15N values in the AGB reflected the proportion of 15N vs. 14N in the plant tissue (Figure 6c). As seen, T3 and T4 tended to have a lower 15N abundance than T1 and T2, though with only T3 being significantly different from both T1 and T2. The δ 13C values (Figure 6d) represented the ratio of 13C/12C in the AGB. As such, a more negative δ13C value indicated a higher content of the lighter 12C isotope [44]. A significant effect was observed between fertilized and non-fertilized plots in that the 13C abundance of T3 and T4 was higher (less negative δ13C values) than for T1 and T2, suggesting that the application of fertilizer impacted the photosynthetic efficiency [45]. No significant differences in BGB isotopic composition between treatments was observed (not shown).
3.6. Nutrient Composition of Aboveground Biomass
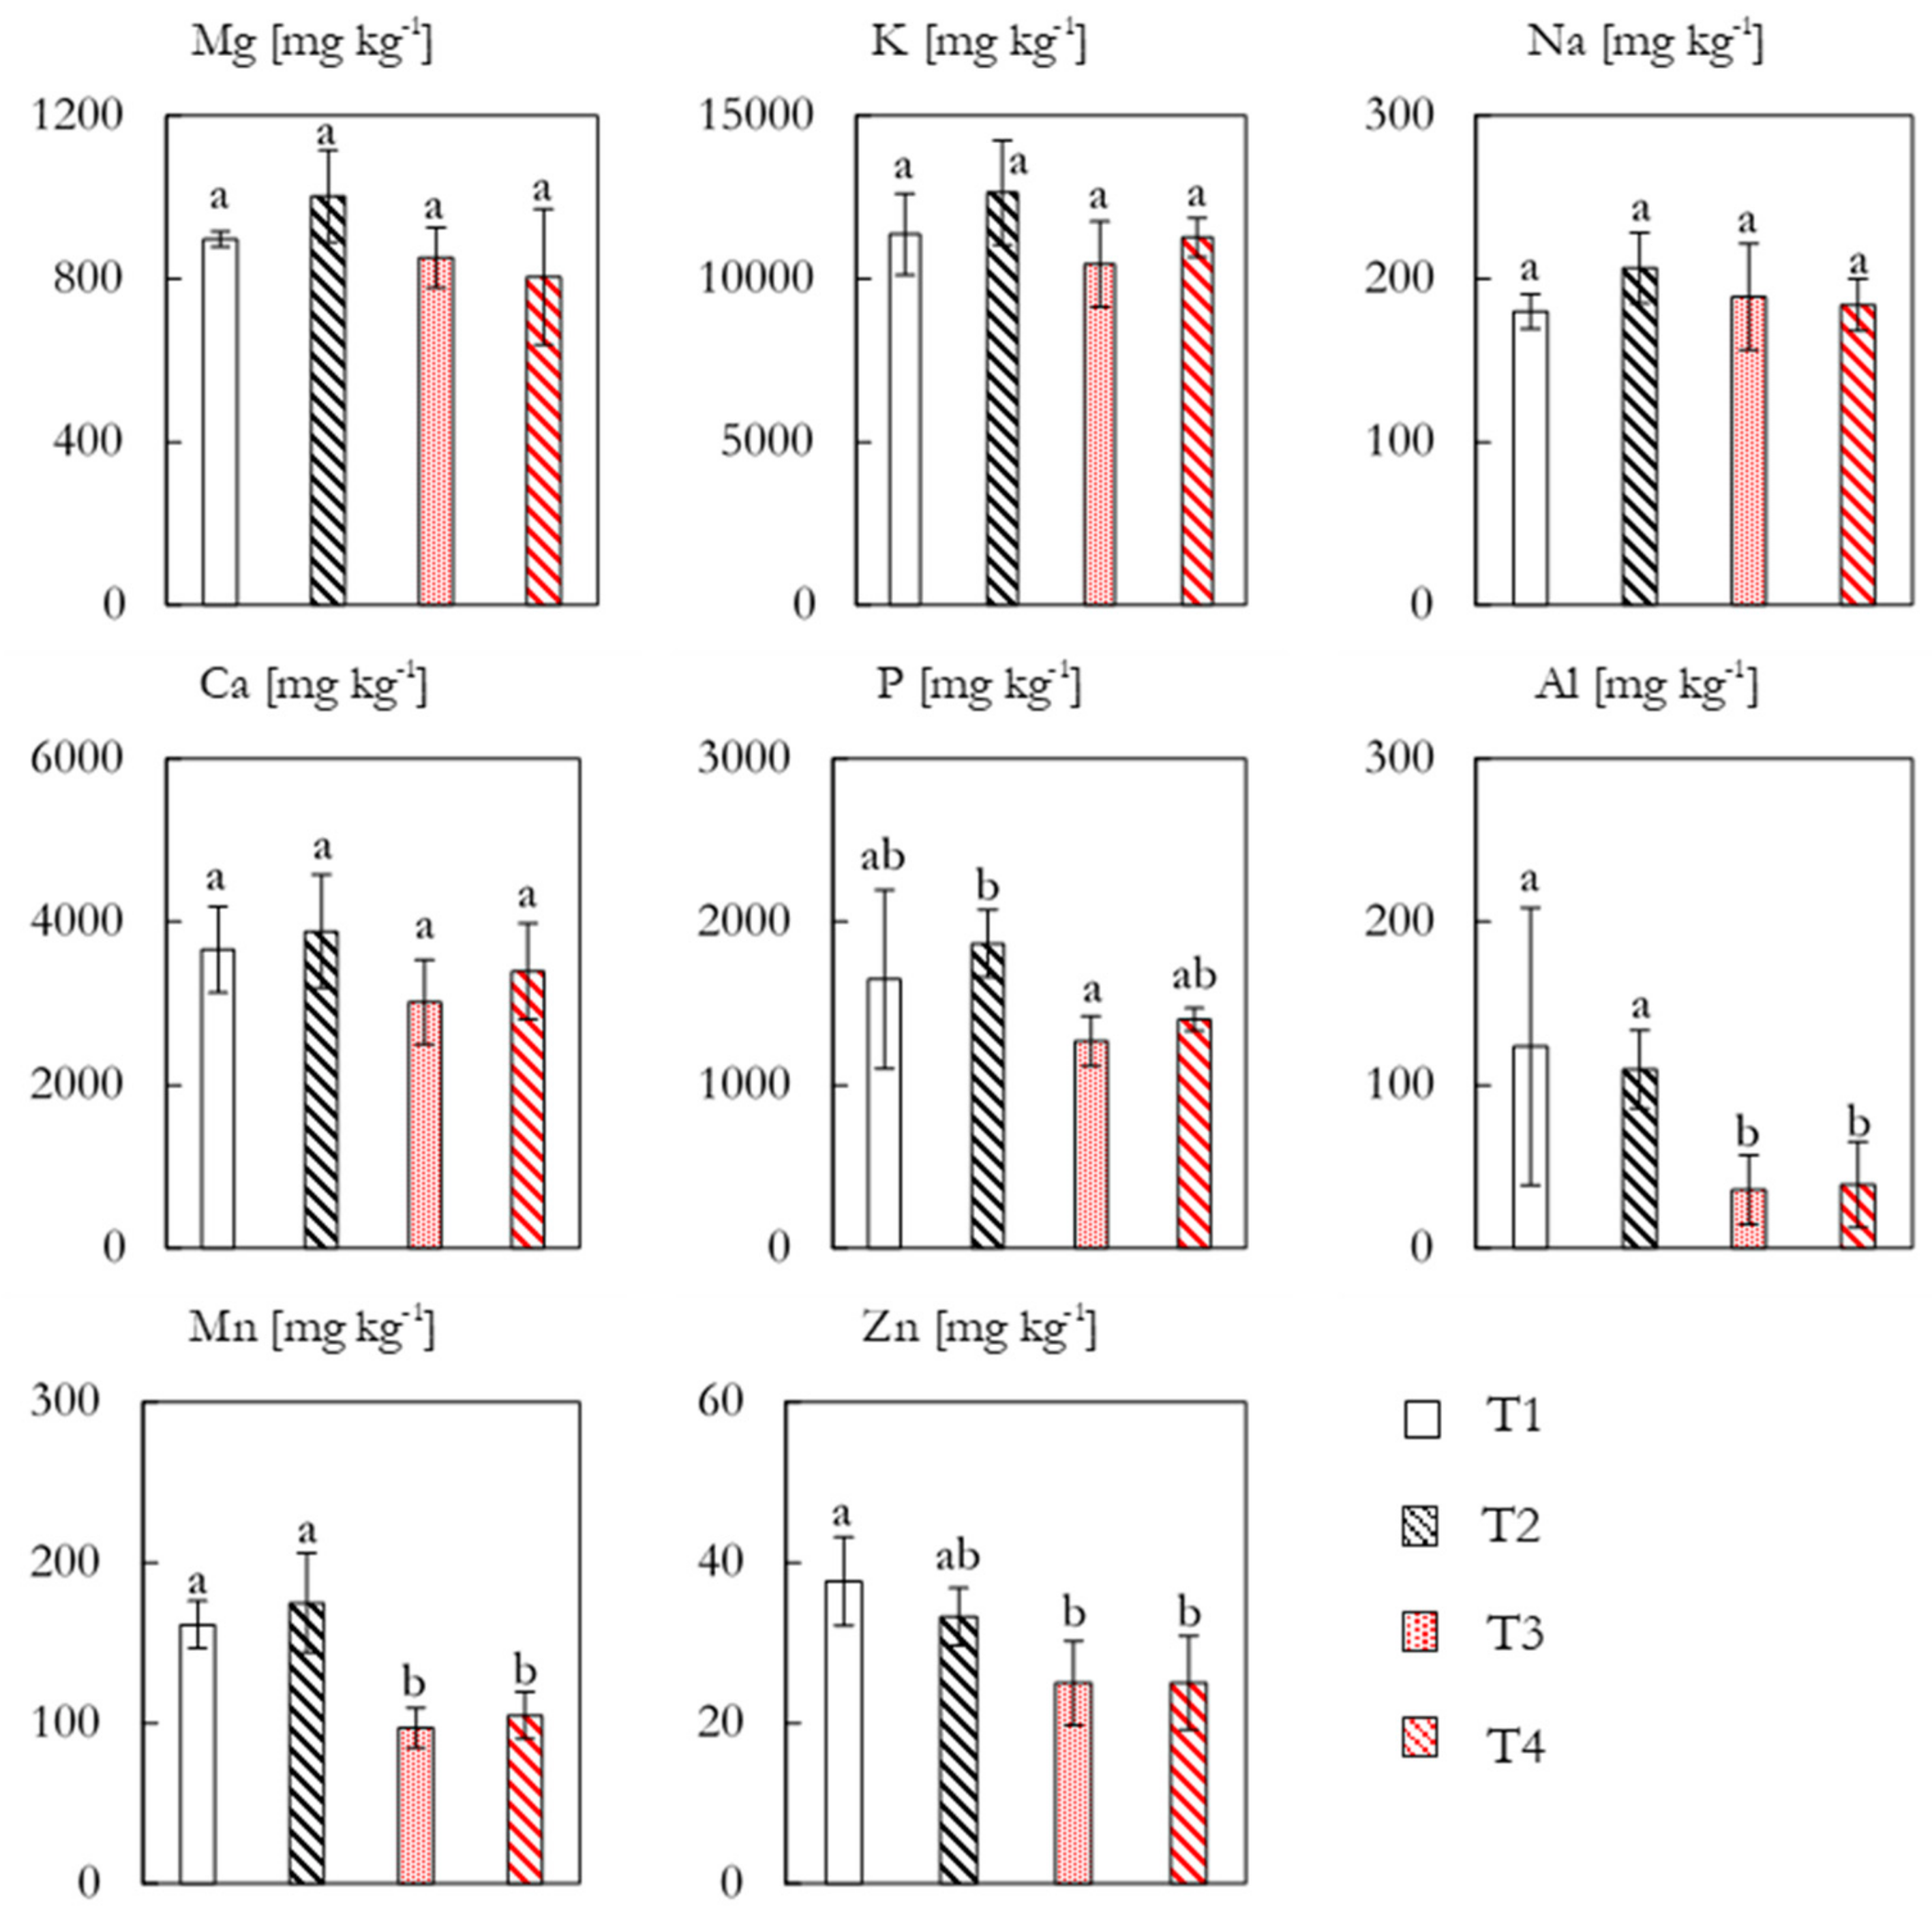
The concentrations of eight nutrient elements in the plant tissue are shown in Figure 7. The concentrations of Mg, K, Na, and Ca did not exhibit any significant differences between treatments, though T2 tended to have slightly higher concentrations of all four elements. The concentration of K exceeded the other elements with an average of 11429 ± 1189 mg kg−1 (equivalent to 1.1% dry weight). A significant response was seen for Pl concentrations between T2 (1868 ± 206 mg kg−1) and T3 (1268 ± 153 mg kg−1), whereas the other treatments were non-significantly different. Al concentrations showed a marked and significant increase for the non-fertilized plots with concentrations of approximately 110 mg kg−1, as compared to approximately 35 mg kg−1 for T3 and T4. For Mn, the pattern of increased concentrations in the non-fertilized plots was continued, with T1 and T2 containing 161 ± 15 and 175 ± 31 mg kg−1, respectively, as compared to approximately 100 mg kg−1 for T3 and T4. Zn also exhibited some variation between treatments, with T1 (38 ± 6 mg kg−1) being significantly higher than T3 (25 ± 5 mg kg−1) and T4 (25 ± 6 mg kg−1).
The total stock of the measured elements in the standing biomass for each treatment (not shown) revealed a significantly higher level in T3 for the majority of the elements (Mg, K, Ca, Na, P, C, and N) coinciding with the significantly higher biomass. No significant differences between treatments were seen for Al. For Mn and Zn, T3 was significantly higher than T2 and T4, but T1 was not.
4. Discussion, Implications and Conclusions
This study quantified the short-term effect of adding locally sourced glacial rock flour to an agricultural field of timothy grass in South Greenland with and without 25% normal NPK fertilizer. The assessment included soil properties, biomass yields, and plant nutrient uptake. The experiment showed that GRF-application had no significant impact on the biomass production. This is consistent with pot trial experiments with ryegrass [15]. Little effect was found on above and below ground biomass using glacial rock flour from Greenland, even though the applied amount of GRF was 5% of the soil weight (corresponding to an application rate of 30 t GRF ha−1). However, the study showed that under nutrient deficiency (P, K, Mg, and S), the addition of GRF could increase the aboveground biomass, particularly at a low K availability. In our experiment, K was added (as part of the NPK fertilization). Therefore, we cannot make a direct comparison with [15], particularly because the K level in agricultural soil in South Greenland is typically high due to conventional fertilization.
A low dose of GRF (20 t ha−1) in combination with 25% conventional NPK fertilizer markedly increased the aboveground biomass production, whereas 40 t GRF ha−1 with the same amount of NPK resulted in a decrease in yield, indicating that the applying GRF may also have negative effects on plant growth and the resulting biomass. The GRF treatment showed no significant increase in plant availability of nutrients or pH in the soil compared to the control treatment. Furthermore, the particle size distributions of the control treatment and GRF-treated plots showed that GRF particles had not infiltrated down in the soil.
The nutrient uptake by the plants was not affected by the GRF application. The fertilized plots showed higher gross nutrient uptake due to the higher yields observed here, but the plant tissue concentrations were lower because of the limited supply of nutrients being diluted in a larger amount of biomass. From the analysis of the nutrient composition of the AGB, we conclude that plants from all treatments were limited by N, P, and Mg, while the concentrations of Mn and Al were too high, approaching levels of toxicity.
The application of GRF as a soil amendment seems to implicate a trade-off between the immediate release of exchangeable nutrients bound to negatively charged sites on mineral particles and the long-term weathering of GRF minerals to supply macro- and micronutrients. There seems to be greater potential for the latter since the concentration of immediate plant-available nutrients in the GRF is negligible and would imply continuous application. The notion of applying a vast amount of GRF as a ‘reservoir’ of slowly releasing nutrients seems appealing, though there are clear disadvantages to this, especially in a sub-arctic context where the environment is not very suitable for weathering; hence, the nutrient supply would be even slower than in the tropics [9,21]. Thus, there is a need for long term experiments, since most experiments are investigating effects happening in the first or second growing season after application. Contrarily, the authors of [6] showed that five years after the application of 3 tons volcanic rock flour (RF) per hectare in a field experiment in Brazil, the soil had significantly higher concentrations of Ca, Mg, P, and K, and soil pH was raised 1.3 units compared to before the experiment began, stressing the long term effect. Again, however, this effect is unlikely in the cooler and drier climate of south Greenland.
It is likely that a higher amount of rainfall during the growing season would have impacted the results, since a negative water balance was observed. However, drought was not the primary limitation to plant growth because a marked increase in biomass production was noted after NPK fertilization. Both rates of rock flour application were very high and would therefore probably exceed the capacity for most Greenlandic farmers, as it would be very laborious and expensive to have the material transported to the farm and distributed in the field even if a source was available nearby.
An important aspect to consider regarding the applicability of GRF in an agricultural context is matching the specific GRF to the needs of the specific soil. Some studies have argued for the advantages of mechanical activation of GRF to improve the solubility of the mineral-bound nutrients. The authors of [46] showed that milling concentrated K-feldspar using a ball mill for as little as 10 minutes drastically decreased particle size and increased SSA, which in turn greatly increased the amount of K extracted (by HNO3, nonetheless). Similarly, the authors of [47] found that milling gneiss powder for 1 hour resulted in a K-release comparable to that of conventional fertilizers. The comparability between these two experiments and the one presented in this article is, however, low since the attained D50 and SSA are in the range of Tasersuaq GRF, i.e., milling would probably not have had an effect in our experiment, as the particle size was already small and the surface area was high.
Further research into the supplementary effects of RF application is needed to evaluate the merits for agricultural purposes, namely the effects beyond macro-and micronutrient supply and pH-control, which most studies, including this one, have focused on. Several studies have highlighted the beneficial effects on plant and soil health by the addition of Si, which most RFs are rich in, even though Si is not characterized as an essential plant nutrient [48]. As already stated, the authors of [49] found that adding dissolved Si greatly improved wheat uptake of P in acidic soils, while the authors of [50] pointed out that Si fertilization may help some plants cope with drought and salinity stress. In addition, it has been pointed out that many studies have found that increased Si uptake enhances plants’ resistance to various diseases and pests [51]. However, these effects are, of course, dependent on the solubility of Si in the applied material, as, e.g., quartz (SiO2) is highly resistant to weathering and may therefore not supply any Si to the soil solution in an appreciable timeframe.
In conclusion, the results obtained in our experiment indicate that the glacial rock flour from Tasersuaq is not a viable agricultural supplement in the first year of application, at least not if applied as a top-dressing in a field of perennial timothy grass.
Supplementary Materials
A supplementary file (Figures S1–S8, and Tables S1–S4) is available online at https://www.mdpi.com/2073-445X/9/6/198/s1: Supporting information on methodology and materials.
Author Contributions
Conceptualization, B.E. and F.N.S.; investigation, F.N.S. and O.B.; resources, B.E.; original draft preparation, F.N.S.; writing—review and editing, F.N.S. and B.E.; supervision, B.E. All authors have read and agreed to the published version of the manuscript.
Funding
This research was funded by Danish National Research Foundation (CENPERM DNRF100) and Geocenter Denmark.
Acknowledgments
Thanks are extended to GEUS staff for field work at Lake Tasersuaq, Calista and Agathe for allowing field work at your farm, to Minik Rosing additional funding for the project and coordination and Søs for help in the laboratory. Many thanks also to three journal reviewers for constructive and helpful comments.
Conflicts of Interest
The authors declare no conflict of interest.
References
- Hamaker, J.D.; Weaver, D.A. The Survival of Civilization; Hamaker-Weaver Publishers: Seymour, MI, USA, 1982. [Google Scholar]
- Anda, M.; Shamshuddin, J.; Fauziah, C.I. Improving chemical properties of a highly weathered soil using finely ground basalt rocks. Catena 2015, 124, 147–161. [Google Scholar] [CrossRef]
- Basak, B.B.; Sarkar, B.; Biswas, D.R.; Sarkar, S.; Sanderson, P.; Naidu, R. Bio-Intervention of naturally occurring silicate minerals for alternative source of potassium. In Advances in Agronomy; Academic Press: Cambridge, MA, USA, 2017; pp. 115–145. [Google Scholar] [CrossRef]
- Haller, H. Efficacy, Sustainability and Diffusion Potential of Rock Dust for Soil Remediation in Chontales, Nicaragua. Master’s Thesis, Mid Sweden University, Sundsvall, Sweden, 2011. [Google Scholar]
- Ramos, C.G.; Querol, X.; Oliveira, M.L.S.; Pires, K.; Kautzmann, R.M.; Oliveira, L.F.S. A preliminary evaluation of volcanic rock powder for application in agriculture as soil a remineralizer. Sci. Total Environ. 2015, 512–513, 371–380. [Google Scholar] [CrossRef] [PubMed]
- Theodoro, S.H.; Leonardos, O.H. The use of rocks to improve family agriculture in Brazil. An. Acad. Bras. Ciênc. 2006, 78, 721–730. [Google Scholar] [CrossRef]
- Beerling, D.J.; Leake, J.R.; Long, S.P.; Scholes, J.D.; Ton, J.; Nelson, P.N.; Bird, M.; Kantzas, E.; Taylor, L.L.; Sarkar, B.; et al. Farming with crops and rocks to address global climate, food and soil security. Nat. Plants 2018, 4, 138–147. [Google Scholar] [CrossRef] [PubMed]
- Harley, A.D.G.; Gilkes, R.J. Factors influencing the release of plant nutrient elements from silicate rock powders: A geochemical overview. Nutr. Cycl. Agroecosyst. 2000, 56, 11–36. [Google Scholar] [CrossRef]
- Van Straaten, P. Farming with rocks and minerals: challenges and opportunities. Ann. Braz. Acad. Sci. 2006, 731–747. [Google Scholar] [CrossRef] [Green Version]
- Manning, D.A.C.; Baptista, J.; Sanchez Limon, M.; Brandt, K. Testing the ability of plants to access potassium from framework silicate minerals. Sci. Total Environ. 2017, 574, 476–481. [Google Scholar] [CrossRef] [Green Version]
- Silva, D.R.G.; Marchi, G.; Spehar, C.R.; Guilherme, L.R.G.; Rein, T.A.; Soares, D.A.; Ávila, F.W. Characterization and nutrient release from silicate rocks and influence on chemical changes in soil. Rev. Bras. Ciência Do Solo 2012, 36, 951–962. [Google Scholar] [CrossRef]
- Bakken, A.K.; Gautneb, H.; Myhr, K. The potential of crushed rocks and mine tailings as Slow-Releasing K fertilizers assessed by intensive cropping with Italian ryegrass in different soil types. Nutr. Cycl. Agroecosyst. 1996, 47, 41–48. [Google Scholar] [CrossRef]
- Barral Silva, M.T.; Silva Hermo, B.; Garcia-Rodeja, E.; Vazquez Freire, N. Reutilization of granite powder as an amendment and fertilizer for acid soils. Chemosphere 2005, 61, 993–1002. [Google Scholar] [CrossRef]
- Gillman, G.P.; Burkett, D.C.; Coventry, R.J. Amending highly weathered soils with finely ground basalt rock. Appl. Geochem. 2002, 17, 987–1001. [Google Scholar] [CrossRef]
- Gunnarsen, K.C.; Jensen, L.S.; Gómez-Muñoz, B.; Rosing, M.T.; de Neergaard, A. Glacially abraded rock flour from Greenland: Potential for macronutrient supply to plants. J. Plant Nutr. Soil Sci. 2019. [Google Scholar] [CrossRef]
- Manning, D.A.C. Mineral sources of potassium for plant nutrition: A review. Agron. Sustain. Dev. 2010, 30, 281–294. [Google Scholar] [CrossRef] [Green Version]
- Bakken, A.K.; Gautneb, H.; Sveistrup, T.; Myhr, K. Crushed rocks and mine tailings applied as K fertilizers on grassland. Nutr. Cycl. Agroecosyst. 2000, 56, 53–57. [Google Scholar] [CrossRef]
- Bolland, M.D.A.; Baker, M.J. Powdered granite is not an effective fertilizer for clover and wheat in sandy soils from Western Australia. Nutr. Cycl. Agroecosyst. 2000, 56, 59–68. [Google Scholar] [CrossRef]
- Ramezanian, A.; Dahlin, A.S.; Campbell, C.D.; Hillier, S.; Mannerstedt-Fogelfors, B.; Öborn, I. Addition of a volcanic rockdust to soils has no observable effects on plant yield and nutrient status or on soil microbial activity. Plant Soil 2012, 367, 419–436. [Google Scholar] [CrossRef]
- Hinsinger, P.; Bolland, M.D.A.; Gilkes, R.J. Silicate rock powder: Effect on selected chemical properties of a range of soils from Western Australia and on plant growth as assessed in a glasshouse experiment. Fertil. Res. 1995, 45, 69–79. [Google Scholar] [CrossRef]
- Manning, D.A.C. How will minerals feed the world in 2050? Proc. Geol. Assoc. 2015, 126, 14–17. [Google Scholar] [CrossRef]
- Ramos, C.G.; de Mello, A.G.; Kautzmann, R.M. A preliminary study of acid volcanic rocks for stonemeal application. Environ. Nanotechnol. Monit. Manag. 2014, 1-2, 30–35. [Google Scholar] [CrossRef] [Green Version]
- Bennike, O.; Jensen, J.B.; Sukstorf, F.N.; Rosing, M.T. Mapping glacial rock flour deposits in Tasersuaq, southern West Greenland. Geol. Surv. Den. Greenl. Bull. 2019, 43. [Google Scholar] [CrossRef] [Green Version]
- Westergaard-Nielsen, A.; Bjornsson, A.B.; Jepsen, M.R.; Stendel, M.; Hansen, B.U.; Elberling, B. Greenlandic sheep farming controlled by vegetation response today and at the end of the 21st century. Sci. Total Env. 2015, 512–513, 672–681. [Google Scholar] [CrossRef] [PubMed]
- Westergaard-Nielsen, A.; Karami, M.; Hansen, B.U.; Westermann, S.; Elberling, B. Contrasting temperature trends across the Ice-Free part of Greenland. Sci. Rep. 2018, 8, 1586. [Google Scholar] [CrossRef] [PubMed]
- Caviezel, C.; Hunziker, M.; Kuhn, N. Bequest of the Norseman—The potential for agricultural intensification and expansion in southern greenland under climate change. Land 2017, 6, 87. [Google Scholar] [CrossRef] [Green Version]
- Cappelen, J. Greenland–DMI Historical Climate Data Collection 1784-2017; Danish Meteorological Institute: Copenhagen, Denmark, 2018; p. 118.
- Hansen, B.U. Satellite monitoring of the biomass production in southern Greenland. Dan. J. Geogr. 1988, 88, 94–101. [Google Scholar] [CrossRef]
- Anisimov, O.; Arnalds, Ö.; Arnoldusen, A.; Bockheim, J.; Breuning-Madsen, H.; Broll, G.; Brown, J.; Desyatkin, R.; Goryachkin, S.; Jakobsen, B.H.; et al. Soil Atlas of the Northern Circumpolar Region; European Commission. Institute for Environment: Luxembourg, 2010; Volume 2007, p. 144. [Google Scholar]
- Gardiner, N.J.; Kirkland, C.L.; Hollis, J.; Szilas, K.; Steenfelt, A.; Yakymchuk, C.; Heide-Jørgensen, H. Building Mesoarchaean crust upon Eoarchaean roots: The Akia Terrane, West Greenland. Contrib. Mineral. Petrol. 2019, 174. [Google Scholar] [CrossRef] [Green Version]
- Brummer, J.E.N.; Nichols, J.T.; Engel, R.K.; Eskridge, K.M. Efficiency of different quadrat sizes and shapes for sampling standing crop. J. Range Manag. 1994, 47, 84–89. [Google Scholar] [CrossRef]
- Franks, C.D.; Goings, K.A. Above-Ground Biomass (Plant) Determinations; United States Department of Agriculture: Washington, DC, USA, 1997. [Google Scholar]
- Blouin, M.; Barot, S.; Roumet, C. A quick method to determine root biomass distribution in diameter classes. Plant Soil 2006, 290, 371–381. [Google Scholar] [CrossRef]
- Frasier, I.; Noellemeyer, E.; Fernandez, R.; Quiroga, A. Direct field method for root biomass quantification in agroecosystems. MethodsX 2016, 3, 513–519. [Google Scholar] [CrossRef]
- Gómez Tena, M.P.; Gilabert, J.; Machí, C.; Zumaquero, E.; Toledo, J. Relationship between the specific surface area parameters determined using different analytical techniques. In Proceedings of the XII Foro Global Del Recubrimiento Cerámico. Universitat Jaume I, Castellón, Spain, 17–18 February 2014. [Google Scholar]
- Bremner, J.M. Nitrogen total. In Methods of Soil Analysis Part 3: Chemical Methods; Soil Science Society of America: Madison, WI, USA, 1996. [Google Scholar]
- Olsen, S.R. Estimation of Available Phosphorus in Soils by Extraction with Sodium Bicarbonate; United States Department of Agriculture: Washington, DC, USA, 1954.
- Kuo, S. Phosphorus. In Method of Soil Analysis Part 3.Chemical Methods; Sparks, D.L., Ed.; Soil Science Society America, Inc.: Madison, WI, USA; America Society Agronomy, Inc.: Washington, DC, USA, 1996; pp. 869–919. [Google Scholar]
- Wilk, M.B.; Gnanadesikan, R. Probability plotting methods for the analysis for the analysis of data. Biometrika 1968, 55, 1–17. [Google Scholar] [CrossRef]
- Blott, S.J.; Pye, K. GRADISTAT: A grain size distribution and statistics package for the analysis of unconsolidated sediments. Earth Surf. Process. Landf. 2001, 26, 1237–1248. [Google Scholar] [CrossRef]
- Bootsma, A. Forage crop maturity zonation in the Atlantic region using growing Degree-Days. Can. J. Plant Sci. 1984, 64, 329–338. [Google Scholar] [CrossRef] [Green Version]
- Moot, D.J.; Scott, W.R.; Roy, A.M.; Nicholls, A.C. Base temperature and thermal time requirements for germination and emergence of temperate pasture species. N. Z. J. Agric. Res. 2010, 43, 15–25. [Google Scholar] [CrossRef] [Green Version]
- Barton, C.D.; Karathanasis, A.D. Clay minerals. In Encyclopedia of Soil Science; Lal, R., Ed.; Marcel Dekker, Inc.: New York, NY, USA, 2002; pp. 187–192. [Google Scholar]
- O’Leary, M.H. Carbon isotopes in photosynthesis. BioScience 1988, 38, 328–336. [Google Scholar] [CrossRef]
- Marshall, J.D.; Brooks, J.R.; Lajtha, K. Sources of variation in the stable isotopic composition of plants. Stable Isot. Ecol. Environ. Sci. 2007, 22–60. [Google Scholar] [CrossRef]
- Kleiv, R.A.; Thornhill, M. Production of mechanically activated rock flour fertilizer by high intensive ultrafine grinding. Miner. Eng. 2007, 20, 334–341. [Google Scholar] [CrossRef] [Green Version]
- Priyono, J.; Gilkes, R.J. High-Energy milling improves the effectiveness of silicate rock fertilizers: A glasshouse assessment. Commun. Soil Sci. Plant Anal. 2008, 39, 358–369. [Google Scholar] [CrossRef]
- Coskun, D.; Deshmukh, R.; Sonah, H.; Menzies, J.G.; Reynolds, O.; Ma, J.F.; Kronzucker, H.J.; Bélanger, R.R. The controversies of silicon’s role in plant biology. New Phytol. 2019, 221, 67–85. [Google Scholar] [CrossRef]
- Kostic, L.; Nikolic, N.; Bosnic, D.; Samardzic, J.; Nikolic, M. Silicon increases phosphorus (P) uptake by wheat under low P acid soil conditions. Plant Soil 2017, 419, 447–455. [Google Scholar] [CrossRef]
- Swain, R.; Rout, G.R. Silicon in agriculture. In Sustainable Agriculture Reviews; Springer: Dordrecht, The Netherlands, 2017; pp. 233–260. [Google Scholar] [CrossRef]
- Ma, J.F. Role of silicon in enhancing the resistance of plants to biotic and abiotic stresses. Soil Sci. Plant Nutr. 2004, 50, 11–18. [Google Scholar] [CrossRef]
Figure 1.
Overview of the two study areas. Tasersuaq is the lake in which the glacial rock flour was sampled. Ipiutaq is the experimental site, where the glacial rock flour was used as a soil amendment. The map of Greenland is constructed in ArcMap, while the two insets are from Google Earth.
Figure 1.
Overview of the two study areas. Tasersuaq is the lake in which the glacial rock flour was sampled. Ipiutaq is the experimental site, where the glacial rock flour was used as a soil amendment. The map of Greenland is constructed in ArcMap, while the two insets are from Google Earth.

Figure 2.
Daily accumulated precipitation (blue bars) and daily mean air temperature (black line) for the 2019 growing season measured at Narsarsuaq.
Figure 2.
Daily accumulated precipitation (blue bars) and daily mean air temperature (black line) for the 2019 growing season measured at Narsarsuaq.

Figure 3.
Selected chemical and physical properties of the soil profile. Pavail: plant-available P; BD: bulk density.
Figure 3.
Selected chemical and physical properties of the soil profile. Pavail: plant-available P; BD: bulk density.
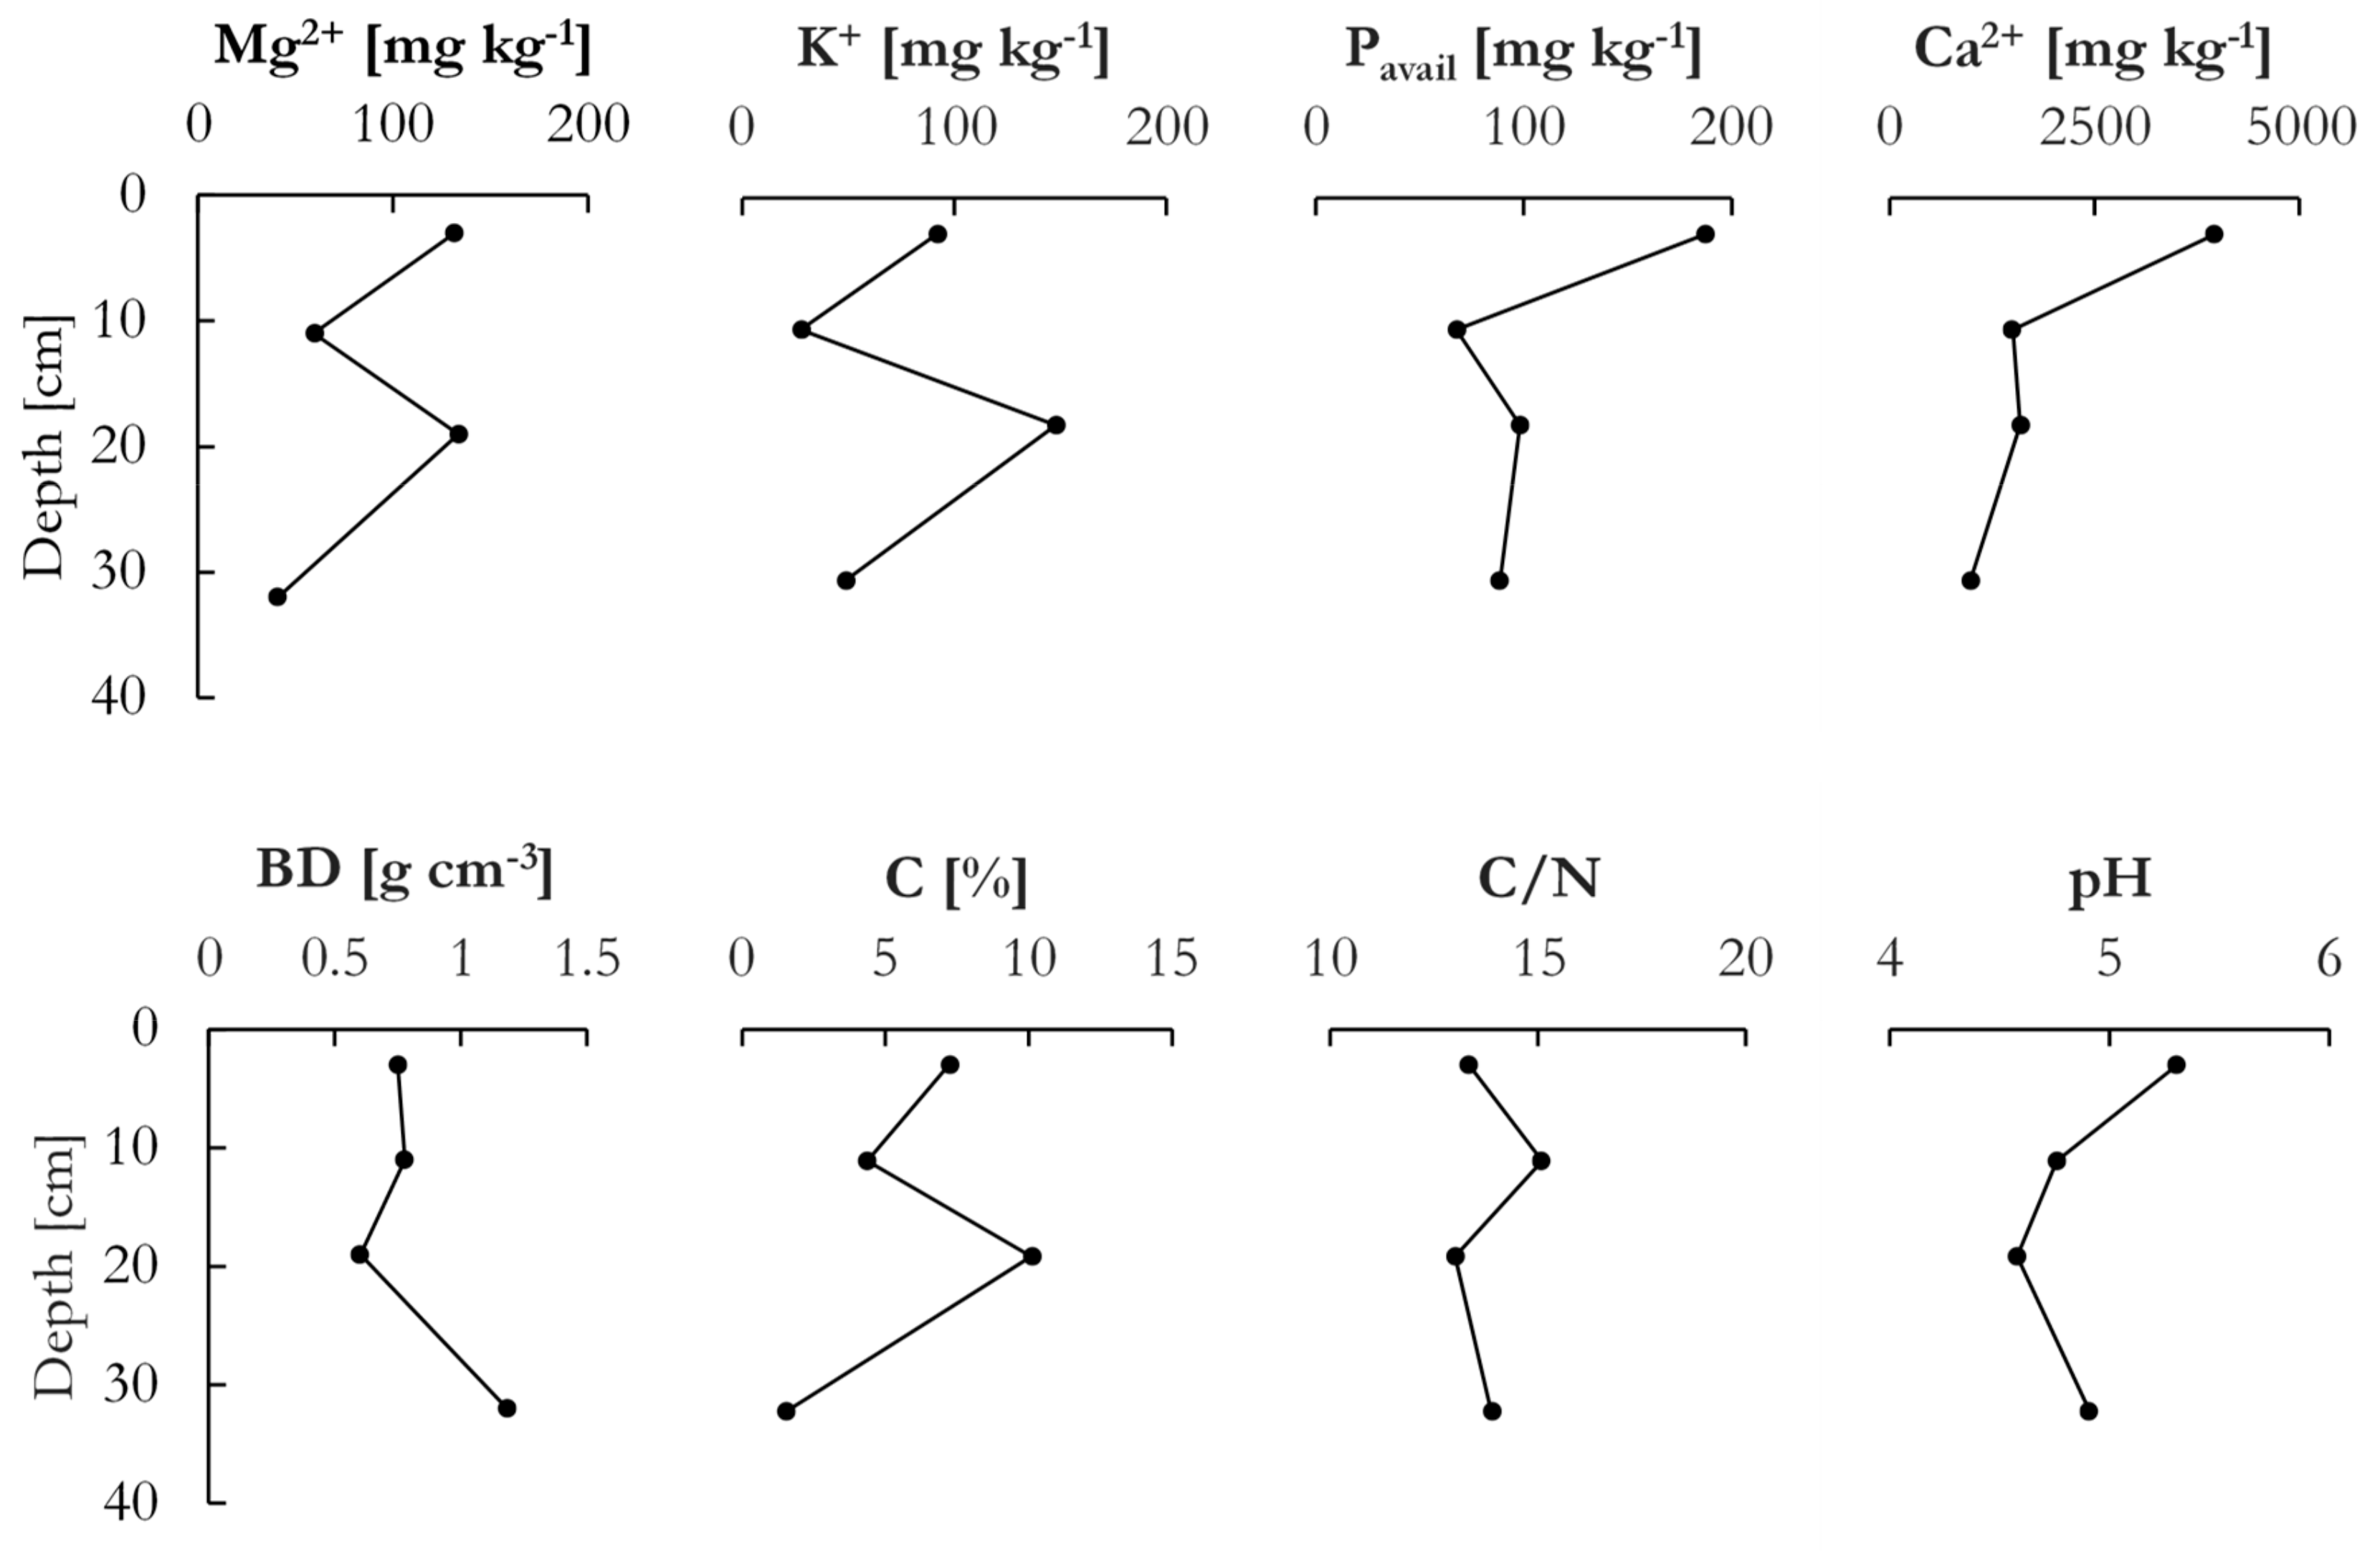
Figure 4.
Particle size distribution of glacial rock flour (GRF) primary particles (grey line), T1 (solid black line), and T2 (dashed black line). The distributions were constructed as an average of five replicates measured five times using a Malvern Mastersizer 2000. No error bars are shown, as the standard deviations were small and concealed the small difference between T1 (control) and T2.

Figure 5.
Concentrations of exchangeable ions and C/N ratio for the soil of T1 and T2 at two depths (n = 5). Standard deviation is shown with the error bars. Different letters refer to significance variations (p < 0.05). T1 refers to the control treatment.
Figure 5.
Concentrations of exchangeable ions and C/N ratio for the soil of T1 and T2 at two depths (n = 5). Standard deviation is shown with the error bars. Different letters refer to significance variations (p < 0.05). T1 refers to the control treatment.
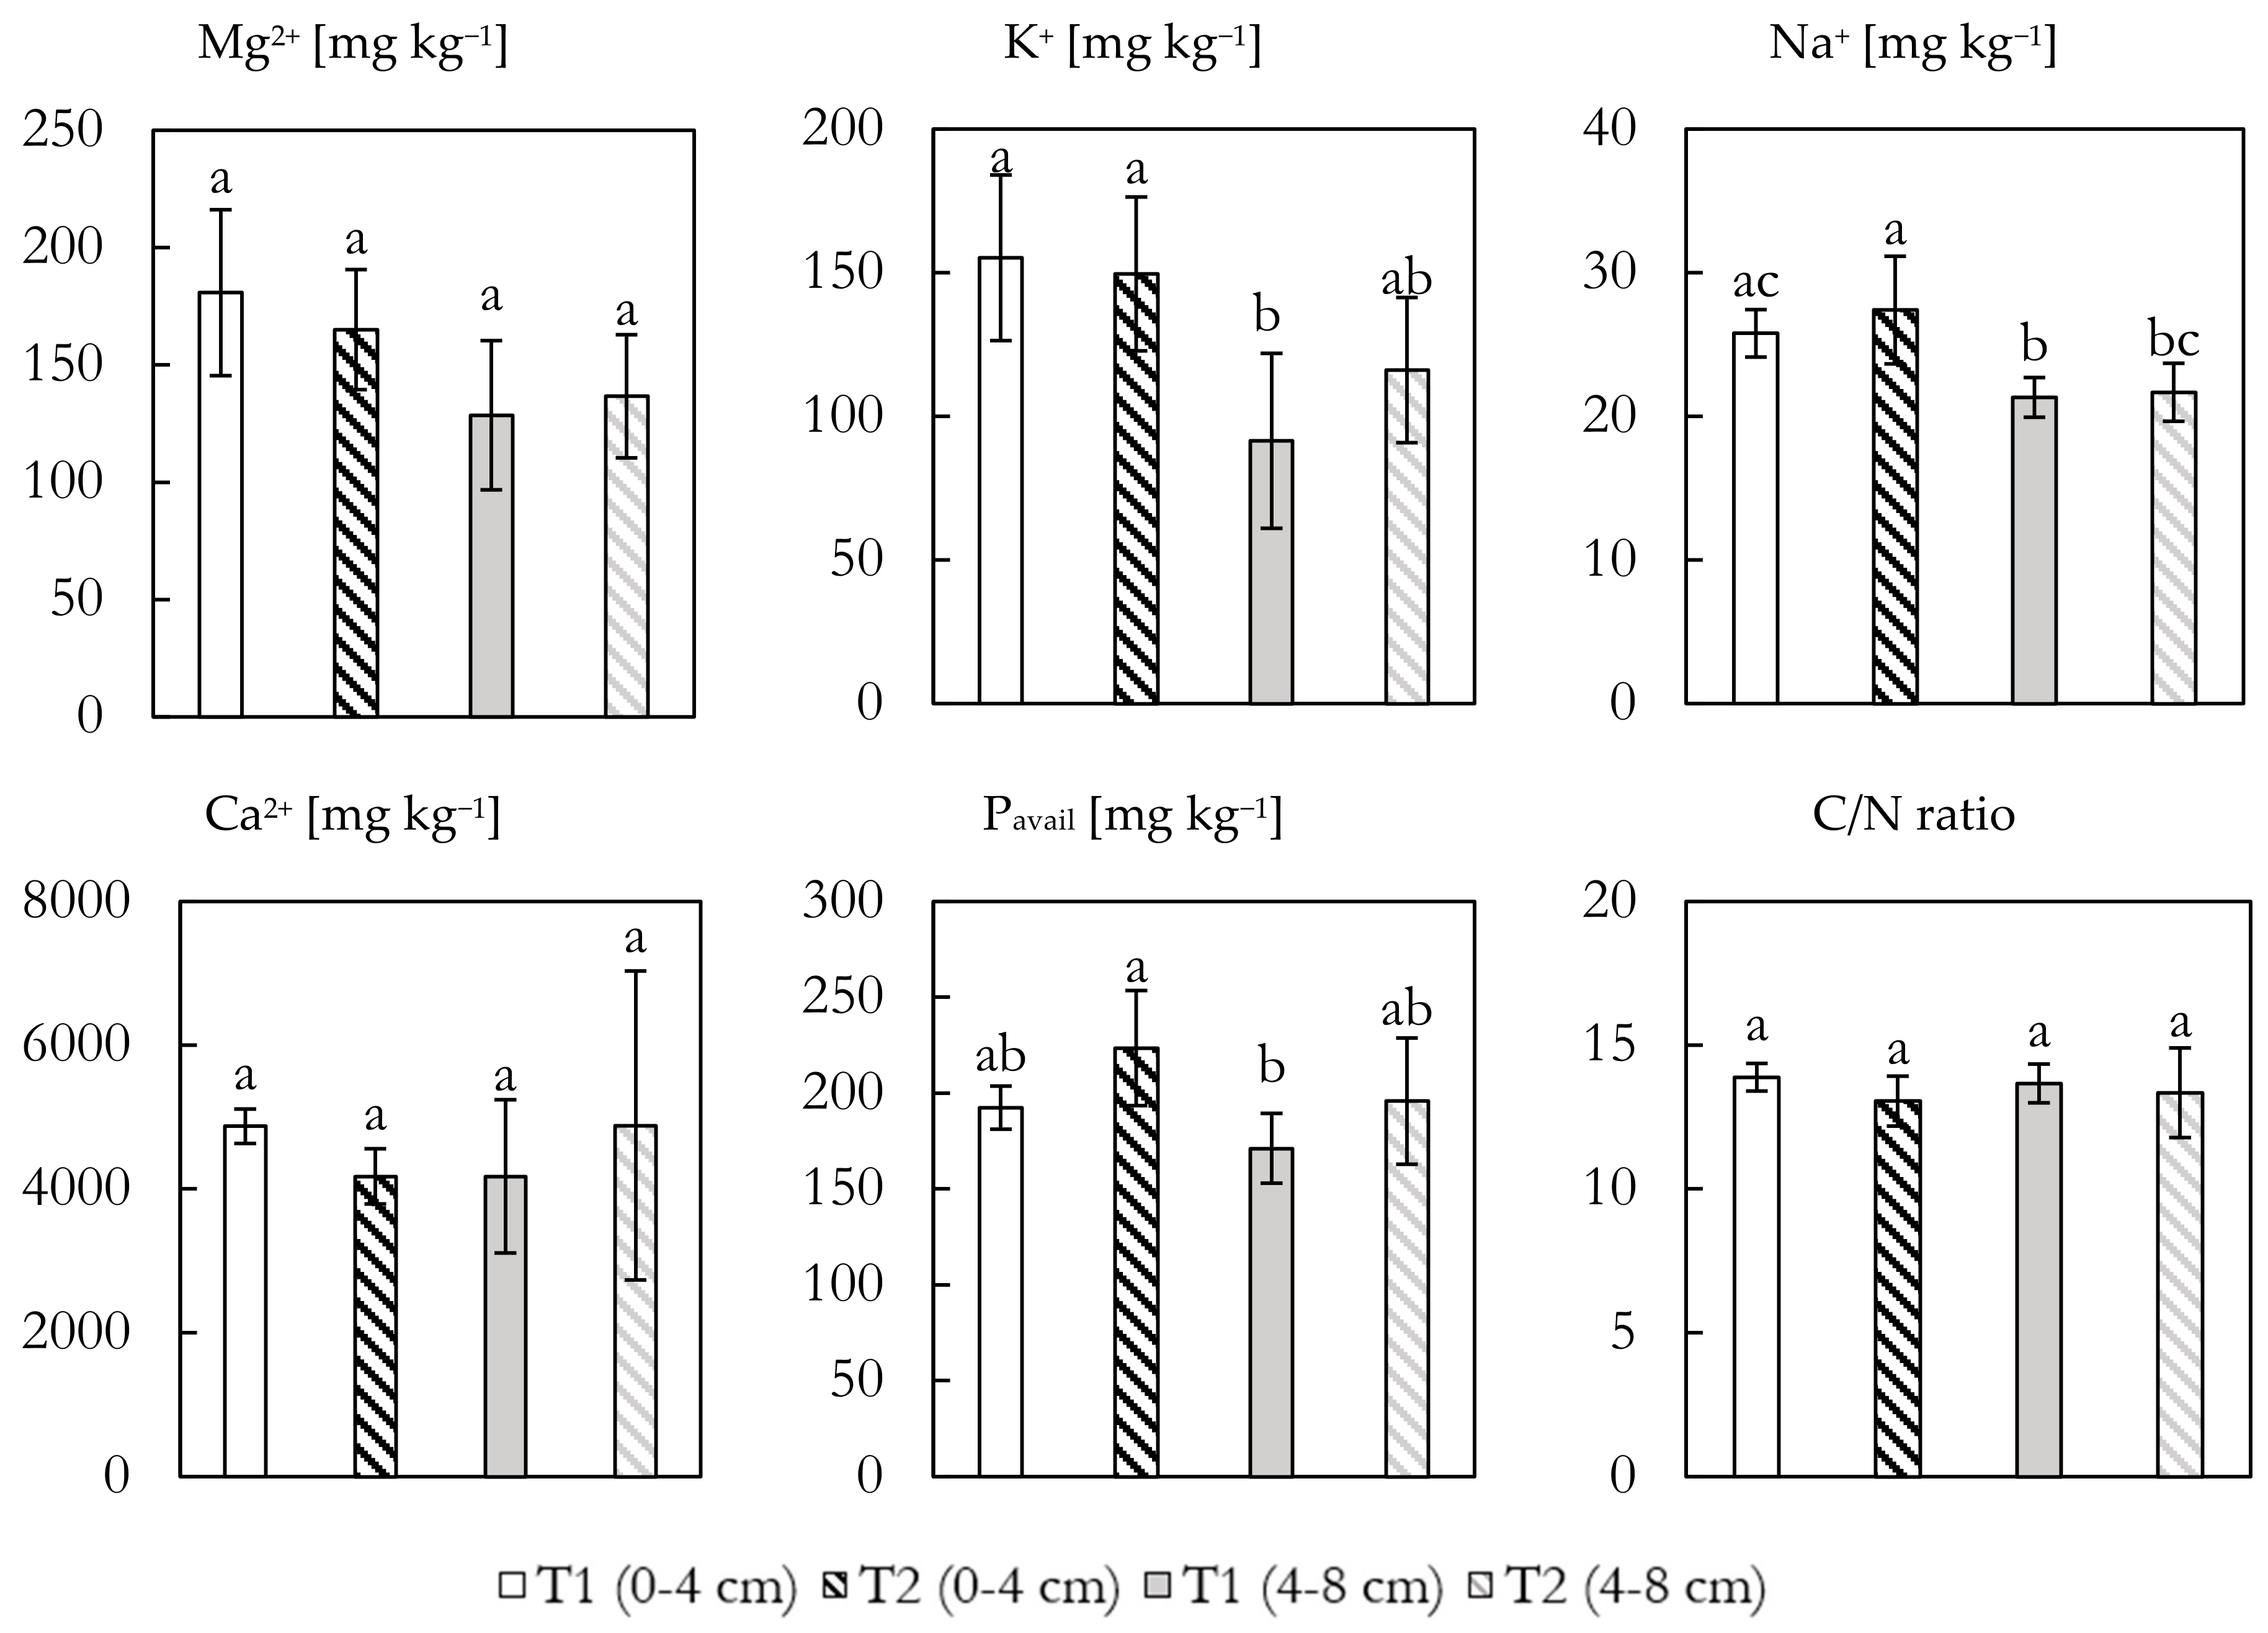
Figure 6.
Characteristics of harvested biomass and isotopic composition of C and N in the aboveground biomass (AGB). (a) AGB, (b) belowground dry biomass (BGB), (c) δ15N values in AGB, and (d) δ13C values in AGB. The vertical line within each boxplot represents the median value. Different letters refer to significance variations (p < 0.05). T1 refers to the control treatment.

Figure 7.
ICP-MS (inductively coupled plasma-mass spectrometry) measurements of the concentration of eight elements in the AGB. Different letters refer to significance variations (p < 0.05). Error bars denote the standard deviation. T1 refers to the control treatment.
Figure 7.
ICP-MS (inductively coupled plasma-mass spectrometry) measurements of the concentration of eight elements in the AGB. Different letters refer to significance variations (p < 0.05). Error bars denote the standard deviation. T1 refers to the control treatment.

Table 1.
Depth-integrated (0–40 cm) nutrient stocks in the experimental field in kg ha−1 except for N and C, which were measured as t ha−1.
Table 1.
Depth-integrated (0–40 cm) nutrient stocks in the experimental field in kg ha−1 except for N and C, which were measured as t ha−1.
| Mg2+ | K+ | Ca2+ | Na+ | Pavail | N | C |
|---|---|---|---|---|---|---|
| 258 | 243 | 4943 | 55 | 285 | 12.7 | 172.9 |
Table 2.
Properties of glacial rock flour from Tasersuaq. CEC: cation exchange capacity.
| Soil pH (CaCl2) | 6.9 [± 0.1] |
| D50 [µm] | 5.5 [± 0.1] |
| Surface area [m2 g−1] | 11.1 [± 0.1] |
| N-total [mg kg−1] | N.a. |
| C- total [mg kg−1] | 462 [± 57] |
| Pavail [mg kg−1] | 83 [± 4] |
| K- exc. [mg kg−1] | 25 [± 3] |
| Mg- exc. [mg kg−1] | 64 [± 2] |
| Ca- exc. [mg kg−1] | 576 [± 22] |
| Na- exc. [mg kg−1] | 22 [± 3] |
| CEC [cmol+ kg−1] | 3.6 [± 0.2] |
Table 3.
Soil pH, %C, and CEC for T1 and T2.
| T1 0–4 cm | T2 0–4 cm | T1 4–8 cm | T2 4–8 cm | |
|---|---|---|---|---|
| Soil pH (CaCl2) | 5.6 ± 0.2 (a) | 5.5 ± 0.1 (a) | 5.5 ± 0.3 (a) | 5.3 ± 0.1(a) |
| C [%] | 9.7 ± 0.7 (a) | 7.8 ± 1.7 (a) | 7.6 ± 2.1 (a) | 8.1 ± 2.8 (a) |
| CEC [cmol kg−1] | 26.4 ± 1.3 (a) | 22.8 ± 2.2 (a) | 22.3 ± 6.4 (a) | 25.9 ±12.8 (a) |
| pH is measured in CaCl2. CEC is calculated as the sum of Ca, Mg, K, and Na. | ||||
© 2020 by the authors. Licensee MDPI, Basel, Switzerland. This article is an open access article distributed under the terms and conditions of the Creative Commons Attribution (CC BY) license (http://creativecommons.org/licenses/by/4.0/).
Share and Cite
MDPI and ACS Style
Sukstorf, F.N.; Bennike, O.; Elberling, B. Glacial Rock Flour as Soil Amendment in Subarctic Farming in South Greenland. Land 2020, 9, 198. https://doi.org/10.3390/land9060198
AMA Style
Sukstorf FN, Bennike O, Elberling B. Glacial Rock Flour as Soil Amendment in Subarctic Farming in South Greenland. Land. 2020; 9(6):198. https://doi.org/10.3390/land9060198
Chicago/Turabian StyleSukstorf, Frederik Næsby, Ole Bennike, and Bo Elberling. 2020. "Glacial Rock Flour as Soil Amendment in Subarctic Farming in South Greenland" Land 9, no. 6: 198. https://doi.org/10.3390/land9060198
Note that from the first issue of 2016, this journal uses article numbers instead of page numbers. See further details here.