Article

Quantifying the Economic Value of Ecosystem Services in Oil Palm Dominated Landscapes in Riau Province in Sumatra, Indonesia

by
Ando Fahda Aulia
1,2,
Harpinder Sandhu
1,3,* and
Andrew C. Millington
1
1
College of Science and Engineering, Flinders University, Adelaide, SA 5001, Australia
2
Faculty of Economics and Business, Universitas Riau, Pekanbaru 28293, Indonesia
3
UniSA STEM, University of South Australia, Adelaide, SA 5001, Australia
*
Author to whom correspondence should be addressed.
Land 2020, 9(6), 194; https://doi.org/10.3390/land9060194
Submission received: 13 April 2020 / Revised: 6 June 2020 / Accepted: 9 June 2020 / Published: 11 June 2020

Abstract

:
Ecosystem services in oil palm plantations owned by smallholders in four villages in the Riau Province, Indonesia were identified and valued. Nine provisioning, three regulating and maintenance, one cultural ecosystem service, and a single ecosystem dis-service, were identified from interviews with 62 farming households. Direct and indirect market valuation methods were used to estimate the total economic value (TEV) of these services, which averaged USD 6520 ha−1 year−1 (range = USD 2970–7729 ha−1 year−1). The values of provisioning services were USD 4331 ha−1 year−1 (range = USD 2263–5489 ha−1 year−1), regulating and maintenance services were valued at USD 1880 ha−1 year−1 (range of USD 707–3110 ha−1 year−1), and cultural services were USD 309 ha−1 year−1. We conclude that identifying and valuing ecosystem services offers an opportunity to improve the environmental and economic sustainability of smallholders in oil palm landscapes in Indonesia.

1. Introduction

Oil palm cultivation and expansion pose significant threats to biodiversity and contribute to large amounts of greenhouse gas emissions, leading to global climate change [1,2,3,4,5]. Simultaneously, increasing global demand for palm oil in industrial applications and food processing makes it economically attractive. The Indonesian and Malaysian governments have promoted the expansion of oil palm by providing policy support to both large- and small-scale producers. Currently, these two countries supply more than 85% of the world’s palm oil production.
In 2016, Indonesia was the leading palm oil producer with 36 MT produced from approximately six million hectares. Agriculture contributes 12.8% (USD 133.8 billion) to Indonesia’s GDP of USD 1.04 trillion [6]. Palm oil contributes the second largest share, after rice, to the country’s agricultural economy. High returns on investment has resulted in the growth of the palm oil industry, which in turn has contributed significantly to rural economic development and poverty alleviation [7,8]. The importance of this is underlined by the fact that 40% of oil palm growers are smallholders.
The economic and environmental risks associated with monocultures are well known globally [9,10]. Shifts in economic, environment, or policy settings (e.g., declining crop prices, or changes in global demand) have the potential to significantly impact smallholder livelihoods. Such shifts are in addition to the current and ongoing risks that oil palm-dominated landscapes pose to the environment. A continuation of the current economic policies which promote the expansion and intensification of oil palm cultivation in Indonesia has been questioned in terms of sustainability, and of the well-being of smallholders [11,12]. Therefore, there is a need to examine the current landscapes dominated by oil palm cultivation so that diversified landscapes, that can provide diverse livelihoods and better protect the environment, can be developed.
Tropical forests in South East Asia are disappearing at an alarming rate and their very existence is threatened by the expansion of oil palm plantations in some places [13]. The conversion of natural and lightly disturbed forests to plantations often leads to declining ecosystem functions and services [14,15]. More generally, it is now understood that ecosystem services and benefits to human beings that are provided by managed and natural ecosystems are being degraded rapidly worldwide [16,17]. In particular, changes in land cover have the potential to accelerate reductions in the capacity of ecosystems to support life through the provision of goods and services [18,19].
In the context of this research, managed oil palm plantations increase economic benefits, though they do so at the cost of diminished ecosystem services [20]. Because of the trade-offs between the palm oil industry and the environment, investigations into the impacts of oil palm cultivation on biodiversity have become research focuses [21,22]. The ecosystem services approach is considered an appropriate methodology to address environmental sustainability in rural landscapes [23,24]. Recently, attention has been focused on the impact of oil palm plantations on changes in biodiversity and greenhouse gas emissions, but much less is known about other ecosystem services associated with oil palm cultivation [25]. Consequently, the scientific literature on the full range of ecosystem services generated by oil palm-dominated landscapes is scant and this is impeding the urgent need to understand the role of oil palm cultivation in supporting smallholder livelihoods.
Therefore, the objective of the research reported in this paper is to identify and value the range of ecosystem services generated by four villages with oil palm-dominated landscapes in the Riau Province in Sumatra. We used household-level data from four villages in the Riau Province, drawn from a detailed analysis of these four villages [26].

Ecosystem Services and Agricultural Landscapes

Agricultural activities utilise about one-third of the earth’s surface to meet the demands of a growing global population [27]. Though agricultural land is primarily used to produce crops and livestock for food, it also provides other services, such as fibre and biofuel production, opportunities to store carbon, on-farm biodiversity, and aesthetic and recreational opportunities [28,29]. However, intensive agriculture often results in the loss of ecosystem services at both the farm and landscape scales. A substantial number of literature documents research into ecosystem services in agricultural landscapes [30,31,32]. Within this body of work, information on the impacts of—and dependencies on—ecosystem services in the oil palm plantation sector is limited [25].
Almost all of the palm oil produced globally is from plantation agriculture [33]. The rapid development of oil palm plantations in Indonesia has resulted in significant land cover change [34]. The conversion of rainforests and peatland forests to oil palm plantations has resulted in losses in biodiversity and ecosystem services [35,36]. Oil palm plantations have also replaced other forms of agriculture in Sumatra (e.g., rubber plantations and rain-fed rice cultivation). Oil palm plantations clearly produce significant economic value in terms of cash income for smallholders, who work their own small plantations and large estates, managed by national and multinational corporations. However, the production of oil palm also generates trade-offs, particularly those that are not yet valued in formal markets. For example, it degrades water and soil quality, which reduces the value of water regulation and soil protection services [37]. Nonetheless, oil palm plantations can also enhance ecosystem services such as carbon sequestration and soil protection, if they are planted on land that was not previously forest or peatland [21].
Conserving both ecosystems and their services is critical for economic development and poverty alleviation, as the livelihood and wellbeing of many people depend on biodiversity and ecosystem services [38]. Biodiversity is essential for the provision of many ecosystem services that are important for human well-being [39]. However, it is threatened by increasing global economic activities. Of particular relevance to this research are the threats from agricultural expansion [40,41,42] and agricultural intensification [43,44]. Current agricultural practices affect ecosystem functions, which in turn affect ecosystem services, and often result in lower yields [45,46,47].

2. The Ecosystem Services Framework

The United Nations-led Millennium Ecosystem Assessment classifies ecosystem services as provisioning, regulating, cultural, and supporting services [17]. This classification is a holistic concept which is best elucidated in these four categories. However, in decision-making contexts in which the economic valuation of ecosystem services is required, it is not the most appropriate classification because of the double counting of some services [48,49]. Wallace [50], having used the MEA classification extensively, proposed three levels of classification, namely, ecological processes, ecosystem services or end services (i.e., what is valued), and benefits. However, he argues that only end services should be used in valuation. Boyd and Banzhaf [51] consider services as end products of nature, instead of benefits, which should be included in economic valuation. Fisher et al. [48] use final benefits (e.g., drinking water, water for irrigation, and water for hydroelectric power) which can be valued in economic terms. However, due to the complexity of ecosystems, a consensus is still lacking on a coherent and integrated approach to ecosystem services assessments. Research efforts to address this are ongoing [52]. The United Nations Environmental Program (UNEP)-led initiative, widely known as the Economics of Ecosystems and Biodiversity (TEEB), facilitates the uptake of science and policy responses in an attempt to halt the decline in ecosystem services by capturing the economic value of ecosystem services in national accounts. Standardization in describing ecosystem services is a requirement if these values are to be captured by ecosystem accounting methods. This has led to the development of a Common International Classification of Ecosystem Services (CICES) by the European Environment Agency (EEA). CICES identifies three categories of ecosystem services—provisioning, regulation and maintenance, and cultural.
In the current study, the final benefits scheme, proposed by Fisher et al. [48] was used to measure the economic values of ecosystem services in the oil palm-dominated landscapes being investigated. As the focus of this study is at the landscape scale, where there are other landscape elements besides oil palm plantations, the final benefits provided by ecosystem services associated with these landscapes have been grouped into the four categories provided by the TEEB typology. These final benefits can be classified as private or public goods. All farming activities undertaken in these oil palm-dominated landscapes are at a local scale and the resulting ecosystem services benefit farmers as a private good. Other ecosystem services, whose property rights are less well-defined (e.g., those associated with water, soil, and carbon), and which contribute to regional or global ecosystem services, are considered as a public good.

3. Study Area and Methods
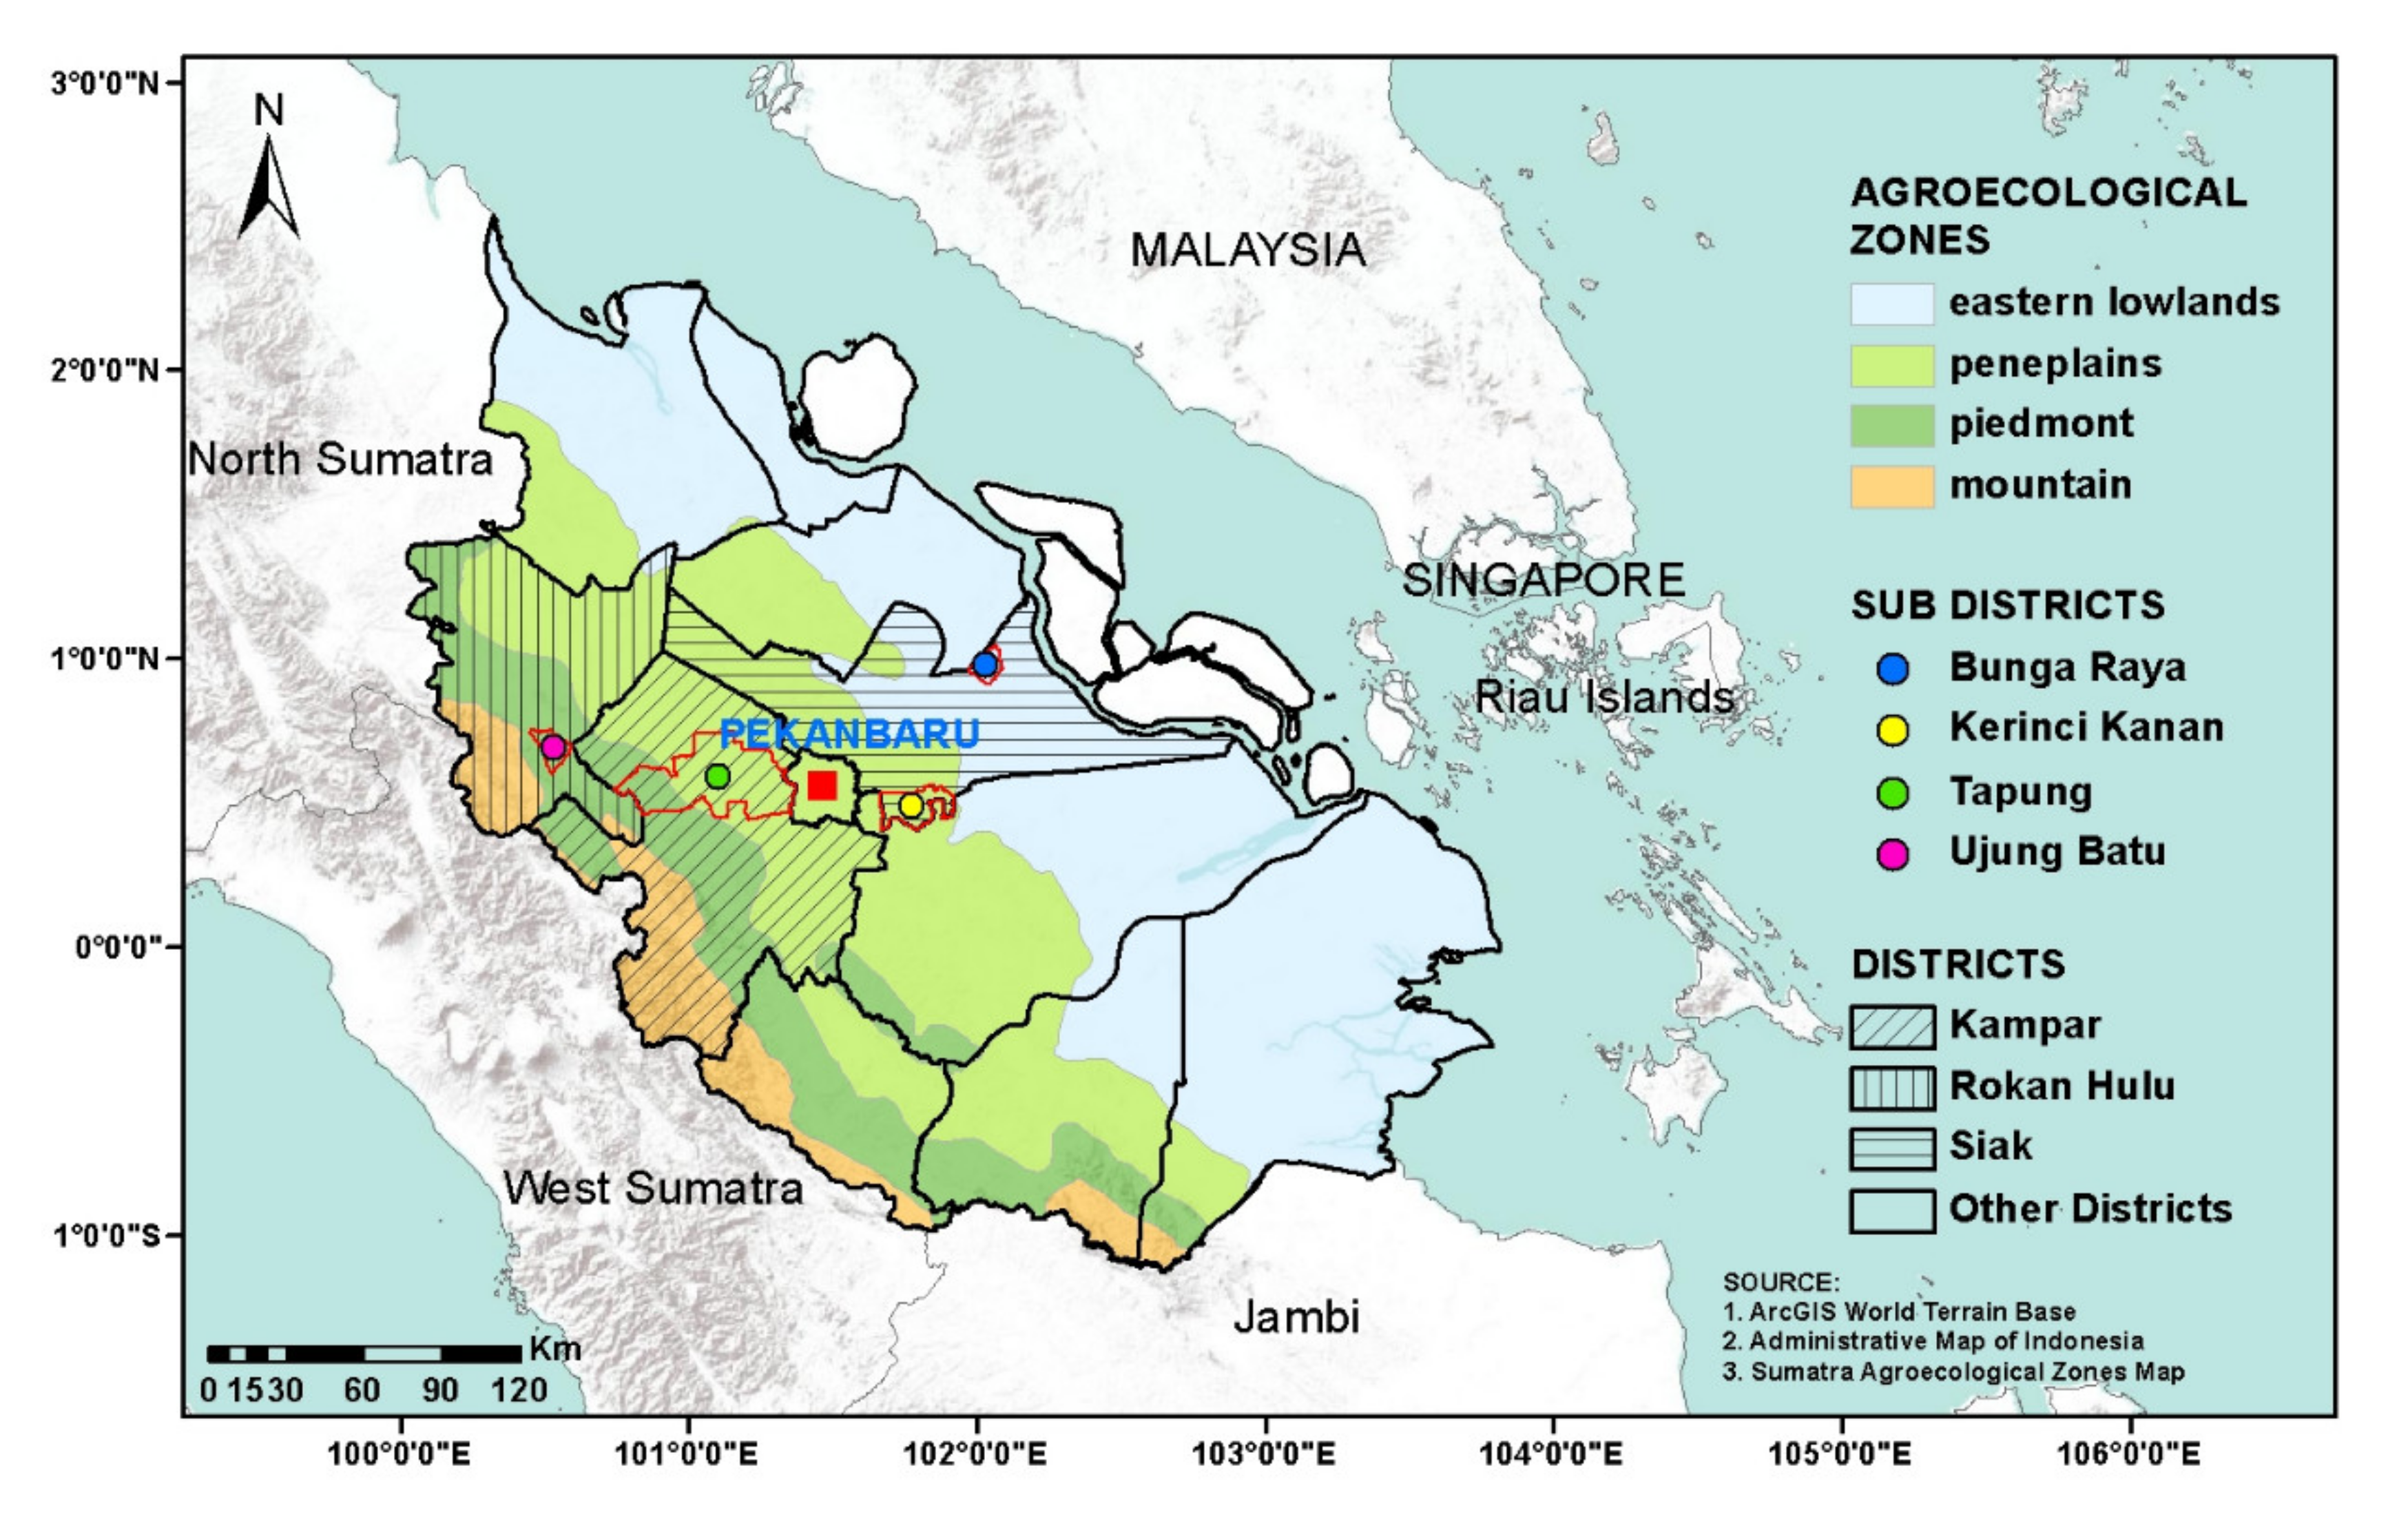
3.1. Study Area

The Riau Province, in Sumatra, covers approximately 8.9 million ha, as shown in Figure 1. Much of the province comprises either fairly flat or undulating, hilly terrain [53,54]. Coastal peat swamps extend inward for about 240 km and also cover large parts of the Rupat and Bengkalis Islands, which are part of the Riau Province. Myers et al [55] included Sumatra as part of the Sunda Lowland biodiversity hotspot, and UNESCO declared the tropical forests of Sumatra a world heritage environment in 2011.
Riau was selected for this research because it has the largest oil palm area of any of Indonesia’s 34 provinces and because of the lead author’s familiarity with the region’s agricultural economy. Oil palm plantations in the Riau Province account for 21% of the national oil palm estate. All forms of cultivation account for 49% of land in the province [56], the majority (94.7%) of which are some form of plantation [57]. Oil palm is the major estate crop in terms of area and production. Its area increased from 1,673,500 ha (2008) to 2,489,957 ha (2018), which resulted in a 33.3% increase in the tonnage of palm fruits harvested [58]. In 2018, the total area of coconut and rubber—the next most important plantation crops after oil palm—were 422,595 ha (17% of oil palm area) and 484,071 ha (19.5%), respectively [58]. Forest cover in Riau has declined from 63% (1990s) to 25.4% in 2018 [58,59]. Simultaneously, the locus of oil palm cultivation shifted from the west of the province to the east, where most peatlands are located. The loss of forest has been ascribed to inward transmigration and a shift in preference from traditional agriculture to plantations, mainly oil palm and rubber. Non-plantation crops are dominated by dryland and wetland paddy rice (93,755 ha cultivated; 365,293 t harvested), and maize (12,231 ha; 30,765 t). The areas of all other crops in 2018 was < 3000 ha and, apart from cassava, production was less than < 7000 t in total [58,59].
The province’s population was 6,971,750 in 2019 [60]. The national transmigration program (TMP) has strongly influenced population and land use in Riau. Under the TMP, large numbers of people migrated from Java between 1968 and 1988 to facilitate development in these sparsely populated areas, such as Sumatra, Borneo, and Irian Jaya [61], reduce population pressure in Java, and promote national integration and security [62]. Transmigrants were given land to grow crops that were key to the national economy, such as oil palm, and the program has been considered as an important driver of forest loss [63]. Susanti and Burgers [64] discuss the chronology of the stages in the national transmigration project. They noted that the stage that targeted oil palm plantations in the 1980s led to an increase of 35,626 transmigrant households in Riau between 1979 and 1983, which reached a peak of 20,000 new households in 1988–1989 in Riau. In total 142,598 transmigrant households were established in Riau between 1969 and 2013 [60]. Some of these transmigrants came to work in the forestry sector in the early 1970s and then shifted to oil palm cultivation as forestry declined. This added to the rapid increase in oil palm plantations in Riau. This in turn triggered another influx of spontaneous, rather than planned, migrants [61]. Based on the 2010 national census, about 15.5 million transmigrants have entered Sumatra, of which 1.4 million are in Riau. Two of the four villages sampled have significant transmigrant populations (Bunga Raya and Kerinci Kanan), as shown in Figure 1.

3.2. Sampling

A detailed “interview” schedule containing closed and open questions, as shown in Supplementary Data 1, was designed to collect livelihood information for individual households involved in oil palm cultivation. This interview schedule was part of a project with broader aims than those covered in this paper [26], and the responses and information used and reported on in this paper are only those which can be used to identify and value ecosystem services. The main categories of information collected were the physical characteristics of houses for wealth ranking, basic household structure and demographics, agricultural practices including valuations of inputs and outputs, non-farm activities, and issues and problems faced by households.

Sampling Frame

The four study sites (hereafter called “villages”) where oil palm cultivation dominates economic activities, as shown in Table 1, were selected for detailed investigation using a purposive sampling frame based on the agro-ecological zonation of the Riau Province [65]. Three agro-ecological zones (AEZs)—the eastern lowlands, peneplains, and piedmont, as shown in Figure 1—were sampled along a broad west–east transect. The mountain agro-ecological zone in western Riau was not sampled, as oil palm plantations are infrequent along the mountainous spine of Sumatra.
Interviews were conducted in Bahasa Indonesian between December 2012 and March 2013. A household was defined as a farming family that received some of its income from its own oil palm plantation. Households that only provided labour to other oil palm plantations and did not own any land or households that only owned land in a village elsewhere were excluded from the study.
A two-stage convenience sampling scheme was used to select the villages and households. A convenience sampling scheme is a non-probabilistic sampling scheme where respondents are selected due to their convenience in terms of accessibility and proximity to the researcher [66,67]. The first stage was to identify the study sites in the three AEZs, and then, secondly, to select households in the villages. In the first stage, we determined areas in each AEZ that appeared to be well suited for the research along a broad west–east transect from satellite imagery and topographic maps. We visited these areas with a contact from the Riau Development Bank and spoke to leaders in the area before deciding which villages to choose. Important considerations in these conversations were land-use history, migration history, the presence of smallholders working their own plantations, and willingness to allow us to conduct the research. We selected households in conjunction with a local contact in each village using a broad definition of the types of households that we wanted to interview,(i.e., farming families who made at least part of their living from oil palm activities through either owning land on which oil palm was grown, by selling oil palm fruit, or by working on an oil palm plantation or a neighbour’s farm).
This type of scheme was chosen because of two logistical constraints. First, heads of households were generally only available in the evenings and, given the length of time it took to interview them (approximately two hours), only one interview could be conducted each day. Secondly, access to villages was an issue due to the wet-season road conditions. In total, 62 households that had active roles in oil palm production across the four villages were sampled. The sampling scheme and questionnaire were evaluated and approved by the Flinders University Social and Behavioural Sciences ethics committee (Project #5878, approved 31 October 2012). Permission to undertake the research was also provided by the relevant provincial authorities in Indonesia.

3.3. Data Collection and Analysis

Data from the household interviews were used to identify and value ecosystem services and dis-services in the oil palm-dominated landscapes in which they were located. Some services were identified by the researchers and included in the pilot survey of the interview schedule, while others were added after the pilot survey. These services, in particular provisioning services, were mostly addressed with closed questions. Other ecosystem services were sometimes identified, through farmers’ responses to open questions.
The total economic value of ecosystem services and dis-services was calculated by adding the market and non-marketed values of ecosystem services as follows:
EStotal = (∑ ESmarket + ∑ ESnon-market) − ∑ ESdis-services
where EStotal is the net total economic value (TEV) of all ecosystem services and dis-services measured, ∑ ESmarket is the sum of the individual values of all ecosystem services measured that have market values, ∑ ESnon-market is the sum of the individual values of all ecosystem services measured that do have market values, and ∑ ESdis-services is the sum of the individual values of all ecosystem dis-services measured.
The market value of the ecosystem services, including the economic value of the provisioning services, is that obtained by the household in the market. This included all annual and perennial crops and livestock. Non-market values were used for regulating and cultural ecosystem services. The key regulating services identified in this work were water regulation, soil erosion (as a dis-service), and carbon storage. Following the research conducted by Comte et al., in oil palm plantations in Indonesia, water regulation was estimated from groundwater recharge [68]. Using the amounts of soil lost under different aged plantations, soil erosion was valued following the procedure outlined by [69]. Following the procedure outlined by [70], carbon storage was calculated from above-ground biomass carbon and priced using historical carbon trading data. Cultural ecosystem services exist in these oil palm dominated-landscapes in terms of the local beliefs related to forest protection, though there was only one example in the research—a sacred forest grove in Tapung—which was valued using a surrogate price, based on the average land price for oil palm plantations.
The identified ecosystem dis-service (soil erosion) involved both trade-offs, due to the conversion of forests and other types of agriculture to oil palm landscapes (e.g., reductions in production from other land uses and losses in biodiversity), and the dis-services that are generated by converting forest to oil palm (e.g., disruption to the water cycle, increased soil erosion, and decline of cultural ecosystem services). These appear as negative values on the balance sheet of total economic value.

3.4. Economic Valuation of Ecosystem Services

The economic valuations of the ecosystem services identified in the interviews were accomplished by using direct and indirect methods. Direct estimation is applicable to any ecosystem services that can be sold into the market, while indirect valuation is used for ecosystem services that are not traded in the market [71,72]. Indirect valuation used avoided cost and replacement cost methods; for example, by assessing regulating services that allow society to avoid costs that would have been incurred in the absence of these services [71].
Direct valuation was used to estimate the value of provisioning services as they have real market prices. It was used for oil palm fruits, all other annual and perennial crops, timber and non-timber forest products, and livestock. The economic value of associated provisioning services was estimated using the total potential income of the households interviewed in each village per hectare per year. Farm gate prices for fresh oil palm fruit bunches (FFBs) were used to estimate their provisioning service value. The original prices and values in Indonesian Rupiah (IDR) were converted to US dollars (USD) at the average conversion factor for 2013 (USD 1 = IDR 10,451 [73]), to allow for changes in economic value over the period of sampling. The economic value of all provisioning services was obtained by adding the potential income received by farmers per hectare per year. When area data were not provided by the farmers, per-hectare unit measurements provided by the Directorate General of Estate Crops [74] were used. The costs of investments made in agricultural production (e.g., fertilizers, pesticides and labour) were not subtracted from the valuations.
Issues raised by households in the interviews enabled three regulating services to be identified. Water regulation was defined in this study as groundwater recharge (i.e., annual precipitation minus evapotranspiration, runoff, and interception). An assumption made here was that all the water infiltrating into the soil in oil palm plantations was either used by the trees, was accounted for in evapotranspiration, or was either runoff or groundwater recharge. Annual rainfall data for 2012 [58] were obtained for the stations closest to the four villages. The evapotranspiration rates used were for 5- to 25-year-old oil palms [75,76], which is a similar range of ages of the oil palm plantations owned by the farmers interviewed. The average annual runoff was estimated to be 25% of the total annual rainfall [68,75]. An interception rate of 17% precipitation was used [68], although this varies with tree age and rainfall intensity. The price of water used was USD 0.72 kilolitre−1, the price charged by the provincial water company in Pekanbaru.
Carbon storage was also quantified and valued. Two measurements of carbon sequestration in oil palm plantations were used to calculate available carbon stock in oil palm plantations: CO2 fixation in oil palm plantations [70] to calculate carbon stock available in oil palm plantations grown in mineral soils which are dominant in Ujung Batu, Tapung, and Kerinci Kanan; aboveground biomass carbon in oil palm located on the organic-rich soils in peat swamp [5], which dominate Bunga Raya. The average monthly carbon price for 2013, EUR 4.36/tonne [77], was used and converted to USD using the average monthly exchange rates for 2013 (EUR 1 = USD1.328).
The market values of soil lost through water erosion (as a dis-service) were calculated by multiplying estimates of soil eroded (in Mg ha−1 year−1) in each village by the local market price of soil. Soil water erosion rates for oil palm plantations less and greater than 10 years old were obtained from Hartemink [78]. Soil is not a traded agricultural commodity in Riau, but there is a market for soil in the construction sector in Pekanbaru—the provincial capital. The average price of soil in this market for 2014—USD 3.86 Mg−1—was used.
The only cultural ecosystem service in the oil palm-dominated landscapes studied was a protected sacred grove of trees in Tapung village. It was included as a cultural ecosystem service because it provided spiritual non-material benefits, including a sense of place and belonging to the indigenous communities that maintain it. It may also provide recreational opportunities to a wider range of people [79,80,81]. The cultural services it provided were quantified on the basis of the argument that its value can be measured since it can be expressed in human action [51] using an avoided cost method—the conversion cost using the price of forest land if it had been converted to oil palm. To do this, the average sale price of oil palm plantations in the Riau Province at a productive age (average tree age = 7.5 years), was obtained from plantation sales advertised online. This was considered as a “shadow price” and was divided by 25, the assumed opportunity cost which was used as the proxy production period of individual oil palm tree, based on discussions with farmers during the interviews in Riau.

4. Results

4.1. Identification of Ecosystem Services in the Oil Palm-Dominated Landscapes Studied

Some ecosystem services were identified by farmers during the interviews, while others were framed as part of the interview schedule. However, even after 62 detailed interviews, farmers did not identify all of the ecosystems services that have been associated with oil palms in the research literature. Table 2 provides a comprehensive list of both (i.e., identified or not identified in the interviews), and categorises them into provisioning, regulating, habitat, and cultural and amenity services, by following the TEEB typology.
In terms of the smallholders interviewed, the most important feature of provisioning services in oil palm landscapes was their ability to provide cash incomes to households. Oil palm is a perennial crop and FFBs are harvested twice a month year-round. Harvesting starts two to three years after planting and the trees are considered to be most productive when they are 9–15 years old [82]. Oil palm fruits can be processed for crude palm oil (CPO) and palm kernel oil, for a range of consumer and industrial products, and can also be processed as a fibre. Other provisioning ecosystem services directly related to oil palms include palm fronds, which are used for roofing thatch and as fodder for cattle [83,84]. Oil palm fronds comprise approximately 70% fibre, 22% nitrogen, and small proportions of crude proteins and ether extracts which make them a good source of roughage for ruminants [85]. Old oil palm trunks can be used in the production of compressed wood and bioethanol [86,87], though this was not identified by smallholders in the current study. This may be due to the absence of replanting stages in the areas studied.
Other provisioning services generated from these landscapes were derived from other crops and livestock. Beyond oil palm, the other main crops identified by households were rubber, areca (betel) nuts, cacao, rice, bamboo, and coconut. The main forms of livestock, both by number and value, were cattle, goats, and chickens. Most of the crops and livestock listed by households were sold in markets as additional income sources, though some crops and livestock were used within households, (e.g., bamboo for building construction, chickens for eggs and meat, and vegetables).
Six households in Tapung had integrated ruminant production into oil palm production, which is in line with Devendra’s [83] observation that oil palm plantations can play a role in integrated oil palm–ruminant systems. These farms kept cattle and goats on feedlots located between oil palm plantations, and integration was enhanced by the use of palm fronds as additional feed for cattle and the use of dung as manure. The intercropping of other crops with oil palms was not observed in any of the four villages investigated. Other plantations crops (e.g., rubber, areca nuts, and cacao), were in different areas to palms, and vegetables were exclusively grown in kitchen gardens.
While it is known that other regulating services (e.g., air quality regulation, water and climate regulation, and habitat provision), play a crucial role in environmental regulation by oil palm-dominated landscapes [15,88], many were not identified by respondents, as shown in Table 2.

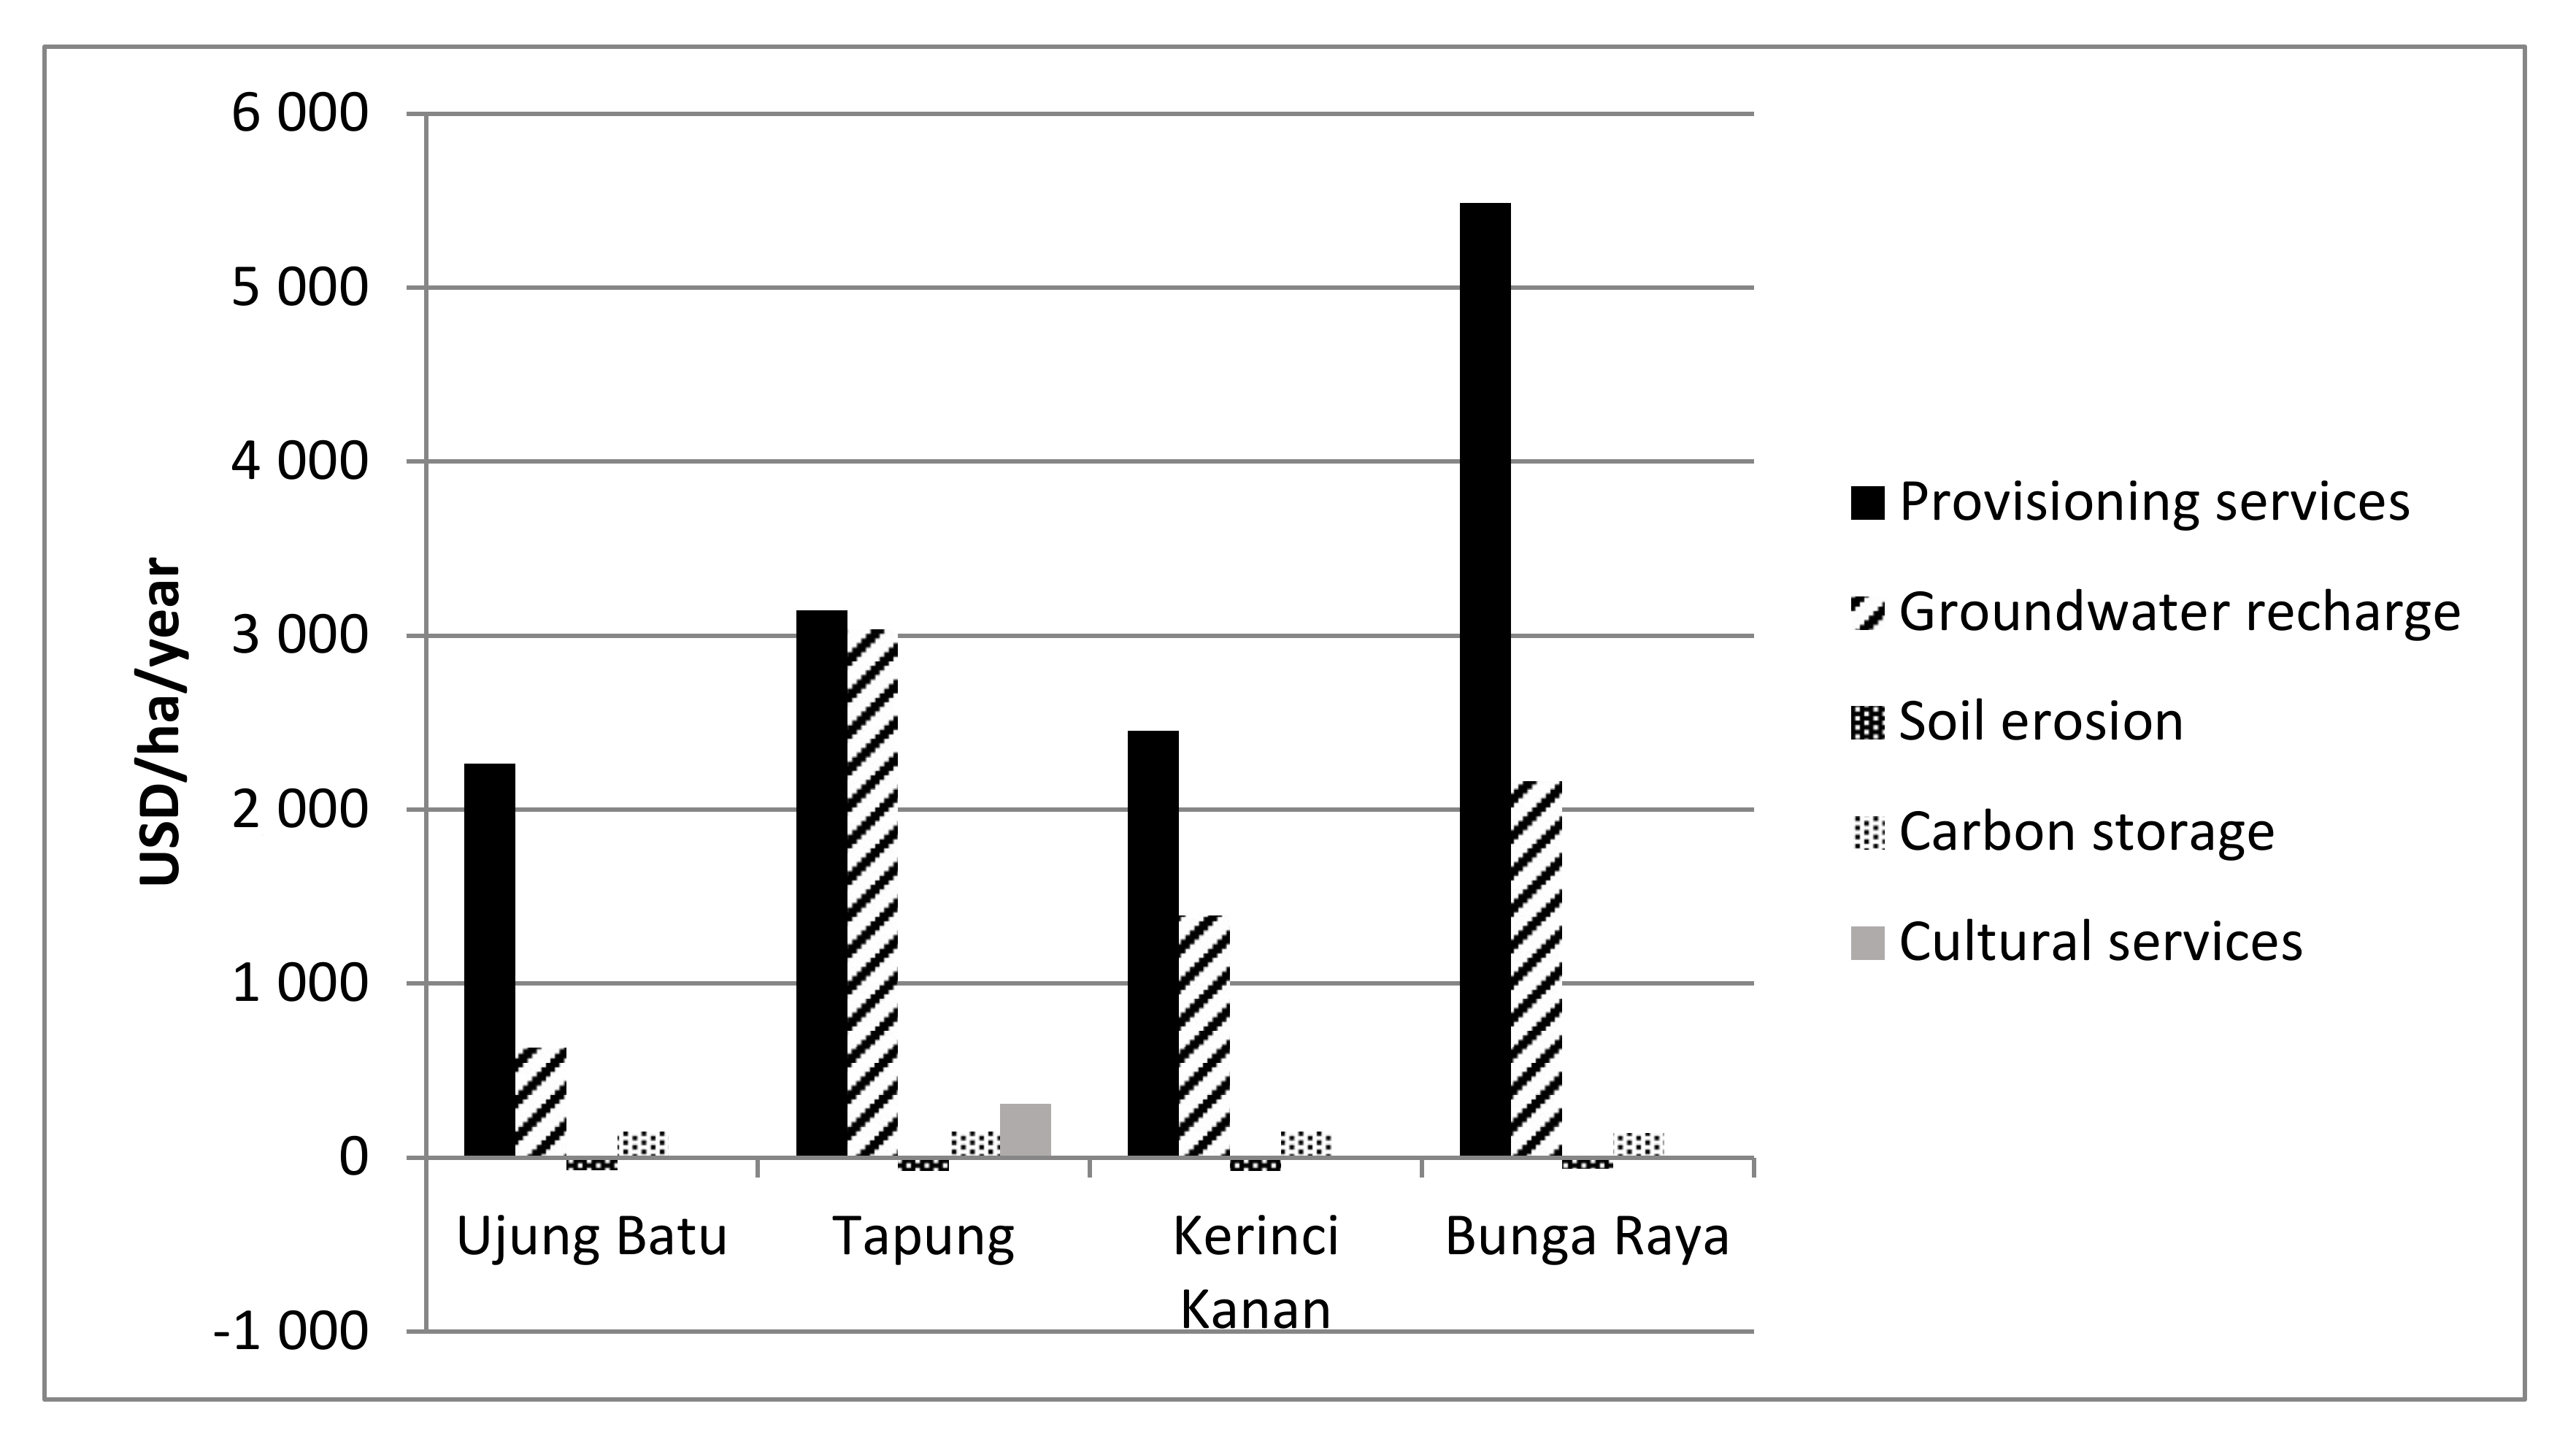
4.2. Economic Value of Ecosystem Services in Four Villages

Estimates of the TEVs of the ecosystem services for the four villages were calculated from the information collected during the household surveys, as shown in Table 3. The average potential TEV of all agricultural activities in landscapes dominated by oil palm was USD 6520 ha−1 year−1, with a range of USD 2970–7729 ha−1 year−1.
The highest proportions of the TEVs for each village were generated by provisioning services. The average TEV of all provisioning services was USD 4331 ha−1 year−1 (range = USD 2263–5489 ha−1 year−1). The highest proportion of provisioning services in terms of value was from oil palm fruits, with an average TEV of USD 1707 ha−1 year−1 (range = USD 1315–2043 ha−1 year−1). Other commodities that offered significant economic value included rubber (USD 170–1569 ha−1 year−1), areca nuts (USD 0.02–1594 ha−1 year−1), and cacao (USD 240–738 ha−1 year−1), as shown in Table 3.
Across the four study areas, non-marketed ecosystem services contributed, on average, USD 1852 ha−1 year−1 (range = USD 707–3110 ha−1 year−1). This component accounted for nearly a quarter (23.8%) of the TEV for Ujung Batu, and just over half (52.1%) in Tapung, shown in Table 3. These high proportions were not surprising, as most of these ecosystem (regulating and maintenance and cultural) services are not available in the marketplace.
Water is a basic requirement for all crops, making water regulation and its economic valuation a critical parameter in ecosystem services investigations. The value of water regulation in the villages studied ranged between USD 631 and 3038 ha−1 year−1, with an average of USD 1806 ha−1 year−1, as shown in Table 3. Groundwater recharge was noticeably higher in Tapung than the other three villages, which can be accounted for by its high annual rainfall totals and more porous soils than the other villages.
In Tapung, there was a 200 ha patch of remnant local forest located in the community-owned, but company-managed, oil palm plantations. It is deemed sacred by Tapung residents, which means it can be considered a common pool forest resource claimed by the local people and, in the context of this study, provides a cultural and amenity service. Its value was estimated at USD 309 ha−1 year−1, as shown in Table 3.
The ecosystem dis-service that impacted these landscapes most is soil erosion, which is often associated with the conversion of tropical forests to oil palm plantations. The estimated soil erosion incurred cost on average is USD −73 ha−1 year−1. It was at its lowest (USD −63 ha−1 year−1) in Bunga Raya in the peat swamps of eastern Riau, and its highest (USD −78 ha−1 year−1) in the hilly terrain on Kerinci Kanan, as shown in Table 3.
The TEVs of the ecosystem services are illustrated in Figure 2. This figure exhibits clearly the marked differences between marketed (provisioning) and non-marketed (regulating and maintenance, and cultural and amenity) services in all villages except Tapung. These differences are probably lower than Figure 2 indicates because not all non-marketed services were identified by farmers and, therefore, were not included in the calculations. Groundwater recharge is high in all villages except Ujung Batu, while the economic values of soil erosions, carbon storage, and cultural services are relatively low compared to both provision services and groundwater recharge.

5. Discussion

5.1. Ecosystem Services Associated with Oil Palm Landscapes

This research recognises that oil palm-dominated landscapes provide many ecosystem services that benefit humans, despite the often-heralded changes in biodiversity brought about by forest conversion for oil palms, as shown in Table 2.
Industrial-scale monoculture farming practices are used to cultivate oil palm [89,90], regardless of whether it is grown on estates by companies (which is not the focus of this paper) or by smallholders who supply oil palm fruit to companies [91]. It can be argued that oil palm-dominated landscapes not only provide products for the market, but that in doing so, support the livelihoods of many growers and labourers. This study argues that these benefits derive not just from oil palm, but also from other crops and livestock that share the landscapes with oil palm plantations. The research, therefore, confirms an earlier study that contends that smallholders in Indonesia grow a variety of tree crops to hedge against fluctuations in income from the main crops they grow [92]. Because of the substantial amounts of liquidity among farmers in oil palm-dominated landscapes, increasing the local ruminant population is another livelihood diversification strategy [26,84] and one that also provides a return to the landscape through organic manure to manage soil fertility [26,93,94]. Diversification into other tree crops, either by planting new trees or retaining established plantations, is more common than diversification into ruminants among the households researched. All of the villages (62.9% of households in total) grew coconuts, as shown in Table 3. Areca nuts were grown by 14 households (22.5% of all households) and cacao by eight (12.9%) in three villages. Nineteen households in Bunga Raya and Tapung grew rubber, while three households in Tapung grew bamboo, as shown in Table 3. These statistics can be compared to the six households in Tapung, as shown in Table 3, that had developed livestock rearing in addition to oil palm cultivation.
The expansion of agriculture often results in changes to ecosystem services, and in the context of this study, the expansion of oil palm cultivation in these landscapes dovetail with arguments that have been made about other types of agriculture [95,96]. According to this research, stands of oil palm provide some positive regulating and maintenance services within broader landscapes, such as water regulation and carbon storage. However, the high number of smallholder oil palm plantations in these oil palm-dominated landscapes has meant that the natural forests that existed between other forms of agriculture (e.g., rubber plantations), which would have provided a range of cultural and amenity services such as sacred forest groves, have generally been lost [97]. Provisioning services and regulating services, such as water regulation, carbon storage, and soil erosion change as forests and former farmland are converted oil palm-dominated landscapes. The magnitude and direction of these changes depends on whether oil palm is replacing native forest, cropland, or another type of plantation (e.g., rubber), and the physical environment. For example, changes in the provision of ecosystem services when oil palms replace rice or forest on the almost level peatlands of eastern Riau will be significantly different to the changes experienced in western and central Riau when upland forest, rubber plantations, or dryland paddy rice on sloping terrain and mineral soils are replaced by oil palms.
Six households in Tapung provided some evidence of ruminant production being integrated into oil palm production, which is in line with the observation that oil palm plantations can play a role in integrated oil palm-ruminant systems without harming the environment [80]. Integrated systems have been shown to decrease costs and maximise land use, and thereby increase incomes from both the oil palm and livestock elements of the system [94,98]. The integration of these elements involved cattle and goats being kept in feedlots between stands of oil palms, with palm fronds being used as additional feed for cattle, and animal dung being used to manure oil palms. In other instances, cattle are grazed in plantations [99], with grasses between the rows of trees being grazed. This has the added benefit of reducing weeding costs by 16–40% [91]. Cattle grazing in oil palm-dominated landscapes has been shown to increase biodiversity (of dung beetles) and conserve soils [100]. However, it can also have negative impacts in terms of soil compaction, impaired drainage and damage to trees [93].
Comte et al. [68] evaluated oil palm cultivation practices that affect hydrological processes. Water use by oil palm is difficult to quantify because it depends on the time periods between intra-annual and inter-annual variations in climate. Nevertheless, mean monthly rainfall and potential evapotranspiration have proven the most suitable variables for estimating water supply for oil palm [75]. Carr [76] estimated that the evapotranspiration rate of mature trees is around 4–5 mm/day.
As is the case with other man-made landscapes, oil palm cultivation often brings about environmental degradation [100] and therefore impacts regulating and maintenance services. Oil palm has triggered the loss of tropical forests in South East Asia, which has in turn led to substantial losses of biodiversity [21]. One of the biggest threats posed by oil palm agriculture to biodiversity relates to large animals, such as elephants, tigers, rhinoceroses, and orangutans. This effect is inevitable, and common to any agricultural expansion that leads to massive habitat conversion [41]. Foster et al. [22] summarise biodiversity loss in terms of reduction in species richness and total abundance in oil palm plantations compared to other habitats. Yet, they have also shown that oil palm plantations provide some positive outcomes; e.g., bee species richness is higher in oil palm plantations than native tropical forests and oil palm plantations have a greater number of dung beetle communities in riparian reserves within oil palm plantations than in surrounding logged forests [101]. These are not flagship species, such as tigers or elephants, and they do not attract the same attention that the losses of flagship species do.
A regulating dis-service identified in these landscapes was soil erosion by water. Oil palm has been implicated in increasing erosion rates when forest is cleared to create plantations as this exposes soils to intense rainfall before ground cover is re-established [102]. In general, accelerated soil erosion is restricted to young oil palm plantations; however, as trees mature, soil erosion still occurs, and the rates may continue to increase depending on slope properties and soil management practises [78]. Soil erosion also often leads to a reduction in soil nutrient levels [68,78]. The latter author has estimated that soil erosion rates range from 7 to 21 Mg ha−1 year−1. Estimates of the value of soil erosion were based on proxy values based on the market price of soil. However, a better estimation should include values related to crop yield decline due to soil loss and the value of environmental externalities such the siltation of rivers and oceans (potentially reducing biodiversity, fish catch, etc.).
Oil palm landscapes also provide cultural services. When large areas of forest have been converted to oil palm, these services may originate from logged forests or degraded land and not from primary forests [22]. However, the opposite is also true, as is the case in this study where, in Tapung village, primary forest adjacent oil palm plantations have been kept intact and provide cultural services. The preserved forest here is considered sacred by the people who live in the surrounding oil palm plantation landscape [79]. It has a direct impact on human wellbeing, providing recreational, spiritual, and religious benefits. It is, in some ways, similar to the concept of land sparing, where blocks are reserved for biodiversity conservation and are interspersed within homogenous farmed landscapes [103].
The respondents could not identify some valuable ecosystem services that are relevant to oil palm due to the lack of awareness amongst these respondents. For example, any impacts on habitat provision, pollinators, species abundance, and richness, etc., were not identified, due to lack of understanding by the households in this context.

5.2. Economic Value of Ecosystem Services in Oil Palm Landscapes

The economic value of provisioning, regulating, and cultural services in the four oil palm-dominated landscapes in Riau was estimated. Revenue from each provisioning service was generated from the marketable commodities, while the costs for non-marketed services were generated by the methods outlined in Section 3.4.
The research shows that oil palm generates the highest potential value in terms of per-hectare land use (USD 1315–2043 ha−1 year−1) compared to other commodities, as shown in Table 3, although some other crops generate reasonable returns per unit area. These include rubber (USD 1569 ha−1 year−1) and areca nut (USD 1594 ha−1 year−1), as shown in Table 3. Such crops could provide significant alternatives to oil palm, and the returns from these provisioning ecosystem services underline their importance for household diversification strategies. However, as with all crops and livestock options, the possibility of growing any particular crop, or rearing specific animals, depends on factors such as soil properties, water availability, land-use histories, market opportunities and farmer preferences.
The mean TEV of the oil palm-dominated landscapes sampled was USD 6520 ha−1 year−1, with the highest value being in Bunga Raya and the lowest in Ujung Batu, as shown in Table 3. If these estimates of total economic value are compared to claims about the economic value of the Riau forest estate in their original condition (i.e., various types of humid tropical lowland forests), they are higher than the estimates of the TEV of ecosystem services in tropical forests, which range from USD 5264 to 5382 ha−1 year−1 [88,104]. Furthermore, the average economic value of provisioning services in this study (USD 4331 ha−1 year−1) is much larger than that of the provisioning services of “unconverted” tropical forests, which consists of food, water, raw materials, and genetic and medicinal resources, which has been estimated at USD 1828 ha−1 year−1 [88].
Some of the differences in estimates that have arisen between the findings of this study and previous studies can also be ascribed to differences in the assumptions made when calculating values by different researchers. This does bring into question the issue of the confidence limits of the values of regulating and maintenance, and cultural and amenity ecosystem services, as well as dis-services from this study, compared to more accurately estimated provisioning services. Nevertheless, the estimates can be considered indicative of values that the services provide. For example, the average economic value of groundwater recharge is about USD 1806 ha−1 year−1. On the one hand, this is much higher than the average value of water regulation in tropical forests (USD 8 ha−1 year−1, estimated by Costanza et al. [104] and USD 342 ha−1 year−1, estimated by de Groot et al. [89]). While, on the other hand, the value of carbon storage quantified in this study (USD 147 ha−1 year−1) was much lower than the USD 2044 ha−1 year−1 ascribed to the average levels of climate regulation provided by tropical forests [88,104].
Soil erosion in tropical forest has been valued at USD 337 ha−1 year−1 [104], a cost that is much larger than the dis-services of soil erosion from oil palm calculated in this study, which was, on average, USD 71 ha−1 year−1 as compared to the much lower estimate of USD 15 ha−1 year−1 by de Groot et al. [88]. This difference is likely due to the generally subdued topography of oil palm-dominated landscapes in Riau compared to the wider range of topographic situations under which tropical forests occur, which include major mountain chains and thin, mineral soils. In addition, established oil palm plantations provide a better ground cover than many annual crops that are extensively grown in the tropics, such as cassava and maize. Nonetheless, this study indicates that the negative economic value of soil erosion is not very large in Riau and that the overall global averages for the tropics needed to be considered carefully when local situations are examined in detail. These observations are supported by some of the statements made by farmers when surveyed, which concur with the observation made by Corley and Tinker [75] that the rapid establishment of ground cover makes oil palm landscapes relatively resistant to erosion compared to many other types of agricultural crops [75]. This was accentuated in the villages studied by the relatively low frequency of manual weed control.
Finally, the use of tropical forest for recreation and cultural activities was estimated at USD 867 ha−1 year−1 [88,104]. This is over double the value assigned to the single example of a small sacred forest in this study (USD 309 ha−1 year−1), but given that there was only one example of a remnant forest in this research, and that this was the only element that could be ascribed as having cultural significance in this study, the comparison is highly tentative.
Tropical forest plantations, such as oil palm, are typically assumed to be poor substitutes for natural forests, particularly in terms of biodiversity conservation, carbon storage, and the provision of water and other goods and services. They are often monocultures that do not appear to invite recreational opportunities or other direct uses. Nonetheless, on the basis of this research, it is believed that oil palm-dominated landscapes have a legitimate place in the sound management of rural landscapes in the humid tropical forest biome. Well-planned oil-palm plantations can alleviate some of the social, economic, and ecological pressures that households face, which in turn exert stresses on natural forests [105]. Utilising these economic benefits must be the key management objective, yet this is hampered by the fact that the economic valuation of ecosystem services in oil palm-dominated landscapes areas has not been carried out thoroughly in the past. In part, this is because the focus has been only on oil-palms and not their contributions to the landscapes that they dominate. Holistic economic valuation might help to facilitate the sustainable management of the many ecosystem services that oil palm-dominated landscapes provide. Such economic valuations could be used in landscape design to enhance the broad provision of ecosystem services, based on sound ecological knowledge [106]. This in turn could further improve smallholder incomes by replacing reliance on unsustainable inputs and by better managing natural resources in order to support and ensure long-term sustainable oil palm cultivation in the face of the current increasing demand for palm oil.

5.3. Limitations of the Study

The high economic values of ecosystem services provided by the oil palm-dominated landscapes illustrated in this study should be used with caution in light of these important caveats:
  • Contemporary market prices were used in the calculations. Therefore, the values assigned to all resources is dependent on the context of the valuation and varies across time and space. For example, if there are changes in the demand and supply of oil palm, the prices will change, as will the valuations.
  • The economic values estimated in this study were derived mostly from data generated from the interviews with smallholders. For example, agricultural commodity prices were based on the respondents’ answers. Prices may vary between villages, districts, and provinces and will largely depend on the cultivation or livestock rearing cycles. Therefore, different samples (villages) may result in different responses.
  • The values of provisioning services do not account for the input costs or variable costs (e.g., capital investments, fertilizer and farm equipment running costs) of the built infrastructure.
  • There may be some plurality in the valuation of ecosystem services in this research that other researchers [48,49,104] have also discovered. This occurred because the MEA categorization of ecosystems services was used.
  • In estimating the economic value of the sacred forest, we used an assumption that the land value of sacred forests equalled the value of land if it was used for oil palm production over 25 years.
  • Part of the interviews allowed farmers to identify ecosystem services. However, because an ecosystem service known to be generated by oil palm cultivation was not identified by a farmer during the interviews does not mean that it is not present; it may not, for instance, seem valuable to the farmer or household or it may be something that would be recognized and valued in another season of the year.
  • All of the calculations for regulating services relied on data from other studies in oil palm plantations. These will not apply exactly to all of the oil palm-dominated landscapes sampled in Riau. For example, the interception rate of 17% precipitation was used in the water balance calculation [68], although it is known that this varies with tree age and rainfall intensity.
  • The average price of soil for construction in Pekanbaru was used in the soil erosion calculation. The real price of soil in agricultural areas, if it were traded, rather than as a construction or garden material in an urban centre, would likely be less than the value used in the calculations in this study. That in turn would make the average values of soil erosion for each village lower. A better estimation would include values related to crop yield decline due to soil loss and the value of environmental externalities, such as the siltation of rivers and oceans (potentially reducing biodiversity, fish catch, etc.).
  • With only one example from the four villages, the arguments for the inclusion and valuation of cultural ecosystems services in this research can only be considered highly tentative.

6. Conclusions

This study shows that oil palm-dominated landscapes provide a range of ecosystem services. Thirteen ecosystem services were identified and valued by smallholders in four villages in oil palm-dominated landscapes in the Riau Province. The economic values of the direct and indirect benefits derived from these landscapes were substantial. The majority of the value, between approximately 47% and 76% depending on the village, was derived from provisioning services. Approximately one quarter (24%) to a half (52%) of the TEV of ecosystem services was provided by four non-marketed ecosystem services identified by smallholders.
This research provides an opportunity for policy responses at the provincial, and probably the national, level in Riau and Indonesia, respectively, that can aid smallholders in developing sustainable and economically viable and diversified landscapes, instead of ones dominated by oil palm. Such diversified landscapes could ensure the income and livelihood security of smallholders and the protection of biodiversity and ecosystem services

Supplementary Materials

The following are available online at https://www.mdpi.com/2073-445X/9/6/194/s1.

Author Contributions

Project conceptualisation, A.F.A., H.S., and A.C.M.; Methodology, A.F.A., H.S., and A.C.M.; Supervision, H.S. and A.C.M.; Validation, A.F.A., H.S., and A.C.M.; Field analysis, A.F.A. and A.C.M.; Valuation A.F.A. and H.S.; Visualisation, A.F.A.; Writing—original draft, A.F.A.; Writing—review and editing, H.S. and A.C.M.; All authors have read and agreed to the published version of the manuscript.

Funding

AFA was funded by DFAT doctoral training award from the Australian government and the Flinders University School of Environment Research Student Top-Up Funds. The supervision costs (A.C.M. and H.S.) were met by the Flinders University Faculty of Science and Engineering.

Acknowledgments

The authors thank the Riau Development Bank for help with identifying villages for sampling.

Conflicts of Interest

The authors declare no conflict of interest.

References

  1. Carlson, K.M.; Curran, L.M.; Asner, G.P.; Pittman, A.M.; Trigg, S.N.; Adeney, J.M. Carbon emissions from forest conversion by Kalimantan oil palm plantations. Nat. Clim. Chang. 2012, 3, 283–287. [Google Scholar] [CrossRef]
  2. Danielsen, F.; Beukema, H.; Burgess, N.D.; Parish, F.; Brühl, C.A.; Donald, P.F.; Murdiyarso, D.; Phalan, B.E.N.; Reijnders, L.; Struebig, M.; et al. Biofuel plantations on forested lands: Double jeopardy for biodiversity and climate. Conserv. Biol. 2009, 23, 348–358. [Google Scholar] [CrossRef]
  3. Harris, N.L.; Brown, S.; Hagen, S.C.; Saatchi, S.S.; Petrova, S.; Salas, W.; Hansen, M.C.; Potapov, P.V.; Lotsch, A. Baseline Map of Carbon Emissions from Deforestation in Tropical Regions. Science 2012, 336, 1573–1576. [Google Scholar] [CrossRef]
  4. Koh, L.P.; Wilcove, D.S. Is oil palm agriculture really destroying tropical biodiversity? Conserv. Lett. 2008, 1, 60–64. [Google Scholar] [CrossRef]
  5. Murdiyarso, D.; Hergoualc’h, K.; Verchot, L.V. Opportunities for reducing greenhouse gas emissions in tropical peatlands. Proc. Natl. Acad. Sci. USA 2010, 107, 19655–19660. [Google Scholar] [CrossRef] [PubMed] [Green Version]
  6. World Bank. World Bank National Accounts Data. 2019. Available online: https://data.worldbank.org/indicator/NV.AGR.TOTL.ZS (accessed on 13 April 2020).
  7. Rist, L.; Feintrenie, L.; Levang, P. The livelihood impacts of oil palm: Smallholders in Indonesia. Biodivers. Conserv. 2010, 19, 1009–1024. [Google Scholar] [CrossRef]
  8. Sayer, J.; Ghazoul, J.; Nelson, P.; Boedhihartono, A.K. Oil palm expansion transforms tropical landscapes and livelihoods. Glob. Food Secur. 2012, 1, 114–119. [Google Scholar] [CrossRef]
  9. Klasen, S.; Meyer, K.M.; Dislich, C.; Euler, M.; Faust, H.; Gatto, M.; Hettig, E.; Melati, D.N.; Jaya, I.N.S.; Otten, F.; et al. Economic and ecological trade-offs of agricultural specialization at different spatial scales. Ecol. Econ. 2016, 122, 111–120. [Google Scholar] [CrossRef] [Green Version]
  10. Tilman, D. Global environmental impacts of agricultural expansion: The need for sustainable and efficient practices. Proc. Natl. Acad. Sci. USA 1999, 96, 5995–6000. [Google Scholar] [CrossRef] [Green Version]
  11. Jelsma, I.; Schoneveld, G.; Zoomers, A.; Van Westen, A.C.M. Unpacking Indonesia’s independent oil palm smallholders: An actor-Disaggregated approach to identifying environmental and social performance challenges. Land Use Policy 2017, 69, 281–297. [Google Scholar] [CrossRef]
  12. Schoneveld, G.C.; Van Der Haar, S.; Ekowati, D.; Andrianto, A.; Komarudin, H.; Okarda, B.; Jelsma, I.; Pacheco, P. Certification, good agricultural practice and smallholder heterogeneity: Differentiated pathways for resolving compliance gaps in the Indonesian oil palm sector. Glob. Environ. Chang. 2019, 57, 101933. [Google Scholar] [CrossRef]
  13. Laurance, W.F. Forest destruction in tropical Asia. Curr. Sci. 2007, 93, 1544–1550. [Google Scholar]
  14. Dislich, C.; Keyel, A.C.; Salecker, J.; Kisel, Y.; Meyer, K.M.; Auliya, M.; Barnes, A.D.; Corre, M.D.; Darras, K.F.A.; Faust, H.; et al. A review of the ecosystem functions in oil palm plantations, using forests as a reference system. Biol. Rev. 2016, 92, 1539–1569. [Google Scholar] [CrossRef] [PubMed]
  15. Labrière, N.; Laumonier, Y.; Locatelli, B.; Vieilledent, G.; Comptour, M. Ecosystem Services and Biodiversity in a Rapidly Transforming Landscape in Northern Borneo. PLoS ONE 2015, 10, e0140423. [Google Scholar] [CrossRef] [Green Version]
  16. The Intergovernmental Science-Policy Platform on Biodiversity and Ecosystem Services. Global Assessment Report on Biodiversity and Ecosystem Services of the Intergovernmental Science-Policy Platform on Biodiversity and Ecosystem Services; Brondizio, E.S., Settele, J., Díaz, S., Ngo, H.T., Eds.; IPBES Secretariat: Bonn, Germany, 2019. [Google Scholar]
  17. Millennium Ecosystem Assessment. Ecosystems and Human Well-Being: Synthesis; Island Press: Washington, DC, USA, 2005. [Google Scholar]
  18. Abram, N.K.; Meijaard, E.; Ancrenaz, M.; Runting, R.K.; Wells, J.A.; Gaveau, D.; Pellier, A.-S.; Mengersen, K. Spatially explicit perceptions of ecosystem services and land cover change in forested regions of Borneo. Ecosyst. Serv. 2014, 7, 116–127. [Google Scholar] [CrossRef] [Green Version]
  19. Saswattecha, K.; Hein, L.; Kroeze, C.; Jawjit, W. Effects of oil palm expansion through direct and indirect land use change in Tapi river basin, Thailand. Int. J. Biodivers. Sci. Ecosyst. Serv. Manag. 2016, 12, 1–23. [Google Scholar] [CrossRef] [Green Version]
  20. Phalan, B.T.; Bertzky, M.; Butchart, S.H.M.; Donald, P.F.; Scharlemann, J.P.W.; Stattersfield, A.J.; Balmford, A. Crop Expansion and Conservation Priorities in Tropical Countries. PLoS ONE 2013, 8, e51759. [Google Scholar] [CrossRef] [Green Version]
  21. Fitzherbert, E.; Struebig, M.; Morel, A.; Danielsen, F.; Brühl, C.A.; Donald, P.; Phalan, B. How will oil palm expansion affect biodiversity? Trends Ecol. Evol. 2008, 23, 538–545. [Google Scholar] [CrossRef]
  22. Foster, W.A.; Snaddon, J.L.; Turner, E.C.; Fayle, T.; Cockerill, T.D.; Ellwood, M.D.F.; Broad, G.R.; Chung, A.Y.C.; Eggleton, P.; Khen, C.V.; et al. Establishing the evidence base for maintaining biodiversity and ecosystem function in the oil palm landscapes of South East Asia. Philos. Trans. R. Soc. B Biol. Sci. 2011, 366, 3277–3291. [Google Scholar] [CrossRef] [Green Version]
  23. Baró, F.; Gómez-Baggethun, E.; Haase, D. Ecosystem service bundles along the urban-rural gradient: Insights for landscape planning and management. Ecosyst. Serv. 2017, 24, 147–159. [Google Scholar] [CrossRef] [Green Version]
  24. The Economics of Ecosystems and Biodiversity. TEEB for Agriculture & Food: Scientific and Economic Foundations; United Nations Environment: Geneva, Switzerland, 2018; Available online: http://teebweb.org/agrifood/scientific-and-economic-foundations-report/ (accessed on 31 May 2020).
  25. Sharma, S.K.; Baral, H.; Pacheco, P.; Laumonier, Y. Assessing Impacts on Ecosystem Services under Various Plausible Oil Palm Expansion Scenarios in Central Kalimantan; CIFOR Infobriefs, No. 176; Centre for International Forestry Research: Bogor, Indonesia, 2017. [Google Scholar] [CrossRef]
  26. Aulia, A.F. Rural Livelihoods and Ecosystem Services in Oil Palm Landscapes in Riau, Sumatra, Indonesia. Ph.D. Thesis, Flinders University, Adelaide, Australia, 2017. [Google Scholar]
  27. Food and Agriculture Organization of the United Nations. The State of Food Security and Nutrition in the World; FAO: Rome, Italy, 2007. [Google Scholar]
  28. Sandhu, H.S.; Wratten, S.D.; Porter, J.R.; Costanza, R.; Pretty, J.; Reganold, J. Mainstreaming Ecosystem Services into Future Farming. Solutions 2016, 7, 40–47. [Google Scholar]
  29. Swinton, S.M.; Lupi, F.; Robertson, G.P.; Hamilton, S.K. Ecosystem services and agriculture: Cultivating agricultural ecosystems for diverse benefits. Ecol. Econ. 2007, 64, 245–252. [Google Scholar] [CrossRef]
  30. Heal, G.M.; Small, A.A. Agriculture and ecosystem services. In Handbook of Agricultural Economics; Gardner, B.L., Rausser, G.C., Eds.; Elsevier Science B.V.: Amsterdam, The Netherlands, 2002; Volume 2A, pp. 1341–1369. [Google Scholar]
  31. Johnson, K.A.; Polasky, S.; Nelson, E.; Pennington, D. Uncertainty in ecosystem services valuation and implications for assessing land use trade offs: An agricultural case study in the Minnesota River Basin. Ecol. Econ. 2012, 79, 71–79. [Google Scholar] [CrossRef]
  32. Sandhu, H.; Muller, A.; Sukhdev, P. Transformation of agriculture and food systems: Application of TEEBAgriFood Framework. Solutions 2019, 10, 63–69. [Google Scholar]
  33. Koh, L.P.; Ghazoul, J. Spatially explicit scenario analysis for reconciling agricultural expansion, forest protection, and carbon conservation in Indonesia. Proc. Natl. Acad. Sci. USA 2010, 107, 11140–11144. [Google Scholar] [CrossRef] [Green Version]
  34. Carlson, K.M.; Curran, L.M.; Ratnasari, D.; Pittman, A.M.; Soares-Filho, B.S.; Asner, G.P.; Trigg, S.N.; Gaveau, D.A.; Lawrence, D.; Rodrigues, H.O. Committed carbon emissions, deforestation, and community land conversion from oil palm plantation expansion in West Kalimantan, Indonesia. Proc. Natl. Acad. Sci. USA 2012, 109, 7559–7564. [Google Scholar] [CrossRef] [Green Version]
  35. Wicke, B.; Sikkema, R.; Dornburg, V.; Faaij, A. Exploring land use changes and the role of palm oil production in Indonesia and Malaysia. Land Use Policy 2011, 28, 193–206. [Google Scholar] [CrossRef]
  36. Yoshida, A.; Chanhda, H.; Ye, Y.-M.; Liang, Y.-R. Ecosystem service values and land use change in the opium poppy cultivation region in Northern Part of Lao PDR. Acta Ecol. Sin. 2010, 30, 56–61. [Google Scholar] [CrossRef]
  37. The United Nations Environment Programme. Oil Palm Plantations: Threats and Opportunities for Tropical Ecosystems. UNEP Global Environmental Alert Service (GEAS). 2011. Available online: https://na.unep.net/geas/archive/pdfs/Dec_11_Palm_Plantations.pdf (accessed on 22 July 2015).
  38. Sandhu, H.; Sandhu, S. Linking ecosystem services with the constituents of human well-being for poverty alleviation in eastern Himalayas. Ecol. Econ. 2014, 107, 65–75. [Google Scholar] [CrossRef]
  39. Díaz, S.; Fargione, J.; Chapin, F.S.; Tilman, D. Biodiversity loss threatens human well-being. PLoS Biol. 2006, 4, e277. [Google Scholar] [CrossRef] [Green Version]
  40. Brooks, T.M.; Mittermeier, R.A.; Da Fonseca, G.A.B.; Gerlach, J.; Hoffmann, M.; Lamoreux, J.F.; Mittermeier, C.G.; Pilgrim, J.D.; Rodrigues, A.S.L. Global Biodiversity Conservation Priorities. Science 2006, 313, 58–61. [Google Scholar] [CrossRef] [Green Version]
  41. Tilman, D.; Fargione, J.; Wolff, B.; D’Antonio, C.; Dobson, A.; Howarth, R.; Schindler, D.; Griscom, B.; Simberloff, D.; Swackhamer, D. Forecasting Agriculturally Driven Global Environmental Change. Science 2001, 292, 281–284. [Google Scholar] [CrossRef] [PubMed] [Green Version]
  42. Turner, B.L.; Lambin, E.F.; Reenberg, A. The emergence of land change science for global environmental change and sustainability. Proc. Natl. Acad. Sci. USA 2007, 104, 20666–20671. [Google Scholar] [CrossRef] [PubMed] [Green Version]
  43. Firbank, L.; Petit, S.; Smart, S.M.; Blain, A.; Fuller, R.J. Assessing the impacts of agricultural intensification on biodiversity: A British perspective. Philos. Trans. R. Soc. B Biol. Sci. 2007, 363, 777–787. [Google Scholar] [CrossRef] [PubMed]
  44. Tscharntke, T.; Klein, A.M.; Kruess, A.; Steffan-Dewenter, I.; Thies, C. Landscape perspectives on agricultural intensification and biodiversity—Ecosystem service management. Ecol. Lett. 2005, 8, 857–874. [Google Scholar] [CrossRef]
  45. Kragt, M.; Robertson, M. Quantifying ecosystem services trade-offs from agricultural practices. Ecol. Econ. 2014, 102, 147–157. [Google Scholar] [CrossRef]
  46. Wratten, S.; Sandhu, H.; Cullen, R.; Costanza, R. (Eds.) Ecosystem Services in Agricultural and Urban Landscapes; Wiley-Blackwell: Chichester, UK, 2013. [Google Scholar]
  47. Zhang, W.; Ricketts, T.H.; Kremen, C.; Carney, K.; Swinton, S.M. Ecosystem services and dis-Services to agriculture. Ecol. Econ. 2007, 64, 253–260. [Google Scholar] [CrossRef] [Green Version]
  48. Fisher, B.; Turner, R.K.; Morling, P. Defining and classifying ecosystem services for decision making. Ecol. Econ. 2009, 68, 643–653. [Google Scholar] [CrossRef] [Green Version]
  49. Fu, B.; Su, C.-H.; Wei, Y.; Willett, I.R.; Lu, Y.-H.; Liu, G. Double counting in ecosystem services valuation: Causes and countermeasures. Ecol. Res. 2010, 26, 1–14. [Google Scholar] [CrossRef]
  50. Wallace, K.J. Classification of ecosystem services: Problems and solutions. Biol. Conserv. 2007, 139, 235–246. [Google Scholar] [CrossRef] [Green Version]
  51. Boyd, J.; Banzhaf, S. What are ecosystem services? The need for standardized environmental accounting units. Ecol. Econ. 2007, 63, 616–626. [Google Scholar] [CrossRef] [Green Version]
  52. De Groot, R.; Alkemade, R.; Braat, L.; Hein, L.; Willemen, L. Challenges in integrating the concept of ecosystem services and values in landscape planning, management and decision making. Ecol. Complex. 2010, 7, 260–272. [Google Scholar] [CrossRef]
  53. Ramdani, F.; Hino, M. Land Use Changes and GHG Emissions from Tropical Forest Conversion by Oil Palm Plantations in Riau Province, Indonesia. PLoS ONE 2013, 8, e70323. [Google Scholar] [CrossRef] [PubMed] [Green Version]
  54. Ministry of Forestry. Profil Kehutanan Provinsi (Provincial Forestry Profile). 2013. Available online: http://www.dephut.go.id/uploads/files/76333af5b0c4474a6498f7d3d1303470.pdf (accessed on 22 July 2015).
  55. Myers, N.; Mittermeier, R.A.; Mittermeier, C.G.; Da Fonseca, G.A.B.; Kent, J. Biodiversity hotspots for conservation priorities. Nature 2000, 403, 853–858. [Google Scholar] [CrossRef]
  56. Ishguchi, O.; Uryu, Y.; Masa Shimada, M.; Otaki, T. Relationships between L-Band NRCS and Land Use Classification in Riau Province, Sumatra, Indonesia; JAXA: Kyoto, Japan, 2008; Available online: http://www.erorc.jaxa.jp/ALOS/kyoto/jun2008_kc10/poster/kc10_poster_isoguhci.pdf (accessed on 21 February 2014).
  57. Miettenen, J.; Liew, S.C. Connections between fire and land cover change in Riau province, Sumatra from 1998–2002. In Proceedings of the 2003 IEEE International Geoscience and Remote Sensing Symposium. Proceedings (IEEE Cat. No.03CH37477), Toulouse, France, 21–25 July 2003; Volume 4, pp. 2496–2498. [Google Scholar]
  58. BPS—Statistics of Riau Province. Riau in Figures 2020; BPS—Statistics of Riau Province: Pekanbaru, Indonesia, 2020. [Google Scholar]
  59. Ministry of Environment & Forestry. Statistics of Environment and Forestry 2018; Ministry of Environment and Forestry: Jakarta, Indonesia, 2019.
  60. Ministry of Manpower and Transmigration 2014. Penempatan Transmigrasi Dari era Kolonisasi s/d Tahun 2014 (Allocation of Transmigration from Colonisation Era to 2014). Available online: http://www.depnakertrans.go.id/pusdatin.html,8,352,ptrans (accessed on 27 October 2014).
  61. Jelsma, I.; Giller, K.; Fairhurst, T. Smallholder Oil Palm Production Systems in Indonesia: Lessons from the NESP Ophir Project; Wageningen University: Wageningen, The Netherlands, 2009. [Google Scholar]
  62. Hoshur, C.A. Resettlement and the politicization of ethnicity in Indonesia. Bidjragen tot de Tall-, Land-en Volkenkunde 1997, 153, 557–576. [Google Scholar]
  63. Fearnside, P.M. Transmigration in Indonesia: Lessons from Its Environmental and Social Impacts. Environ. Manag. 1997, 21, 553–570. [Google Scholar] [CrossRef]
  64. Susanti, A.; Burgers, P. Oil Palm Expansion in Riau Province, Indonesia: Serving People, Planet, Profit? European Report on Development; Utrecht University: Utrecht, The Netherlands, 2012. [Google Scholar]
  65. Scholz, U. Crop geography for agro-Ecological characterization in Sumatra and Costa Rica. In Agricultural Environments. Characterization, Classification and Mapping; Bunting, A., Ed.; CAB International: Rome, Italy, 1987; pp. 247–259. [Google Scholar]
  66. Creswell, J.W. Research Design: Qualitative, Quantitative, and Mixed Methods Approaches, 4nd ed.; SAGE Publications: Thousand Oaks, CA, USA, 2014. [Google Scholar]
  67. Rice, S. Sampling in geography. In Key Methods in Geography, 2nd ed.; Clifford, N., French, S., Valentine, G., Eds.; SAGE Publications: London, UK, 2010. [Google Scholar]
  68. Comte, I.; Colin, F.; Whalen, J.K.; Grünberger, O.; Caliman, J.-P. Agricultural practices in oil palm plantations and their impact on hydrological changes, nutrient fluxes and water quality in Indonesia: A review. Adv. Agron. 2012, 116, 71–124. [Google Scholar] [CrossRef]
  69. Sandhu, H.; Wratten, S.D.; Cullen, R.; Case, B. The future of farming: The value of ecosystem services in conventional and organic arable land. An experimental approach. Ecol. Econ. 2008, 64, 835–848. [Google Scholar] [CrossRef]
  70. Lamade, E.; Bouillet, J.-P. Carbon storage and global change: The role of oil palm. Oléagineux, Corps Gras, Lipides 2005, 12, 154–160. [Google Scholar] [CrossRef]
  71. De Groot, R.S.; Wilson, M.A.; Boumans, R.M. A typology for the classification, description and valuation of ecosystem functions, goods and services. Ecol. Econ. 2002, 41, 393–408. [Google Scholar] [CrossRef] [Green Version]
  72. Farber, S.C.; Costanza, R.; Wilson, M.A. Economic and ecological concepts for valuing ecosystem services. Ecol. Econ. 2002, 41, 375–392. [Google Scholar] [CrossRef]
  73. Bank Indonesia. Exchange Rates on Transaction, Bank Indonesia. 2014. Available online: http://www.bi.go.id/en/moneter/informasi-kurs/transaksi-bi/Default.aspx (accessed on 22 July 2015).
  74. Directorate General of Estate Crops. Pembakuan Statistik Perkebunan Berbasis E-Form (Standardisation of E-Form-Based Plantation Statistics); Directorate General of Estate: Jakarta, Indonesia, 2010. [Google Scholar]
  75. Corley, R.H.V.; Tinker, P.B. The Oil Palm, 4nd ed.; Blackwell Science: Oxford, UK, 2003. [Google Scholar]
  76. Carr, M.K.V. The water relations and irrigation requirements of oil palm (elaeis guineensis): A review. Exp. Agric. 2011, 47, 629–652. [Google Scholar] [CrossRef]
  77. Fusion Media. Carbon Emissions Historical Data, Fusion Media. 2014. Available online: http://www.investing.com/commodities/carbon-emissions-historical-data (accessed on 22 July 2015).
  78. Hartemink, A.E. Soil erosion: Perennial crop plantations. In Encyclopedia of Soil Science, 2nd ed.; Taylor & Francis: New York, NY, USA, 2006; pp. 1613–1617. [Google Scholar]
  79. Bhagwat, S.A.; Rutte, C. Sacred groves: Potential for biodiversity management. Front. Ecol. Environ. 2006, 4, 519–524. [Google Scholar] [CrossRef] [Green Version]
  80. Horcea-Milcu, A.-I.; Hanspach, J.; Abson, D.J.; Fischer, J. Cultural Ecosystem Services: A Literature Review and Prospects for Future Research. Ecol. Soc. 2013, 18, 44. [Google Scholar] [CrossRef] [Green Version]
  81. Wadley, R.L.; Colfer, C.J.P.; Dennis, R.; Aglionby, J. The ‘Social Life’ of Conservation: Lessons from Danau Sentarum. Ecol. Soc. 2010, 15, 39. [Google Scholar] [CrossRef] [Green Version]
  82. Sheil, D.; Casson, A.; Meijaard, E.; Noordwijk Mv Gaskell, J.; Sunderland-Groves, J.; Wertz, K.; Kanninen, M. The Impacts and Opportunities of Oil Palm in Southeast Asia: What Do We Know and What Do We Need to Know? Center for International Forestry Research (CIFOR). 2009. Available online: http://www.cifor.cgiar.org/Knowledge/Publications/Detail?pid=2792 (accessed on 22 July 2015).
  83. Devendra, C. Intensification of Integrated Oil Palm–Ruminant Systems. Outlook Agric. 2009, 38, 71–81. [Google Scholar] [CrossRef]
  84. Zahari, M.W.; Abu Hassan, O.; Wong, H.K.; Liang, J.B. Utilization of Oil Palm Frond—Based Diets for Beef and Dairy Production in Malaysia. Asian-Australas. J. Anim. Sci. 2003, 16, 625–634. [Google Scholar] [CrossRef]
  85. Ishida, M.; Abu Hassan, O. Utilization of oil palm frond as cattle feed. Jpn. Agric. Res. Q. 1997, 31, 41–47. [Google Scholar]
  86. Sulaiman, O.; Salim, N.; Nordin, N.A.; Hashim, R.; Ibrahim, M.; Sato, M. The potential of oil palm trunk biomass as an alternative source for compressed wood. BioResources 2012, 7, 2688–2706. [Google Scholar] [CrossRef]
  87. Yamada, H.; Tanaka, R.; Sulaiman, O.; Hashim, R.; Hamid, Z.; Yahya, M.; Kosugi, A.; Arai, T.; Murata, Y.; Nirasawa, S.; et al. Old oil palm trunk: A promising source of sugars for bioethanol production. Biomass-Bioenergy 2010, 34, 1608–1613. [Google Scholar] [CrossRef]
  88. De Groot, R.; Brander, L.; Van Der Ploeg, S.; Costanza, R.; Bernard, F.; Braat, L.; Christie, M.; Crossman, N.D.; Ghermandi, A.; Hein, L.; et al. Global estimates of the value of ecosystems and their services in monetary units. Ecosyst. Serv. 2012, 1, 50–61. [Google Scholar] [CrossRef]
  89. Edwards, F.A.; Edwards, D.P.; Sloan, S.; Hamer, K.C. Sustainable Management in Crop Monocultures: The Impact of Retaining Forest on Oil Palm Yield. PLoS ONE 2014, 9, e91695. [Google Scholar] [CrossRef] [PubMed]
  90. Kongsager, R.; Reenberg, A. Contemporary Land-Use Transitions: The Global Oil Palm Expansion; GLP International Project Office, Department of Geography and Geology, University of Copenhagen: Copenhagen, Denmark, 2012. [Google Scholar]
  91. Feintrenie, L.; Schwarze, S.; Levang, P. Are Local People Conservationists? Analysis of Transition Dynamics from Agroforests to Monoculture Plantations in Indonesia. Ecol. Soc. 2010, 15, 37. [Google Scholar] [CrossRef] [Green Version]
  92. Barlow, C.; Tomich, T. Indonesian Agricultural Development: The Awkward Case of Smallholder Tree Crops 1. Bull. Indones. Econ. Stud. 1991, 27, 29–53. [Google Scholar] [CrossRef]
  93. Devendra, C. Integrated Tree Crops–Ruminants Systems. Outlook Agric. 2004, 33, 157–166. [Google Scholar] [CrossRef]
  94. Gabdo, B.H.; Bin Abdlatif, I. Analysis of the Benefits of Livestock to Oil Palm in an Integrated System: Evidence from Selected Districts in Johor, Malaysia. J. Agric. Sci. 2013, 5, 47–55. [Google Scholar] [CrossRef]
  95. Goldewijk, K.K.; Ramankutty, N. Land cover change over the last three centuries due to human activities: The availability of new global data sets. Geo J. 2004, 61, 335–344. [Google Scholar] [CrossRef]
  96. Hooper, D.; Adair, E.C.; Cardinale, B.J.; Byrnes, J.E.K.; Hungate, B.A.; Matulich, K.L.; Gonzalez, A.; Duffy, J.E.; Gamfeldt, L.; O’Connor, M.I. A global synthesis reveals biodiversity loss as a major driver of ecosystem change. Nature 2012, 486, 105–108. [Google Scholar] [CrossRef]
  97. Gokhale, Y.; Pala, N.A. Ecosystem Services in Sacred Natural Sites (SNSs) of Uttarakhand: A Preliminary Survey. J. Biodivers. 2011, 2, 107–115. [Google Scholar] [CrossRef]
  98. Latif, J.; Mamat, M.N. A financial study of cattle integration in oil palm plantations. Oil Palm Ind. Econ. J. 2002, 2, 34–44. [Google Scholar]
  99. Slade, E.M.; Burhanuddin, M.I.; Caliman, J.-P.; Foster, W.A.; Naim, M.; Prawirosukarto, S.; Snaddon, J.L.; Turner, E.C.; Mann, D.J. Can cattle grazing in mature oil palm increase biodiversity and ecosystem service provision? Planter 2014, 90, 655–665. [Google Scholar]
  100. Foley, J.A.; DeFries, R.; Asner, G.P.; Barford, C.; Bonan, G.; Carpenter, S.R.; Chapin, F.S.; Coe, M.T.; Daily, G.C.; Gibbs, H.K.; et al. Global Consequences of Land Use. Science 2005, 309, 570–574. [Google Scholar] [CrossRef] [PubMed] [Green Version]
  101. Gray, C.L.; Slade, E.M.; Mann, D.J.; Lewis, O.T. Do riparian reserves support dung beetle biodiversity and ecosystem services in oil palm-dominated tropical landscapes? Ecol. Evol. 2014, 4, 1049–1060. [Google Scholar] [CrossRef] [PubMed]
  102. Schrier-Uijl, A.P.; Anshari, G.Z. Methods for Determining Greenhouse Gas Emissions and Carbon Stocks from Oil Palm Plantations and their Surroundings in Tropical Peatlands Reports from the Technical Panels of the 2nd Greenhouse Gas Working Group of the Roundtable on Sustainable Palm Oil (RSPO). 2013. Available online: http://www.rspo.org/file/GHGWG2/9_methods_for_determining_ghg_emissions_and_C_stock_Schrier_n_Anshari.pdf (accessed on 22 July 2015).
  103. Fischer, J.; Brosi, B.; Daily, G.C.; Ehrlich, P.R.; Goldman, R.; Goldstein, J.; Lindenmayer, D.B.; Manning, A.D.; Mooney, H.A.; Pejchar, L.; et al. Should agricultural policies encourage land sparing or wildlife-Friendly farming? Front. Ecol. Environ. 2008, 6, 380–385. [Google Scholar] [CrossRef]
  104. Costanza, R.; De Groot, R.; Sutton, P.; Van Der Ploeg, S.; Anderson, S.; Kubiszewski, I.; Farber, S.; Turner, R.K. Changes in the global value of ecosystem services. Glob. Environ. Chang. 2014, 26, 152–158. [Google Scholar] [CrossRef]
  105. Paquette, A.; Messier, C. The role of plantations in managing the world’s forests in the Anthropocene. Front. Ecol. Environ. 2009, 8, 27–34. [Google Scholar] [CrossRef] [Green Version]
  106. Teuscher, M.; Gérard, A.; Brose, U.; Buchori, D.; Clough, Y.; Ehbrecht, M.; Hölscher, D.; Irawan, B.; Sundawati, L.; Wollni, M.; et al. Experimental Biodiversity Enrichment in Oil-Palm-Dominated Landscapes in Indonesia. Front. Plant Sci. 2016, 7, 1538. [Google Scholar] [CrossRef] [Green Version]
Figure 1. Riau Province, Indonesia, showing agro-ecological zones, district and sub-district boundaries, and the four study sites—Bunga Raya, Kerinci Kanan, Tapung, and Ujung Bat.
Land 09 00194 g001
Figure 2. Summary of economic value of ecosystem services and dis-services provided by oil palm landscapes in Bunga Raya, Kerinci Kanan, Tapung, and Ujung Batu. The provisioning services category includes oil palm fruits, rubber, coconut, bamboo, areca nuts, cacao, rice, cattle, and chickens.
Land 09 00194 g002
Table 1. Basic information, landscape characteristics, and migration and land-use histories of four villages sampled.
Information itemUjung BatuTapungKerinci KananBunga Raya
No. of respondents9181124
Population (2013)48,92592,97723,95222,454
Agro-ecological zonePiedmontPeneplainsPeneplainsEastern lowlands
Migration historyTrading center with inter-provincial migrants (Sumatra)Long established population, transmigrants in surroundingsInitial settlers were transmigrants who cultivated oil palmInitial settlers were transmigrants who cultivated rice
Land use history in the context of oil palm cultivationOil palm cultivation established around state-owned plantation in the 1980sTimber production areas converted to OP in the late 1990s. Strong influences of a nearby private OP estatePrimary forest cleared for transmigrant settlement in the early 1990sPeat swamp forest cleared for transmigrants in the 1980s. The rice farms began to be converted to OP in the 2000s
Table 2. Ecosystem services that are identified and valued in the study using the Economics of Ecosystems and Biodiversity (TEEB) typology (adapted from [14,17]).
Ecosystem ServicesMain Service TypesIdentified and Valued in this Study (Indicated by X)Not Identified in Interviews, but Y Is Identified in the Literature. The Description of the Ecosystem Services Is in Parentheses.
1ProvisioningFood (e.g., oil-palm fruit, coconut, areca nut, cacao, rice, cattle, chicken)X
2Water (e.g., for drinking, irrigation, cooling)Y (micro-environment impacts)
3Raw Materials (e.g., rubber, bamboo)X
4Genetic resources (e.g., for crop improvement and medicinal purposes)Y (genetic pool of oil palm species)
5Medicinal resources (e.g., biochemical products, models, and test-organisms)Y (Documented uses of palm oil include treating prostate diseases, use as a component in skin lotion, and as a carrier for the medicinal extracts of other plants)
6Ornamental resources (e.g., artisan work, decorative plants, pet animals, and fashion)Y (Despite decreasing forest cover and decreasing accessibility to forests, oil palm supplies considerably fewer birds at lower prices than forests do, representing a decrease in the ornamental resources ecosystem function)
7Regulating servicesAir quality regulation (e.g., capturing (fine) dust, chemicals, etc.)Y (emissions of Greenhouse Gases––GHGs and volatile organic compounds—VOCs are a precursor to tropospheric ozone from oil palm plantations; air pollution from land-clearing fires, and increased emissions of VOCs)
8Climate regulation (including C-sequestration, affecting global climate through GHG emissions, and also having a direct effect on local microclimates)X
9Moderation of extreme events (e.g., storm protection and flood prevention)Y (oil palm plantations are likely to increase the probability of shallow landslides, and increase the risk and frequency of wildfires in surrounding areas)
10Regulation of water flows (e.g., natural drainage, irrigation, and drought prevention)X
11Waste treatment (especially water purification)Y (results in large amounts of organic waste, in particular, empty fruit bunches and palm oil mill effluent)
12Soil erosionX
13Maintenance of soil fertility (including soil formation)Y (release of nutrients via decomposition and mineralization is susceptible to losses through leaching and gaseous emissions, because the magnitude of uptake from the newly established crops is still relatively low)
14PollinationY (oil palm plantations generally support lower species richness and abundances of invertebrate pollinators)
15Biological control (e.g., seed dispersal, pest and disease control)Y (fungi and entomopathogenic viruses to control the rhinoceros beetle, Oryctes Monoceros)
16Habitat servicesMaintenance of life cycles of migratory species (including nursery service)Y (oil palm plantations contain more weedy and exotic species than forests, and are exposed to more agrochemicals, further reducing the chances of survival for many species)
17Maintenance of genetic diversity (especially in gene pool protectionY (oil palm plantations greatly reduce species richness and species’ abundances for most taxa)
18Cultural and amenity servicesAesthetic informationY (not identified in literature)
19Opportunities for recreation and tourismY (not identified in literature)
20Inspiration for culture, art, and designY (not identified in literature)
21Spiritual experienceX
22Information for cognitive developmentY (not identified in literature)
Table 3. Potential mean total economic value (TEV) of selected ecosystem services (ES) in Bunga Raya, Kerinic Kanan, Tapung, and Ujung Batu (USD ha−1 year−1). Numbers in square parentheses are the numbers of households growing these crops or rearing these livestock.
Mean Economic Value (and Range) in USD ha−1 Year−1
Ujung Batu
[n = 9]
Tapung
[n = 18]
Kerinci Kanan
[n = 11]
Bunga Raya
[n = 24]
Average
Provisioning services
Oil palm fruit1315
(459–2488)
1823
(574–4306)
2043
(1091–3359)
1645
(332–3100)
1707
Rubber170
(0–735) [5]
1569
(0–8551) [14]
869
Coconut65 (0–97) [6]75 (0–97) [14]71 (0–97) [8]44 (0–97) [11]64
Bamboo80 (0–478) [3]80
Areca nuts0.4 (0–3) [4]0.02 (0–0.2) [1]1594
(0–16,046) [9]
532
Cacao561
(0–5052) [1]
738 (0–6486) [3]240
(0–1768) [4]
513
Rice317
(0–2679) [3]
317
Cattle296
(0–2662) [1]
257 (0–1914) [6]332 (0–3349) [2]48 (0–478) [4]233
Chickens26 (0–230) [3]1 (0–18) [2]8 (0–25) [8]32
(0–479) [16]
17
Regulating and maintenance services
Groundwater recharge631 (225–2853)3038
(1530–5315)
1392 (62–2690)2163
(1779–4407)
1806
Soil erosion
(dis-service)
−73 (48–91)−77 (48–91)−78 (48–91)−63 (48–91)−73
Carbon storage149149149140147
Cultural and amenity services
Sacred forest309309
TEV29706563391777296520
Marketed ES
(% of TEV)
2263 (76.2%)3144 (47.9%)2454 (62.7%)5489 (71.0%)4331 (66.4%)
Non-marketed ES
(% of TEV)
707 (23.8%)3419 (52.1%)1463 (37.3%)2240 (29.0%)2189 (33.6%)

