Article

Spatio-Temporal Coordination and Conflict of Production-Living-Ecology Land Functions in the Beijing-Tianjin-Hebei Region, China

1
Key Laboratory of Land Surface Pattern and Simulation, Institute of Geographic Sciences and Natural Resources Research, Chinese Academy of Sciences, Beijing 100101, China
2
College of Resources and Environment, University of Chinese Academy of Sciences, Beijing 100049, China
3
Aerospace Information Research Institute, Chinese Academy of Sciences, Beijing 100094, China
*
Author to whom correspondence should be addressed.
Land 2020, 9(5), 170; https://doi.org/10.3390/land9050170
Submission received: 8 April 2020 / Revised: 15 May 2020 / Accepted: 21 May 2020 / Published: 23 May 2020
(This article belongs to the Section Land Systems and Global Change)

Abstract

:
Assessment of multiple land use functions promotes both utilization efficiency of land and regional coordination. Different personal and public products and services are offered by various land use types, meaning their functionality varies. Lack of judgment on temporal trends, turning points, or consideration of multi-source indicators like the ecological and air quality index leads to uncertainties in urban multifunctionality evaluation and functional orientation. In this study, the production-living-ecology land use function index system and evaluation process was improved using an entropy weight, triangle model, and coupling coordination degree. The production-living-ecology land use function (PLELUF) is defined from land use multi-functions. The Beijing-Tianjin-Hebei urban agglomeration was the representative area. The model was applied to quantify land use functions and measure spatio-temporal coordination and conflict from 1990 to 2015. Results found that the production and living functions displayed an overall upward trend and the growth rate of production function is larger, doubling from 1990 to 1995, while living function increases steadily. Ecology function remained steady from 1990 to 2000 but increased afterward. Land use function stage became balanced in ecology-living-production after 2005. No function-balanced cities existed in 1990; nine function-balanced cities were found in 2015. The coupling coordination degree increased from a slight conflict to a high coordination. Land use multi-functionality was high in the north and low in the south in 2015; Beijing had the most significant multifunctionality. This study can aid land use zoning and sustainable land management.

Graphical Abstract

1. Introduction

Land use change has been considered to be one of primary determinants in global change [1,2,3]. In recent years, because of global urbanization and industrialization, great changes have taken place in land use patterns. Each land use type often shows multifunctionality, contains ecological, social, and economic value, and represents the degree and ability of land to meet a variety of human needs [4]. Land use multifunctionality (LUMF) is reflected in the different personal and public products offered by various land use types [5]. The contradiction between scarce land resources and growing demand is becoming increasingly acute, and land use tends to be diversified. Knowing the relations among land use functions is conducive to land use management and sustainable development [6,7].
In the evolution of a multi-function concept, LUMF was defined and classified by scholars with different indicator systems, and is mainly affirmed by environmental, social, and economic functions [8,9,10]. This embodies the idea of the production-living-ecology land use functions (PLELUF) in the national land development planning in China. Productive land, living land, and ecological land is classified from the perspective of land use function [11,12]. China has a high population density in urban areas, and the phenomenon wherein various land spaces occupy each other is prominent [13]. With the continuous expansion of urban and rural industrial land, the space for high-quality cultivated land, forests, grasslands, and other ecological areas has been squeezed. At present, the Chinese government has begun to emphasize the importance of the “production-living-ecology” land use planning. The Rural Revitalization Strategic Plan (2018–2022) [14] points out the need to “optimize production space, reasonably distribute living space, and protect ecological space.” We combined the production-living-ecology planning practice from the Chinese government1 with the multi-functionality research, and came into being the idea of PLELUF. However, different land use functions collide with each other, and the key to optimizing land use functions is to solve conflicts and promote coordination.
The multifunctionality concept originated from agricultural land research [15,16] and has extended to production, society, and ecology, as well as to sustainable land development [5,17]. Tipraqsa et al. [15] adopted food safety, environment functions, economy functions, and society functions of Thailand to estimate the integrated farming systems. The classification of land use functions is the basis for LUMF assessments. The general land use function classification system is represented by Pérez-Soba et al. [18] and based on the basis of the EU SENSOR plan, which develops sustainability assessment tools for land use. The classification system subdivides the social function, economic function, and environmental function of land use into nine sub–functions according to different industrial sectors. On the basis of the construction of a multi–index evaluation system, an economic model [19], a biophysical process model [20], a landscape ecology index [21], and an ecosystem service evaluation model [22,23] are applied to calculate the land’s sub–functions. Then, a mathematical method is used to integrate the evaluation results of the different land sub–functions, including a subjective and objective weighting method [24].
Scholars have carried out much research concerning LUMF in different regions [10], land use types [25], and study scales [26]. Hermann et al. [27] put forward a methodological framework covering different levels on landform types, landscape sample sites, and landscape comprehensive types. The basic analysis units can be divided into two types: administration and grid units. Studies have tested LUMF using various spatial scales based on the modeling of ecosystem services and biodiversity indicators [28]. Based on the assessment of LUMF, some studies began to explore the relationship between land use functions, such as trade–offs and conflicts [29,30]. While these studies are rich in spatial identification, they cannot fully mine the temporal relationships and evolution of influencing factors between multiple land use functions.
Studies on ecosystem services developed early [22], and scholars have classified ecosystem services according to research purpose and study area [3,31]. Typically, Millennium Ecosystem Assessment [31] divides ecosystem services into supply function, regulation function, support function, and cultural function. Ecosystem services can be evaluated in terms of quality [26], value [3], and energy [32], while quantitative evaluation focuses on combining these factors with ecological processes [23]. The use of ecological models such as InVEST [23], ARIES [33], and EPM [34] can promote the simulation and spatial overlay analysis of multiple ecosystem services. The ecosystem service research provides a theoretical basis and method reference for ecological multi-functional research.
In reference to the idea of LUMF, several studies have launched production-living-ecology analyses including the classification system [13], spatial identification [29,35], and function evaluation [36,37]. A recent production-living-ecology land use classification system focused on the social and economic sub–functions [36]. However, sub-functions concerning urban coordination and environmental problems were not adequately taken into consideration [38]. It is necessary to improve the classification system’s suitability for rapidly developing urban agglomerations, and to involve the introduction of an ecological model and air quality index [39,40]. Further, the three land use functions’ interactions over a long period of time remains largely unknown, particularly the temporal trends and turning points. Summarizing the long–term regularity of LUMF is helpful in judging the changes in different development processes in order to analyze and predict them [41,42].
Therefore, it is necessary to analyze the interaction of the PLELUF and clarify the spatio-temporal coordination and conflict characteristics to assist regional development. Consequently, the objective of our study is to: (1) improve the PLELUF index system for developing urban agglomeration and measuring the coordination and conflict, and (2) apply the new system to conduct the coordination and conflict of PLELUF, and detect the spatio-temporal turning points. Taking the “capital economic circle” Beijing-Tianjin-Hebei (BTH) region in China as study area, an entropy weight, a triangle model, and a coupling coordination degree were used to calculate the PLELUF, and reveal their relationships from 1990 to 2015. This study provides a reference for the identification of regional differences and development pattern optimization, which may be used by land planners and policymakers in the BTH region.

2. Materials and Methods

2.1. Study Area

Located in the northeastern coastal zone of China (36°01’–42°37’ N, 113°04’–119°53’ E), the BTH region is the third largest urban agglomeration in China (Figure 1). It includes the capital Beijing, the municipality Tianjin, and eleven cities in Hebei Province. The elevation declines from the northwest to the southeast [43], and mountains and plains account for approximately 48.2% and 43.8%, respectively [44]. It features a typical warm and temperate continental monsoon climate. The water resources per capita is 286 m3 in 2015, one-ninth of that for China. The BTH region feeds 8.1% of the country’s population using 1.9% of the country’s land. The total discharge of wastewater from the BTH region is 5.56 billion tons, and the output of general industrial solid waste is 471.10 million tons [45]. Haze and air pollution are frequent, and the average concentration of SO2 and PM10 are 38 μg/m3 and 132 μg/m3 [46]. Regional differences still exist, and the urbanization rates for Beijing, Tianjin, and Hebei reached 86.5%, 82.6%, and 51.3%, respectively. The BTH region produced 6931 billion of GDP, making up 10.2% of the whole country. However, the GDP per capita of Beijing and Tianjin is 2.64 and 2.68 times that of Hebei, respectively.
This acceleration of urbanization and industrialization results in a huge demand for land and natural resources [24,47], resulting in unbalanced phenomena in the BTH region, and the Beijing-Tianjin-Hebei Coordinated Development Plan Outline was put forward on 30 April 2015 [48]. For this reason, the BTH region is an ideal area for evaluating LUMF, conflicts, and coordination.

2.2. Production-Living-Ecology Land Use Function Classification System

The PLELUF index system uses the production, living, and ecology functions as its first-order indicators (Table 1). Production land refers to land for agricultural, industrial, and commercial activities for obtaining products and supplying functions, whereas living land refers to that which carries and protects human settlements, and ecology land is that which regulates, maintains, and protects the function of ecological security. In this study, the production function is embodied in agricultural outputs, regional industry, and transportation capacity. The living function is roughly divided into social security, employment support, medical support, and educational functions. The ecology function consist of resources supplies, ecology regulation, and maintenance functions.
In this study, the geospatial data, environmental statistics, and socio-economic data in 1990, 1995, 2000, 2005, 2010, and 2015 were used. The environmental statistics come from the Environmental Statistics Yearbook, Natural Resources Bulletin, and Water Conservancy Annals. The socio–economic statistical data are obtained from the Economic Statistical Yearbook and Social Statistical Yearbook. Most indicators are unit values. The concentration of PM10 was introduced as the detection index for air pollution. The land use remote sensing monitoring data were 30 m × 30 m rasters, obtained from the Resource and Environment Data Cloud Platform of the Chinese Academy of Sciences (http://www.resdc.cn/). The land use data are interpreted based on Landsat TM/ETM images, and the interpretation accuracy is 89.42%, which meets the mapping requirements. The geospatial modeling tools used in this study are ArcGIS (Environmental Systems Research Institute Inc, Redlands, California USA), Fragstats (Oregon State University, Corvallis, Oregon USA), and InVEST (Stanford University, Stanford, California USA). The pathological degree of the ecosystem risk and habitat quality index were calculated to characterize regulation and maintenance functions. The pathological degree of the ecosystem risk from the Fragstats model indicates the fragmentation degree of the landscape, and reflects the degree of human interference to a certain extent [49]. Fragmentation is an important factor behind the loss of biodiversity, and is closely related to the ecological maintenance function [50]. The habitat quality index from the InVEST model [51] was expressed by assessing the extent of various habitat types and the degradation degree of each type. It provides a way to assess biodiversity based on land use changes [20,52]. Vector distribution maps of roads, railways, industrial, and residential areas were obtained from the Resource and Environment Data Cloud Platform of Chinese Academy of Sciences (http://www.resdc.cn/), and were used as threat data.
In order to reduce the regional differences, the logarithmic transformation of each index was followed by normalization calculations. We standardized the data using Equations (1) and (2), and the extreme value was determined according to the maximum and minimum values of each index from 1990 to 2015.
Positive   indicator :     y ij = ln x ij ln Min ( x i ) ln Max ( x i ) ln Min ( x i )
Negative   indicator :   y ij = ln Max ( x i ) ln x ij ln Max ( x i ) ln Min ( x i )
where x ij denotes the value of indicator i ( 1 i m ) in year j   ( 1 j n ) ; y ij denotes the standard value of x ij ; and Max ( x i ) and Min ( x i ) are the maximum and minimum value of indictor i in all years, respectively. Thus, the index values ranged from 0–1.

2.3. Calculation Methods and Analysis Models

2.3.1. Weights and Evaluation for the Production-Living-Ecology Land Use Functions

Entropy was first introduced into information theory by Shannon [53]. As an objective weighting method, the entropy weight method can decide the weight according to the information amount [54,55].
The standardized value of y ij is defined as Equation (3):
p ij = y ij j = 1 n y ij .
The decision information of each index can be expressed by entropy value:
e i = k j = 1 n p ij ln p ij
where e i 0 , k > 0 , k = 1 ln n ; 0 ln 0 0 .
The difference degree can be calculated as follows:
g i = 1 e i .
The entropy weight w i can be calculated as:
w i = g i i = 1 m g i
where   0 w i 1 ; i m w i = 1 .
Finally, following the entropy weight, the PLELUF indices for j th year were achieved from the formula:
f ij = i = 1 m w i y ij .

2.3.2. Graphical Representation of Multifunctionality of Production-Living-Ecology Land Use Functions

The triangle model, which originated from pedology, is a subjective assortment using particle size distribution to evaluate soil texture [56,57]. When used to illustrate the developing tendency, the triangle model can flexibly select the indicators and express them visually [57]. To intuitively provide information neglected by the function indicators, a triangular chart was introduced. The function value was tasked as the coordinates so that the three functions could exhibit complementary relationships with each other. The proportion of each function value in the sum of the three function values is the coordinates of the points, which were plotted in Grapher™ software (Golden Software LLC, Golden, Colorado USA). Figure 2 shows seven functional groups [58]: ecological advantageous types (E); production advantageous types (P); living advantageous types (L); ecological-production advantageous types (EP); living-production advantageous types (LP); ecological–living advantageous types (EL); and ecological-living-production balanced types (ELP).

2.3.3. Quantifying Production-Living-Ecology Land Use Functions Relationships Based on Coupling Coordination Degree Model

Coupling means that multiple systems interact with each other, reflecting their interdependence and restrictions. It has been extensively used in research concerning social development and environmental change [59]. The formulas of coupling coordination degree model are as follows [60]:
D = C × T
C = f ( x ) × g ( y ) × h ( z ) [ f ( x ) + g ( y ) + h ( z ) 3 ] 3 3 = 3 f ( x ) × g ( y ) × h ( z ) 3 f ( x ) + g ( y ) + h ( z )
T = r × f ( x ) + s × g ( y ) + t × h ( z )
where D is the coupling coordination degree; C is the coupling level; T reflects the integrated level of LUMF, and f ( x ) , g ( y ) , and h ( z ) reflect the production function, the living function, and the ecology function, respectively. r, s, and t reflect the devotion of the three functions, which are calculated by entropy weight method to avoid the effect of subjective factors. The coupling development of the production-living-ecology functions was divided into ten classes (Table 2).

2.3.4. Assessing Spatial Advantageous Areas of Production-Living-Ecology Land Use Functions

As shown in Figure 3, to explore the interactions among the PLELUF, LUMF was spatially identified through spatial overlaying [58]. Specifically, the first 30% of assessment units for each land use function were extracted as its advantageous area. Next, we superimposed these advantageous areas of three functions. The triple and double overlap regions were regarded as strong and weak multifunctional regions. The advantage area that does not overlap was defined as a single functional area and the rest referred to as disadvantaged regions.

3. Results

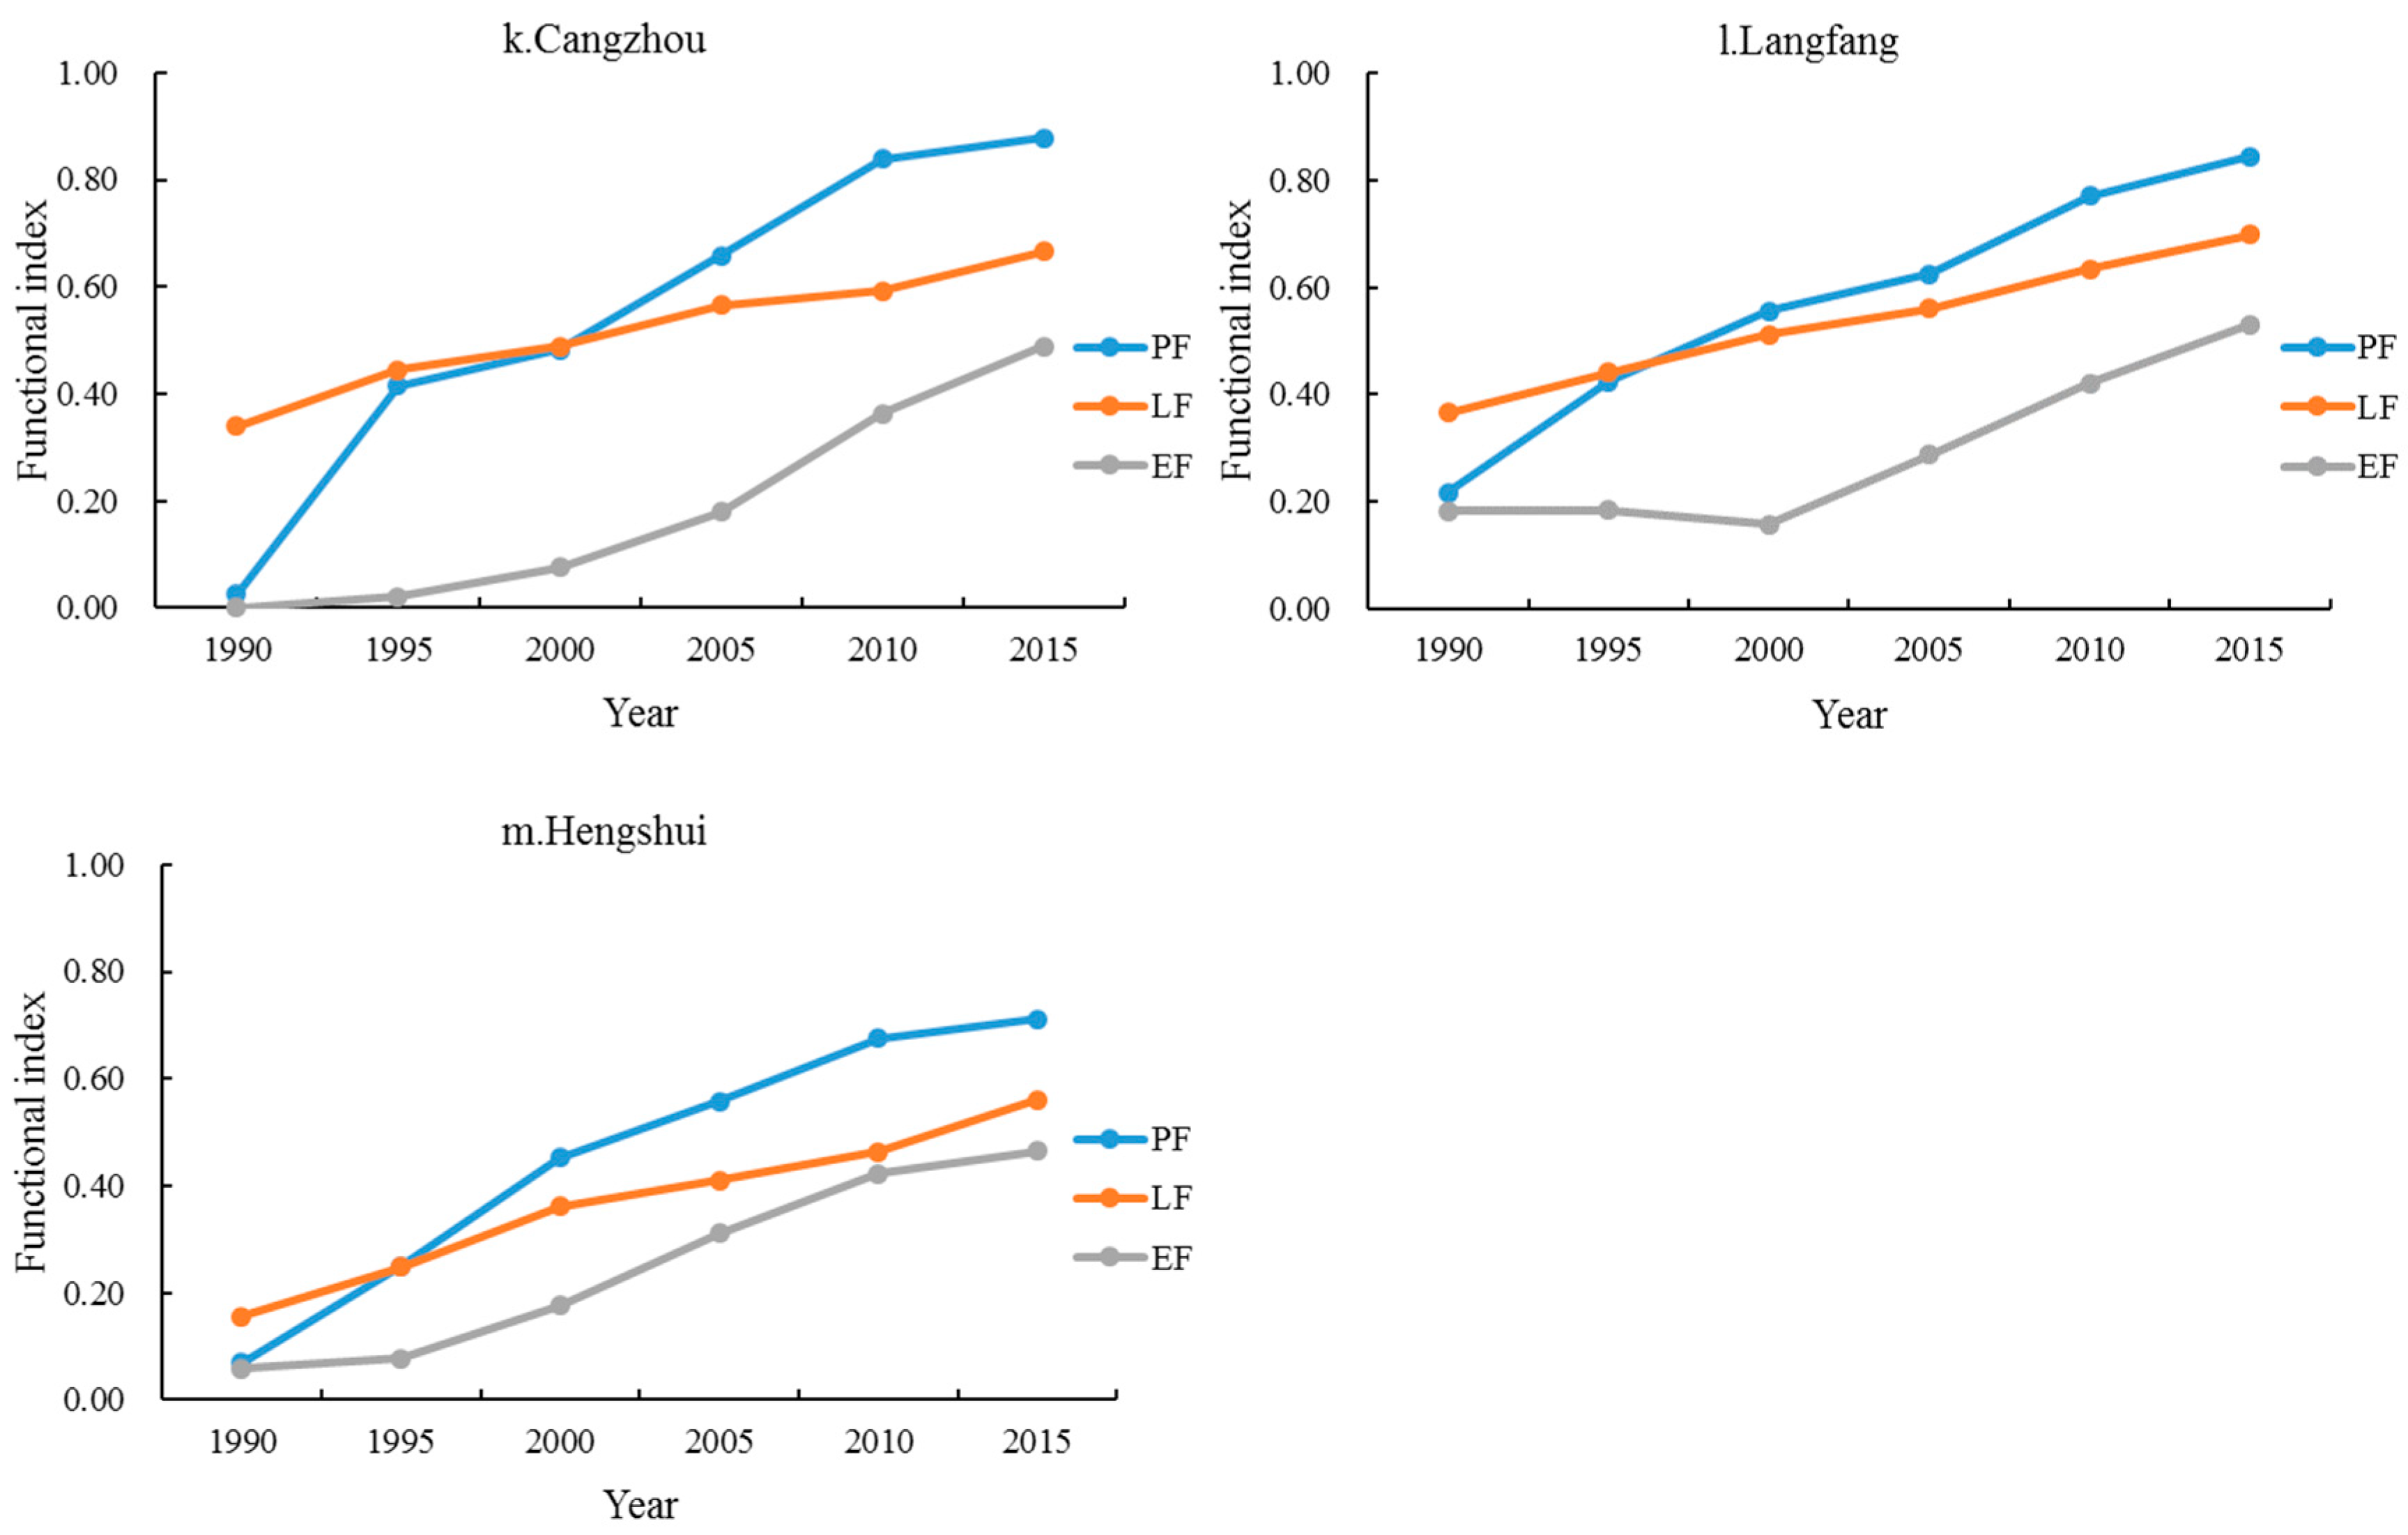
3.1. Temporal Patterns of Production-Living-Ecology Land Use Functions

The temporal variation patterns of the PLELUF in the BTH region are described in Figure 4. The production and living function displayed an overall upward trend and the growth rate of the former was larger, doubling from 1990 to 1995, and slows down after 2010, while the latter increases steadily from 0.38 to 0.71. The ecology function decreased slightly in 2000 (less than 0.3), and then increased to 0.68. By 2015, the production function had moved in ranking from last to first among the three, and the ecology function became the lowest ranked function. This implies that a considerable amount of economic resources, including labor, institutions, and knowledge, were devoted to the economy, and support for living standards continued to be sound. However, less attention was paid to the ecological balance, and the phenomenon was alleviated after 2000.
The temporal variation patterns of the PLELUF from city level also reveal clear characteristics in terms of quantity and trends (Figure 5). In 1990, the production functions of most cities were lower than the living functions, but exceeded the living functions after 2000. However, an exception was that of the living function of Beijing and Tianjin, as they were maintained at a high level (exceeding 0.77) for a long time. Cities with superior resources and environmental backgrounds, such as Qinhuangdao, Zhangjiakou, and Chengde, ranked first in ecology functions (more than 0.46). Although the ecology functions of other cities grew after 2000, they were still backward when compared with other functions.
The uptrend of the production function was obvious, especially from 1990 to 1995, since China’s economic reform and opening-up process. Significant growth occurred in industrial and agricultural output values, transportation volume, and GDP per capita, while slight growth occurred in crop yield. The production function of Chengde experienced a short–term stagnation from 1995 to 2000, mainly due to the substantial reduction of crop yield caused by drought and water shortages, and decreased by 73%. It is worth noting that the economic rate of most cities slowed down after 2010, which was mainly due to the stagnation of crop yield and transportation, and the deceleration of industrial and agricultural output value.
The temporal change of the living function in most cities had a steadily increasing trend, and the permanent resident density also greatly increased. The advances in fields of habitat, urbanization, employment, medical support, and educational areas may bring about social progress. For Beijing and Tianjin, the widening income gap was the main reason for the trough in the living function in 2000 and 2010, respectively. In Chengde, the decrease in crop yield led to a low disposable income of rural residents per capita, as a result of a decline in the area’s living standard (by 0.08) in 2000.
The ecology function curves remained steady from 1990 to 2000 but increased after 2000 for most cities, which shows that environmental governance was initially neglected but has had a certain effect later on. The green coverage, sewage, and waste treatment gradually increased. The ecology function in Tianjin and Cangzhou was especially low in the 1990s (at less than 0.1). Water resources have become an important factor that has restricted the ecology function of the study region. A large-scale drought occurred in 2000, which led to a decrease in water resources per capita from 15% to 89%, and the ecology function of most cities decreased slightly. Moreover, water resources in Zhangjiakou and Handan decreased significantly in 2015, resulting in a decline in ecology function.

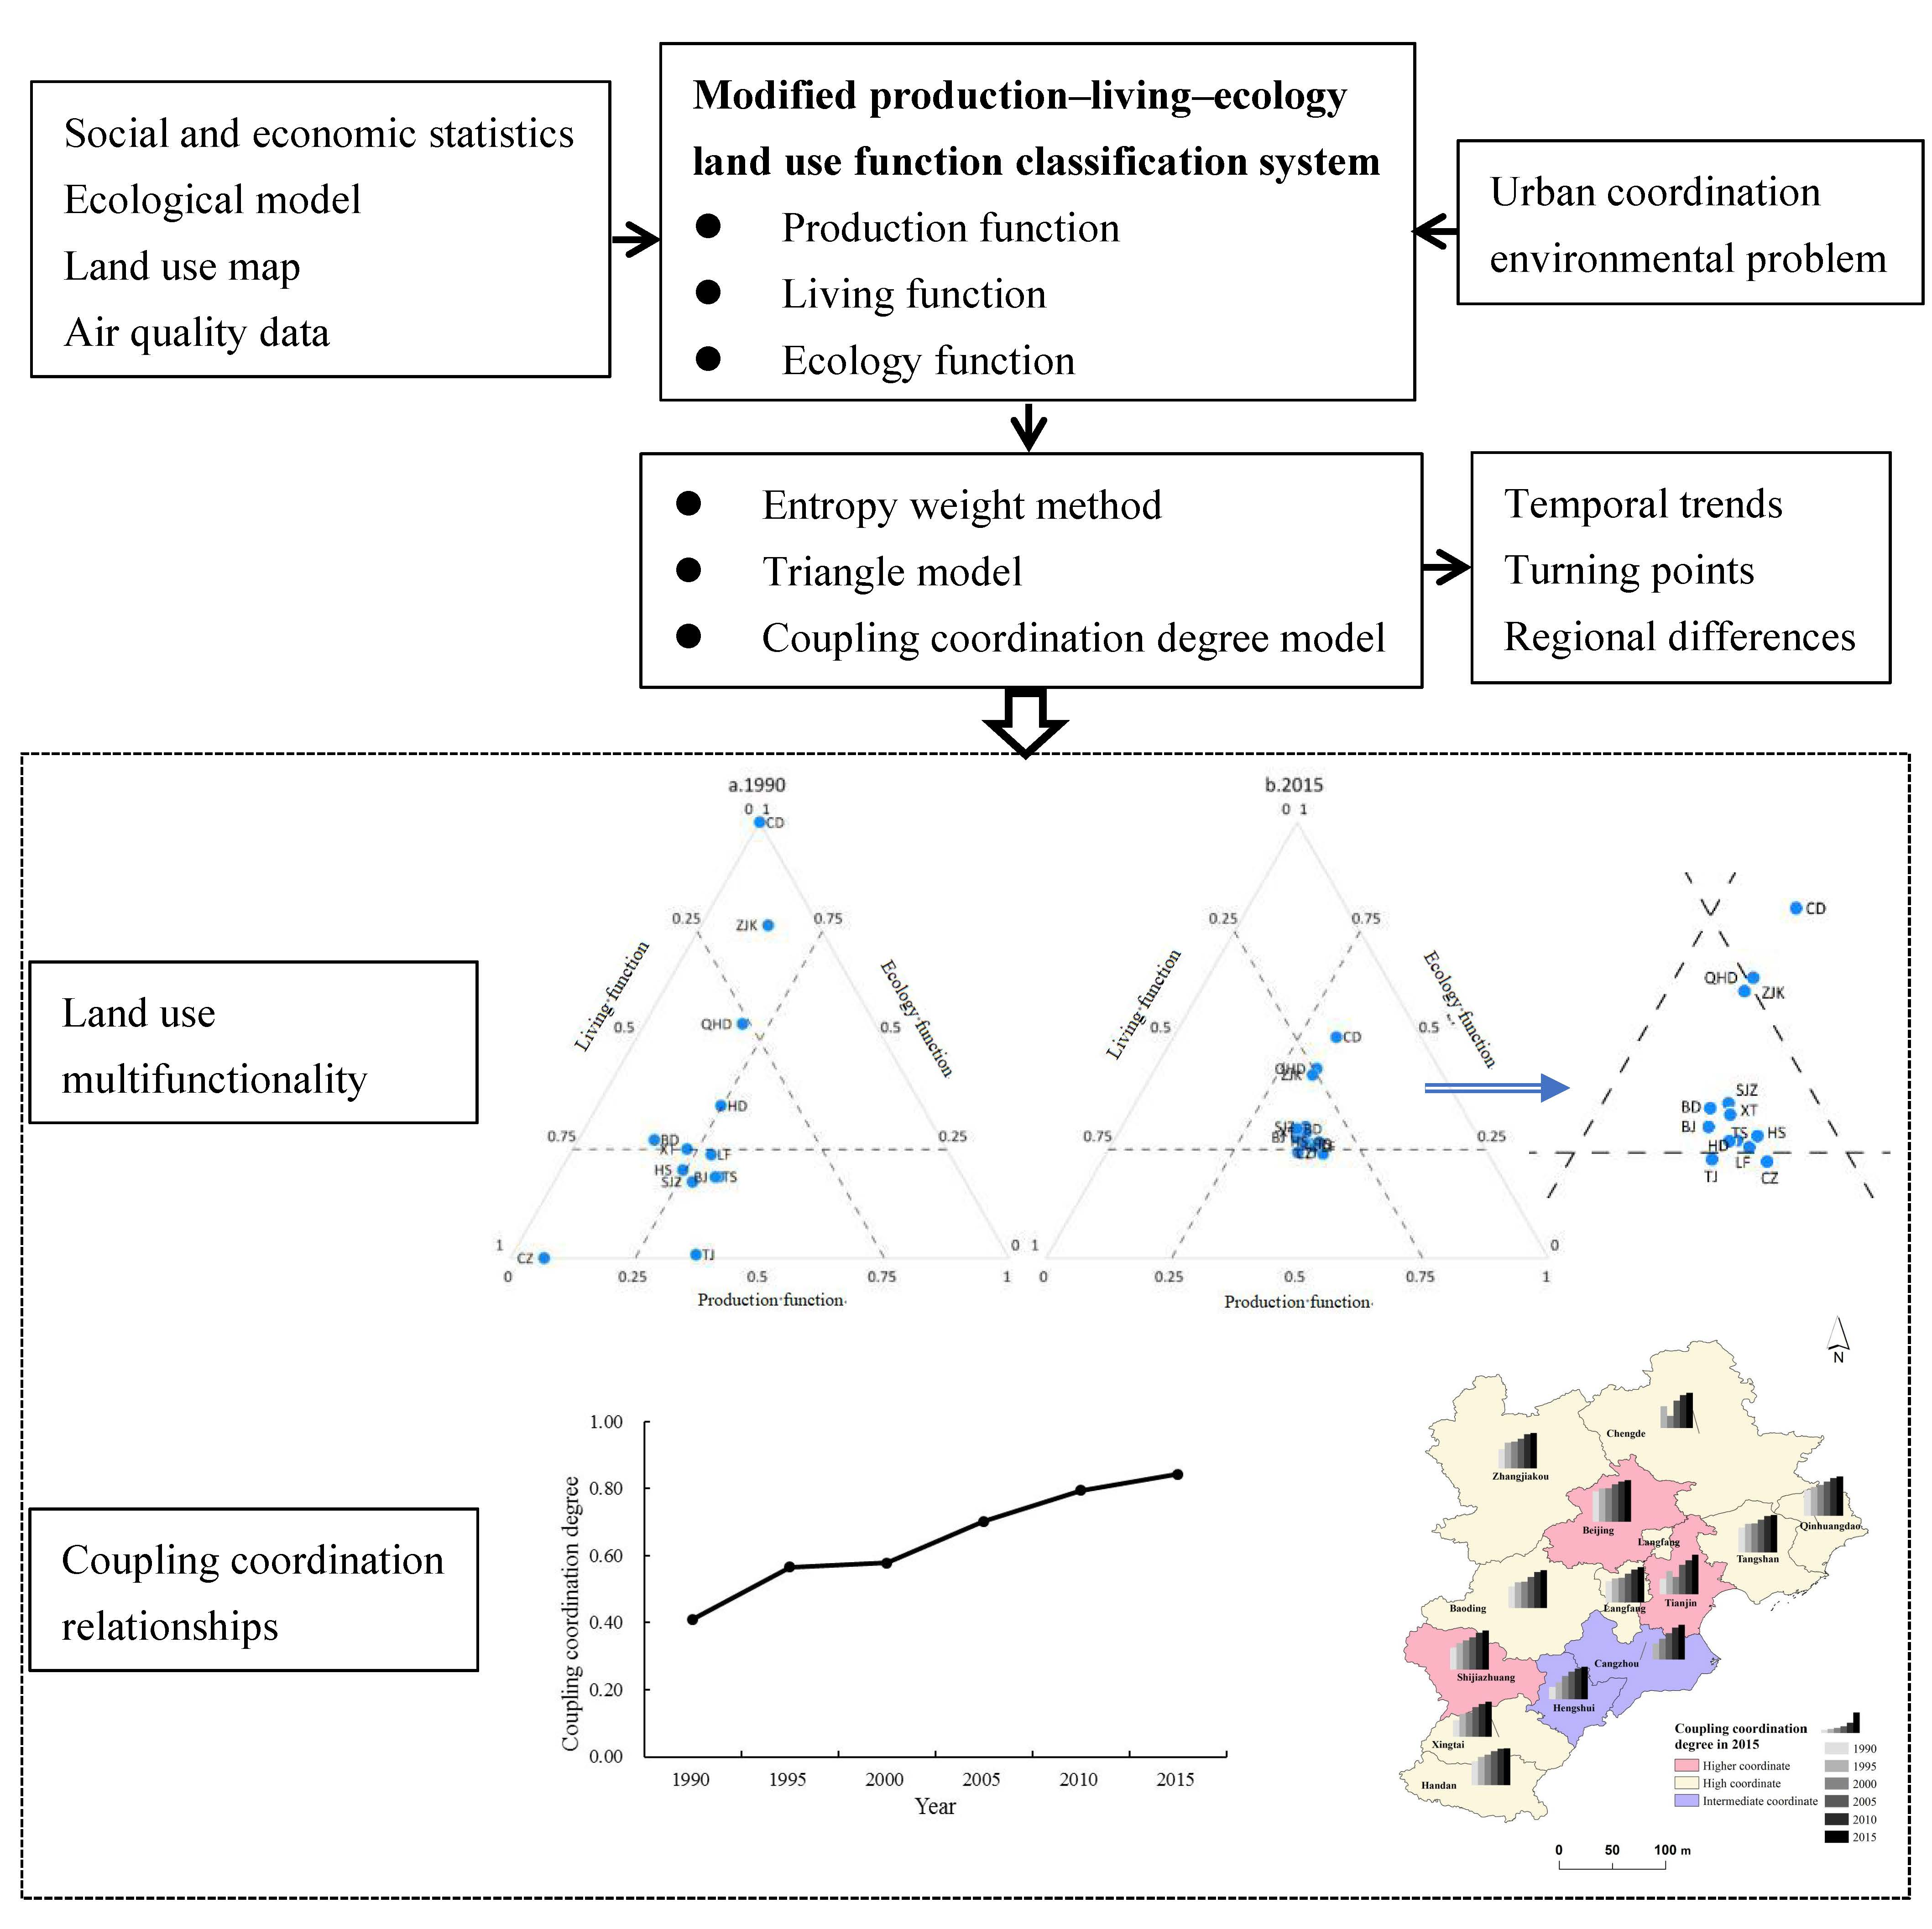
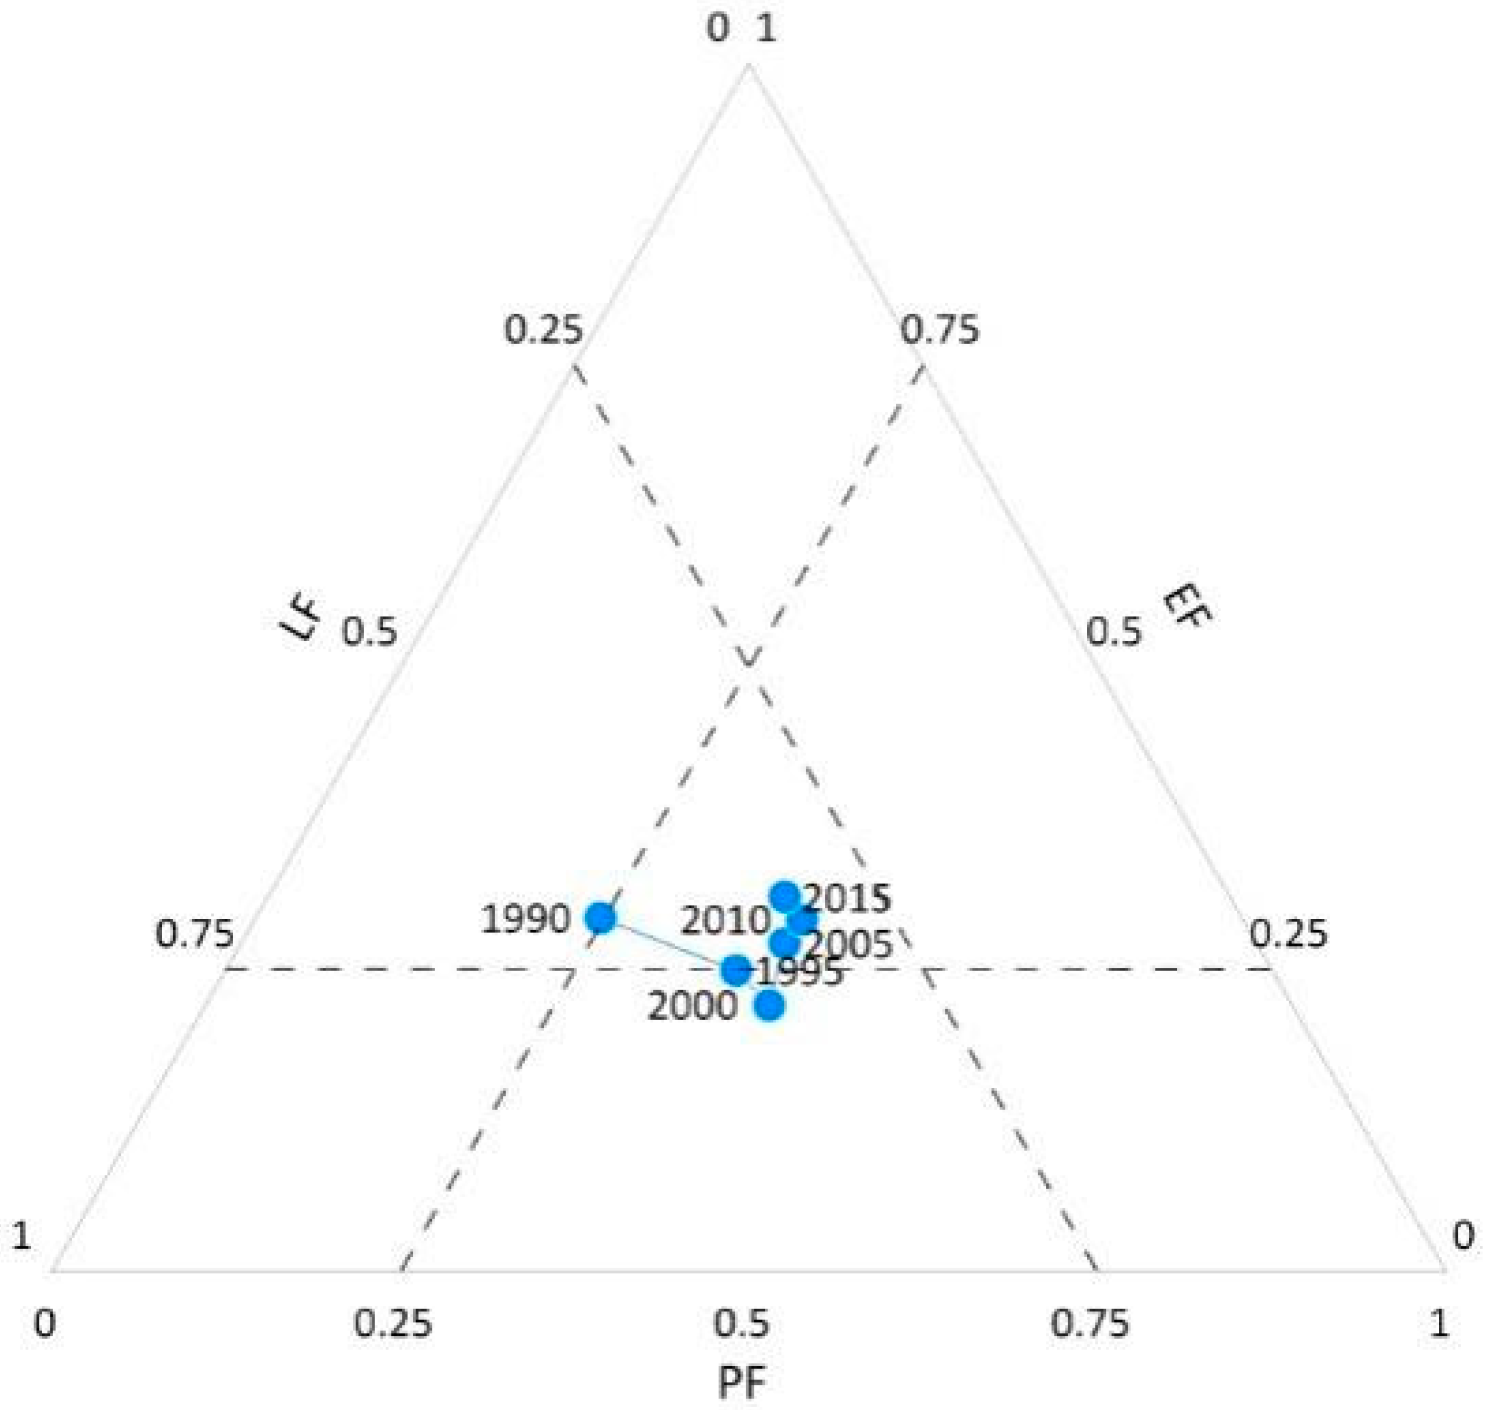
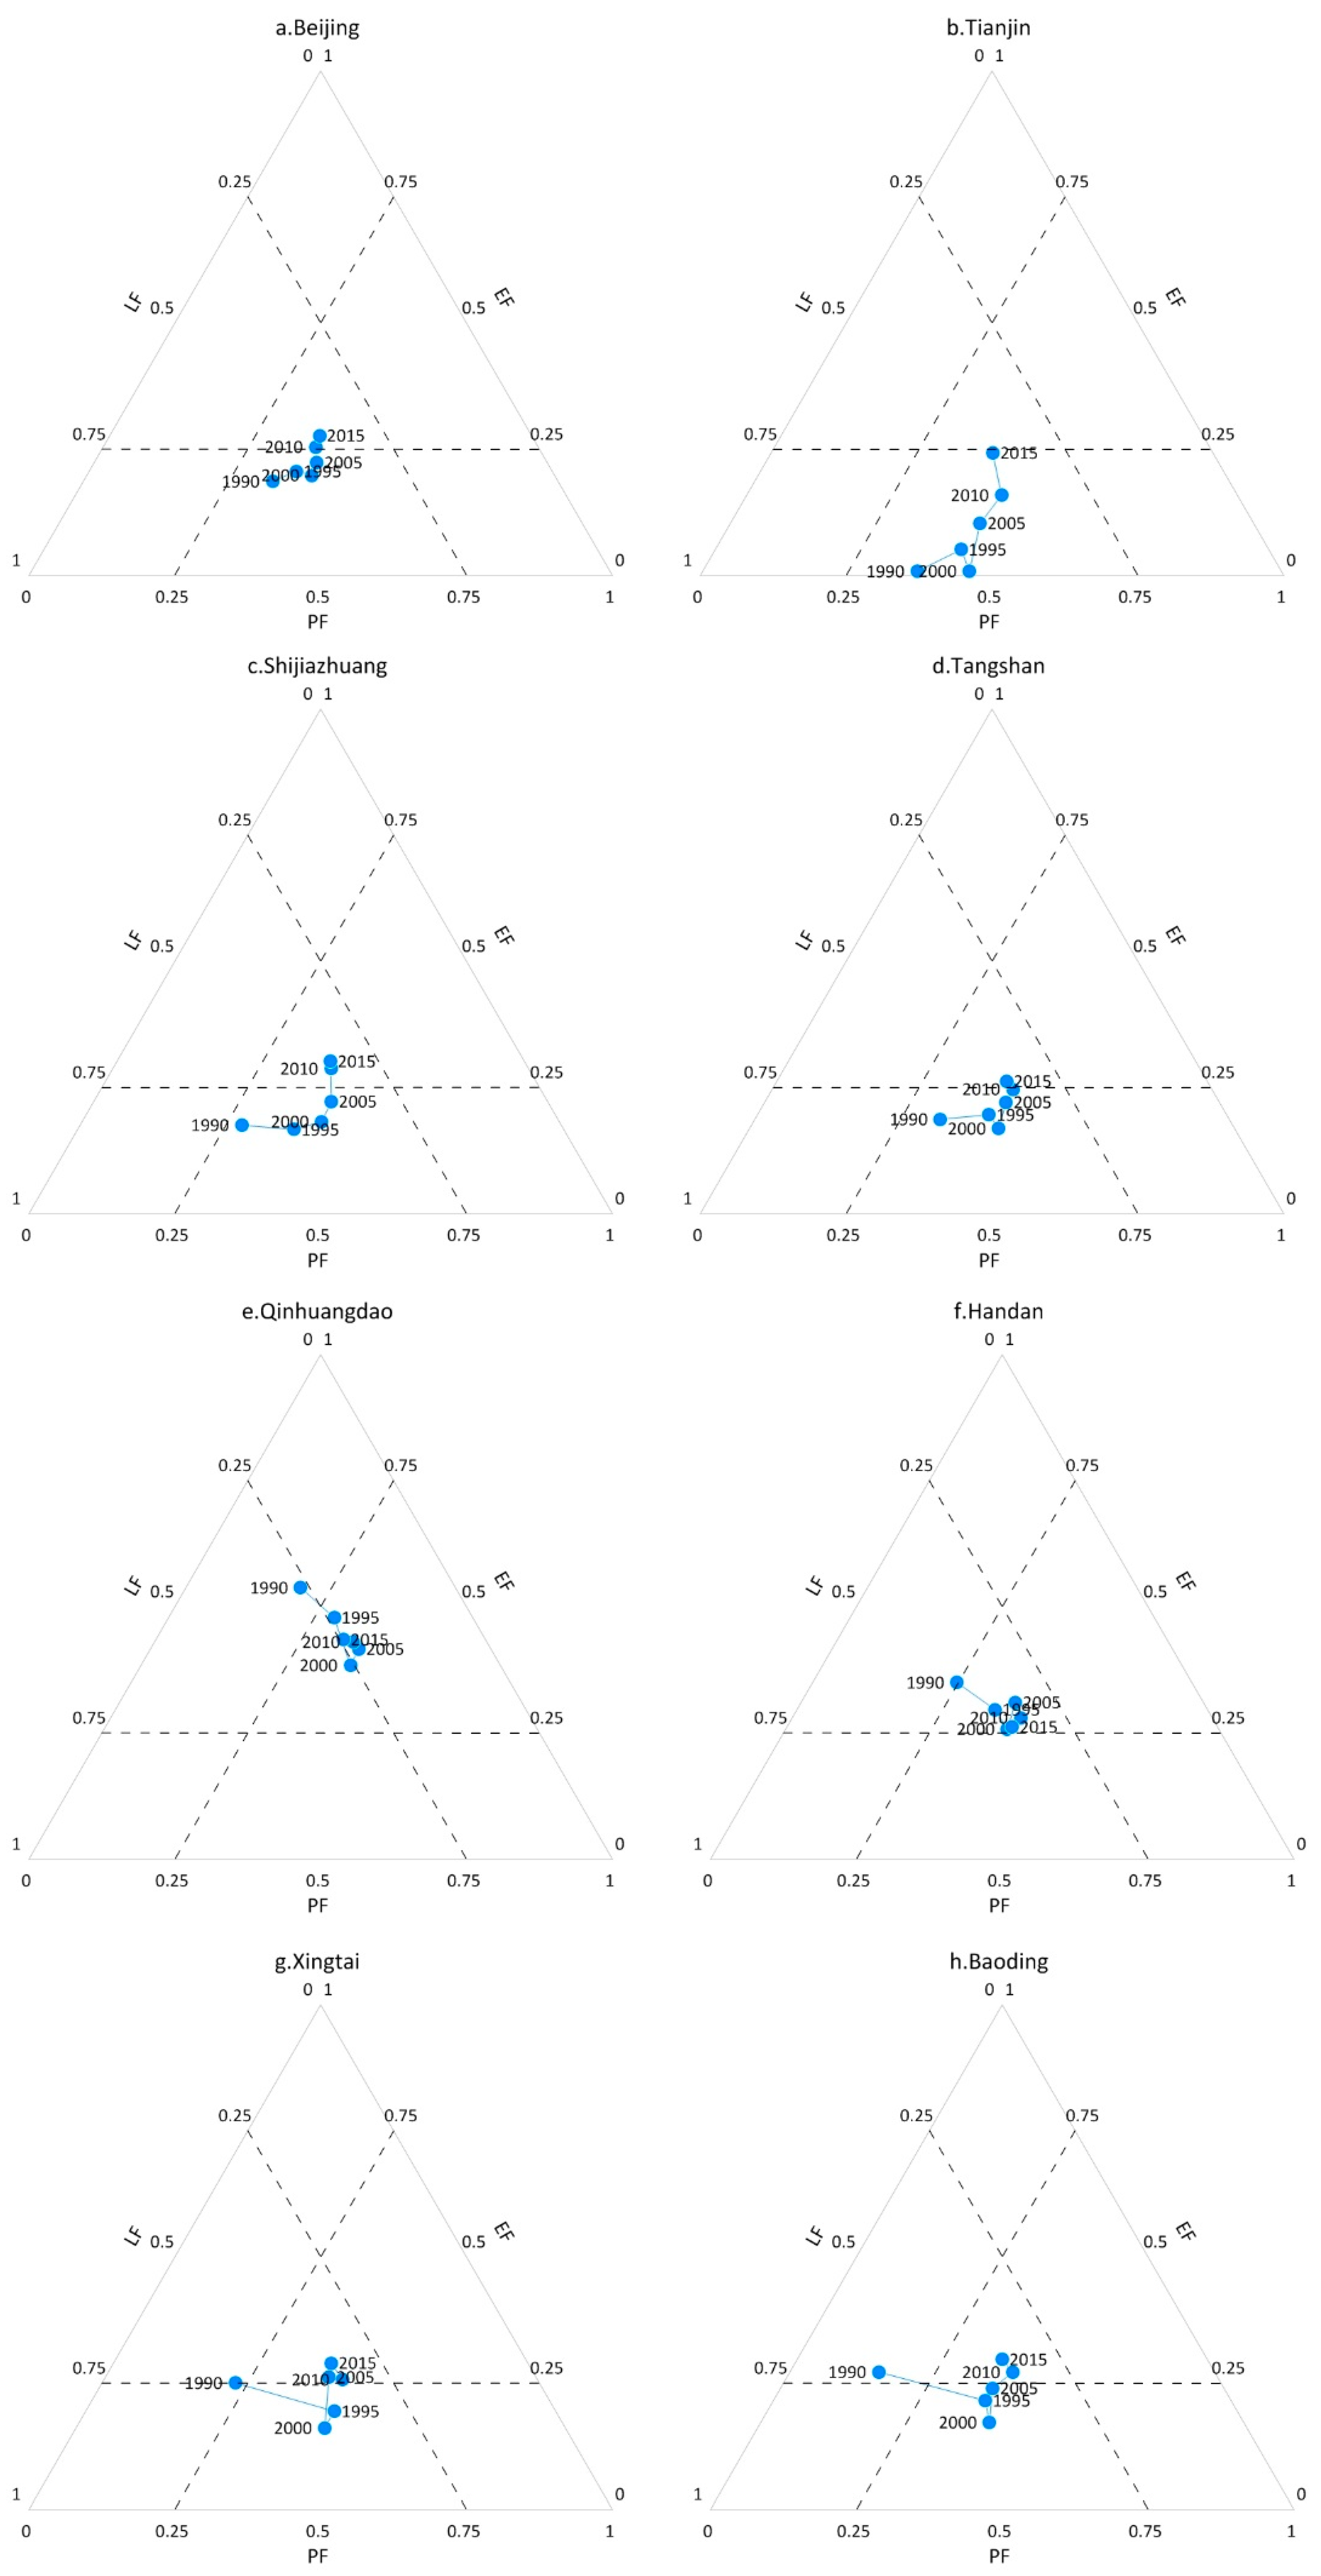
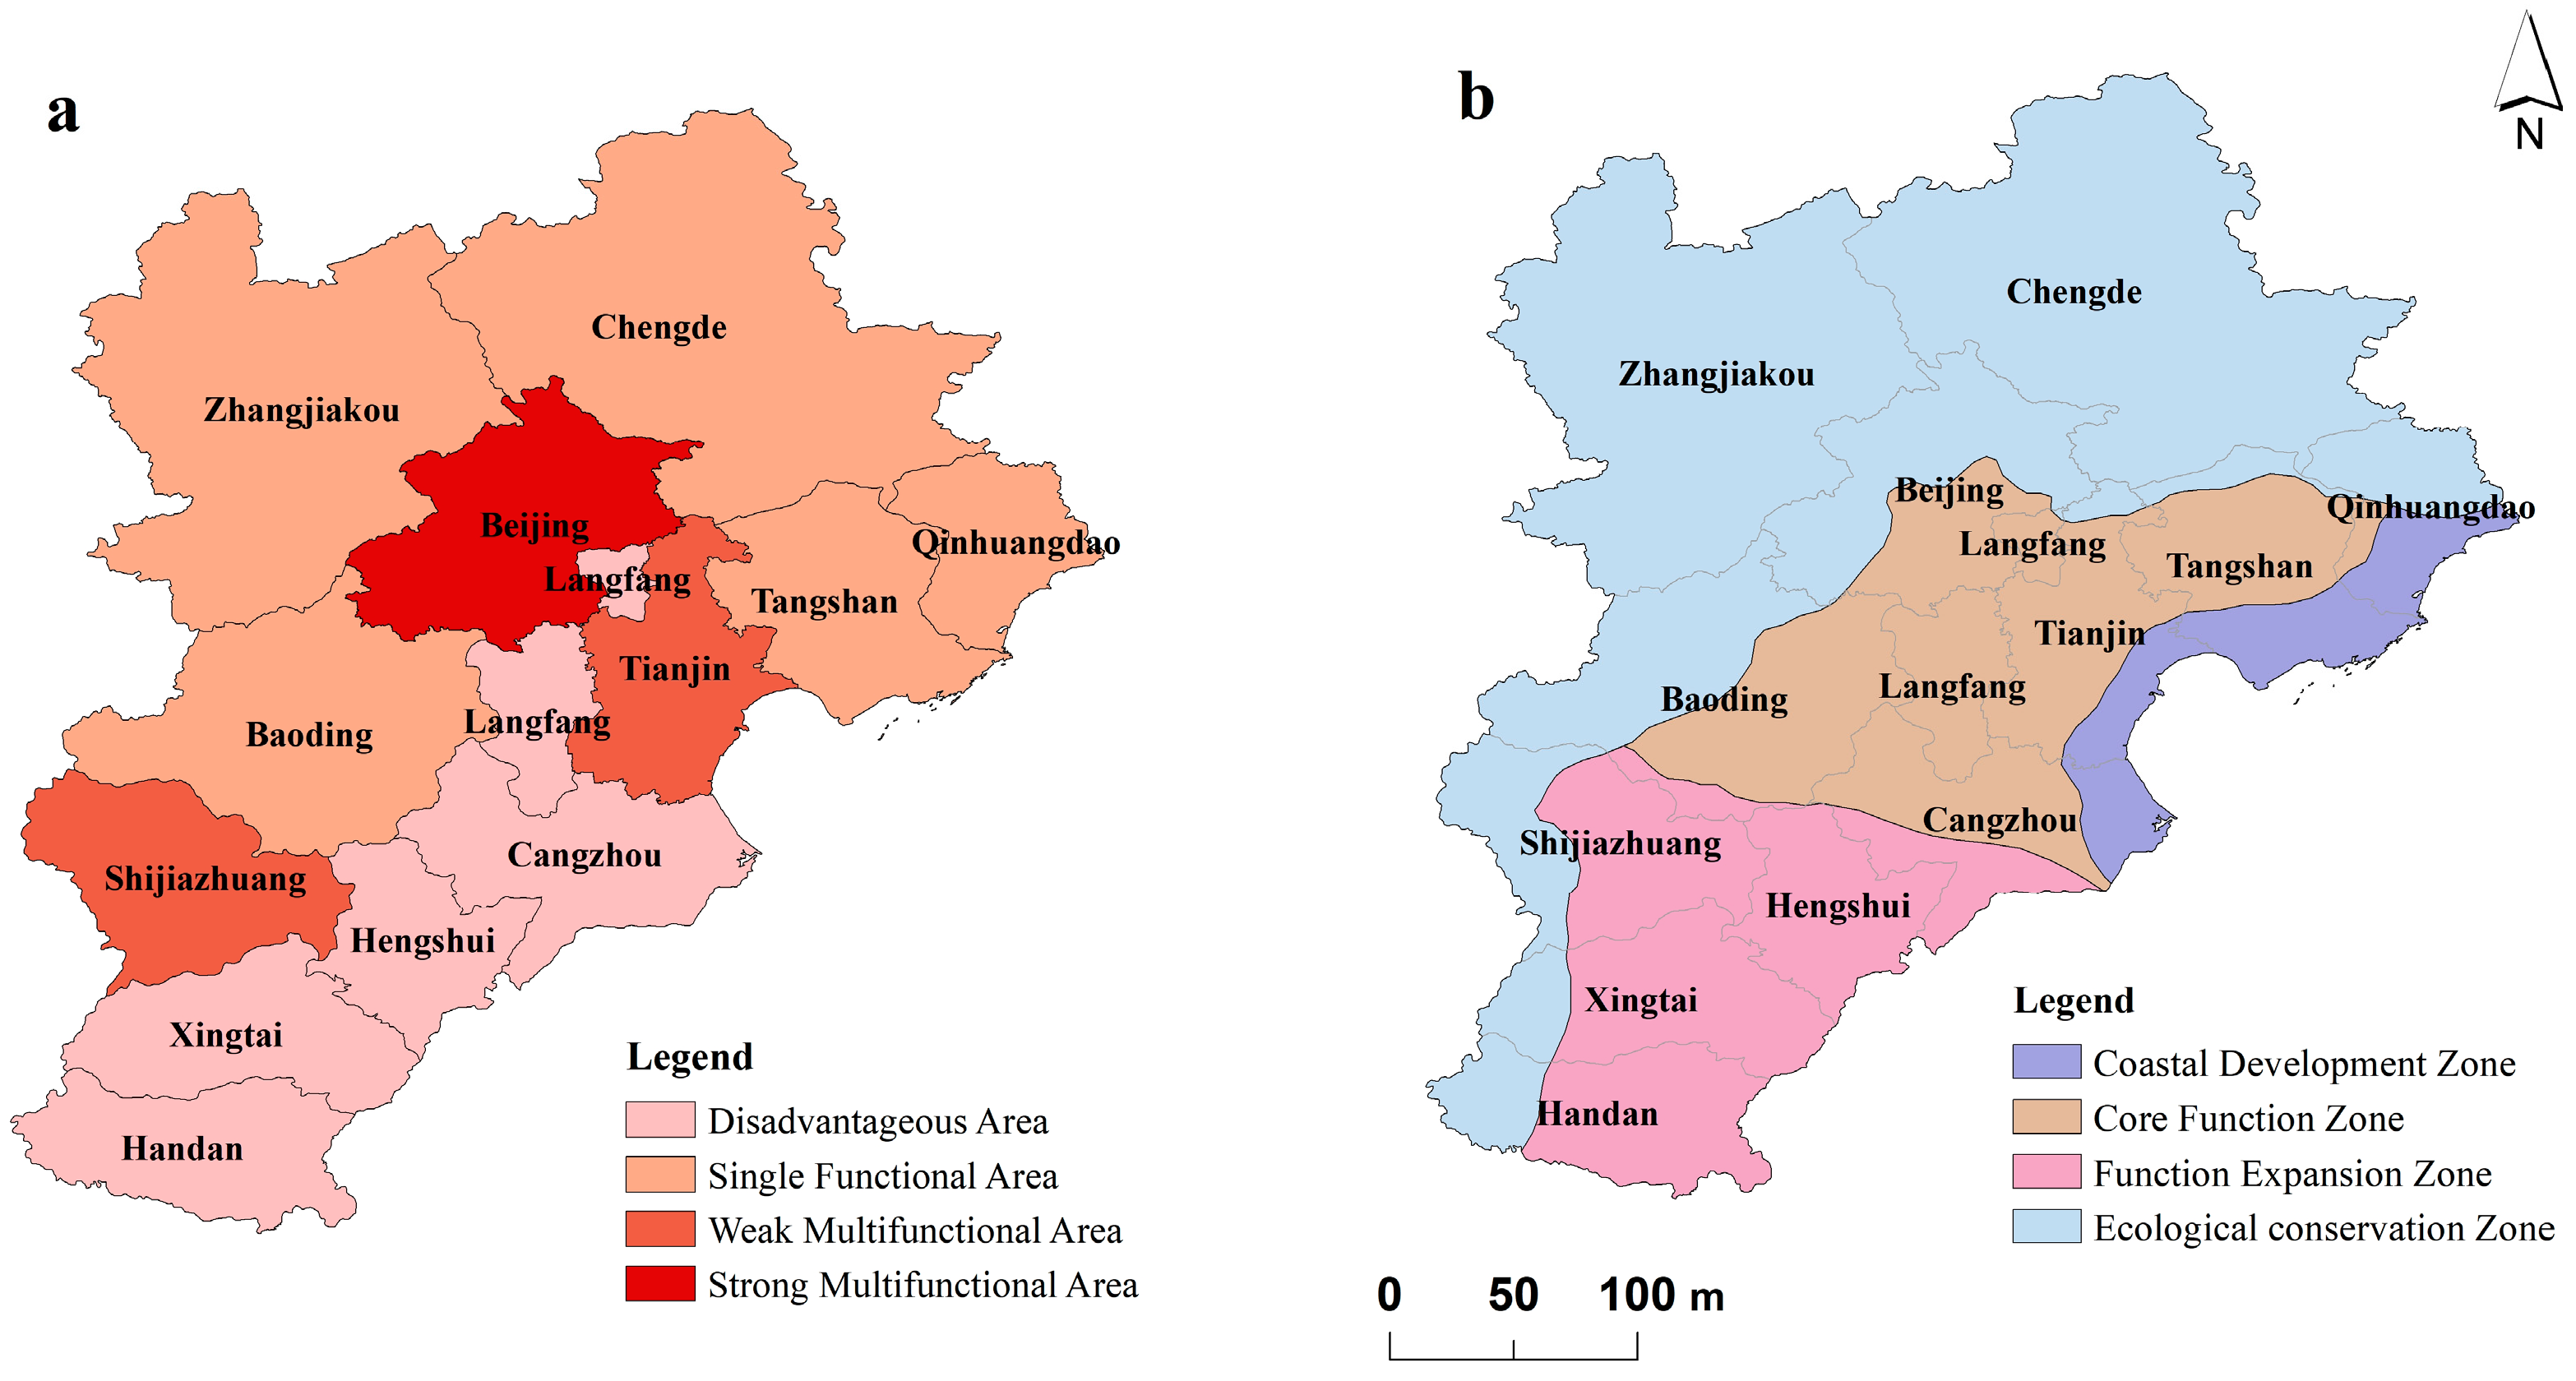
3.2. Stages and Trends of Production-Living-Ecology Land Use Multifunctionality

The production-living-ecology LUMF stage of the BTH region experienced three stages concerning the EL advantages, LP advantages, and ELP balanced types from 1990 to 2015 (Figure 6). Stage one in the EL type refers to an advantageous ecological–living level of LUMF in 1990. The ecology function and living function have a relatively high value, but the production function lags behind. Stage two in the LP type during 1995–2000 shows that the ecology is slightly out of balance. Stage three in the ELP type indicates that LUMF was on the rise and became balanced after 2005. Figure 6 indicates that 2000–2005 was an important turning point from a point of imbalance to that of equilibrium. This demonstrates that the PLELUF changed from single functions to multi-functions, entering into a relatively stable equilibrium.
Table 3 and Figure 7 reflects the production-living-ecology LUMF stage and direction of each city. Beijing, Shijiazhuang, Tianjin, and Tangshan were of the LP type in their early years, and later evolved into either balanced or balanced edge types. In a capital, provincial capital, municipality, or industrial base, the promotion of the ecology function is the key to its equilibrium, for instance, in its green coverage, sewage, and waste treatment. Located in the transition zone between the plateau and plain, Zhangjiakou and Chengde were both ecologically dominant cities in 1990. Zhangjiakou is considered as an E-EP-ELP type, while Chengde has remained as an EP type since 1995. Chengde is a vast but sparsely populated city with poor infrastructure, and its forest and grassland areas account for 76.33%. Construction land, urbanization, and employment numbers are low. Hengshui and Cangzhou were considered as being an L type in 1990, and Hengshui took the lead in entering the ELP stage. Cangzhou’s production is one–sided in its development and has a weak ecology maintenance function. Handan, Xingtai, and Baoding are located in the central and southern part of Hebei province, and have evolved from an EL type to an ELP type.
As can be seen from the distribution map of the LUMF stage of thirteen cities (Figure 8), the production-living-ecology multifunctional state dispersed in 1990, and no city was in balance. By 2015, the distribution tended to appear as concentrated. Nine out of the 13 cities belonged to the balanced type, while two belonged to the LP type and two were of the EP type. Therefore, the spatial differentiation of LUMF in the BTH region should be centered on, due to the functional tendencies of each city.

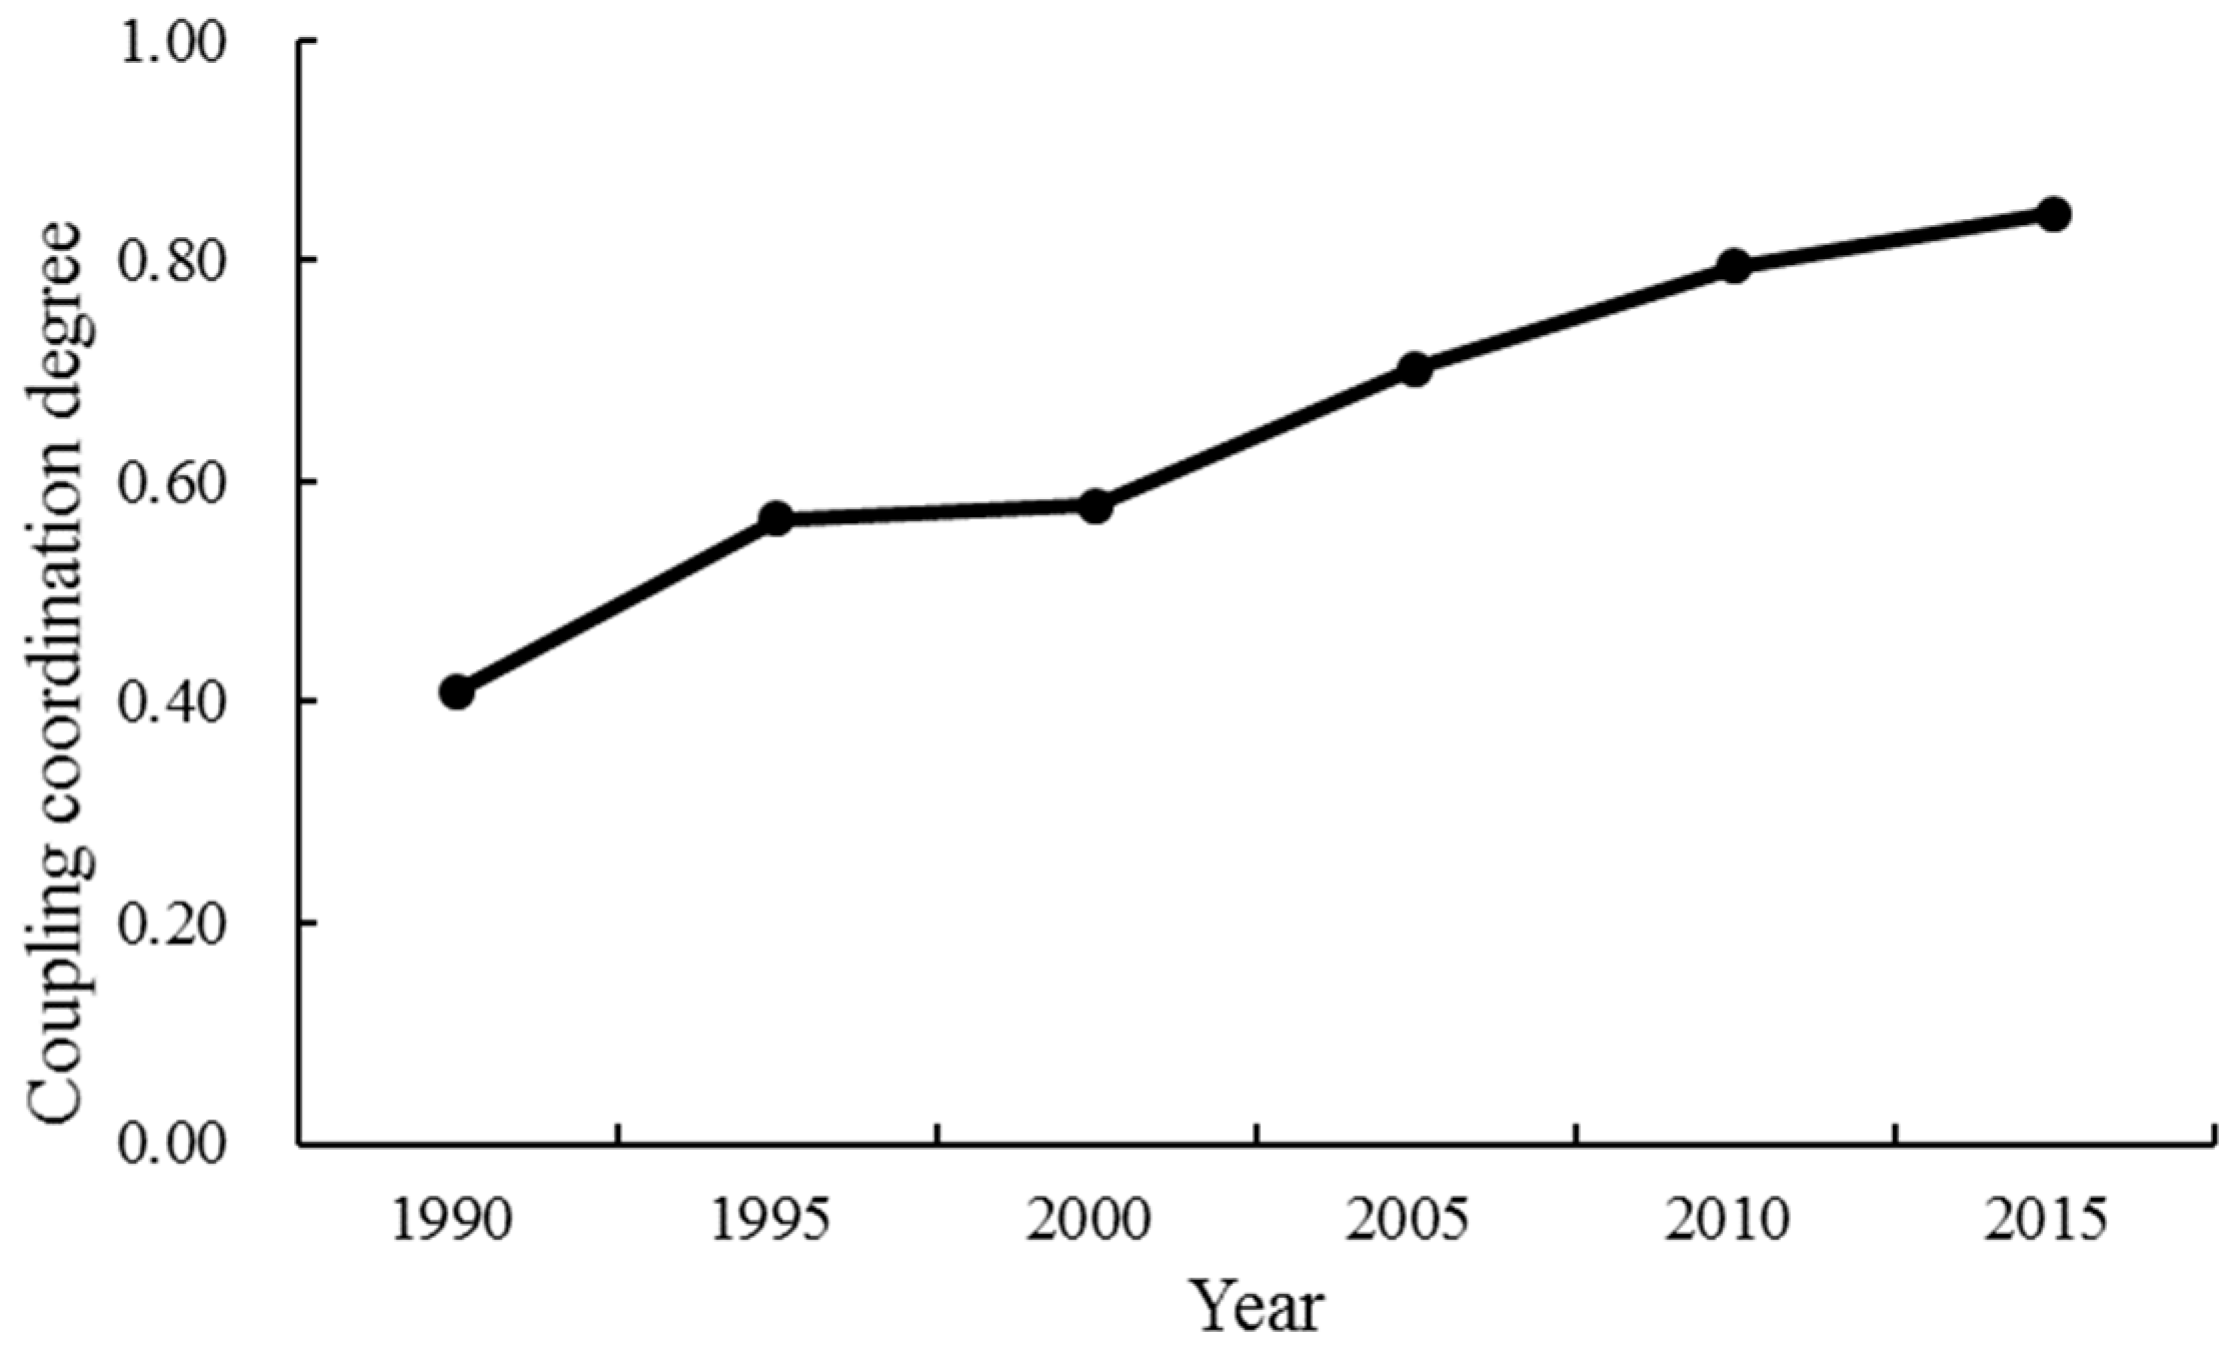
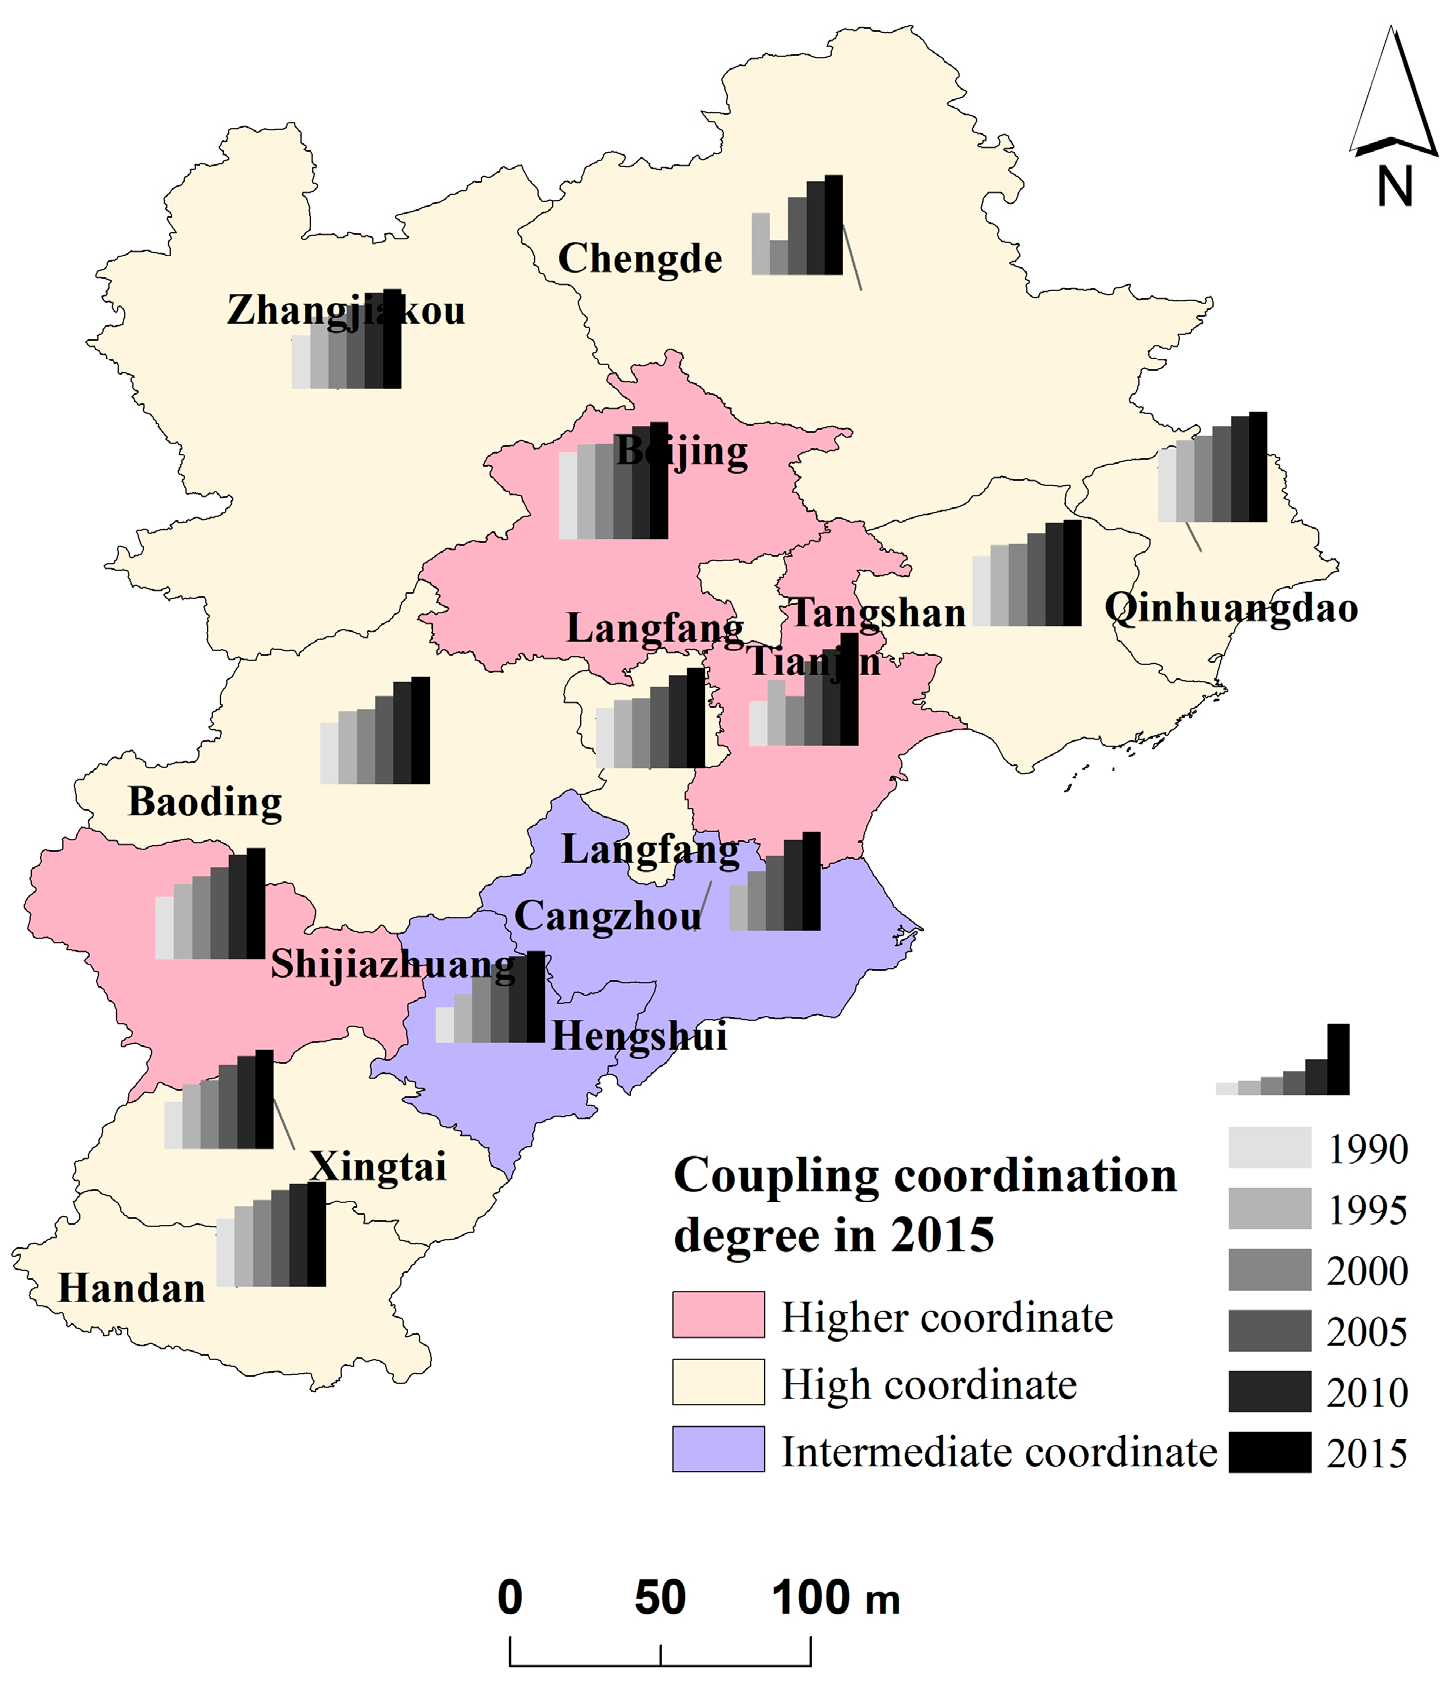
3.3. Coupling Coordination Relationships among Production-Living-Ecology Land Use Functions

The coupling coordination degree (D) increased, except that it had an almost-flat period from 1995 to 2000 (Figure 9). The degree of interaction and influence among the PLELUF gradually grew–—from slightly conflicting in 1990 to highly coordinating in 2015—and was upgraded by four levels. Stage one concerned the conflict in 1990, where the production function was low and the coupling degree (C) of the three functions was 0.41, which shows an initial development stage. Stage two showed that the land use coordination entered a stagnation phase from 1995 to 2000, which had a coupling degree (C) of about 0.57. The ecology function remained unchanged during this period, and the C was weakened. Stage three reached a status of high coordination between 2005 and 2015, reaching 0.84 in 2015.
The D increased from 1990 to 2015, apart from in Tianjin and Chengde (Figure 10). These cities decreased in 2000 following a manifestation in the significant decrease in the C, and a slight decrease in the overall level of LUMF (T). By 2015, most cities were highly coordinated. Higher coordinated cities included Beijing, Tianjin, and Shijiazhuang, while intermediate coordinated cities included Cangzhou and Hengshui. Although the production function of Cangzhou was at the forefront of the study region, its D was the lowest value. In particular, the D of Chengde and Cangzhou was 0 in 1990 because the land use system was at a low-level coupling stage. Moreover, the ecology function of Cangzhou was 0, and the production and living function of Chengde was also 0. Beijing, Tianjin, and Shijiazhuang are expected to lead and drive the common development of the surrounding cities.

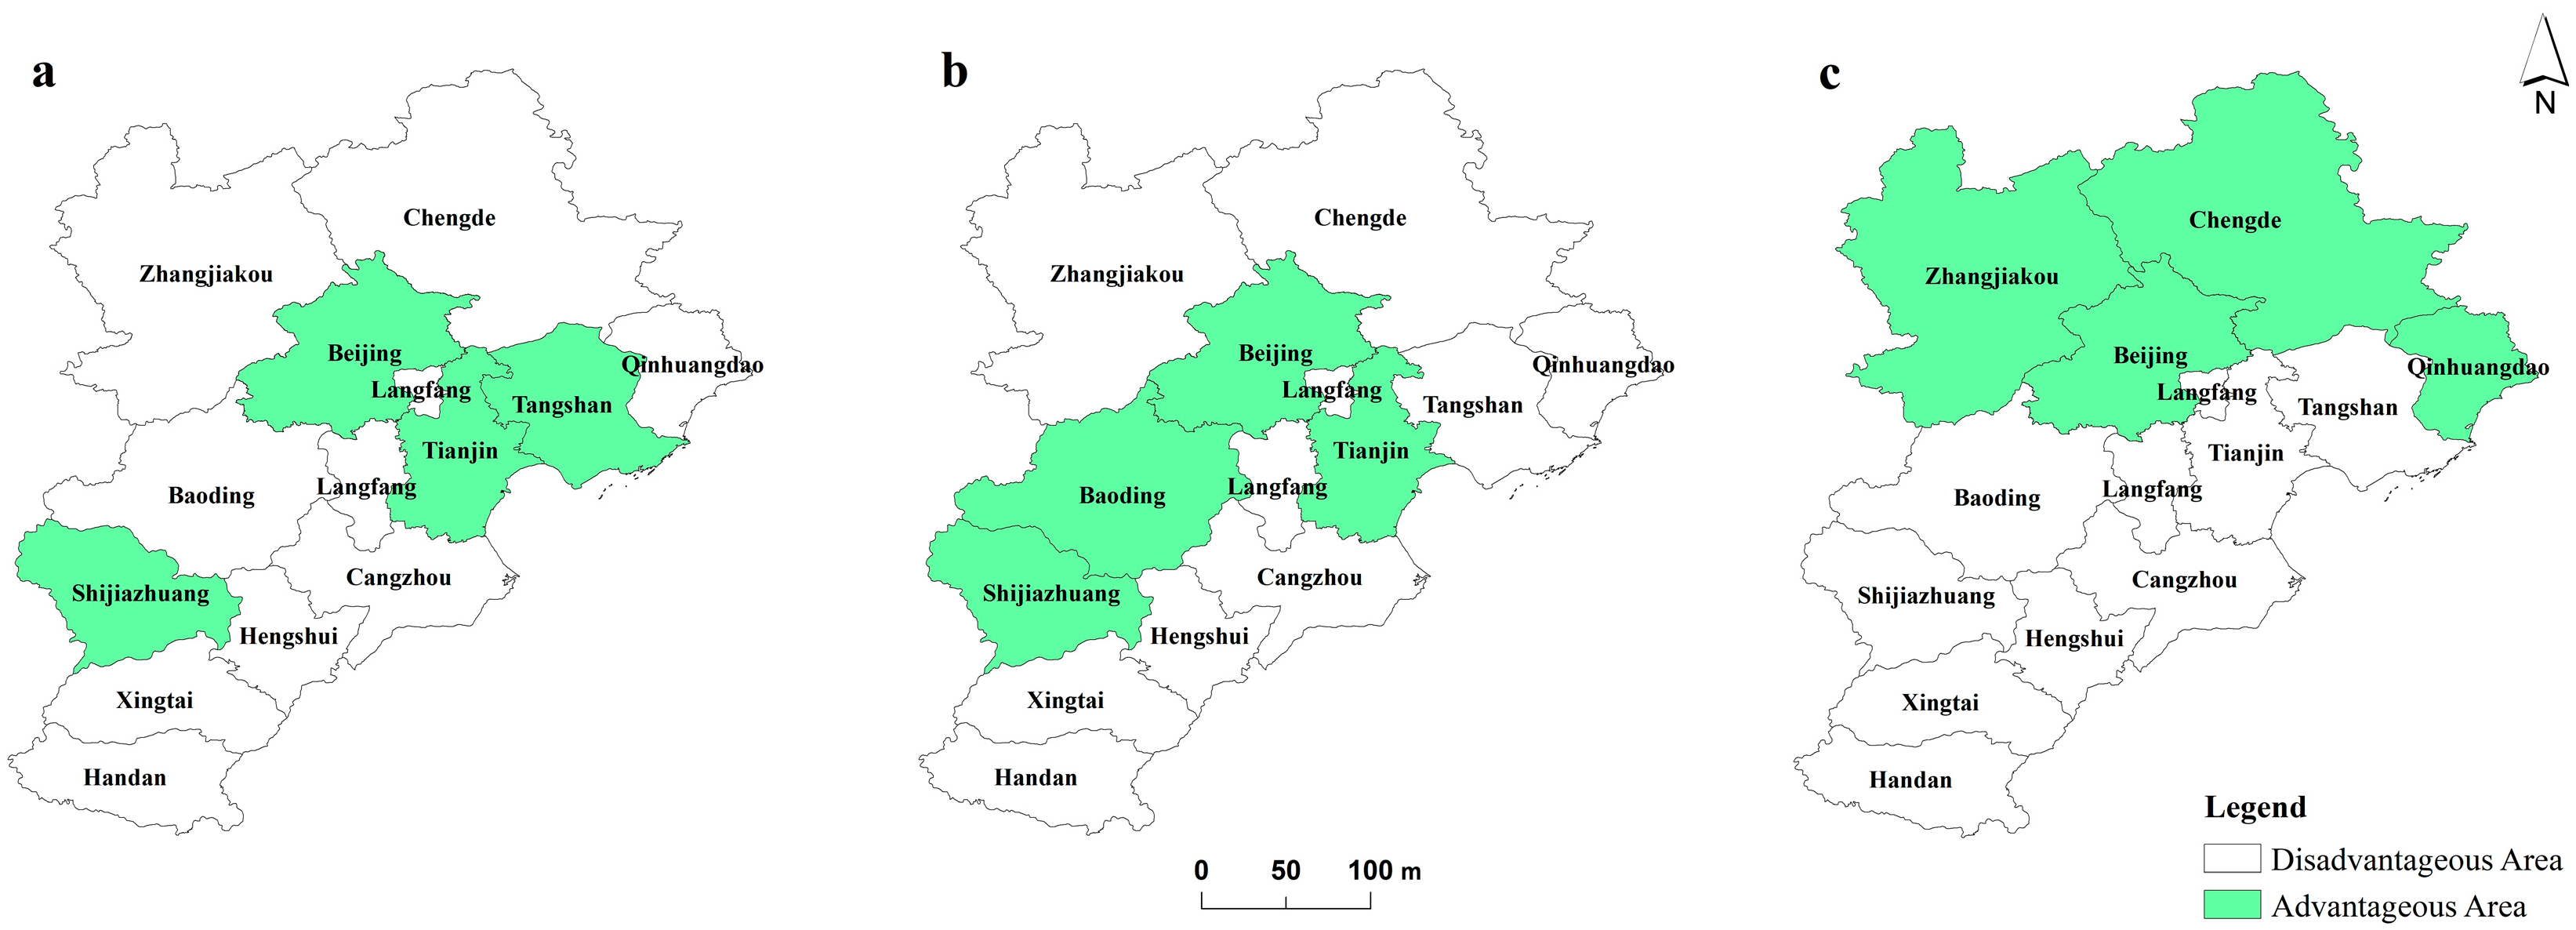
3.4. Advantageous Areas of Production-Living-Ecology Land Use Multifunctionality

The production advantageous areas (Tianjin, Beijing, Tangshan, and Shijiazhuang), living advantageous areas (Beijing, Tianjin, Shijiazhuang, and Baoding), and ecology advantageous areas (Qinhuangdao, Chengde, Zhangjiakou, and Beijing) in 2015 were extracted, respectively (Figure 11). The distribution of production advantageous areas was close to those considered as being living advantageous areas, while the distribution of ecology advantageous areas was different from the former two.
According to the overlaid PLELUF results (Figure 12a), the advantage of the production-living-ecology LUMF in the BTH region shows a high pattern in the north and low pattern in the south. As the capital city of China, the LUMF of Beijing is the most significant amongst all cities in 2015. In contrast, there were no strong multifunctional cities in 1990. Known as China’s political and financial decision center, the secondary industry in Beijing developed early, while the third industry gradually occupied a leading position. The industry output value, passenger transport, and GDP per capita of the city are high. The population density, urbanization, employment, and medical competitiveness contribute towards its living functions. Further, the comparatively high green coverage and habitat quality index favor its ecology function. Tianjin and Shijiazhuang are weak multifunctional cities and served as hot spots for production and living functions. Tangshan, Baoding, Qinhuangdao, Chengde, and Zhangjiakou have become single functional areas. Tangshan benefits from the huge productive forces brought about by its position as an important industrial base in China. The living function advantage of Baoding mainly benefits from the education and employment, while Qinhuangdao, Chengde, and Zhangjiakou have top ecology functions that are attributed to their favorable natural conditions.
Compared with the overall planning of function zoning (Figure 12b), areas with multifunctionality characteristics, such as Beijing and Tianjin, are half located in the core function zone. Essential resources are gathered here, and it is the core area that leads the synergetic development of the study region. The other half are in the ecological conservation zone or coastal development zone. Shijiazhuang, Tangshan, and Baoding are located at the junction of three zones. Zhangjiakou, Chengde, and Qinhuangdao are single ecology functional areas, and are mainly located in the ecological conservation zone. Most of the disadvantaged areas are located in the function expansion zone, where the growth potential is large. By referring to the circle structure, correlations between the function types and the planning can, to a certain extent, explain the scientific nature of the evaluation.

4. Discussion

4.1. Insights into the Changes in the Production-Living-Ecology Land Use Functions

The growth rate of the production function varies in different stages of urban development, with the largest growth rate from 1990 to 1995 and the slowest from 2010 to 2015 in most cities. From 1990 to 1995, China began to build a socialist market economy and accelerated the process of its opening–up [61]. During this period, the city scale of Beijing and Tianjin expanded rapidly [62], and regional cooperation developed both in theory and in practice. The resulting output values of industry, agriculture, and transportation volume increased significantly. After 2010, due to the influence of the international economic and China’s own economic structural change, the growth rate of China’s GDP slowed [63,64]. The industrial and agricultural output value of the BTH region also slowed and transportation volume stagnated.
From 1999 to 2001, water resources per capita in most BTH cities dropped by half or more due to continuous drought in China [65]. Throughout the PLELUF in 2000, the ecology function of most cities decreased, the C was reduced, and the D was stagnant. The crop yield per unit of some cities such as Beijing, Tianjin, Qinhuangdao, Zhangjiakou, and Chengde decreased. In Chengde, compared with 1995, the crop yield per unit was about 25%, the disposable income per capita of rural residents decreased, and the rural–urban income gap nearly doubled. The production function was almost stagnant, and the living function was greatly affected as well. As the most affected city, Chengde suffers from serious soil erosion and poor water conservancy facilities; therefore, its ability to resist drought is poor. For example, the paddy field areas in Chengde were a total of 430 km2. Most fields are flood irrigated, and the average grain productivity of water is 0.6kg/m3 [66]. Water resources have become an important factor that restricts its ecology function and coordination development [67,68].
The rural–urban income gap is an urgent problem that has always fluctuated and remains to be solved [69]. The reasons for the troughs in the temporal change of living functions in Beijing and Tianjin are the same. The increasing extent of per capita disposable incomes of rural residents is less than that of urban residents. In 2015, the income gap in Tianjin narrowed, while Beijing remained high. The dual economic structure and differences in social security are the reasons for these trends [70]. In the 1990s, environmental protection was not taken seriously in Tianjin and Cangzhou. The low greening degree, broken landscape, and serious air pollution have caused instability for the urban ecosystems of these cities. After 2005, the urban greening and air quality has been improved. However, the landscape fragmentation in Cangzhou is still high. Cangzhou is rich in oil and natural gas resources, and its economy has long relied on heavy industry [71]. Its main land use types are cultivated land and construction land.

4.2. Similarities and Differences with Other Studies

In our research, the entropy weight was used to fix the weight of sub–functions, which can fully consider the variation degree of the sub–functions [72,73]. Peng et al. [44] constructed the LUMF distribution map of the BTH region through soil retention, carbon sequestration, water conservation, crop production, and residential space using equal weight so that it stressed ecosystem services. The ecology function of our research combines the water resources, urban environmental regulation, habitat quality, and ecosystem risk. Therefore, we discovered the advantages of Zhangjiakou’s water supply and Beijing’s environmental regulation, in addition to the ecology advantages of Qinhuangdao and Chengde. The living function of our research combines residential space, social stability, employment, education, and medical care. In addition to the residential advantages in Beijing, Tianjin, and Shijiazhuang, we also found the advantages of employment, education, and medical care in Baoding. Besides crop production, the production function also considers industry and commerce. A comprehensive index system and reasonable weight setting is conducive to better characterizing multi–functions and urban differences [19,74].
Compared with studies that use a short time series, a longer time series is helpful to eliminate the interference of slight interannual fluctuations to discover the overall law and direction. Although studies [36] have evaluated land use functions from 2004 to 2013, the annual function always fluctuates, thus it is difficult to identify the turning point. Other studies can prove the reliability of our research to some extent. Some scholars believe that Beijing and Tianjin occupy an absolutely dominant position, and cities around them improve in a more obvious way when compared to cities at the edge of the BTH region. Moreover, the multi-directional horizontal relationship in the urban agglomeration is gradually strengthened [75,76]. Our research also suggests that cities around Beijing and Tianjin usually have a high coupling coordination or LUMF, and the interactional relations are gradually increasing.

4.3. Production-Living-Ecology Land Use Function Optimization and Research Directions

According to the Agenda 2030 goal [77], we have put forward some suggestions to aid land management. Based on the fluctuation of living function in Beijing, popularizing rural education and improving rural social security will help to improve the income of rural residents, so as to achieve the goal of poverty eradication and equitable education. In 2014, national policy proposed to dredge the non-capital functions to core function zones such as Tianjin, Langfang, and Baoding, as well as Shijiazhuang [78,79]. In the future, while Beijing continues to maintain its existing living and ecology functions, it should take the position of a political and cultural center and weaken its production function. Tianjin’s secondary output value and freight volume is much higher than that of others. As a coastal city, it is suitable for innovative manufacturing and international shipping [80,81], to achieve the goal of sustainable production. Serving as urban–rural integrated zones, Hengshui, Xingtai, and Handan have weak PLELUF and poor coordination. We suggest that their infrastructure and quality agriculture should be developed, to assist the goal of regional food security. The ecology functions of Qinhuangdao, Zhangjiakou, and Chengde have long occupied dominant positions and belong to the environmental support zone. We suggest that eco-tourism should be developed while protecting water sources, habitats, animals and plants. Tangshan, Cangzhou, and Qinhuangdao, located along the coast, have obvious advantages in opening–up, so it is suggested to develop coastal industrial clusters.
Our results refer to the overall layout and objective conditions of the BTH region, and point out the consistency between advantageous areas and spatial planning, which are reasonable qualitative verifications. Nevertheless, quantitative evidence is needed to further validate the assessment results [82]. Besides, it is important to refine the PLELUF from the spatial scale to the sub–function level and to implement the index system to the grid or raster scale [21]. A comprehensive gradient analysis of natural conditions and man–made interferences are required to carry out further research [83,84].

5. Conclusions

In this study, production-living-ecology land use functions involving ten sub–functions were divided and spatio-temporally visualized in the BTH region from 1990 to 2015, using qualitative and quantitative methods consisting of an entropy weight method, a triangle model, a coupling coordination degree model, and geospatial modeling tools. The PLELUF are increasing, most cities are gradually becoming balanced, the coupling coordination degree is enhanced, and the LUMF appeared. We found that: (1) the upward trend of the production function was visible. After 2010, the rate slowed to less than 10% for most cities, mainly due to the stagnation of crop yield and transportation. The temporal change of the living function had a relatively steady increasing trend, but the rural–urban income gap sometimes caused troughs. The ecology function fluctuated at the beginning and increased after 2000. Water resources are a limiting factor (2) LUMF experienced ecology–living advantageous, living–production advantageous, and ecology–living–production balanced types, and we found that 2000–2005 was an important turning point towards equilibrium. The balance of the LUMF stage of 13 cities developed from none in 1990 to nine cities in 2015. (3) Apart from an almost flat period from 1995 to 2000, the coupling coordination degree increased from a slight conflict (0.41) to a high coordination (0.84). (4) The pattern of LUMF was high in the north. Beijing was a strong multifunctional city in 2015. Our research not only explicitly evaluates the regional LUMF differences and coupling coordination stage in the study region but also identifies the interaction and turning points among PLELUF over the last 20 years. We suggest that Beijing increase the income of rural residents, and that cities in core function zones carry out industrial upgrading. Tianjin should develop innovative manufacturing and international shipping, and coastal industrial clusters should be built in coastal cities. We also suggest that cities in urban–rural integrated zones develop infrastructure and high-quality agriculture, and the ecological support cities develop eco–tourism. These results can be used for promoting regional coordinated development and urban functional orientation.

Author Contributions

Conceptualization, Z.Y. and E.X.; Formal analysis, E.X.; Funding acquisition, H.Z.; Methodology, Z.Y.; Resources, E.S.; Visualization, Z.Y.; Writing––original draft, Z.Y.; Writing––review & editing, H.Z. All authors have read and agreed to the published version of the manuscript.

Funding

This work was supported by the National Key R&D Program of China (2017YFC1503003) and National Natural Science Foundations of China (41671097).

Conflicts of Interest

The authors declare no conflict of interest.

References

  1. Foley, J.A.; DeFries, R.; Asner, G.P.; Barford, C.; Bonan, G.; Carpenter, S.R.; Chapin, F.S.; Coe, M.T.; Daily, G.C.; Gibbs, H.K.; et al. Global consequences of land use. Science 2005, 309, 570–574. [Google Scholar] [CrossRef] [Green Version]
  2. Mukul, S.A.; Saha, N. Conservation benefits of tropical multifunctional land-Uses in and around a forest protected area of Bangladesh. Land 2017, 6, 2. [Google Scholar] [CrossRef]
  3. Song, W.; Deng, X.Z. Land–use/land–cover change and ecosystem service provision in China. Sci. Total Environ. 2017, 576, 705–719. [Google Scholar] [CrossRef] [PubMed]
  4. De Groot, R. Function–analysis and valuation as a tool to assess land use conflicts in planning for sustainable, multi–functional landscapes. Landsc. Urban Plan. 2006, 75, 175–186. [Google Scholar] [CrossRef]
  5. Verburg, P.H.; Van De Steeg, J.; Veldkamp, A.; Willemen, L. From land cover change to land function dynamics: A major challenge to improve land characterization. J. Environ. Manag. 2009, 90, 1327–1335. [Google Scholar] [CrossRef]
  6. Lovell, S.T. Multifunctional urban agriculture for sustainable land use planning in the United States. Sustainability 2010, 2, 2499–2522. [Google Scholar] [CrossRef] [Green Version]
  7. Junior, R.F.V.; Varandas, S.G.P.; Pacheco, F.A.L.; Pereira, V.R.; Santos, C.F.; Cortes, R.M.V.; Fernandes, L.F.S. Impacts of land use conflicts on riverine ecosystems. Land Use Policy 2015, 43, 48–62. [Google Scholar] [CrossRef] [Green Version]
  8. De Groot, R. Functions of Nature: Evaluation of Nature in Environmental Planning, Management and Decision Making; Wolters–Noordhoff BV: Groningen, The Netherlands, 1992. [Google Scholar]
  9. De Groot, R.; Wilson, M.; Boumans, R. A typology for the description, classification and valuation of ecosystem functions, goods and services. Ecol. Econ. 2002, 41, 393–408. [Google Scholar] [CrossRef] [Green Version]
  10. Willemen, L.; Verburg, P.H.; Hein, L.; Mensvoort, M.E.F.V. Spatial characterization of landscape functions. Landsc. Urban Plan. 2008, 88, 34–43. [Google Scholar] [CrossRef]
  11. Liu, J.L.; Liu, Y.S.; Li, Y.R. Classification evaluation and spatial–temporal analysis of “production–living–ecological” spaces in China. Acta Geogr. Sin. 2017, 72, 1290–1304. (In Chinese) [Google Scholar]
  12. Liao, G.T.; He, P.; Gao, X.S.; Deng, L.J.; Zhang, H.; Feng, N.N.; Zhou, W.; Deng, O.P. The production–living–ecological land classification system and its characteristics in the hilly area of Sichuan province, southwest China based on identification of the main functions. Sustainability 2019, 11, 1600. [Google Scholar] [CrossRef] [Green Version]
  13. Zhang, H.Q.; Xu, E.Q.; Zhu, H.Y. Ecological–living–productive land classification system in China. J. Resour. Ecol. 2017, 8, 121–128. [Google Scholar]
  14. CPC Central Committee, State Council. The Rural Revitalization Strategic Plan (2018–2022). Available online: https://bit.ly/2TzfFJd (accessed on 22 May 2020).
  15. Tipraqsa, P.; Craswell, E.T.; Noble, A.D.; Schmidt-Vogt, D. Resource integration for multiple benefits: Multifunctionality of integrated farming systems in Northeast Thailand. Agric. Syst. 2007, 94, 694–703. [Google Scholar] [CrossRef]
  16. Song, X.Q.; Huang, Y.; Wu, Z.F.; Ouyang, Z. Does cultivated land function transition occur in China? J. Geogr. Sci. 2015, 25, 817–835. [Google Scholar] [CrossRef]
  17. Taleai, M.; Sharifi, A.; Sliuzas, R.; Mesgari, M. Evaluating the compatibility of multi–functional and intensive urban land uses. Int. J. Appl. Earth Obs. Geoinf. 2007, 9, 375–391. [Google Scholar] [CrossRef]
  18. Pérez–Soba, M.; Petit, S.; Jones, L.; Bertrand, N.; Briquel, V.; Omodei-Zorini, L.; Contini, C.; Helming, K.; Farrington, J.H.; Mossello, M.T.; et al. Land Use Functions—a Multifunctionality Approach to Assess the Impact of Land Use Changes on Land Use Sustainability//Sustainability Impact Assessment of Land Use Changes; Springer: Berlin/Heidelberg, Germany, 2008; pp. 375–404. [Google Scholar]
  19. Wiggering, H.; Dalchow, C.; Glemnitz, M.; Helming, K.; Müller, K.; Schultz, A.; Stachow, U.; Zander, P. Indicators for multifunctional land use—Linking socio–economic requirements with landscape potentials. Ecol. Indic. 2006, 6, 238–249. [Google Scholar] [CrossRef]
  20. Fan, Y.T.; Jin, X.B.; Gan, L. Spatial identification and dynamic analysis of land use functions reveals distinct zones of multiple functions in eastern China. Sci. Total Environ. 2018, 642, 33–44. [Google Scholar] [CrossRef] [PubMed]
  21. Zhang, Y.N.; Long, H.L.; Tu, S.S.; Ge, D.Z.; Ma, L.; Wang, L.Z. Spatial identification of land use functions and their tradeoffs/synergies in China: Implications for sustainable land management. Ecol. Indic. 2019, 107, 105550. [Google Scholar] [CrossRef]
  22. Costanza, R.; d’Arge, R.; De Groot, R.; Farber, S.; Grasso, M.; Hannon, B.; Limburg, K.; Naeem, S.; O’Neill, R.V.; Paruelo, J.; et al. The value of the world’s ecosystem services and natural capital. Nature 1997, 387, 253–260. [Google Scholar] [CrossRef]
  23. Gong, J.; Liu, D.Q.; Zhang, J.X.; Xie, Y.C.; Cao, E.J.; Li, H.Y. Tradeoffs/synergies of multiple ecosystem services based on land use simulation in a mountain–basin area, western China. Ecol. Indic. 2019, 99, 283–293. [Google Scholar] [CrossRef]
  24. Wang, S.J.; Ma, H.; Zhao, Y.B. Exploring the relationship between urbanization and the eco–environment—A case study of Beijing-Tianjin-Hebei region. Ecol. Indic. 2014, 45, 171–183. [Google Scholar] [CrossRef]
  25. Belmeziti, A.; Cherqui, F.; Kaufmann, B. Improving the multi–functionality of urban green spaces: Relations between components of green spaces and urban services. Sustain. Cities Soc. 2018, 43, 1–10. [Google Scholar] [CrossRef]
  26. Jiang, C.; Zhang, H.Y.; Zhang, Z.D. Spatially explicit assessment of ecosystem services in China’s Loess Plateau: Patterns, interactions, drivers, and implications. Glob. Planet. Chang. 2018, 161, 41–52. [Google Scholar] [CrossRef]
  27. Hermann, A.; Kuttner, M.; Hainz–Renetzeder, C.; Konkoly-Gyuró, É.; Tirászi, Á.; Brandenburg, C.; Allex, B.; Zienerc, K.; Wrbka, T. Assessment framework for landscape services in European cultural landscapes: An Austrian Hungarian case study. Ecol. Indic. 2014, 37, 229–240. [Google Scholar] [CrossRef]
  28. Stürck, J.; Verburg, P.H. Multifunctionality at what scale? A landscape multifunctionality assessment for the European Union under conditions of land use change. Landsc. Ecol. 2017, 32, 481–500. [Google Scholar] [CrossRef] [Green Version]
  29. Liu, C.; Xu, Y.Q.; Huang, A.; Liu, Y.X.; Wang, H.; Lu, L.H.; Sun, P.L.; Zheng, W.R. Spatial identification of land use multifunctionality at grid scale in farming–pastoral area: A case study of Zhangjiakou City, China. Habitat Int. 2018, 76, 48–61. [Google Scholar] [CrossRef]
  30. Peng, J.; Hu, X.X.; Qiu, S.J.; Hu, Y.N.; Meersmans, J.; Liu, Y.X. Multifunctional landscapes identification and associated development zoning in mountainous area. Sci. Total Environ. 2019, 660, 765–775. [Google Scholar] [CrossRef] [Green Version]
  31. Millennium Ecosystem Assessment. Ecosystems and Human Well-being; Island Press: Washington, DC, USA, 2005; pp. 1–10. [Google Scholar]
  32. Odum, H.T.; Odum, E.P. The energetic basis for valuation of research in Latin America: The state of the art. Ecosyst. Serv. 2012, 41, 7–10. [Google Scholar]
  33. Villa, F.; Bagstad, K.J.; Voigt, B.; Johnson, G.W.; Portela, R.; Honzak, M.; Batker, D. A methodology for adaptable and robust ecosystem services assessment. PLoS ONE 2014, 9, e91001. [Google Scholar] [CrossRef]
  34. Labiosa, W.B.; Forney, W.M.; Esnard, A.M.; Mitsova-Boneva, D.; Bernknopf, R.; Hearn, P.; Hogane, D.; Pearlstine, L.; Strong, D.; Gladwin, H.; et al. An integrated multi-criteria scenario evaluation web tool for participatory land-use planning in urbanized areas: The Ecosystem Portfolio Model. Environ. Model. Softw. 2013, 41, 210–222. [Google Scholar] [CrossRef]
  35. Cai, E.X.; Jing, Y.; Liu, Y.L.; Yin, C.H.; Gao, Y.; Wei, J.Q. Spatial–temporal patterns and driving forces of ecological–living–production land in Hubei province, Central China. Sustainability 2018, 10, 66. [Google Scholar] [CrossRef] [Green Version]
  36. Zhou, D.; Xu, J.C.; Lin, Z.L. Conflict or coordination? Assessing land use multi–functionalization using production-living-ecology analysis. Sci. Total Environ. 2016, 577, 136–147. [Google Scholar] [CrossRef] [PubMed]
  37. Peng, L.; Wang, X.X.; Chen, T.T. Multifunctional land–use value mapping and space type classification: A case study of Puge County, China. Nat. Resour. Modeling 2019, 32, 1–24. [Google Scholar] [CrossRef]
  38. Wang, L.Y.; Li, F.X.; Gong, Y.; Jiang, P.H.; Huang, Q.H.; Hong, W.Y.; Chen, D. A quality assessment of national territory use at the city level: A planning review perspective. Sustainability 2016, 8, 145. [Google Scholar] [CrossRef] [Green Version]
  39. Hao, S.Y. China’s path to the construction of low–carbon cities in the context of new–style urbanization. China Financ. Econ. Rev. 2014, 2, 3. [Google Scholar]
  40. Xiang, H.; Yang, Q.Y.; Su, K.C.; Zhang, Z.X. Spatiotemporal dynamics and obstacles of the multi–functionality of land use in Xiangxi, China. Appl. Sci. 2019, 9, 3649. [Google Scholar] [CrossRef] [Green Version]
  41. Pinto–Correia, T.; Vos, W. Multifunctionality in Mediterranean landscapes–past and future. New Dimens. Eur. Landsc. 2004, 4, 135–164. [Google Scholar]
  42. Thackway, R.; Freudenberger, D. Accounting for the drivers that degrade and restore landscape functions in Australia. Land 2016, 5, 40. [Google Scholar] [CrossRef] [Green Version]
  43. He, C.Y.; Zhang, D.; Huang, Q.X.; Zhao, Y.Y. Assessing the potential impacts of urban expansion on regional carbon storage by linking the LUSD–urban and InVEST models. Environ. Model. Softw. 2016, 75, 44–58. [Google Scholar] [CrossRef]
  44. Peng, J.; Chen, X.; Liu, Y.X.; Lu, H.L.; Hu, X.X. Spatial identification of multifunctional landscapes and associated influencing factors in the Beijing-Tianjin-Hebei Region, China. Appl. Geogr. 2016, 74, 170–181. [Google Scholar] [CrossRef]
  45. National Bureau of Statistics of China. China City Statistical Yearbook in 2016; China Statistics Press: Beijing, China, 2016. (In Chinese) [Google Scholar]
  46. Ministry of Environmental Protection of China. Bulletin on the State of the Environment of China in 2015; Ministry of Environmental Protection of China: Beijing, China, 2016. (In Chinese)
  47. Pasche, M. Technical progress, structural change, and the environmental Kuznets curve. Ecol. Econ. 2002, 42, 381–389. [Google Scholar] [CrossRef]
  48. CPC Central Committee, State Council. Beijing-Tianjin-Hebei Coordinated Development Plan Outline. 2015. Available online: https://bit.ly/2AWlvxZ (accessed on 22 May 2020).
  49. Carvalho, F.M.V.; Júnior, P.D.M.; Ferreira, L.G. The Cerrado into–pieces: Habitat fragmentation as a function of landscape use in the savannas of central Brazil. Biol. Conserv. 2009, 142, 1392–1403. [Google Scholar] [CrossRef]
  50. Geneletti, D. Using spatial indicators and value functions to assess ecosystem fragmentation caused by linear infrastructures. Int. J. Appl. Earth Obs. Geoinf. 2004, 5, 1–15. [Google Scholar] [CrossRef]
  51. Tallis, H.T.; Ricketts, R.T.; Guerry, A.D. InVEST 2.6.0 User’s Guide: Integrated Valuation of Environmental Services and Tradeoffs; The Natural Capital Project: Stanford, CA, USA, 2014. [Google Scholar]
  52. Terrado, M.; Sabater, S.; Chaplin–Kramer, B.; Mandle, L.; Ziv, G.; Acuñaa, V. Model development for the assessment of terrestrial and aquatic habitat quality in conservation planning. Sci. Total Environ. 2016, 540, 63–70. [Google Scholar] [CrossRef] [Green Version]
  53. Shannon, C.E. Communication theory of secrecy systems. Bell Syst. Tech. J. 1948, 28, 656–715. [Google Scholar] [CrossRef]
  54. Smalley, L.L.; Woosley, J.K. Application of steady state maximum entropy methods to high kinetic energy impacts on ceramic targets. Int. J. Impact Eng. 1999, 23, 869–882. [Google Scholar] [CrossRef]
  55. Amiri, V.; Rezaei, M.; Sohrabi, N. Groundwater quality assessment using entropy weighted water quality index (EWQI) in Lenjanat, Iran. Environ. Earth Sci. 2014, 72, 3479–3490. [Google Scholar] [CrossRef]
  56. Yolcubal, I.; Brusseau, M.L.; Artiola, J.F.; Wierenga, P.; Wilson, L.G. Environmental Physical Properties and Processes. In Environmental Monitoring and Characterization; Elsevier Inc.: Amsterdam, The Netherlands, 2004; pp. 207–239. [Google Scholar]
  57. Xu, F.L.; Zhao, S.S.; Dawson, R.W.; Hao, J.Y.; Zhang, Y.; Tao, S. A triangle model for evaluating the sustainability status and trends of economic development. Ecol. Model. 2006, 195, 327–337. [Google Scholar] [CrossRef]
  58. Peng, J.; Liu, Z.C.; Liu, Y.X.; Hu, X.X.; Wang, A. Multifunctionality assessment of urban agriculture in Beijing City, China. Sci. Total Environ. 2015, 537, 343–351. [Google Scholar] [CrossRef]
  59. Deng, F.M.; Fang, Y.; Xu, L.; Li, Z. Tourism, transportation and low-carbon city system coupling coordination degree: A case study in Chongqing Municipality, China. Int. J. Environ. Res. Public Health 2020, 17, 792. [Google Scholar] [CrossRef] [Green Version]
  60. Shi, T.; Yang, S.Y.; Zhang, W.; Zhou, Q. Coupling coordination degree measurement and spatiotemporal heterogeneity between economic development and ecological environment––––Empirical evidence from tropical and subtropical regions of China. J. Clean. Prod. 2020, 244, 118739. [Google Scholar] [CrossRef]
  61. Wu, X. A New Stage of Reform, Opening Up, and Development (1992–1998). In Contemporary Chinese Rural Reform; Springer: Berlin/Heidelberg, Germany, 2016; pp. 191–233. [Google Scholar]
  62. Wang, L.; Li, C.C.; Ying, Q.; Cheng, X.; Wang, X.Y.; Li, X.Y.; Hu, L.Y.; Liang, L.; Yu, L.; Huang, H.B.; et al. China’s urban expansion from 1990 to 2010 determined with satellite remote sensing. Chin. Sci. Bull. 2012, 57, 2802–2812. [Google Scholar] [CrossRef] [Green Version]
  63. Yang, Y. Brief Analysis of China’s Economic Situation and Trend Forecast//2018 2nd International Conference on Education Science and Economic Management (ICESEM 2018); Atlantis Press: Paris, France, 2018. [Google Scholar]
  64. Yu, D.L. Understanding regional development mechanisms in Greater Beijing Area, China, 1995–2001, from a spatial–temporal perspective. GeoJournal 2014, 79, 195–207. [Google Scholar] [CrossRef]
  65. Zhang, Q.; Yu, H.Q.; Sun, P.; Singh, V.P.; Shi, P.J. Multisource data based agricultural drought monitoring and agricultural loss in China. Glob. Planet. Chang. 2019, 172, 298–306. [Google Scholar] [CrossRef]
  66. Wang, M.M.; Lu, T.F.; Zhang, D.L. Rational development and optimal allocation of water resources in Chengde. Hebei Water Conserv. 2005, 8, 17–18. (In Chinese) [Google Scholar]
  67. Liu, M.; Wei, J.H.; Wang, G.Q.; Wang, F. Water resources stress assessment and risk early warning–a case of Hebei Province China. Ecol. Indic. 2017, 73, 358–368. [Google Scholar] [CrossRef]
  68. Wang, X.K.; Dong, Z.C.; Xu, W.; Luo, Y.; Zhou, T.; Wang, W.Z. Study on spatial and temporal distribution characteristics of coordinated development degree among regional water resources, social economy, and ecological environment systems. Int. J. Environ. Res. Public Health 2019, 16, 4213. [Google Scholar] [CrossRef] [PubMed] [Green Version]
  69. Yang, D.T. Urban-biased policies and rising income inequality in China. Am. Econ. Rev. 1999, 89, 306–310. [Google Scholar] [CrossRef]
  70. Hertel, T.; Zhai, F. Labor market distortions, rural–urban inequality and the opening of China’s economy. Econ. Model. 2006, 23, 76–109. [Google Scholar] [CrossRef] [Green Version]
  71. Zhang, Y.; Qi, H. Research on the evaluation of sustainable development in Cangzhou City based on Neural-Network-AHP. In Proceedings of the 2006 International Conference on Machine Learning and Cybernetics, Dalian, China, 13–16 August 2006; pp. 3144–3147. [Google Scholar]
  72. Cerreta, M.; Poli, G. Landscape services assessment: A hybrid multi–criteria spatial decision support system (MC–SDSS). Sustainability 2017, 9, 1311. [Google Scholar] [CrossRef] [Green Version]
  73. Far, S.T.; Rezaei–Moghaddam, K. Multifunctional agriculture: An approach for entrepreneurship development of agricultural sector. J. Glob. Entrep. Res. 2019, 9, 23. [Google Scholar]
  74. Ochola, W.O.; Kerkides, P. An integrated indicator–based spatial decision support system for land quality assessment in Kenya. Comput. Electron. Agric. 2004, 45, 3–26. [Google Scholar] [CrossRef]
  75. Zhao, M.X.; Wei, J.M.; Wu, K. Functional relationship and complex network evolution of Beijing-Tianjin-Hebei urban agglomeration. J. Urban Plan. 2014, 1, 47–52. (In Chinese) [Google Scholar]
  76. Han, B.L.; Liu, H.X.; Wang, R.S. Urban ecological security assessment for cities in the Beijing-Tianjin-Hebei metropolitan region based on fuzzy and entropy methods. Ecol. Model. 2019, 318, 217–225. [Google Scholar] [CrossRef]
  77. United Nations. Transforming Our World: The 2030 Agenda for Sustainable Development; Working Papers; United Nations: New York, NY, USA, 2015; p. 14. [Google Scholar]
  78. Fang, C.L. Theoretical foundation and patterns of coordinated development of the Beijing-Tianjin-Hebei urban agglomeration. Prog. Geogr. 2017, 36, 15–24. [Google Scholar]
  79. Huang, J.; Yang, X. Urbanization quality evaluation and strategy research of Hebei province. In Proceedings of the 2018 5th International Conference on Industrial Economics System and Industrial Security Engineering (IEIS), Toronto, ON, Canada, 3–6 August 2018; IEEE: Piscataway, NJ, USA, 2018; pp. 1–6. [Google Scholar]
  80. Chang, I.C.C.; Leitner, H.; Sheppard, E. A green leap forward? Eco–state restructuring and the Tianjin–Binhai eco–city model. Reg. Stud. 2016, 50, 929–943. [Google Scholar] [CrossRef] [Green Version]
  81. Todd, D. Changing technology, economic growth and port development: The transformation of Tianjin. Geoforum 1994, 25, 285–303. [Google Scholar] [CrossRef]
  82. Pollard, S.J.T.; Davies, G.J.; Coley, F.; Lemon, M. Better environmental decision making—recent progress and future trends. Sci. Total Environ. 2008, 400, 20–31. [Google Scholar] [CrossRef]
  83. Brown, I.; Castellazzi, M. Scenario analysis for regional decision–making on sustainable multifunctional land uses. Reg. Environ. Chang. 2014, 14, 1357–1371. [Google Scholar] [CrossRef]
  84. Xie, H.L.; He, Y.F.; Xie, X. Exploring the factors influencing ecological land change for China’s Beijing-Tianjin-Hebei region using big data. J. Clean. Prod. 2017, 142, 677–687. [Google Scholar] [CrossRef]
1
In the National Land Uses Plan Outline (2006–2020) issued in 2008, the Chinese government began to emphasize the importance of the “production-living-ecology” land use planning. Then the Rural Revitalization Strategic Plan (2018–2022) issued in 2018 pointed out the need to “optimize production space, reasonably distribute living space, and protect ecological space.”
Figure 1. Location and range of the Beijing-Tianjin-Hebei region, China.
Land 09 00170 g001
Figure 2. The seven types of production-living-ecology land use functions combinations in the triangle model.
Land 09 00170 g002
Figure 3. The flowchart about assessing advantageous areas of production-living-ecology land use functions.
Land 09 00170 g003
Figure 4. Changes in the production-living-ecology land use functions of the Beijing-Tianjin-Hebei region (1990–2015). The abbreviations are production function (PF), living function (LF), and ecology function (EF).
Land 09 00170 g004
Figure 5. Changes in the production-living-ecology land use functions in the thirteen cities (1990–2015). (a) Beijing; (b) Tianjin; (c) Shijiazhuang; (d) Tangshan; (e) Qinhuangdao; (f) Handan; (g) Xingtai; (h) Baoding; (i) Zhangjiakou; (j) Chengde; (k) Cangzhou; (l) Langfang; (m) Hengshui.
Land 09 00170 g005aLand 09 00170 g005b
Figure 6. The stage and trend of the production-living-ecology land use multifunctionality in the Beijing-Tianjin-Hebei region (1990–2015).
Land 09 00170 g006
Figure 7. The stage and trend of the production-living-ecology land use multifunctionality in the thirteen cities in the Beijing-Tianjin-Hebei region (1990–2015). (a) Beijing; (b) Tianjin; (c) Shijiazhuang; (d) Tangshan; (e) Qinhuangdao; (f) Handan; (g) Xingtai; (h) Baoding; (i) Zhangjiakou; (j) Chengde; (k) Cangzhou; (l) Langfang; (m) Hengshui.
Land 09 00170 g007aLand 09 00170 g007b
Figure 8. The land use multifunctionality stages of the thirteen cities in 1990 and 2015, with abbreviations as Beijing (BJ); Tianjin (TJ); Shijiazhuang (SJZ); Tangshan (TS); Qinhuangdao (QHD); Handan (HD); Xingtai (XT); Baoding (BD); Zhangjiakou (ZJK); Chengde (CD); Cangzhou (CZ); Langfang (LF); and Hengshui (HS). (a) 1990; (b) 2015.
Land 09 00170 g008
Figure 9. The coupling coordination degree among the production-living-ecology land use functions in the Beijing-Tianjin-Hebei region (1990–2015).
Land 09 00170 g009
Figure 10. The spatio-temporal patterns of the coupling coordination degree of the thirteen cities in the Beijing-Tianjin-Hebei region (1990–2015).
Land 09 00170 g010
Figure 11. Advantageous cities for each function in the Beijing-Tianjin-Hebei region in 2015, where (a) represents the production function, (b) represents the living function, and (c) represents the ecological function.
Land 09 00170 g011
Figure 12. (a) The production-living-ecology land use multifunctionality assessment result in 2015; (b) the spatial planning of the Beijing-Tianjin-Hebei region.
Land 09 00170 g012
Table 1. Assessment of the index system for production-living-ecology land use multifunctionality in the Beijing-Tianjin-Hebei region.
Land Use FunctionsSub–FunctionsIndicatorsUnitCalculation Methods
Production functionAgricultural production functionGrain yield per area kg ha−1Total grain yield/grain sown area
Agricultural output values per areaRMB 10,000 km−2Total output values of agriculture, forestry, pasturage, and fishery/total land area
Economic development functionIndustry output values per areaBillion RMB km−2Total industrial output value/total land area
GDP per capitaRMB per capita−1Gross domestic product/population
Transportation functionTotal freight volume10,000 tons
Total passenger transport10,000 people
Living functionHabitat functionPermanent population densityCapita km−2Permanent population/total land area
Construction land area per capita10,000 km2 per capita−1Construction land area/population
Social security functionUrbanization levelPercentUrban population /permanent population
Rural-urban income gapUrban disposable incomes/rural net incomes
Employment support functionEmployed persons10,000 people
Medical and educational functionNumber of beds in hospitals10000 beds
Number of college students10,000 people
Ecology functionResources supply functionTotal water resources per capita m3 per capita−1Total water resources/population
Ecology regulation functionCentralized treatment rate of sewage treatment plantPercentTreated sewage /total sewage discharge
Comprehensive utilization rate of general industrial solid wastePercentComprehensive utilization of industrial solid waste/ total amount of industrial solid waste
PM10μg/m3
Ecology maintenance functionGreen coverage in constructed areasPercentGreen coverage area/construction land area
Pathological degree of ecosystem riskPatch number/total area
Habitat qualityInVEST
Table 2. Classification standard of the coupling coordination degree.
Coupling Coordination DegreeLevel
0.0–0.09Higher conflict
0.1–0.19High conflict
0.2–0.29Intermediate conflict
0.3–0.39Low conflict
0.4–0.49Slight conflict
0.5–0.59Barely coordinate
0.6–0.69Low coordinate
0.7–0.79Intermediate coordinate
0.8–0.89High coordinate
0.9–1.00Higher coordinate
Table 3. The coordinates (production function, living function, ecology function) in the triangle model (1990–2015).
City199019952000200520102015
Beijing(0.32, 0.49, 0.19)(0.35, 0.44, 0.21)(0.38, 0.42, 0.20)(0.38, 0.39, 0.23)(0.37, 0.38, 0.25)(0.36, 0.36, 0.28)
Tianjin(0.37, 0.62, 0.01)(0.42, 0.53, 0.05)(0.46, 0.53, 0.01)(0.43, 0.47, 0.10)(0.44, 0.40, 0.16)(0.38, 0.38, 0.24)
Shijiazhuang(0.27, 0.55, 0.18)(0.37, 0.46, 0.17)(0.41, 0.41, 0.18)(0.41, 0.37, 0.22)(0.37, 0.34, 0.29)(0.37, 0.33, 0.30)
Tangshan(0.32, 0.49, 0.19)(0.40, 0.40, 0.20)(0.43, 0.40, 0.17)(0.41, 0.37, 0.22)(0.41, 0.34, 0.25)(0.40, 0.34, 0.26)
Qinhuangdao(0.20, 0.26, 0.54)(0.28, 0.24, 0.48)(0.36, 0.26, 0.38)(0.35, 0.23, 0.42)(0.34, 0.23, 0.43)(0.32, 0.24, 0.44)
Handan(0.25, 0.40, 0.35)(0.34, 0.36, 0.30)(0.38, 0.36, 0.26)(0.37, 0.32, 0.31)(0.39, 0.33, 0.28)(0.39, 0.35, 0.26)
Xingtai(0.23, 0.52, 0.25)(0.43, 0.38, 0.19)(0.43, 0.41, 0.16)(0.39, 0.35, 0.26)(0.41, 0.33, 0.26)(0.37, 0.34, 0.29)
Baoding(0.15, 0.58, 0.27)(0.36, 0.42, 0.22)(0.39, 0.44, 0.17)(0.36, 0.40, 0.24)(0.38, 0.35, 0.27)(0.35, 0.35, 0.30)
Zhangjiakou(0.13, 0.10, 0.77)(0.24, 0.17, 0.59)(0.29, 0.20, 0.51)(0.31, 0.20, 0.49)(0.33, 0.22, 0.45)(0.32, 0.26, 0.42)
Chengde(0.00, 0.00, 1.00)(0.30, 0.11, 0.59)(0.34, 0.00, 0.66)(0.33, 0.10, 0.57)(0.35, 0.16, 0.49)(0.32, 0.17, 0.51)
Cangzhou(0.07, 0.93, 0.00)(0.47, 0.51, 0.02)(0.46, 0.47, 0.07)(0.47, 0.40, 0.13)(0.47, 0.33, 0.20)(0.43, 0.33, 0.24)
Langfang(0.28, 0.48, 0.24)(0.40, 0.42, 0.18)(0.45, 0.42, 0.13)(0.42, 0.38, 0.20)(0.42, 0.35, 0.23)(0.40, 0.34, 0.26)
Hengshui(0.24, 0.55, 0.21)(0.43, 0.43, 0.14)(0.45, 0.37, 0.18)(0.44, 0.32, 0.24)(0.43, 0.30, 0.27)(0.41, 0.32, 0.27)

