Land Cover and Land Use Change in the US Prairie Pothole Region Using the USDA Cropland Data Layer


Abstract
:
1. Introduction
2. Study Area, Data, and Methodology
2.1. Study Area
2.2. Data
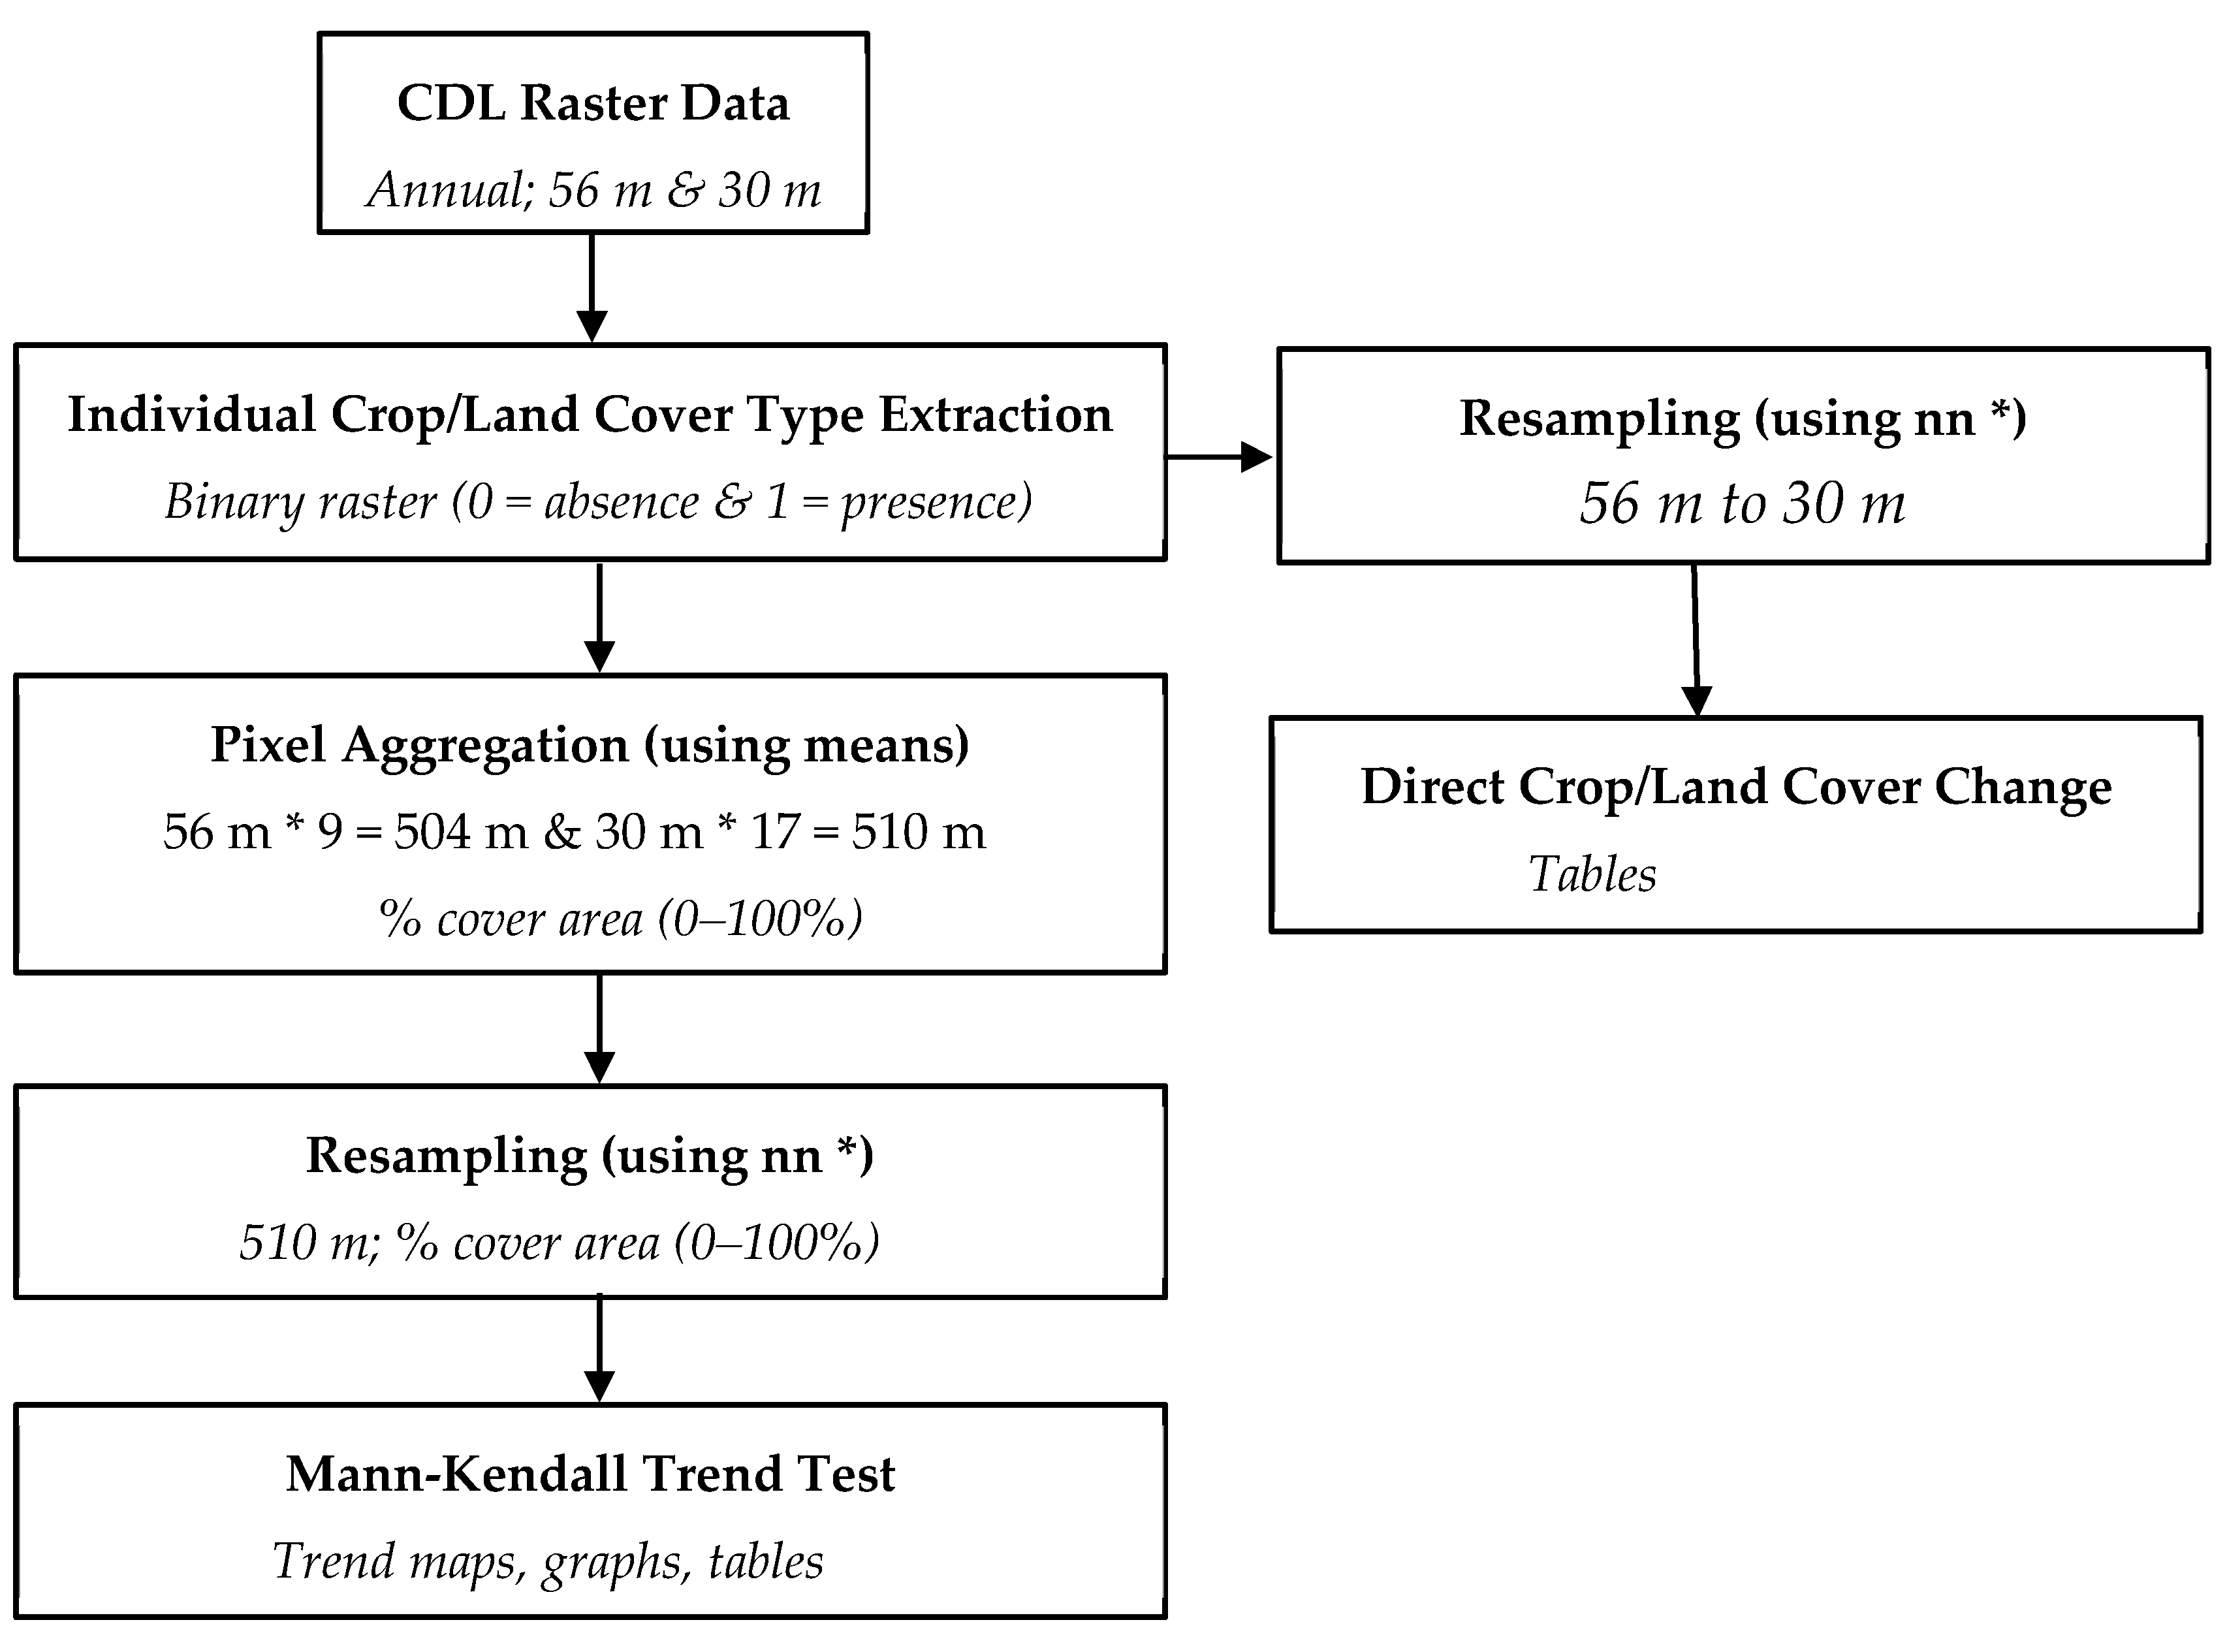
2.3. Methods
3. Results
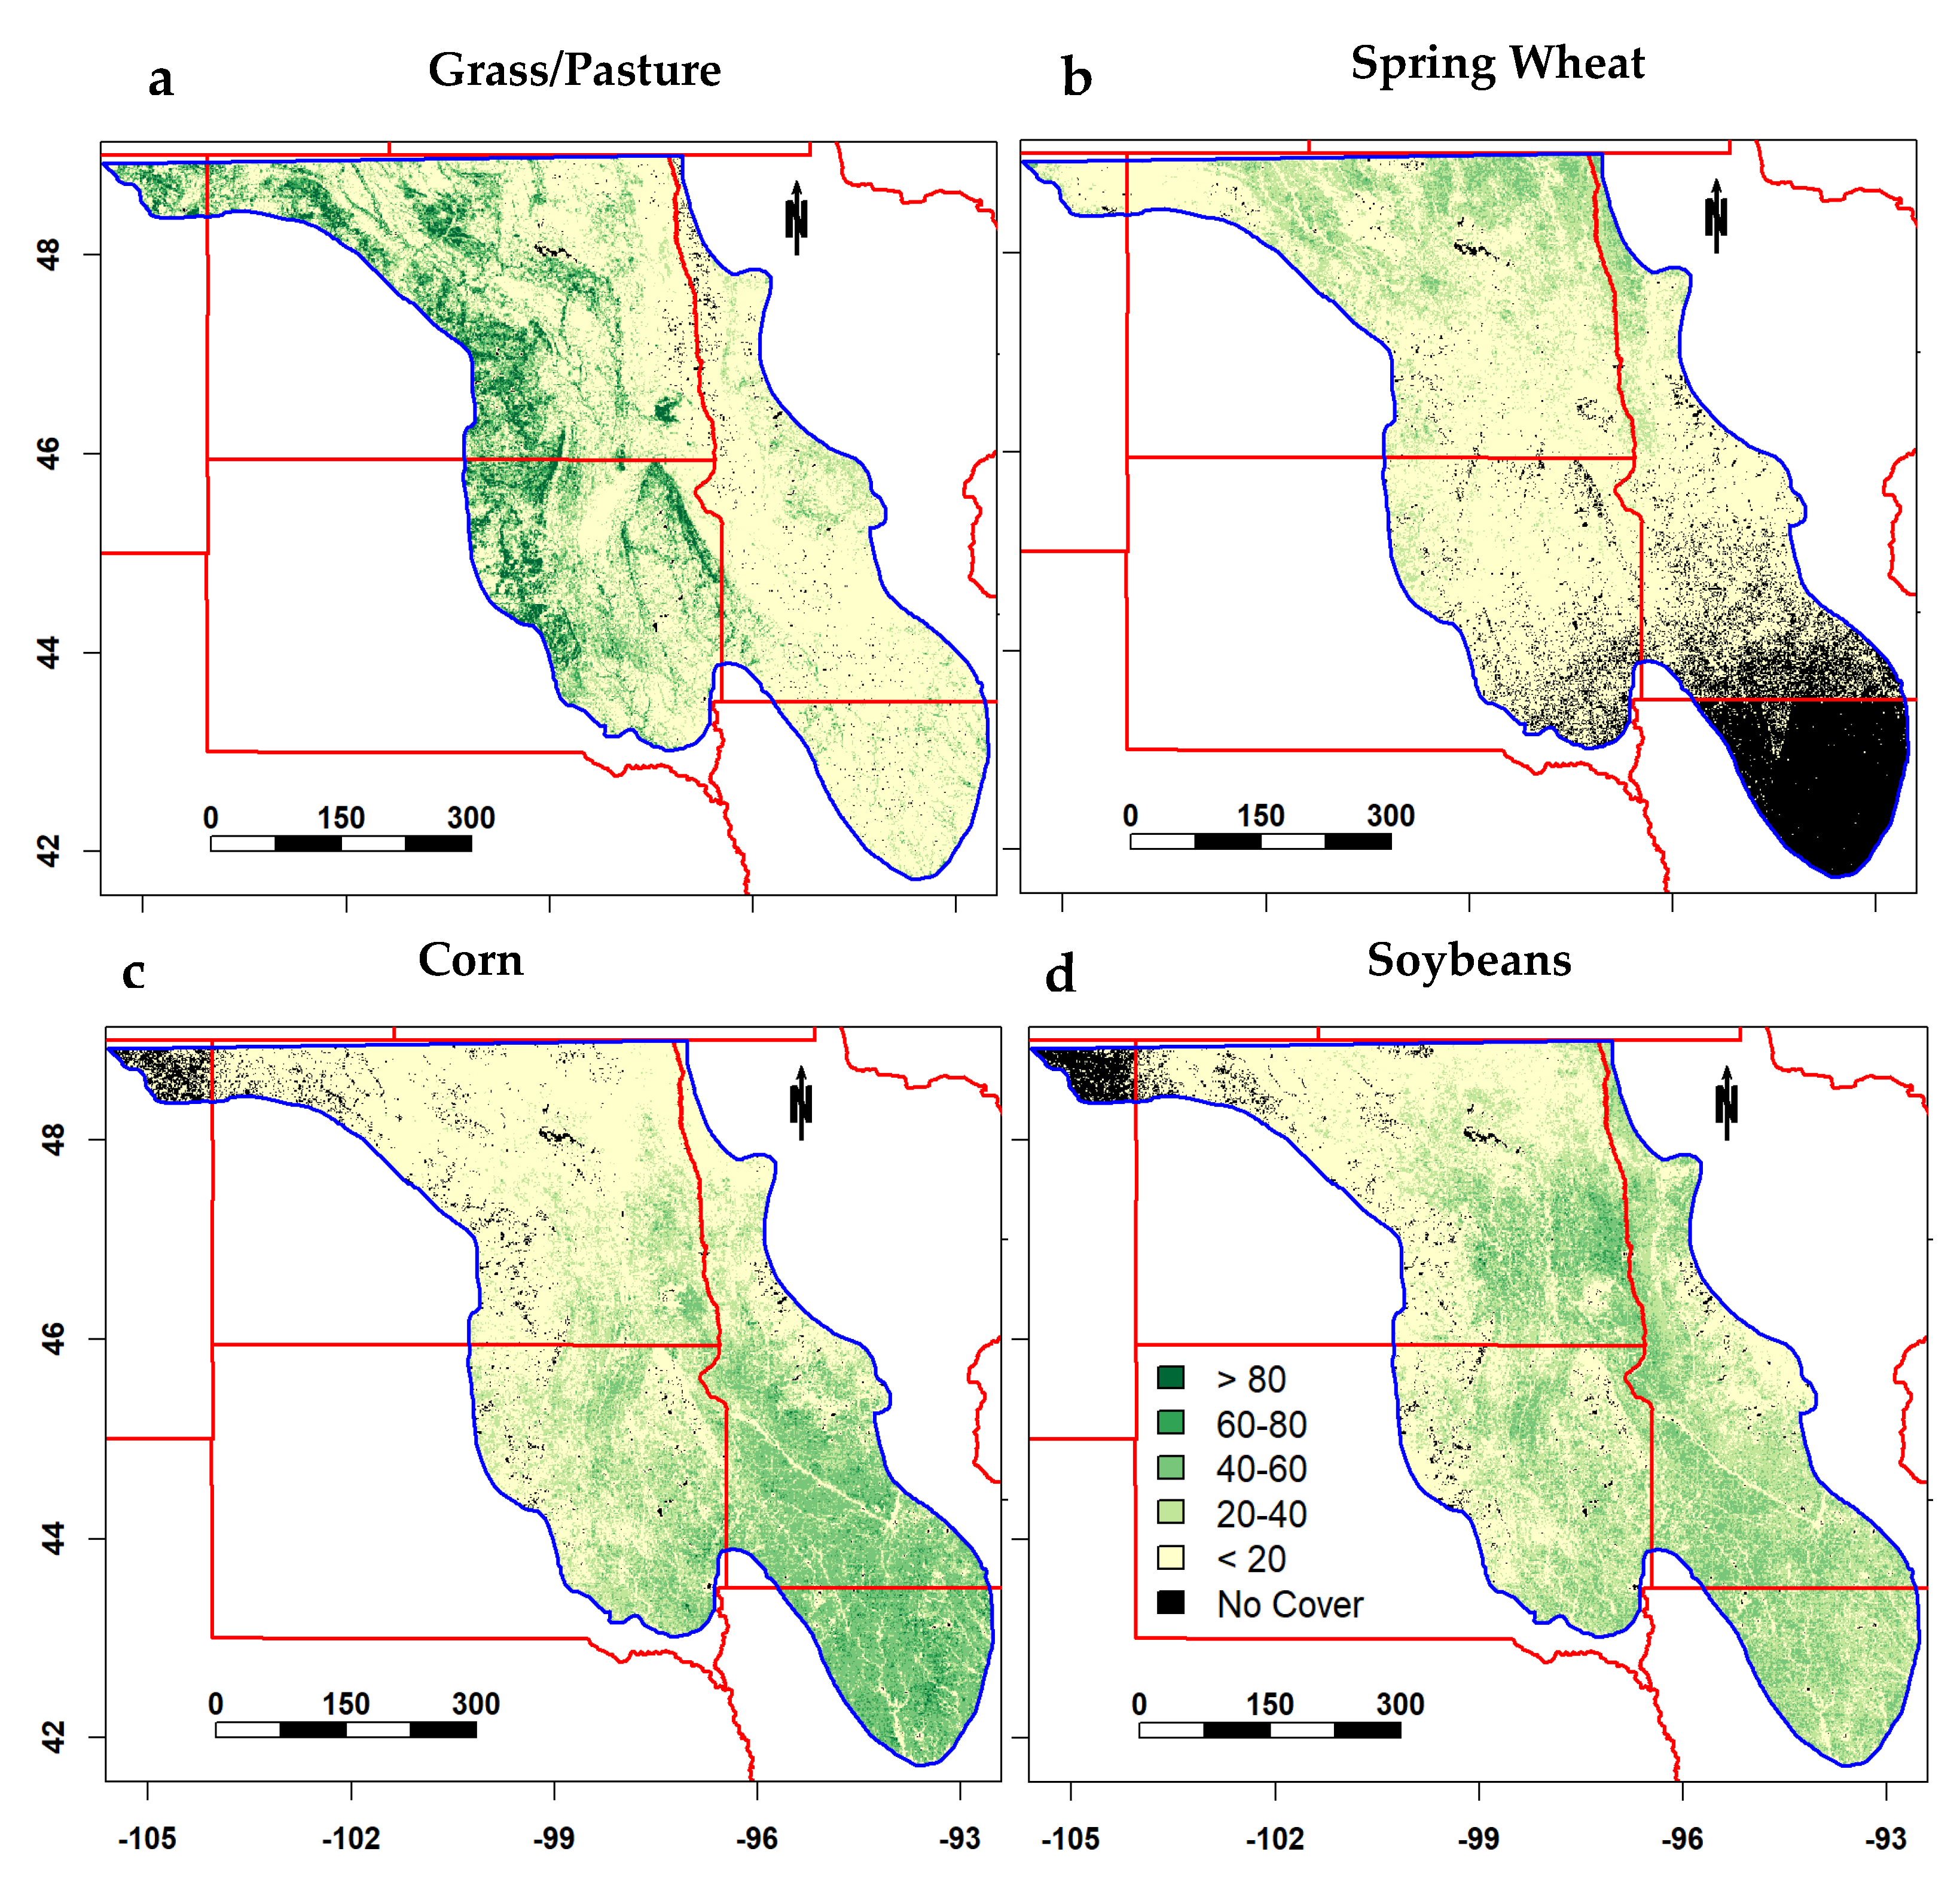
3.1. Mean Land Cover Percentage
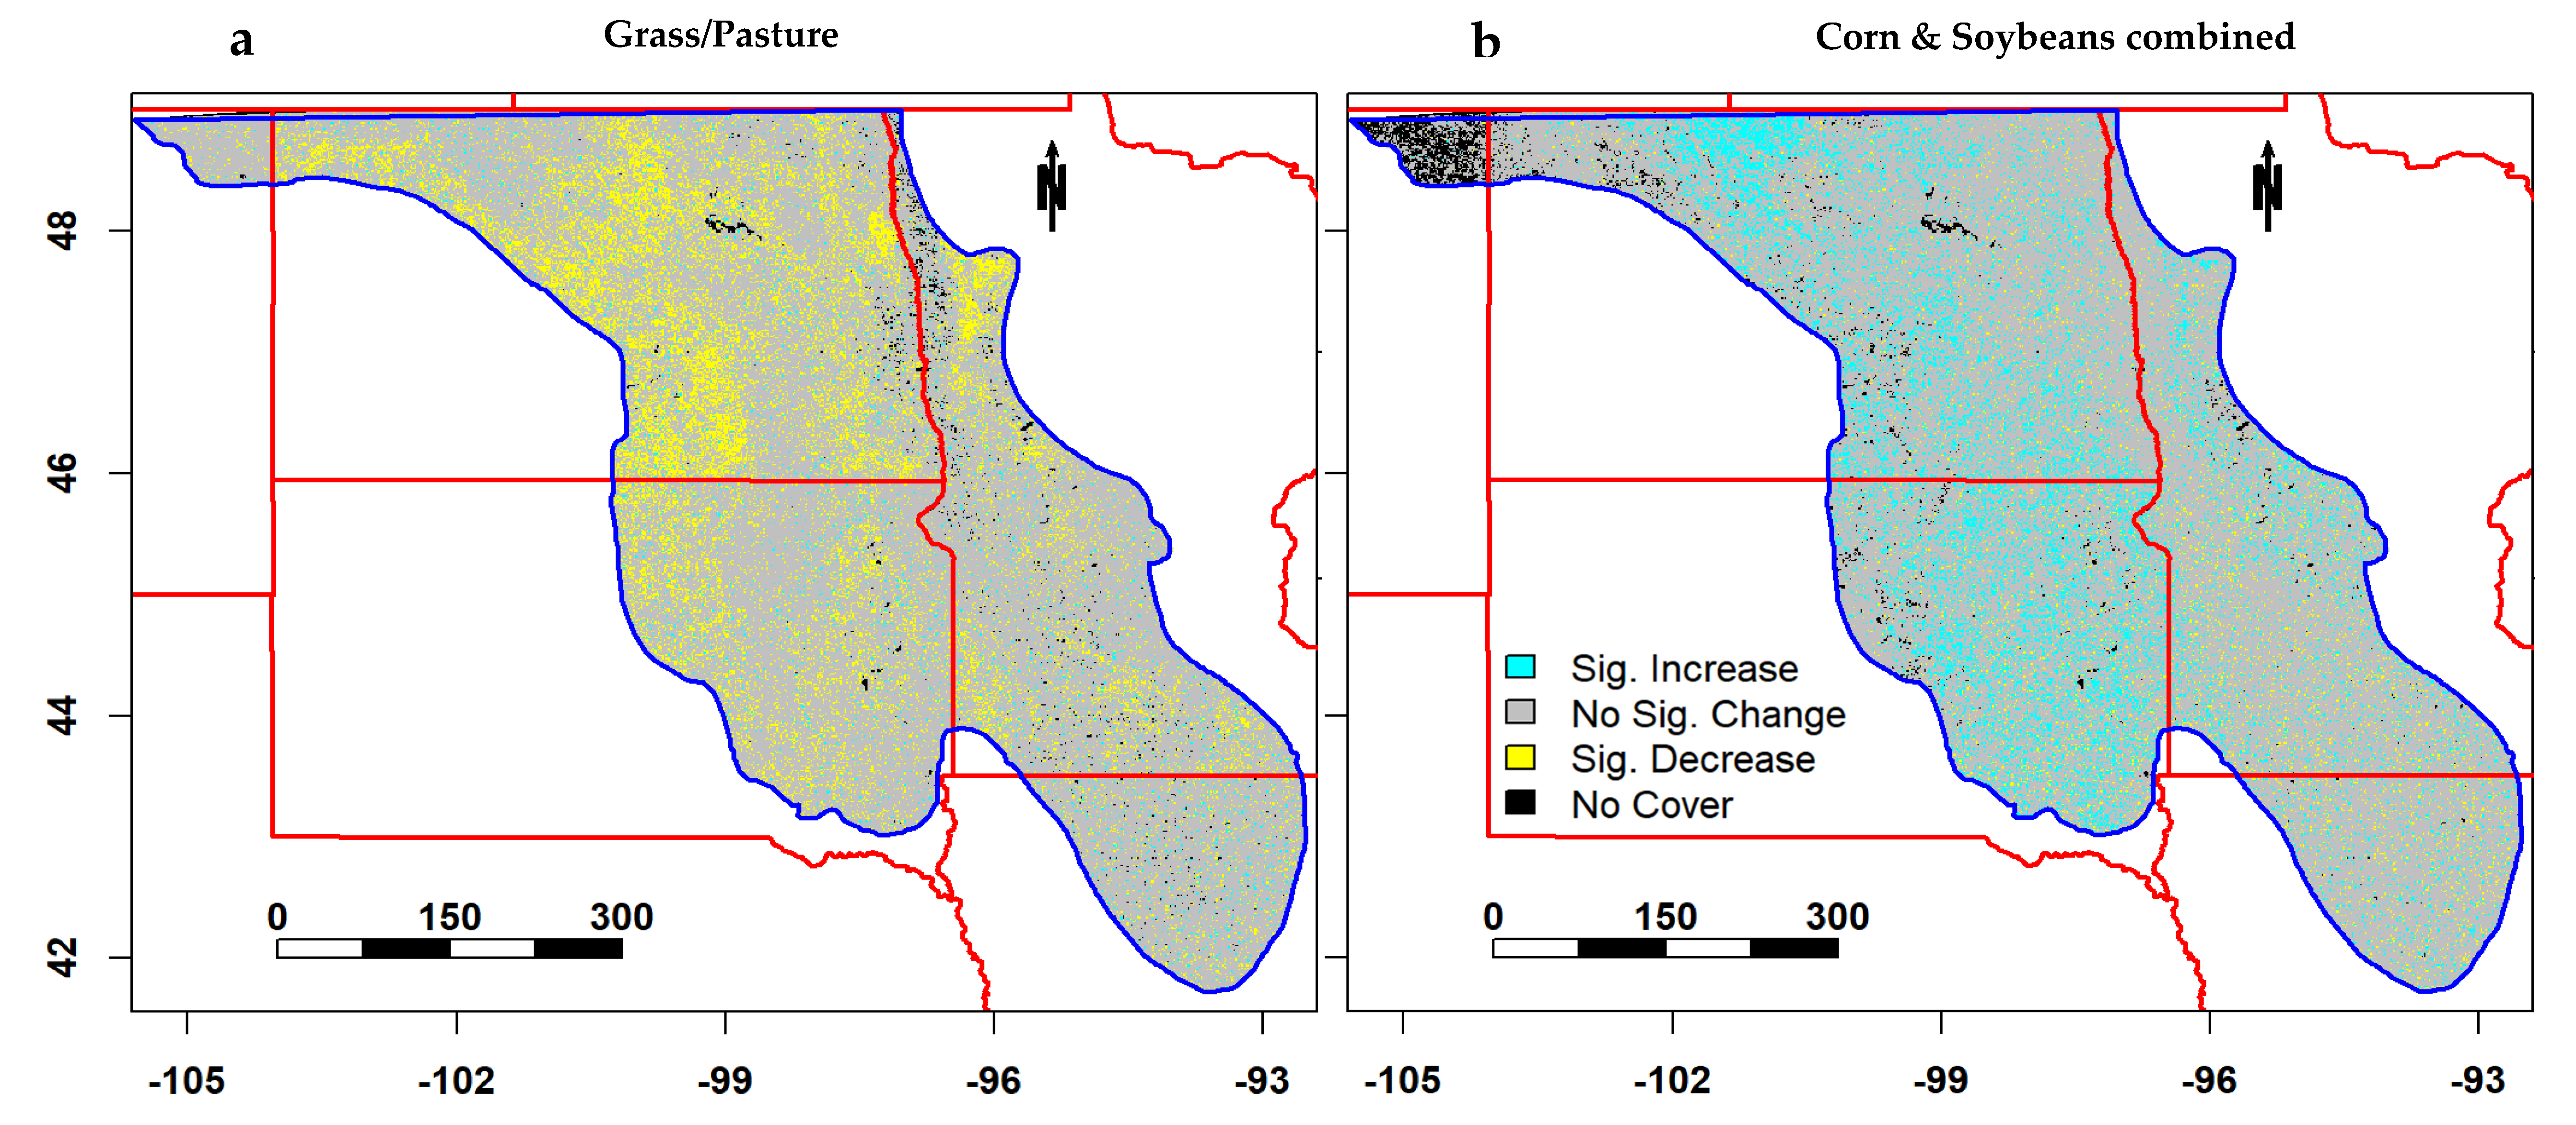
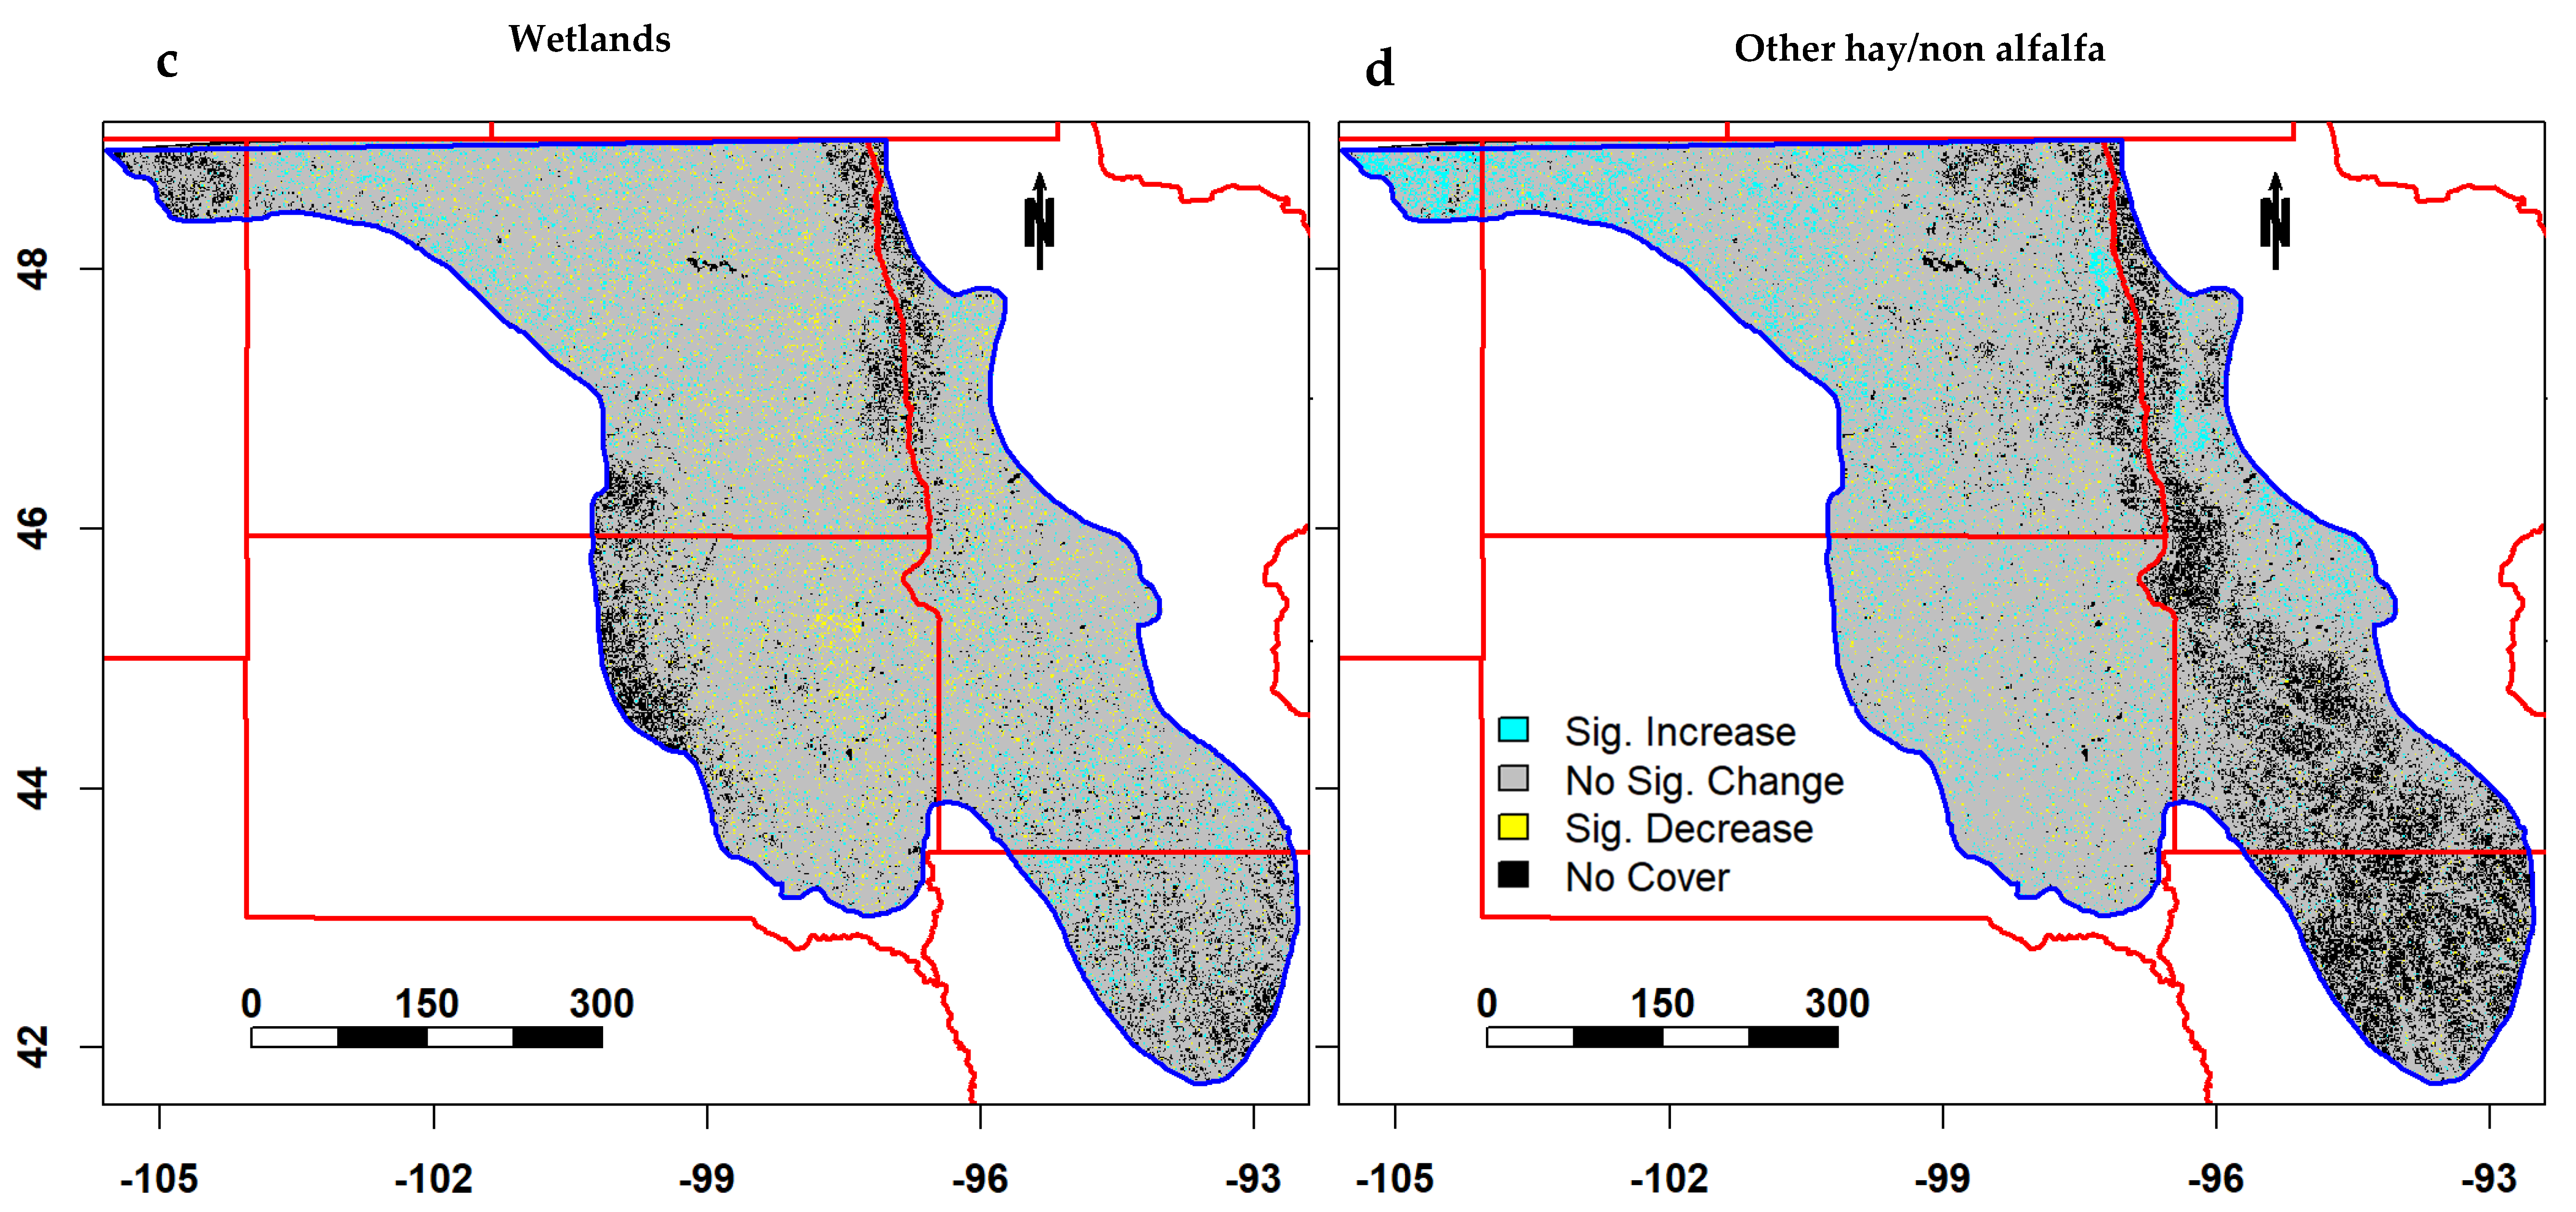
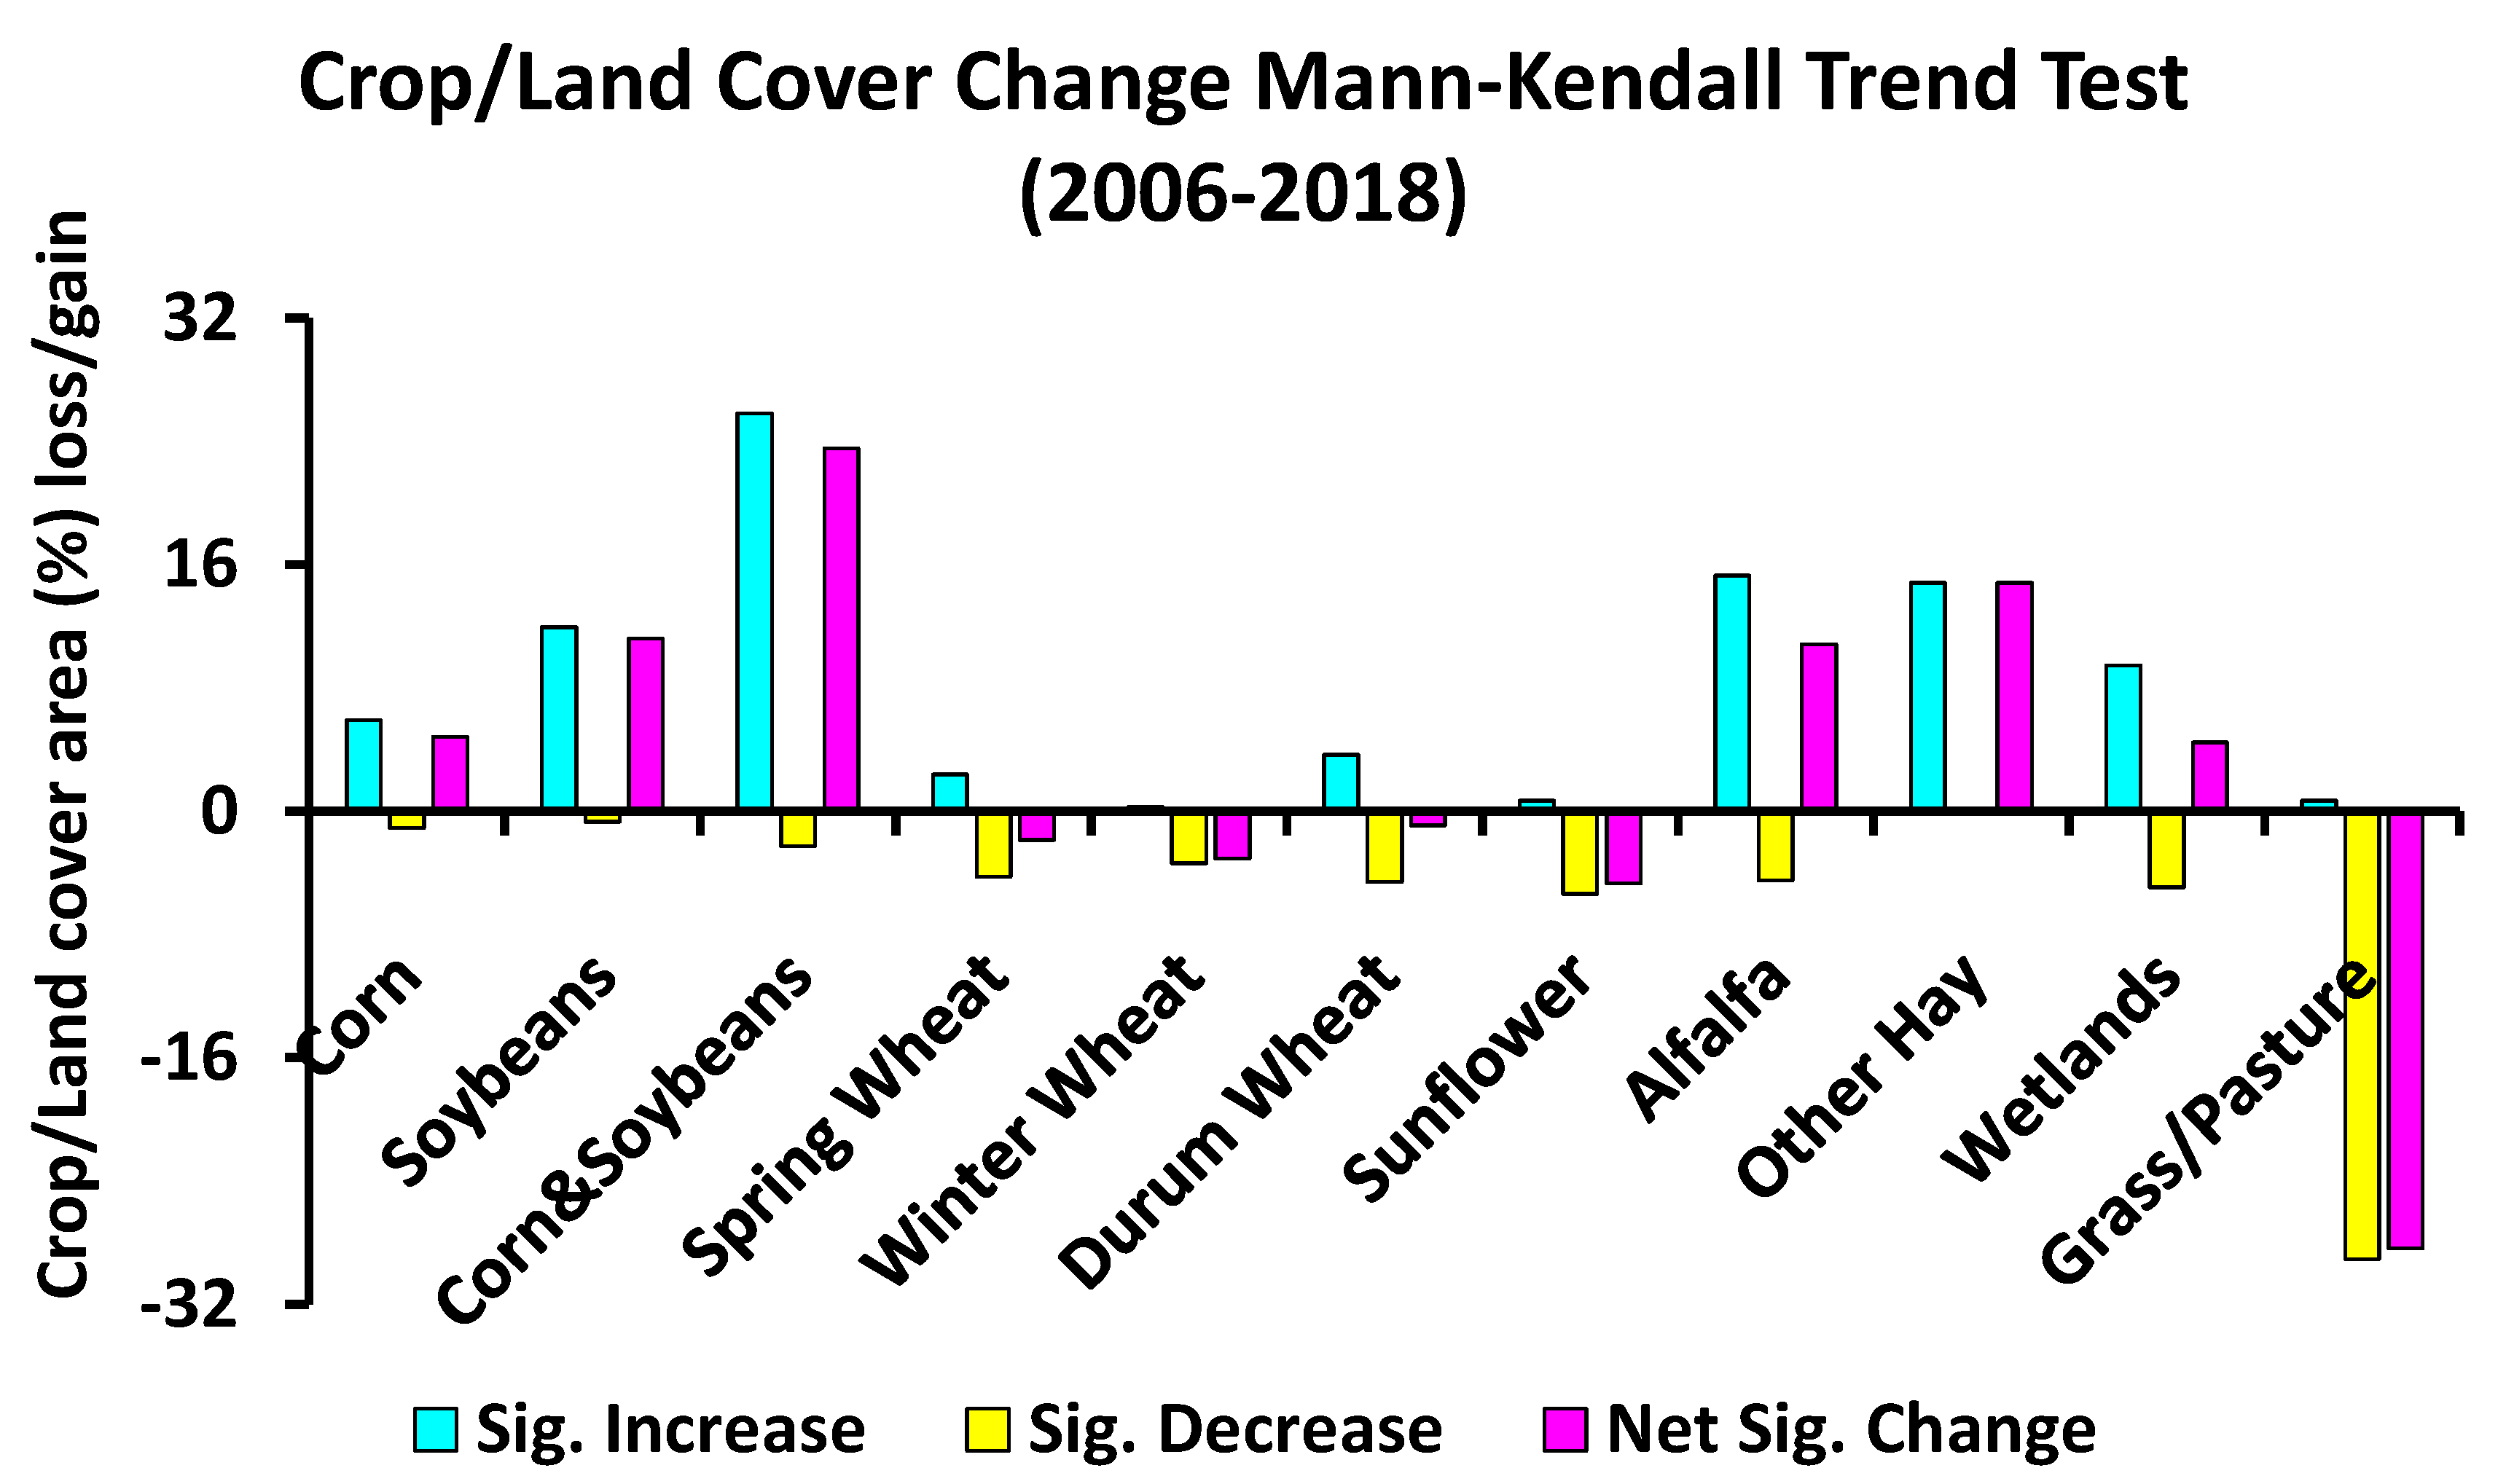
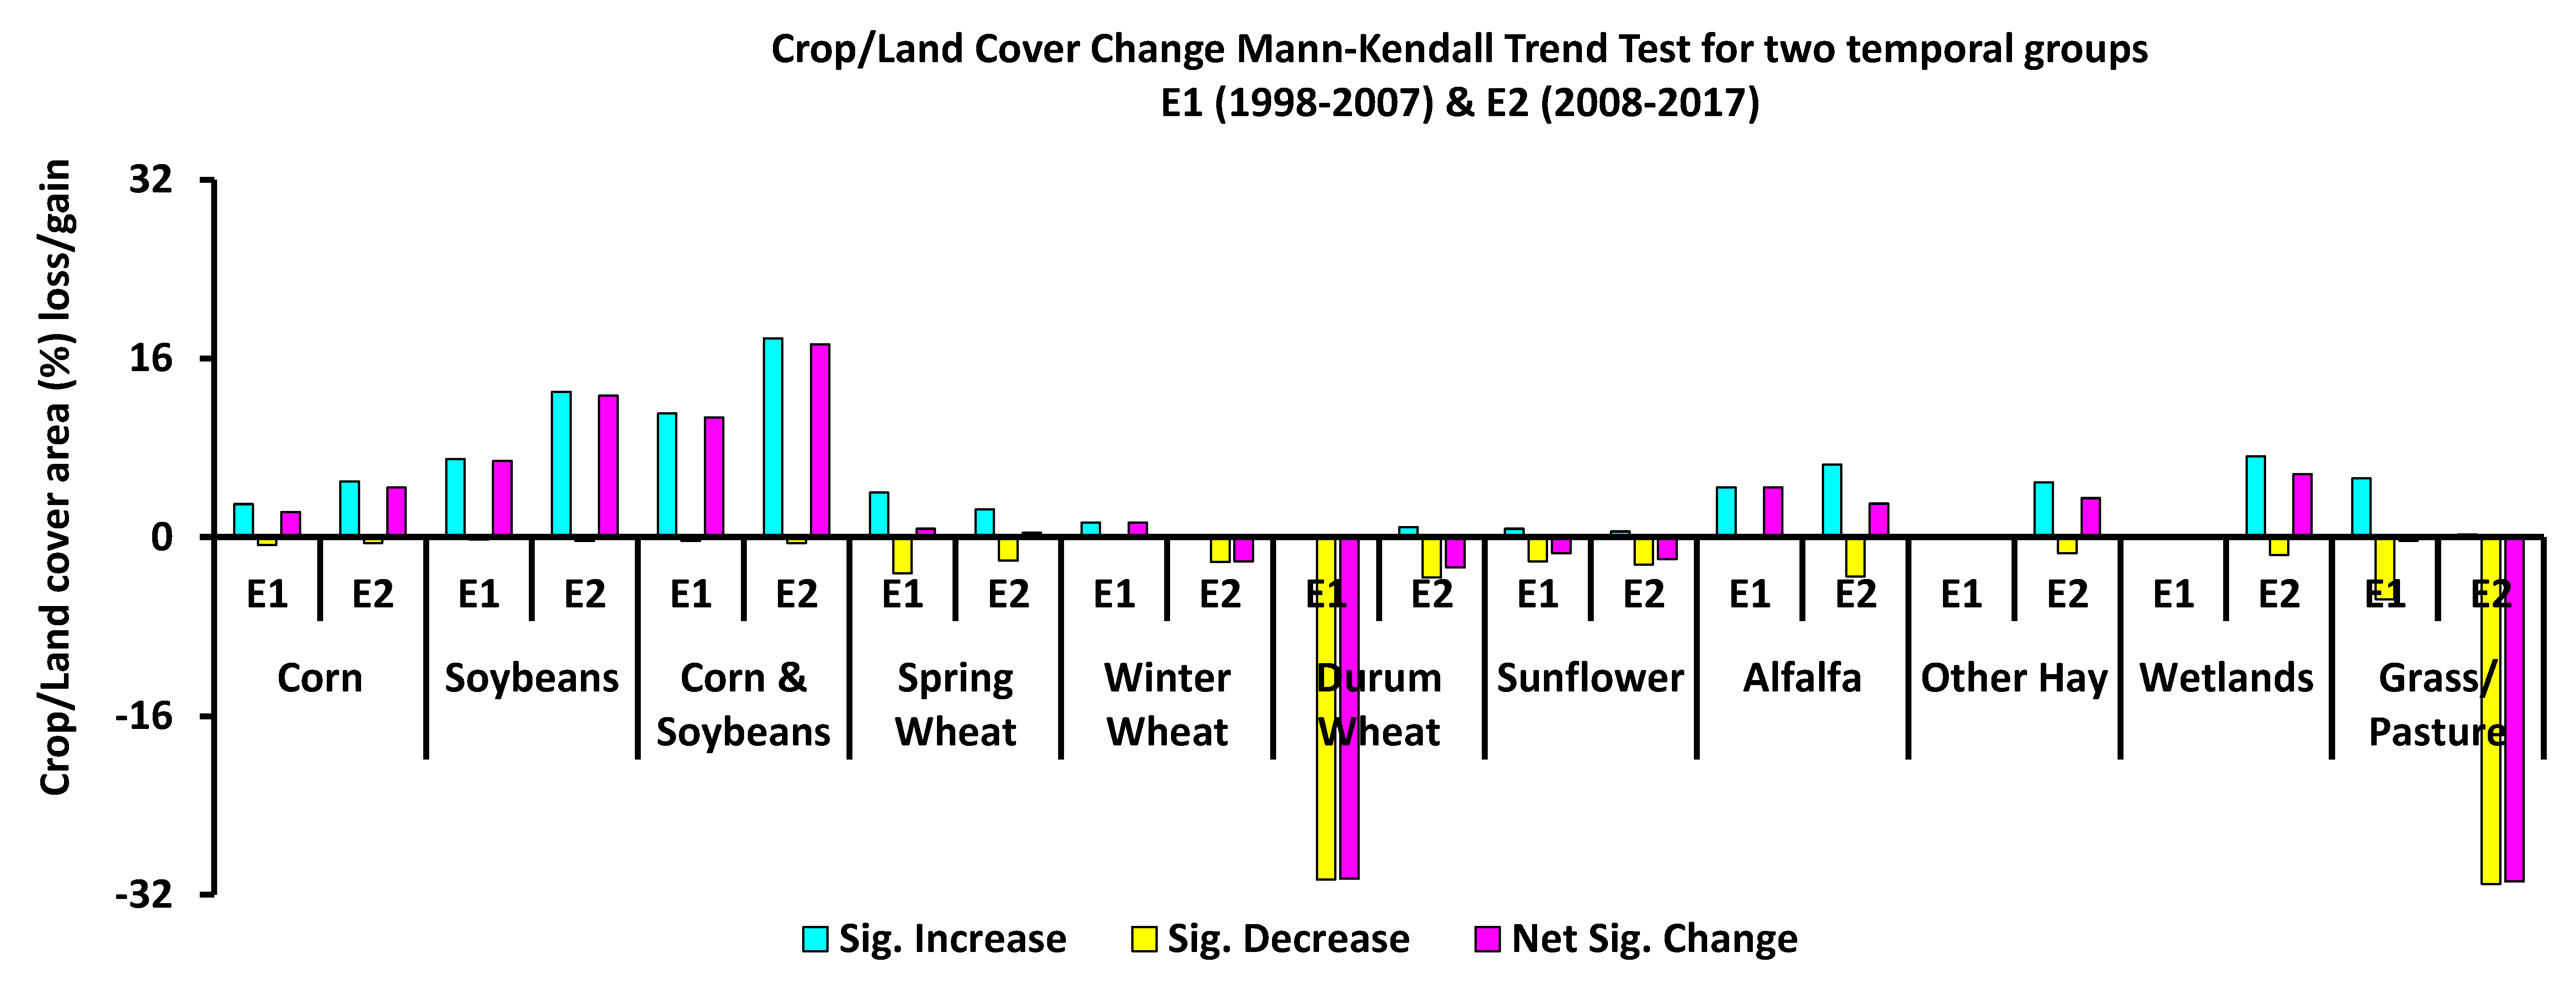
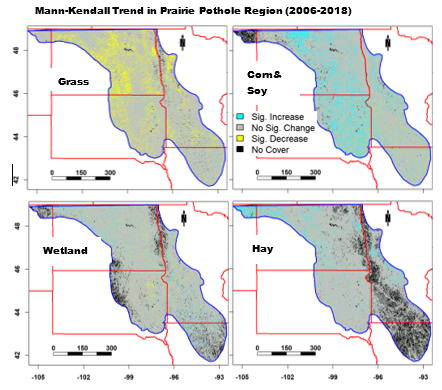
3.2. Crop/Land Cover Change
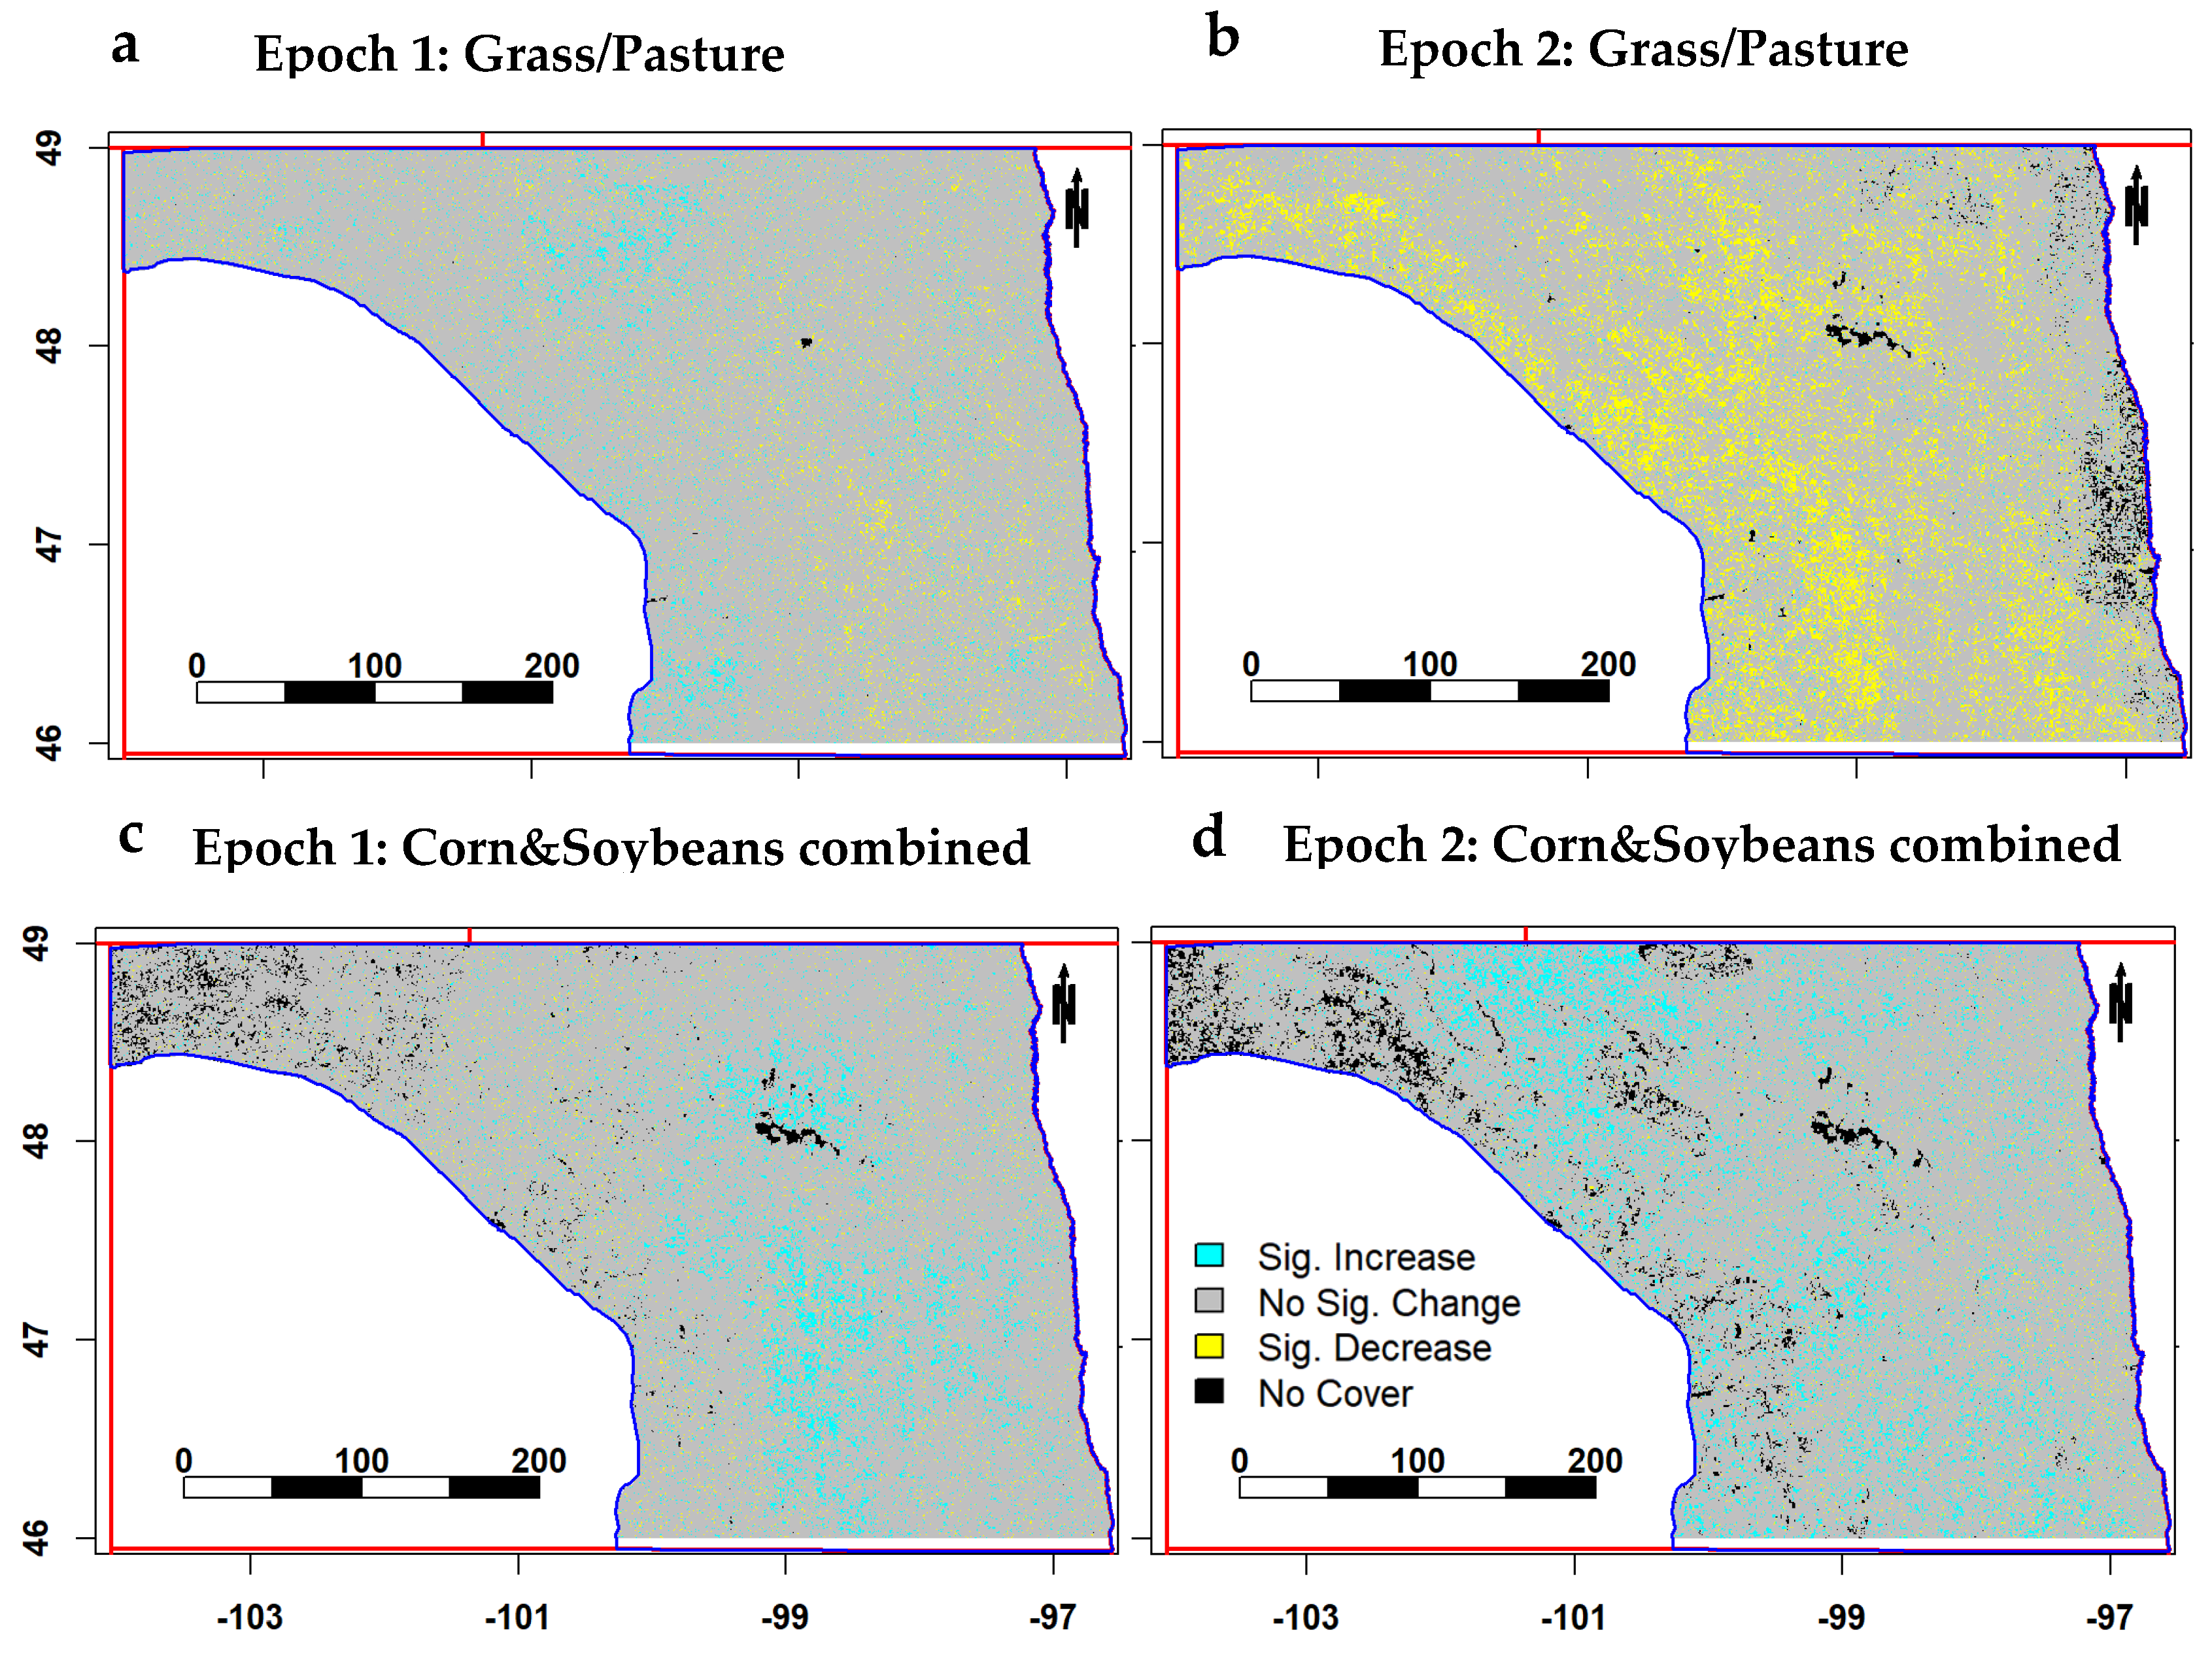
3.3. Comparison of Land/Crop Cover Change between Two Epochs in North Dakota
4. Discussion
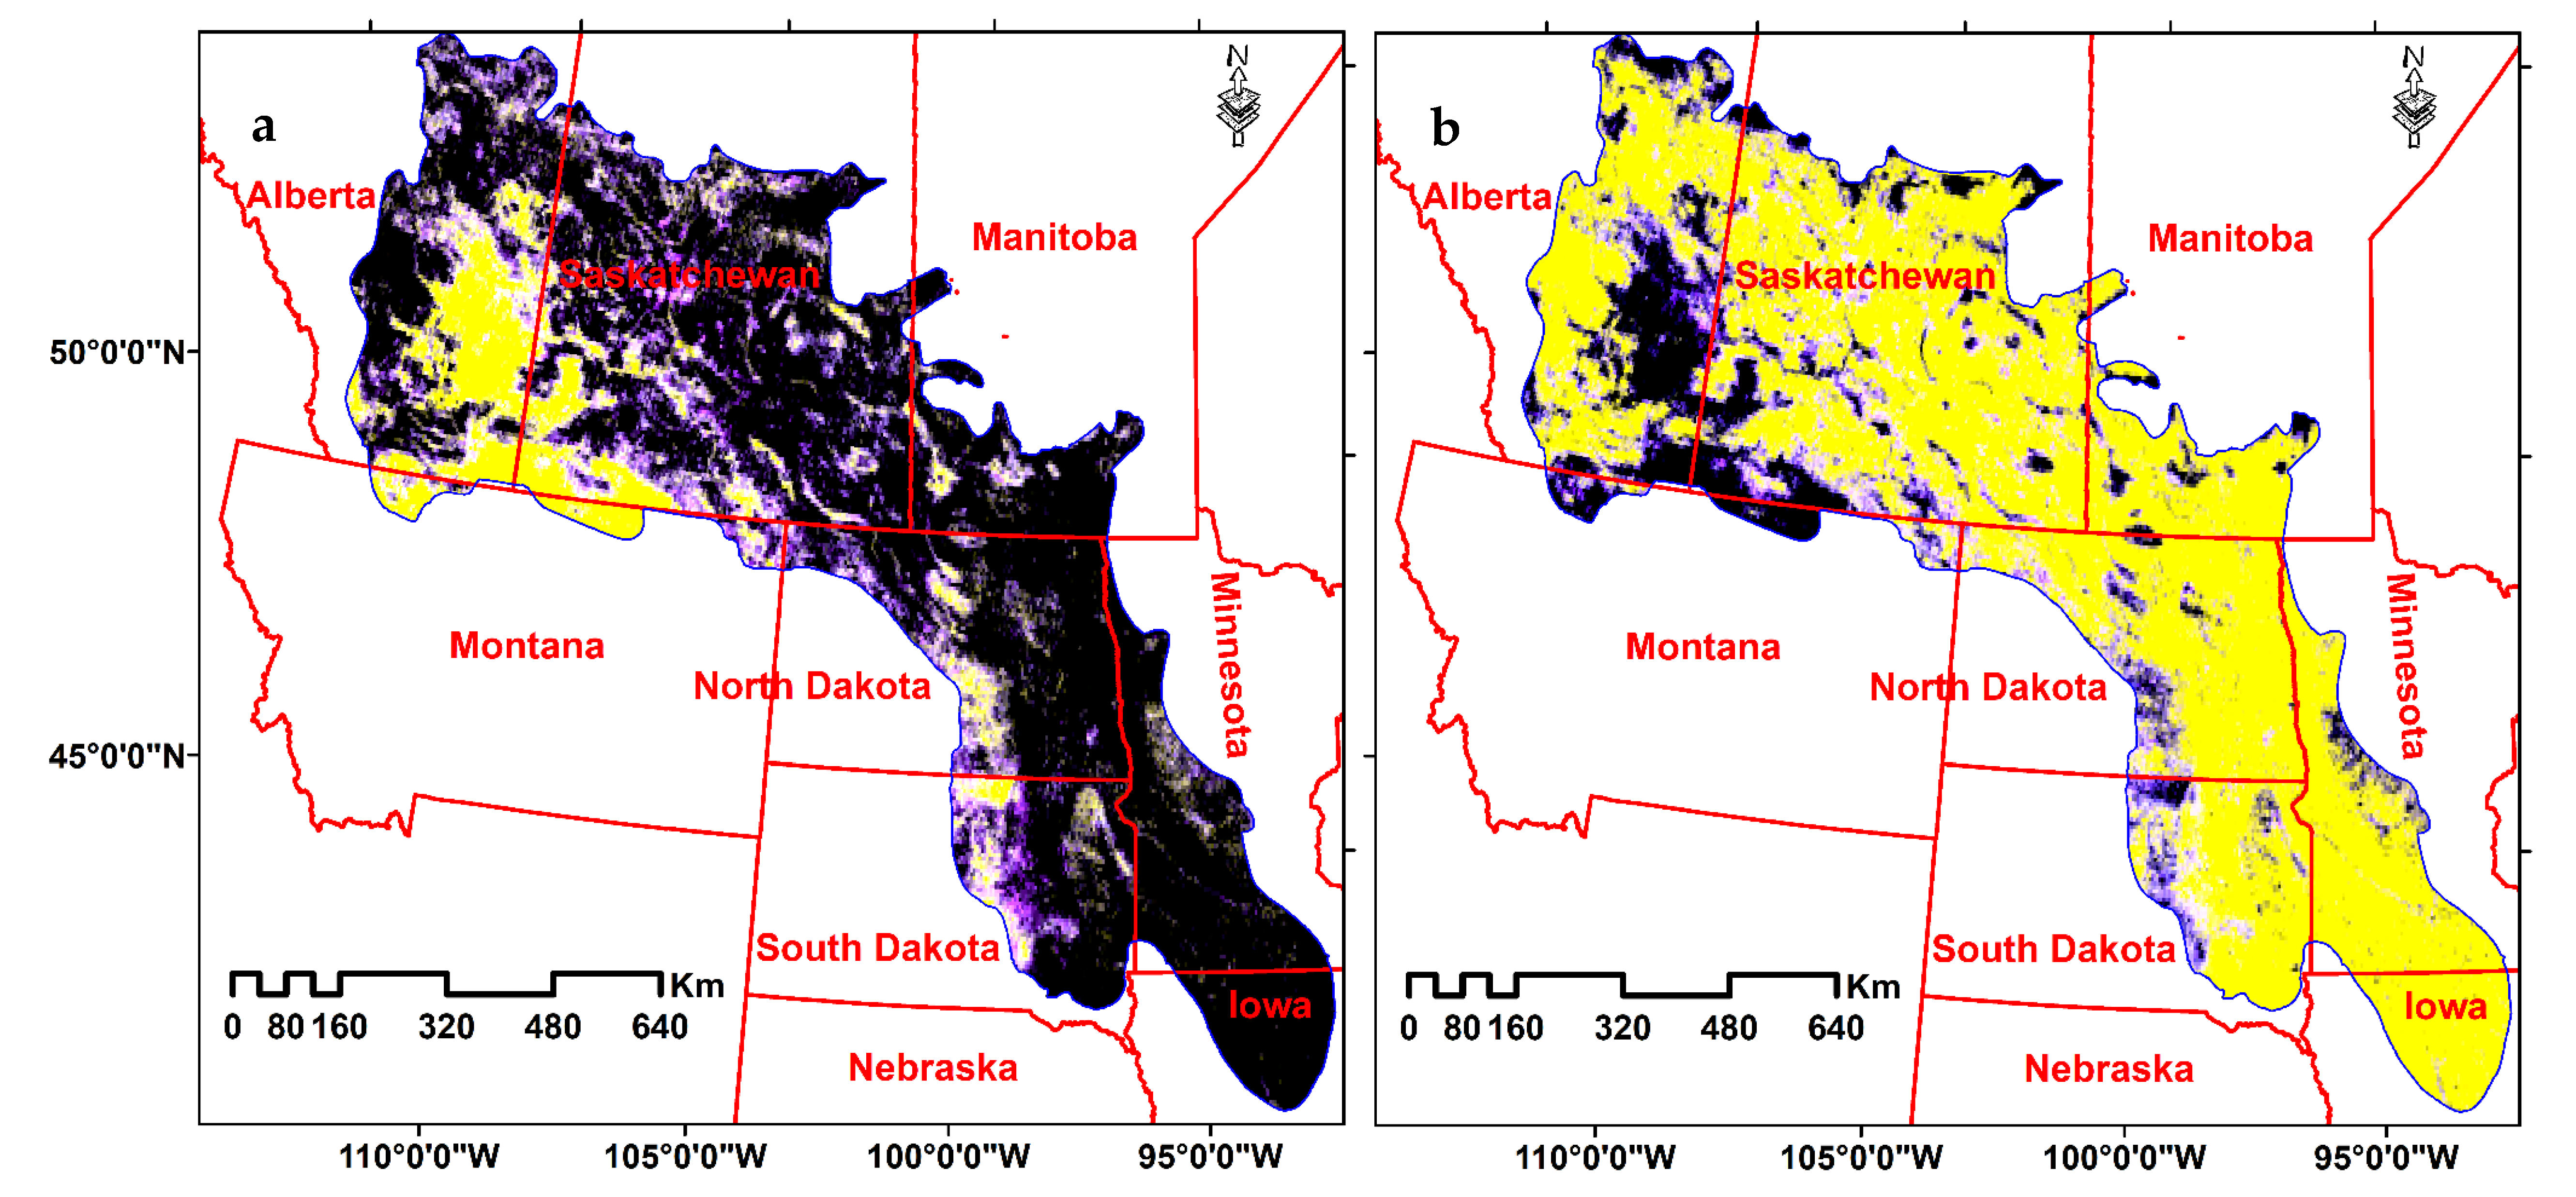
4.1. Land Cover Persistency
4.2. Land Cover Dynamics in the Prairie Pothole Region
4.3. Land Cover Dynamics Comparison in Time
5. Conclusion and Recommendation
Supplementary Materials
Author Contributions
Funding
Acknowledgments
Conflicts of Interest
References
- Ducks-Unlimited. Background Information on the Prairie Pothole Region, DU’s Top Conservation Priority Area. Available online: http://www.ducks.org/conservation/where-ducks-unlimited-works/prairie-pothole-region/prairie-pothole-region-more-information (accessed on 25 May 2017).
- Olimb, S.K.; Robinson, B. Grass to grain: Probabilistic modeling of agricultural conversion in the North American Great Plains. Ecol. Indic. 2019, 102, 237–245. [Google Scholar] [CrossRef]
- Johnson, R.R.; Oslund, F.T.; Hertel, D.R. The past, present, and future of prairie potholes in the United States. J. Soil Water Conserv. 2008, 63, 84A–87A. [Google Scholar] [CrossRef]
- Mishra, S.K.; Negri, M.C.; Kozak, J.; Cacho, J.F.; Quinn, J.; Secchi, S.; Ssegane, H. Valuation of ecosystem services in alternative bioenergy landscape scenarios. Glob. Chang. Bioenergy 2019, 11, 748–762. [Google Scholar] [CrossRef] [Green Version]
- Johnston, C.A. Wetland Losses Due to Row Crop Expansion in the Dakota Prairie Pothole Region. Wetlands 2013, 33, 175–182. [Google Scholar] [CrossRef]
- Wright, C.K.; Larson, B.; Lark, T.J.; Gibbs, H.K. Recent grassland losses are concentrated around U.S. ethanol refineries. Environ. Res. Lett. 2017, 12, 044001. [Google Scholar] [CrossRef]
- Wright, C.K.; Wimberly, M.C. Recent land use change in the Western Corn Belt threatens grasslands and wetlands. Proc. Natl. Acad. Sci. USA 2013, 110, 4134–4139. [Google Scholar] [CrossRef] [Green Version]
- McIntyre, N.E.; Wright, C.K.; Swain, S.; Hayhoe, K.; Liu, G.; Schwartz, F.W.; Henebry, G.M. Climate forcing of wetland landscape connectivity in the Great Plains. Front. Ecol. Environ. 2014, 12, 59–64. [Google Scholar] [CrossRef]
- Lark, J.T.; Salmon, J.M.; Gibbs, K.H. Cropland expansion outpaces agricultural and biofuel policies in the United States. Environ. Res. Lett. 2015, 10, 044003. [Google Scholar] [CrossRef] [Green Version]
- Faber, S.; Rundquist, S.; Male, T. Plowed under: How Crop Subsidies Contribute to Massive Habitat Losses; Environmental Working Group Report: Washington, DC, USA, 2012; Available online: https://defenders.org/publication/plowed-under-how-crop-subsidies-contribute-massive-habitat-losses (accessed on 29 October 2019).
- Johnston, C.A. Cropland Expansion into Prairie Pothole Wetlands, 2001–2010. In Proceedings of the America’s Grasslands Conference: Status, Threats, and Opportunities, 15–17 August 2011; pp. 44–46. [Google Scholar]
- Wachenheim, C.; Roberts, D.C.; Dhingra, N.; Lesch, W.; Devney, J. Conservation reserve program enrollment decisions in the prairie pothole region. J. Soil Water Conserv. 2018, 73, 337–352. [Google Scholar] [CrossRef]
- Philip, E.M.; Stephen, D.L.; Christopher, M.C.; Richard, I. Grasslands, wetlands, and agriculture: The fate of land expiring from the Conservation Reserve Program in the Midwestern United States. Environ. Res. Lett. 2016, 11, 094005. [Google Scholar] [CrossRef]
- Lark, T.J.; Mueller, R.M.; Johnson, D.M.; Gibbs, H.K. Measuring land-use and land-cover change using the U.S. department of agriculture’s cropland data layer: Cautions and recommendations. Int. J. Appl. Earth Obs. Geoinf. 2017, 62, 224–235. [Google Scholar] [CrossRef]
- Boryan, C.G.; Yang, Z. Integration of the cropland data layer based automatic stratification method into the traditional area frame construction process. Surv. Res. Methods 2017, 11, 289–306. [Google Scholar] [CrossRef]
- Decision_Innovation_Solutions. Multi-State Land Use Study: Estimated Land Use Changes 2007–2012; 2013; p 92. Available online: http://www.decision-innovation.com/webres/File/docs/130715%20Multi-State%20Land%20Use%20Report.pdf (accessed on 25 May 2019).
- Boryan, C.; Yang, Z.; Mueller, R.; Craig, M. Monitoring US agriculture: The US Department of Agriculture, National Agricultural Statistics Service, Cropland Data Layer Program. Geocarto Int. 2011, 26, 341–358. [Google Scholar] [CrossRef]
- Dodds, W.K.; Blair, J.M.; Henebry, G.M.; Koelliker, J.K.; Ramundo, R.; Tate, C.M. Nitrogen transport from tallgrass prairie watersheds. J. Environ. Qual. 1996, 25, 973–981. [Google Scholar] [CrossRef]
- Wimberly, M.C.; Narem, D.M.; Bauman, P.J.; Carlson, B.T.; Ahlering, M.A. Grassland connectivity in fragmented agricultural landscapes of the north-central United States. Biol. Conserv. 2018, 217, 121–130. [Google Scholar] [CrossRef]
- Arora, G.; Wolter, P.T. Tracking land cover change along the western edge of the US Corn Belt from 1984 through 2016 using satellite sensor data: Observed trends and contributing factors. J. Land Use Sci. 2018, 13, 59–80. [Google Scholar] [CrossRef]
- Reitsma, K.D.; Clay, D.E.; Carlson, C.G.; Dunn, B.H.; Smart, A.J.; Wright, D.L.; Clay, S.A. Estimated South Dakota Land Use Change from 2006 to 2012; Agronomy, Horticulture and Plant Science Faculty Publications. Brookings, SD, USA, 2014; Volume 18. Available online: https://openprairie.sdstate.edu/plant_faculty_pubs/18 (accessed on 25 May 2019).
- Alemu, W.G.; Henebry, G.M.; Melesse, A.M. Land Surface Phenologies and Seasonalities in the US Prairie Pothole Region Coupling AMSR Passive Microwave Data with the USDA Cropland Data Layer. Remote Sens. 2019, 11, 2550. [Google Scholar] [CrossRef] [Green Version]
- Doherty, K.E.; Howerter, D.W.; Devries, J.H.; Walker, J. Prairie Pothole Region of North America. In The Wetland Book: II: Distribution, Description and Conservation; Finlayson, C.M., Milton, G.R., Prentice, R.C., Davidson, N.C., Eds.; Springer: Dordrecht, The Netherlands, 2016; pp. 1–10. [Google Scholar] [CrossRef]
- USGS. Energy Development and Natural Resources in the Northern Great Plains. 2018. Available online: https://www.sciencebase.gov/catalog/item/54aeaef2e4b0cdd4a5caedf1 (accessed on 20 June 2017).
- Han, W.; Yang, Z.; Di, L.; Mueller, R. CropScape: A Web service based application for exploring and disseminating US conterminous geospatial cropland data products for decision support. Comput. Electron. Agric. 2012, 84, 111–123. [Google Scholar] [CrossRef]
- USDA-NAS. CropScape—Cropland Data Layer. 2017. Available online: https://nassgeodata.gmu.edu/CropScape/ (accessed on 30 April 2019).
- Friedl, M.; Sulla-Menashe, D. MCD12C1 MODIS/Terra+Aqua Land Cover Type Yearly L3 Global 0.05Deg CMG V006 [Data set]. NASA EOSDIS Land Processes DAAC. 2015. Available online: https://lpdaac.usgs.gov/documents/101/MCD12_User_Guide_V6.pdf (accessed on 25 March 2020).
- Henebry, G.M.; de Beurs, K.M.; Wright, C.K.; Ranjeet, J.; Lioubimtseva, E. Dryland East Asia in Hemispheric Context. In Dryland East Asia: Land Dynamics amid Social and Climate Change; Chen, J., Wan, S., Henebry, G., Qi, J., Gutman, G., Sun, G., Kappas, M., Eds.; Higher Education Press and Walter de Gruyter GmbH: Brlin, Germany; Boston, MA, USA, 2013; pp. 23–43. [Google Scholar] [CrossRef]
- Alemu, W.G.; Henebry, G.M. Characterizing Cropland Phenology in Major Grain Production Areas of Russia, Ukraine, and Kazakhstan by the Synergistic Use of Passive Microwave and Visible to Near Infrared Data. Remote Sens. 2016, 8, 1016. [Google Scholar] [CrossRef] [Green Version]
- Drápela, K.; Drápelová, I. Application of Mann-Kendall test and the Sen’s slope estimates for trend detection in deposition data from Bílý Kříž (Beskydy Mts., the Czech Republic) 1997–2010. Beskydy 2011, 4, 133–146. [Google Scholar]
- McLeod, A.I. Kendall Rank Correlation and Mann-Kendall Trend Test, 2.2. 2011. Available online: https://cran.r-project.org/web/packages/Kendall/Kendall.pdf (accessed on 21 December 2019).
- Johnston, C.A. Agricultural expansion: Land use shell game in the US Northern Plains. Landsc. Ecol. 2014, 29, 81–95. [Google Scholar] [CrossRef]
- Lark, T.J.; Larson, B.; Schelly, I.; Batish, S.; Gibbs, H.K. Accelerated Conversion of Native Prairie to Cropland in Minnesota. Environ. Conserv. 2019, 1–8. [Google Scholar] [CrossRef] [Green Version]
- Lin, M.; Huang, Q. Exploring the relationship between agricultural intensification and changes in cropland areas in the US. Agric. Ecosyst. Environ. 2019, 274, 33–40. [Google Scholar] [CrossRef]
- Nguyen, L.H.; Joshi, D.R.; Henebry, G.M. Improved change detection with trajectory-based approach: Application to quantify cropland expansion in South Dakota. Land 2019, 8, 57. [Google Scholar] [CrossRef] [Green Version]
- Johnston, C.A.; McIntyre, N.E. Effects of cropland encroachment on prairie pothole wetlands: Numbers, density, size, shape, and structural connectivity. Landsc. Ecol. 2019, 34, 827–841. [Google Scholar] [CrossRef]
- Millett, B.; Johnson, W.C.; Guntenspergen, G. Climate trends of the North American prairie pothole region 1906–2000. Clim. Chang. 2009, 93, 243–267. [Google Scholar] [CrossRef]
- Poiani, K.A.; Johnson, W.C. Global warming and prairie wetlands. Bioscience 1991, 41, 611–618. [Google Scholar] [CrossRef]
- Johnson, W.C.; Millett, B.V.; Gilmanov, T.; Voldseth, R.A.; Guntenspergen, G.R.; Naugle, D.E. Vulnerability of northern prairie wetlands to climate change. Bioscience 2005, 55, 863–872. [Google Scholar] [CrossRef]
- Kharel, G.; Zheng, H.; Kirilenko, A. Can land-use change mitigate long-term flood risks in the Prairie Pothole Region? The case of Devils Lake, North Dakota, USA. Reg. Environ. Chang. 2016, 16, 2443–2456. [Google Scholar] [CrossRef]
- Yang, Y.; Anderson, M.; Gao, F.; Hain, C.; Kustas, W.; Meyers, T.; Crow, W.; Finocchiaro, R.; Otkin, J.; Sun, L. Impact of tile drainage on evapotranspiration in South Dakota, USA, based on high spatiotemporal resolution evapotranspiration time series from a multisatellite data fusion system. IEEE J. Sel. Top. Appl. Earth Obs. Remote Sens. 2017, 10, 2550–2564. [Google Scholar] [CrossRef]
- Adam, E.; Mutanga, O.; Rugege, D. Multispectral and hyperspectral remote sensing for identification and mapping of wetland vegetation: A review. Wetl. Ecol. Manag. 2010, 18, 281–296. [Google Scholar] [CrossRef]
- Dronova, I.; Gong, P.; Clinton, N.E.; Wang, L.; Fu, W.; Qi, S.; Liu, Y. Landscape analysis of wetland plant functional types: The effects of image segmentation scale, vegetation classes and classification methods. Remote Sens. Environ. 2012, 127, 357–369. [Google Scholar] [CrossRef]
- Knight, J.F.; Tolcser, B.P.; Corcoran, J.M.; Rampi, L.P. The effects of data selection and thematic detail on the accuracy of high spatial resolution wetland classifications. Photogramm. Eng. Remote Sens. 2013, 79, 613–623. [Google Scholar] [CrossRef]
- Berhane, T.M.; Costa, H.; Lane, C.R.; Anenkhonov, O.A.; Chepinoga, V.V.; Autrey, B.C. The influence of region of interest heterogeneity on classification accuracy in wetland systems. Remote Sens. 2019, 11, 551. [Google Scholar] [CrossRef] [Green Version]
- McIntyre, N.E.; Liu, G.; Gorzo, J.; Wright, C.K.; Guntenspergen, G.R.; Schwartz, F. Simulating the effects of climate variability on waterbodies and wetland-dependent birds in the Prairie Pothole Region. Ecosphere 2019, 10, e02711. [Google Scholar] [CrossRef] [Green Version]
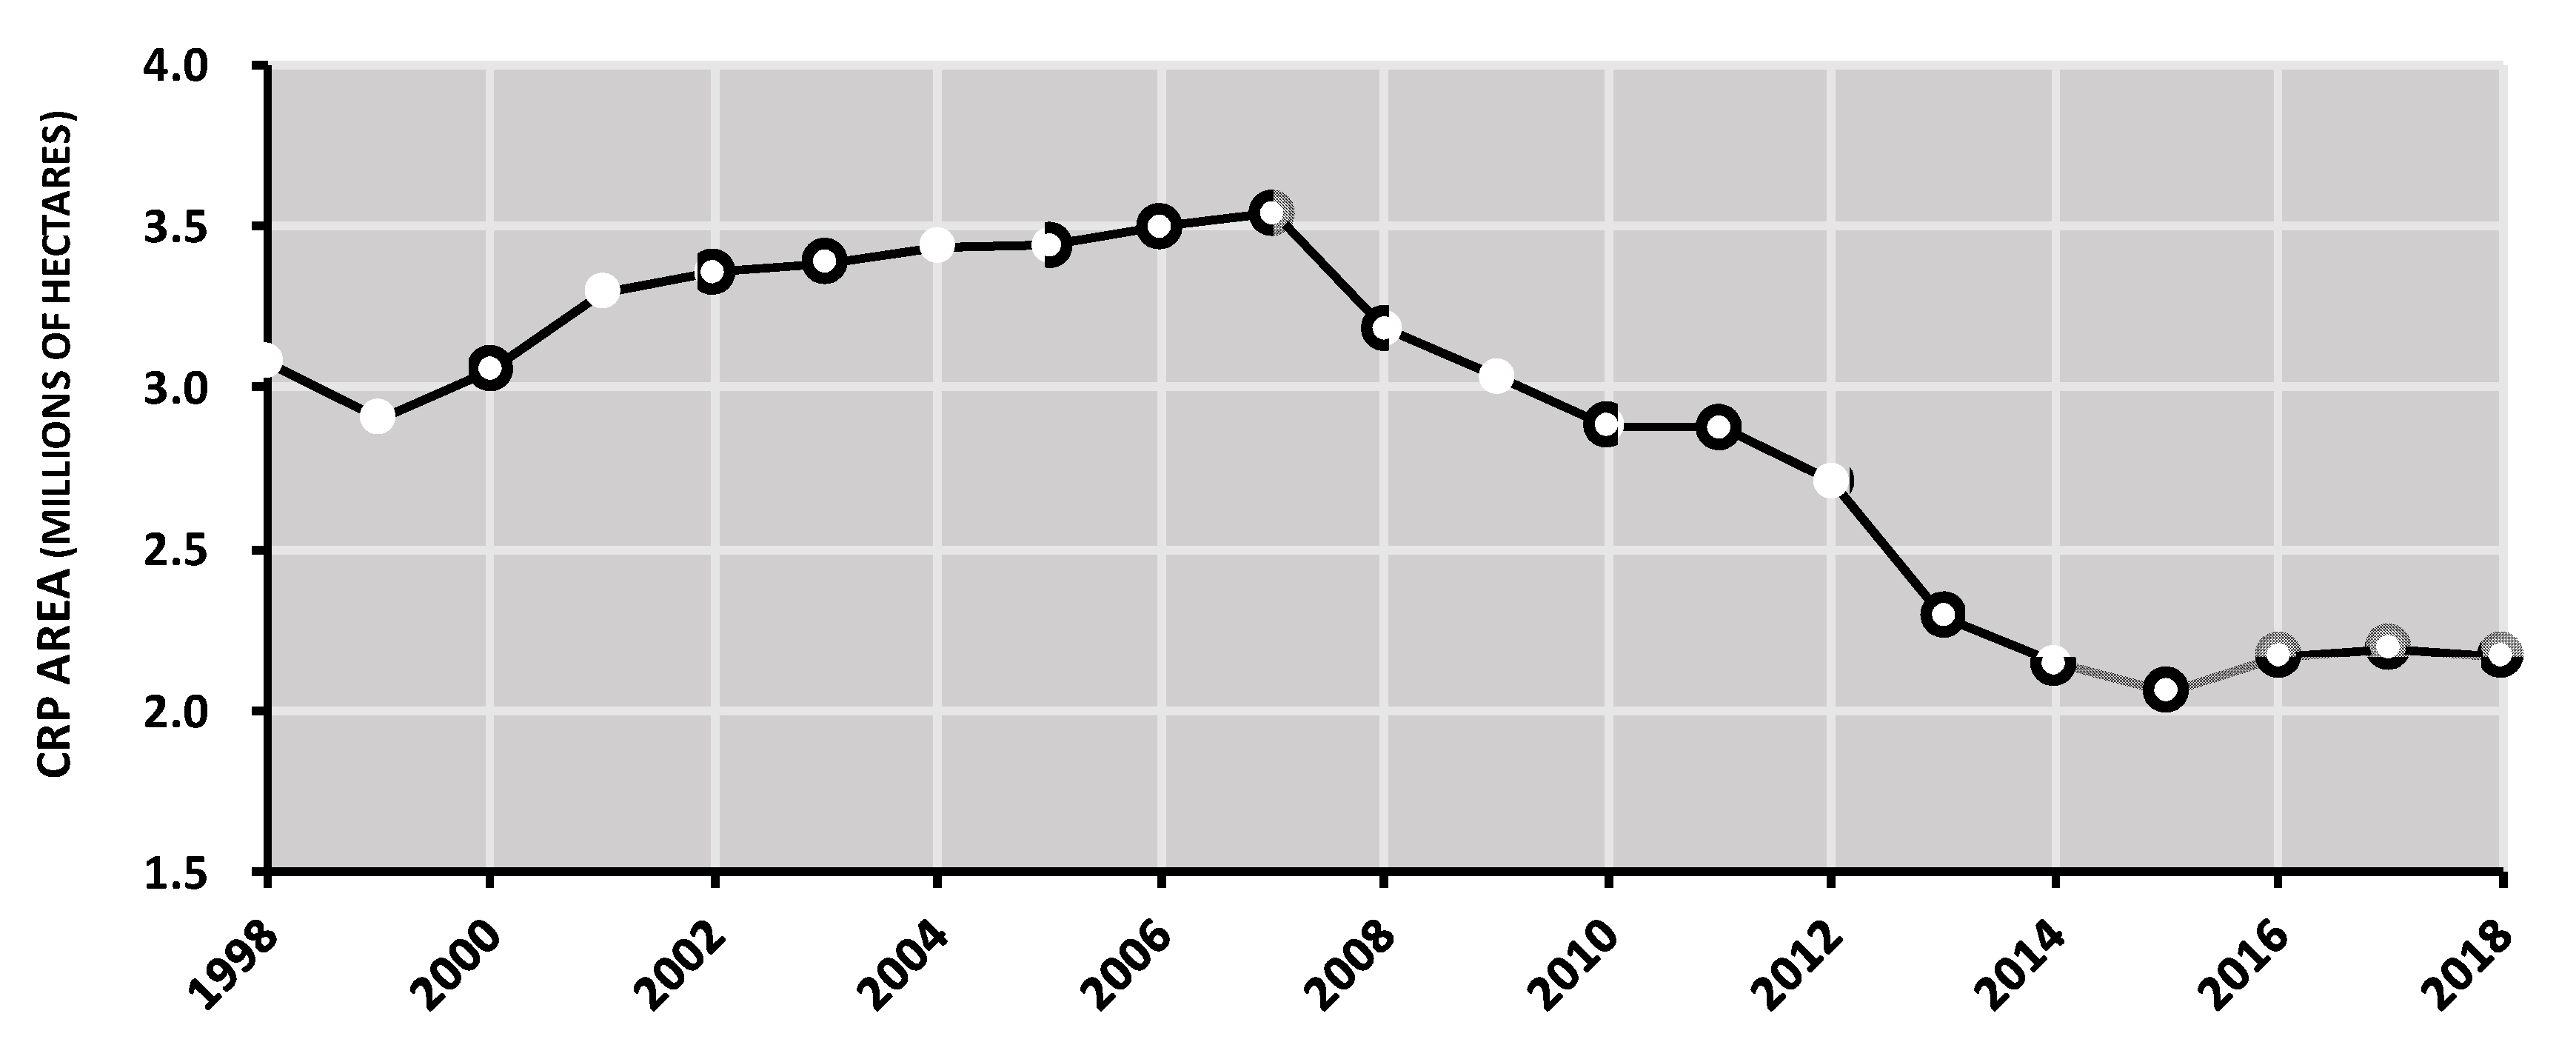
- USDA_FSA. Conservation Reserve Program Statistics; United States Department of Agriculture Farm Service Agency: Washington, DC, USA, 2019. Available online: https://www.fsa.usda.gov/programs-and-services/conservation-programs/reports-and-statistics/conservation-reserve-program-statistics/index (accessed on 6 May 2019).
- Wimberly, M.C.; Janssen, L.L.; Luri, M.; Chowdhury, N.M.; Feng, H. Cropland expansion and grassland loss in the eastern Dakotas: New insights from a farm-level survey. Land Use Policy 2017, 63, 160–173. [Google Scholar] [CrossRef]
- Nguyen, L.H.; Joshi, D.R.; Clay, D.E.; Henebry, G.M. Characterizing land cover/land use from multiple years of Landsat and MODIS time series: A novel approach using land surface phenology modeling and random forest classifier. Remote Sens. Environ. 2018, 238, 111017. [Google Scholar] [CrossRef]


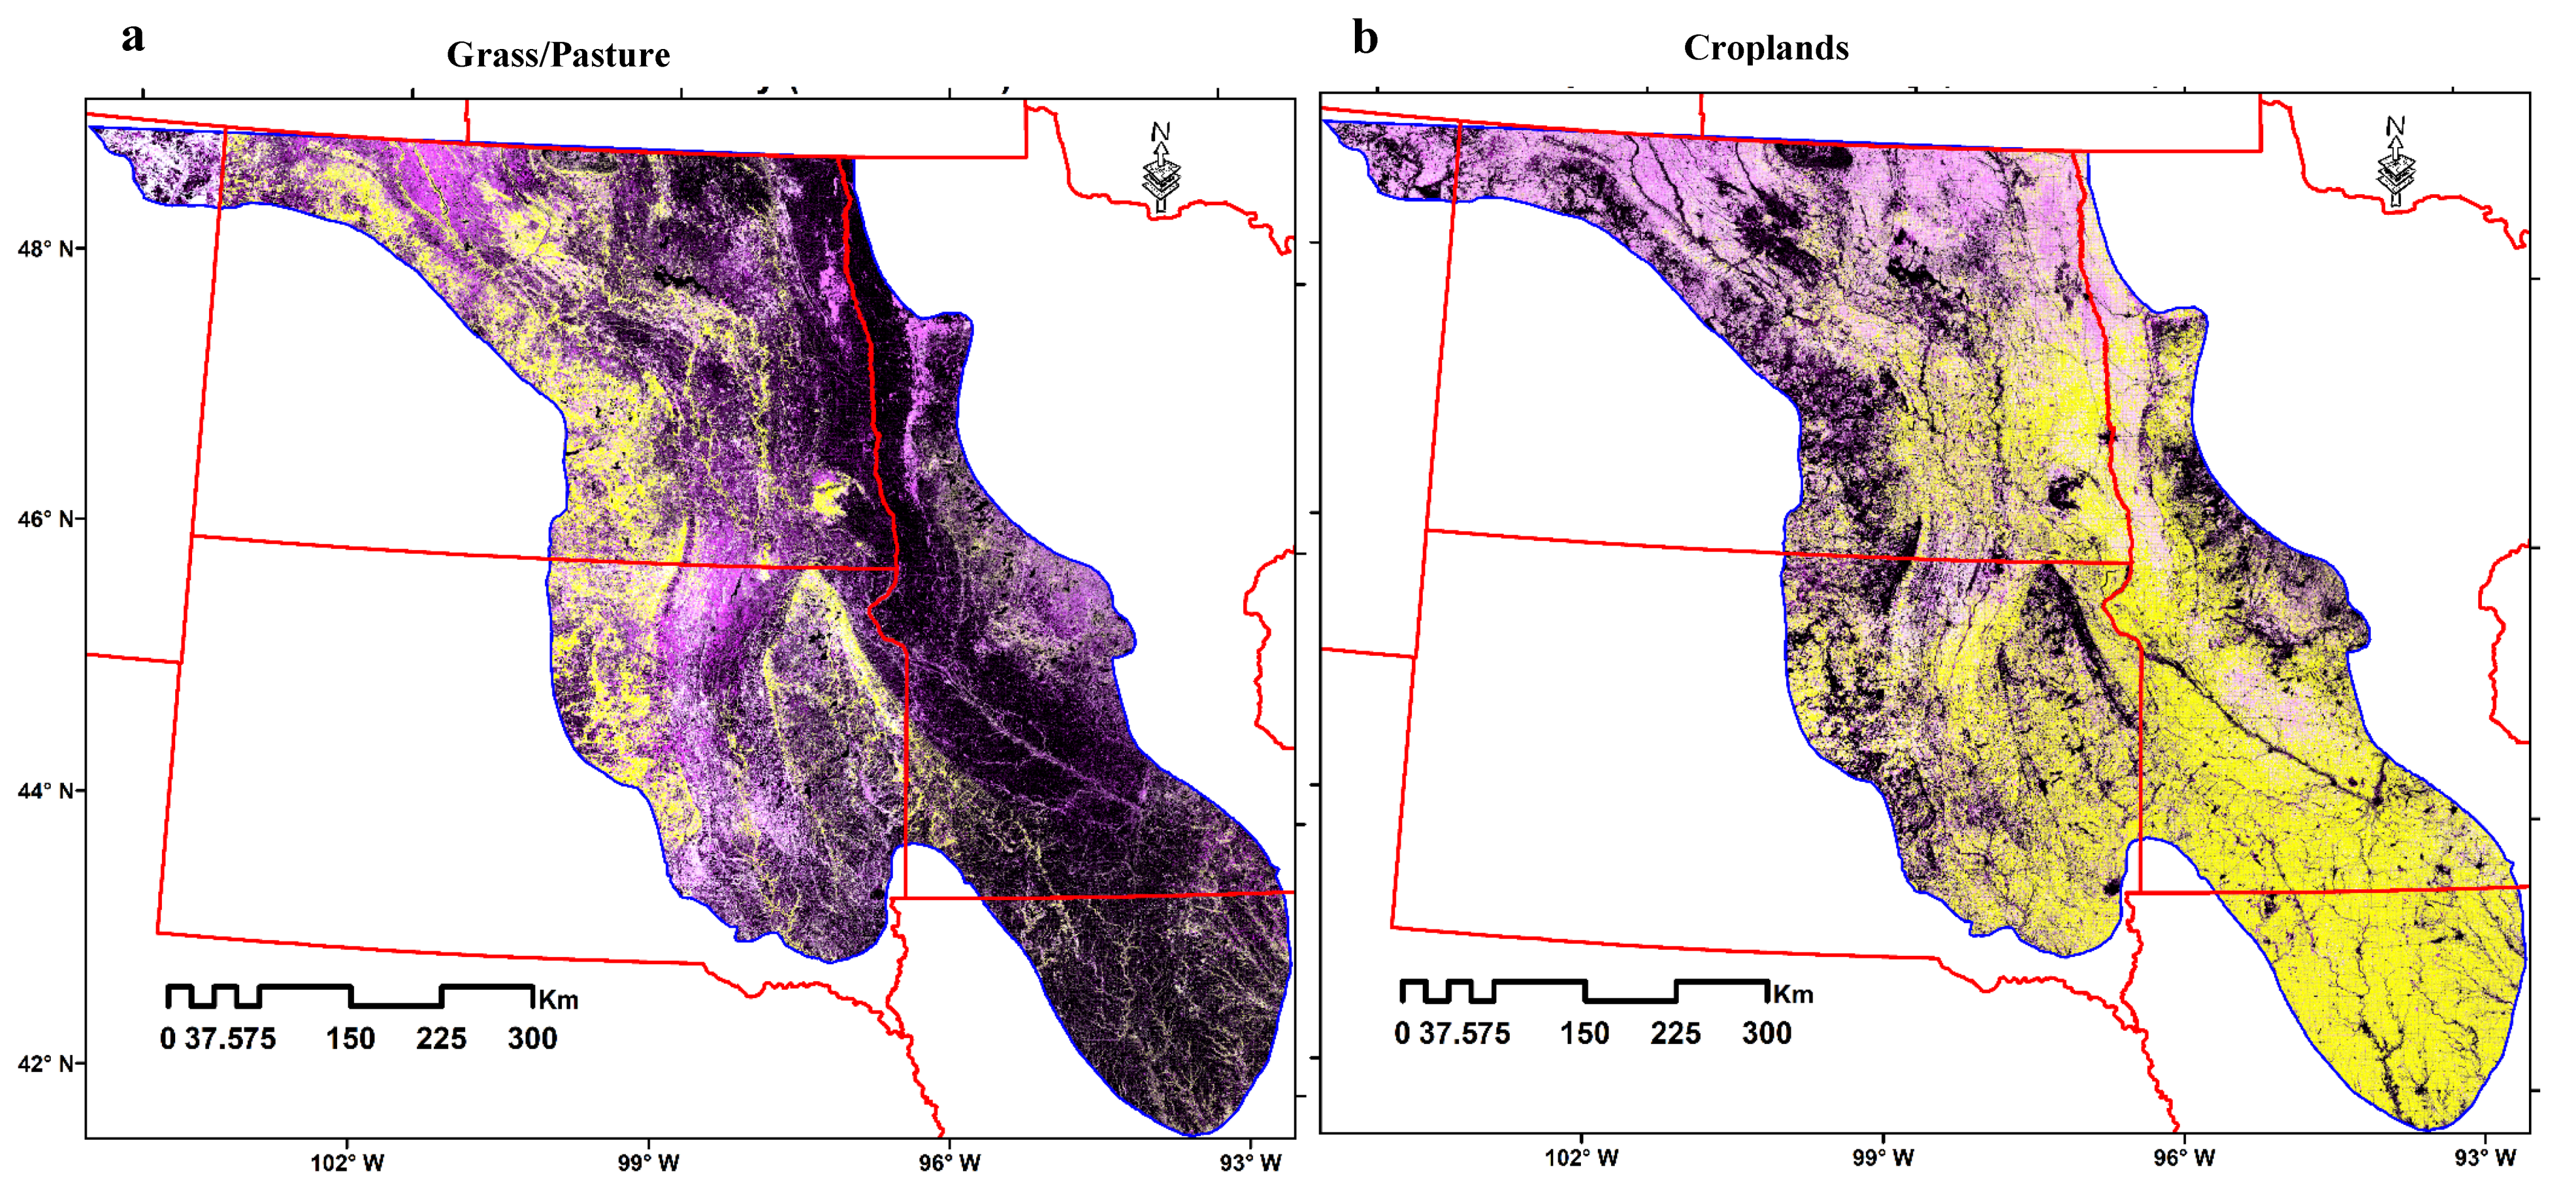
| Color in LC Map | Red = Max% LC | Green = Mean% LC | Blue = Range% LC | Interpretation |
|---|---|---|---|---|
| Black | None | None | None | Land cover (LC) class absent |
| Blues | Low | Low | High | Unstable and ephemeral periphery; rare and erratic |
| Magentas | High | Low | High | Unstable and recurrent periphery; sometimes high, but usually low |
| Whites | High | High | High | Unstable core; sometimes low, but usually high |
| Yellows | High | High | Low | Stable core of LC; always high so low range |
| 1 ≤ x < 20 Milk Cows | x > 1000 Milk Cows | |||||
|---|---|---|---|---|---|---|
| 2012 | 2017 | Change | 2012 | 2017 | change | |
| Iowa | 161 | 85 | −76 | 27 | 31 | +4 |
| Minnesota | 317 | 703 | +386 | 42 | 991 | +949 |
| North Dakota | 8 | 5 | −3 | 2 | 3 | +1 |
| South Dakota | 95 | 60 | −35 | 24 | 51 | +27 |
| Total | 581 | 853 | +272 | 95 | 1076 | +981 |
© 2020 by the authors. Licensee MDPI, Basel, Switzerland. This article is an open access article distributed under the terms and conditions of the Creative Commons Attribution (CC BY) license (http://creativecommons.org/licenses/by/4.0/).
Share and Cite
Alemu, W.G.; Henebry, G.M.; Melesse, A.M. Land Cover and Land Use Change in the US Prairie Pothole Region Using the USDA Cropland Data Layer. Land 2020, 9, 166. https://doi.org/10.3390/land9050166
Alemu WG, Henebry GM, Melesse AM. Land Cover and Land Use Change in the US Prairie Pothole Region Using the USDA Cropland Data Layer. Land. 2020; 9(5):166. https://doi.org/10.3390/land9050166
Chicago/Turabian StyleAlemu, Woubet G., Geoffrey M. Henebry, and Assefa M. Melesse. 2020. "Land Cover and Land Use Change in the US Prairie Pothole Region Using the USDA Cropland Data Layer" Land 9, no. 5: 166. https://doi.org/10.3390/land9050166
APA StyleAlemu, W. G., Henebry, G. M., & Melesse, A. M. (2020). Land Cover and Land Use Change in the US Prairie Pothole Region Using the USDA Cropland Data Layer. Land, 9(5), 166. https://doi.org/10.3390/land9050166