Article

Land Functions, Rural Space Governance, and Farmers’ Environmental Perceptions: A Case Study from the Huanjiang Karst Mountain Area, China

1
School of Architecture and Urban-Rural Planning, Sichuan Agricultural University, Du Jiangyan, Chengdu 611830, China
2
Rural Development Research Institute, Sichuan Academy of Social Science, Chengdu 610041, China
3
College of Geography and Resources Science, Sichuan Normal University, Chengdu 610101, China
*
Author to whom correspondence should be addressed.
These authors contributed equally to this work and should be considered co-first authors.
Land 2020, 9(5), 134; https://doi.org/10.3390/land9050134
Submission received: 20 March 2020 / Revised: 24 April 2020 / Accepted: 27 April 2020 / Published: 28 April 2020
(This article belongs to the Special Issue Mountains under Pressure)

Abstract

:
Residents of rural areas live and depend on the land; hence, rural land plays a central role in the human–land relationship. The environment has the greatest direct impact on farmers’ lives and productivity. In recent years, the Chinese government carried out vigorous rural construction under a socialist framework and implemented a rural revitalization strategy. This study was performed in a rural area of Huanjiang County, Guangxi Province, China. We designed a survey to measure rural households’ perceptions of three types of rural spaces: ecological, living, and production spaces. The survey was administered to 379 farmers, and their perceptions and satisfaction with Ecological–Living–Productive spaces were evaluated with the use of structural equation modeling. Analysis of latent and observed variables indicates that: (1) Farmers’ overall satisfaction with Ecological–Living–Productive spaces was moderate. The average satisfaction score for production spaces was lowest (2.881) while that for living spaces was highest (3.468) and that for ecological spaces was in between (3.351). (2) The three most important exogenous observed variables associated with living space satisfaction were house comfort > domestic water supply > domestic sewage treatment. The three most important exogenous observed variables associated with production space satisfaction were irrigation water > cultivated land quantity > cultivated land fertility. The three most important exogenous observed variables associated with ecological space satisfaction were garbage disposal > vegetation cover > flood and waterlogging. Based on the requirements of the rural revitalization strategy and the results of our analyses of rural households’ spatial perceptions, we propose corresponding countermeasures and suggestions.

1. Introduction

Rural space is defined as an area of land that rural residents live in and depend on. It plays a central role in the relationship between humans and the land. Rural land has direct impacts on the lives and production capacity of rural farmers [1] and, as such, has long been the focus of research on the relationship between humans and the land. Studies have proven that rural land, transportation, infrastructure construction, and public services all positively affect farmers’ satisfaction and quality of life; however, land factors have more significant impacts [2]. When farmers have higher quality land resources, their happiness is generally higher and they receive greater benefits [3]. Land has diverse functions, and effective functioning increases farmers’ welfare and happiness [4]. Research on multifunctional land around the globe has evolved rapidly from the early studies of multifunctionality in agriculture [5]. In 2001, international organizations formally proposed the concept of agricultural multifunctionality and, with increased research attention, studies of multifunctional land use have gradually spread from the field of agriculture to various other fields [6,7]. Multifunctionality of land use considers that all types of land use interact. Overall, it relates to the products and services that the land can provide for residents of a certain area [8]. The multifunctionality of land use emphasizes land use versatility; as such, research on it is comprehensive and covers a wide range of topics.
In 2004, the EU Integrated Project SENSOR (Sustainability Impact Assessment: Tools for Environmental, Social and Economic Effects of Multifunctional Land Use in European Regions), first proposed the concept of multifunctional land use [9]. Specifically, it refers to the private and public products and services provided by different land use methods [10] in terms of society, economy, and the environment [11]. Following this, extensive research on land use versatility was performed. It should be noted that there are differing views within the academic community regarding the classification of land use functions. From the perspective of functional subjectivity, land use functions can be divided into three primary categories: economic, social, and ecological [12,13]. Economic functions include material production and economic development, social functions include transportation and residential functions, and ecological functions include environmental regulation and ecological maintenance capabilities [14]. More recently, a new method of categorizing land use was proposed as an increasing number of scholars have begun to study land use from the perspective of production, living, and ecological functions [15,16,17]. Here, living functions refer to the space’s capacity for human production and life [18], production functions refer to the various products and items of value produced by the land [19], and ecological functions refer to the ability of the land to adjust ecologically and maintain human survival [20]. With the increased interest in the theory of sustainable development over recent years, the Ecological–Living–Productive land use model has become a focus of research within the field of multifunctional land use.
Perception is the act of recognizing certain facts [21]. It is the first step in understanding the surrounding environment and the beginning of all behavior [22,23,24]. Environmental perceptions are the perceptions that people form regarding their natural surroundings and social environment [25,26,27]. Current studies on the environmental perceptions of farmers focus on their risk perceptions [28], how their perceptions impact behavioral decision-making [29], their perceptions of and adaptation to climate and environmental change [30], and their perceptions of land degradation [31]. In terms of the risk perceptions of farmers, there are many studies of their effects on livelihood [32], environmental risk in the breeding industry [33], agricultural production and operation [34], and the risk perception of farmers in response to climate change [35]. Research on farmers’ perceptions primarily examines their influences on behavioral decision-making, analyses perceptions, and adaptive behaviors, and investigates consistency in perceptions and behavior [36]. In particular, there is a relatively large body of literature on farmers’ perceptions of climate change and their adaptive behaviors in poor and arid areas [37], and the effects of perceived value on farmers’ input behaviors [38], planting decisions, and satisfaction with new residential areas [39,40]. Further, analysis of farmers’ perceptions was also applied in the context of the evaluation and analysis of policies such as the rural revitalization policy and the countryside home appliance policy in China [41], the latter of which provides subsidies for farmers to purchase home appliances. Farmers’ perceptions of climatic and environmental changes are affected by factors such as soil fertility, land tenure, age, years of education, time spent in agriculture, and use of social networks [42]. Further, many farmers report perceived changes in local temperature and precipitation [43]. Farmers’ perceptions of land degradation mainly relate to land erosion, soil erosion, fertility loss, and land fragmentation [44]. Research shows that farmers’ understanding of land degradation is a key social factor in controlling land erosion and soil erosion [45].
In summary, current research on land space functions is relatively mature. The focus in this field has changed from early studies of multifunctional agriculture to contemporary studies of multifunctional land use, primarily discussions of land space Ecological–Living–Productive functions. Farmers’ perceptions have also led to discussions in several related fields, such as natural disaster risk, climate change, adaptability of farmers’ livelihoods, and land degradation; and an increasing number of comprehensive multidisciplinary studies have been conducted. However, studies that have evaluated perceptions of rural spaces have not combined perspectives of production, living, and ecological land use functions. The current study addresses this gap by analyzing farmers’ perceptions of, and satisfaction with, rural production spaces, living spaces, and ecological spaces. More importantly, our research is novel as it focuses on farmers’ socioeconomic identity to explore its impact on their perceptions of different land spaces. We consider farmers’ direct perceptions or evaluations of the internal components of different land spaces and analyze their impacts on their overall evaluation of space, which is a very different approach to that used in previous studies. The main factors affecting perception and satisfaction, as related to production, living, and ecological functions, are analyzed using structural equation modeling (SEM). Finally, based on our results, we propose measures to improve land use quality and suggestions for rural space management.

2. Study Area and Data Sources
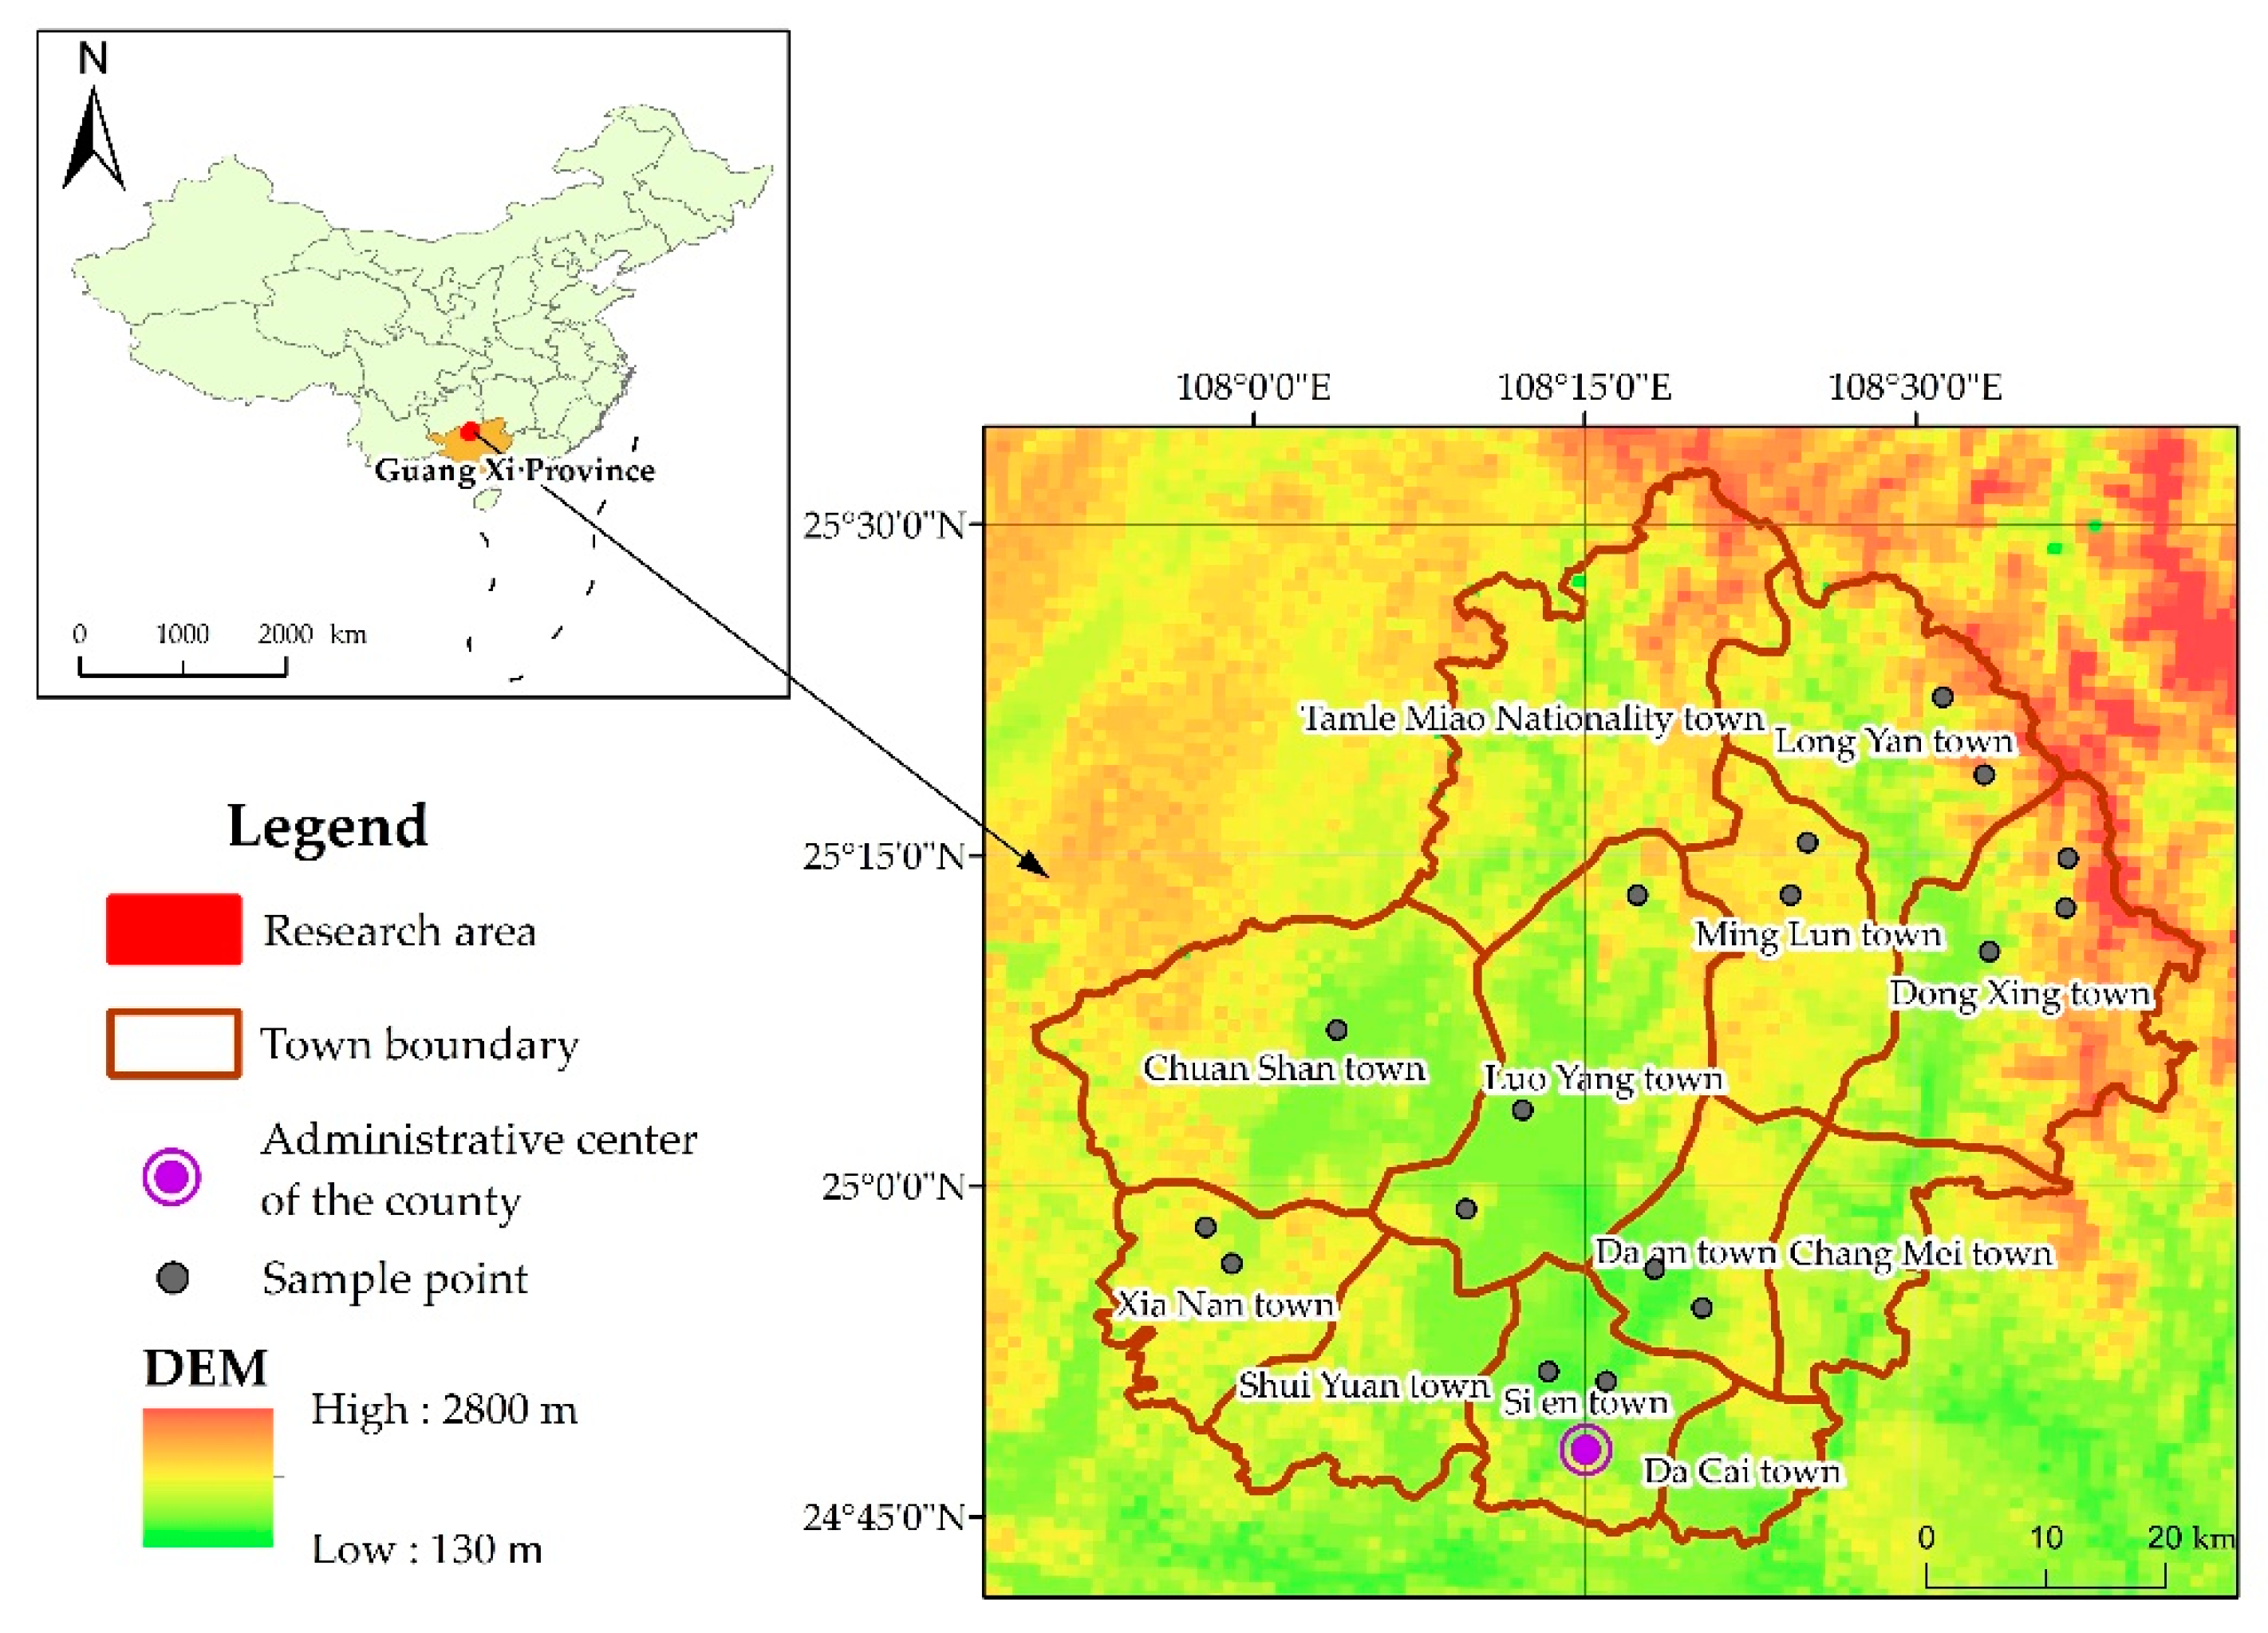
2.1. Study Area

Huanjiang County, Guangxi Province, China, is located between 24°44′–25°33′ N and 107°51′–108°43′ E (Figure 1). It covers a total area of 4553 km2 and is the third largest county in Guangxi. Huanjiang County has 12 townships under its jurisdiction (Table 1) and 149 administrative villages, of which Chuanshan town has the largest area and contains 20 administrative villages with a total area of 66,440.32 ha. The smallest town is Dachai township, which has eight administrative villages under its jurisdiction covering 12,838.92 ha. According to the Statistical Yearbook, the total permanent population in 2016 was 374,312, of which the rural population was 324,101 (86.6%). Huanjiang County is one of 28 poverty-stricken counties in Guangxi and has very poor economic development. As an example, in 2016, the GDP of Huanjiang County was only 4.53 billion yuan, ranking last economically among Guangxi’s counties. Huanjiang County is in the low-latitude region near the Tropic of Cancer. The climate reflects a transition from the southern subtropical climate to the mid-lying subtropical monsoon climate, with abundant light, heat, and humidity. As the main landform types in this area are karst landforms, the hydrological features mainly include surface water and groundwater.

2.2. Data Sources

The sampling locations were chosen with consideration of two factors: the distance from each sample village to the administrative center of the county, and the level of economic development. In choosing the sampling locations, we also considered Tobler’s first law: the closer the object, the higher the similarity. We tried our best to avoid selecting sample points that were spatially homogeneous. A stratified sampling method was adopted to select 16 sample villages from the 141 villages in Huanjiang County. This study was carried out in two stages using the Participatory Rural Assessment (PRA) method [46]. The first stage was completed between 16–26 May 2016. The first stage involved a survey of the actual situation in Huanjiang County; it involved surveying farmers and holding interviews with key personnel. In the second stage, from 4–14 June 2017, an 11-day in-depth field survey was conducted in Huanjiang County. Data were collected through written questionnaires and face-to-face interviews. We recognized that we may not fully understand the situations of the local villages, especially in those where labor is exported. To select representative villages and avoid ones with no farmers, we consulted local guides and village officials. Questionnaires were completed by interviewers and a total of 363 valid questionnaires were obtained. The questionnaire comprised questions on household characteristics and the basic conditions of farmers, land characteristics, farming conditions, and satisfaction with the Ecological–Living–Productive spaces, among others. The average time taken for the semistructured interviews was 1.5 h. Prior to the survey, the project leader conducted centralized training and field drills with 12 research staff to ensure they had the necessary field survey skills and understood the ethical requirements. In addition, to avoid farmers’ misunderstanding the questions due to low education (most were educated to middle high or senior middle school levels, 47.3% and 31.5%, respectively) or differences in local dialect, we selected interviewers able to use the local dialect. During the survey period, one person was responsible for reviewing each questionnaire to ensure that high-quality data were obtained.

3. Research Design and Research Methods

3.1. Data Sources and Scale Design

Based on previous research results, we designed a series of Likert scales to investigate farmers’ satisfaction with their local living space [47,48]. Question responses were rated on a 5-point Likert scale as “strongly disagree” (1), “disagree” (2), “general or inaccurate” (3), “agree” (4), and “strongly agree” (5). We put forward a basic hypothesis that the total rural space satisfaction level of rural households was based on satisfaction with three aspects: living, production, and ecology. Rural households wholly depend on their living spaces. A review of the literature suggested that in addition to rural households’ perceptions of their own housing conditions, other factors within the living space should be considered [49]. Therefore, to fully assess perceptions of living spaces, we measured perceptions related to road traffic, house comfort, neighborhood relations, domestic water conditions, domestic sewage treatment, local medical treatment, and convenience of shopping at the local market, and used them as observed variables. In terms of perceptions of production spaces, the observed variables included cultivated land quantity, cultivated land fertility, cultivated land access, agricultural facilities, job opportunities in the village, and sufficient irrigation water. The observed variables for ecological space perception included characteristics of rocky desertification in karst areas, the evaluation of local rocky desertification, river water quality, flood and waterlogging, garbage disposal, and vegetation coverage. Among them, the amount of cultivated land, the severity of rocky desertification, and increases in floods and waterlogging were negative evaluation indicators.

3.2. Research Methods

This study used SEM, which is a useful multivariate analysis method primarily used to estimate and test causal relationships between variables [50]. SEM has the advantages of combining factor analysis and path analysis, and processing multiple dependent variables at the same time to give simultaneous estimates of the structure of factors and the relationships between them. It allows for measurement of error in independent and dependent variables and it has been widely used in various disciplines. The analysis process was based on a covariance matrix analysis that included both observed variables and indirectly observable latent variables [51]. An SEM consists of two parts: a measurement model and a structural model [52]. In this study, the satisfaction evaluation of ecological, living, and productive spaces formed the observed variables, and the remaining 18 evaluation factors were used as latent variables. Therefore, an SEM model is appropriate. The expressions of the equations follow:
X = X Ψ + υ
Y = Y ϑ + ς
ϑ = Q ϑ + T ψ + σ
In the three equations, Models 1 and 2 are measurement models representing measurement levels, and Model 3 is the SEM. X is an exogenous observed variable vector that can be directly measured and Ψ is an exogenous latent variable vector; Y is an endogenous measurable variable vector and ϑ is an endogenous latent variable vector. X and Y refer to factor loading matrices, which are expressed as the correlation between exogenous observed variables and corresponding exogenous latent variables, and between endogenous observed variables and corresponding endogenous latent variables, respectively. Q is the unique matrix of endogenous latent variables. T refers to the effect of exogenous latent variables on the corresponding endogenous latent variables. υ , ς , and σ are error terms used in the measurement model and structural equation. SEM data analysis was primarily performed using AMOS (Analysis of Moment Structure) software and basic data processing and inspection were conducted in SPSS (Statistical Product and Service Solutions) 17.0 software.
Based on the principles of SEM and the Likert scale measurement system, this paper established a structural equation as follows (Figure 2).

4. Results and Discussion

4.1. Reliability and Validity of Measures

Prior to data analysis, the classic alpha (Cronbach) coefficient was used to analyze the credibility and validity of the survey data at different levels. Cronbach’s alpha is a measure of internal consistency, that is, how closely related a set of items are as a group. A high alpha value is often used (along with substantive arguments and possibly other statistical measures) as evidence that the items measure an underlying (or latent) construct [53]. Some classic studies have demonstrated that the coefficient has a strong effect on the reliability index of the measured data; the higher the coefficient, the higher the reliability [54]. The test results are shown in Table 2. It can be seen that the α coefficient (CA) value (0.762) exceeds the required value of ≥0.7. Thus, the scale is reliable. Further, the three latent variables were tested separately and returned CA values of 0.724, 0.821, and 0.773, respectively, all of which were >0.7, indicating consistency in the data. Factor analysis was then performed to analyze the validity of the data. The overall KMO (Kaiser–Meyer–Olkin) value was 0.844, and those of the three latent variables were all >0.7 and highly significant. Bartlett’s test of sphericity was applied to the KMO values, which showed that the data collected in this study were suitable for factor analysis.

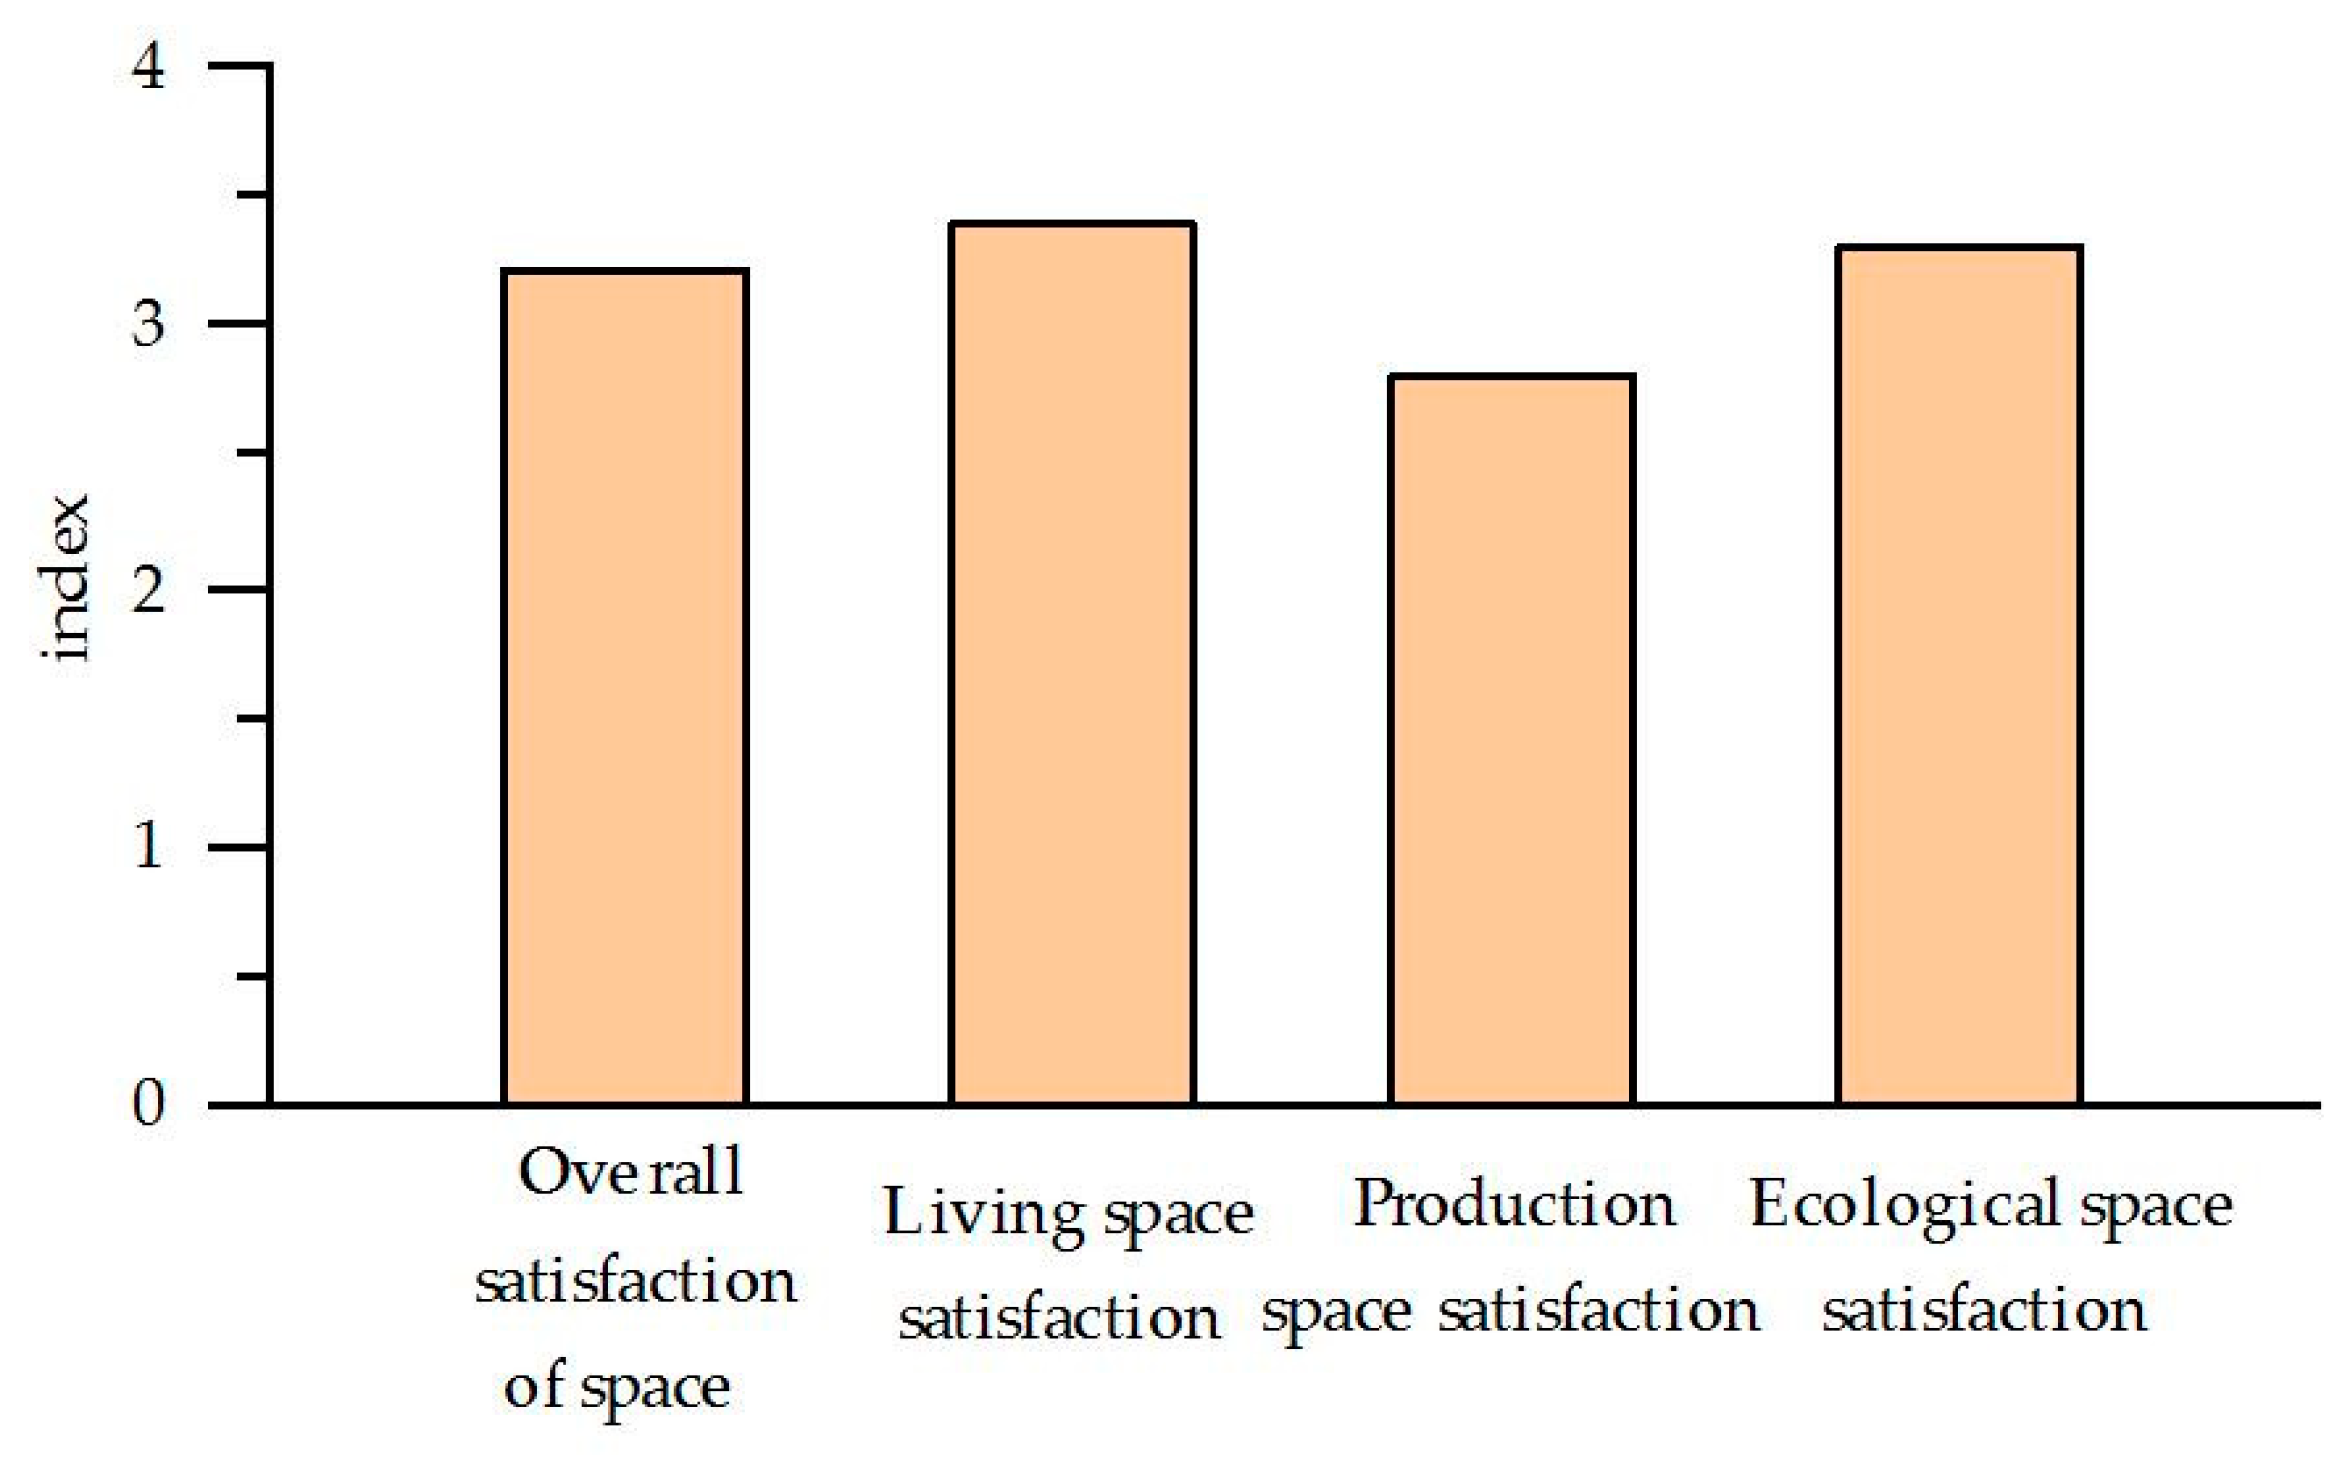
4.2. Overall Evaluation of Satisfaction with the Ecological–Living–Productive Spaces

This study measured satisfaction with the Ecological–Living–Productive spaces overall, as well as with each type of space separately (Figure 3). The overall satisfaction of farmers in Huanjiang County was moderate, with a score of 3.233 out of a possible total of 5. This indicates that farmers were neither satisfied nor dissatisfied with the local living space. Analysis of satisfaction with different types of space revealed that farmers had the lowest satisfaction with production spaces (2.881) and the highest with living spaces (3.468), with ecological space satisfaction falling between these values (3.351). This indicates that new rural construction, rural environmental quality, and infrastructure construction carried out in Huanjiang County in recent years were relatively effective, as farmers perceive that the quality of the living environment has significantly improved. However, the production space satisfaction scores were relatively low, which reflects, to some extent, farmers’ dissatisfaction with the local agricultural production environment.

4.3. Satisfaction with Land Space Characteristics Based on Farmers’ Attributes

We found that the satisfaction of farmers varied according to the attributes of household income level, gender, education level, age, household size, and household location, especially household income level, education level, and household location (Table 3). Among them, farmers with higher incomes tended to be more satisfied with the overall space. It should be noted that farmers with an annual income of <20,000 CNY had very low satisfaction with production spaces. Farmers with higher education levels were more satisfied with the overall and individual spaces. In terms of the geographic position, farmers in the Valley region had significantly higher satisfaction with the overall space than those living in the Middle Mountain and low-lying regions, who also had the lowest satisfaction score for production spaces.

4.4. Exploratory Factor Analysis

Principal component analysis is commonly used for exploring the influences of observed variables. Orthogonal rotation was applied to the data to explore the correlations between factors and extract common factors (Table 4). The results show that three variables (Ecological–Living–Productive space satisfaction) explain 62.17% of overall satisfaction with spaces in Huanjiang County. However, within some of the common factors, there were differences in the interpretation of the survey ratings. In order to further explore and test the reliability of the variables and measure the degree to which the observed variables explain the latent variables, we analyzed the combined validity of the survey. The test results are shown in Table 5. The combined reliability of the three-dimensional variables was greater than the reference standard of 0.50, which shows that the scale designed in this paper has relatively high convergent validity and discriminant validity.

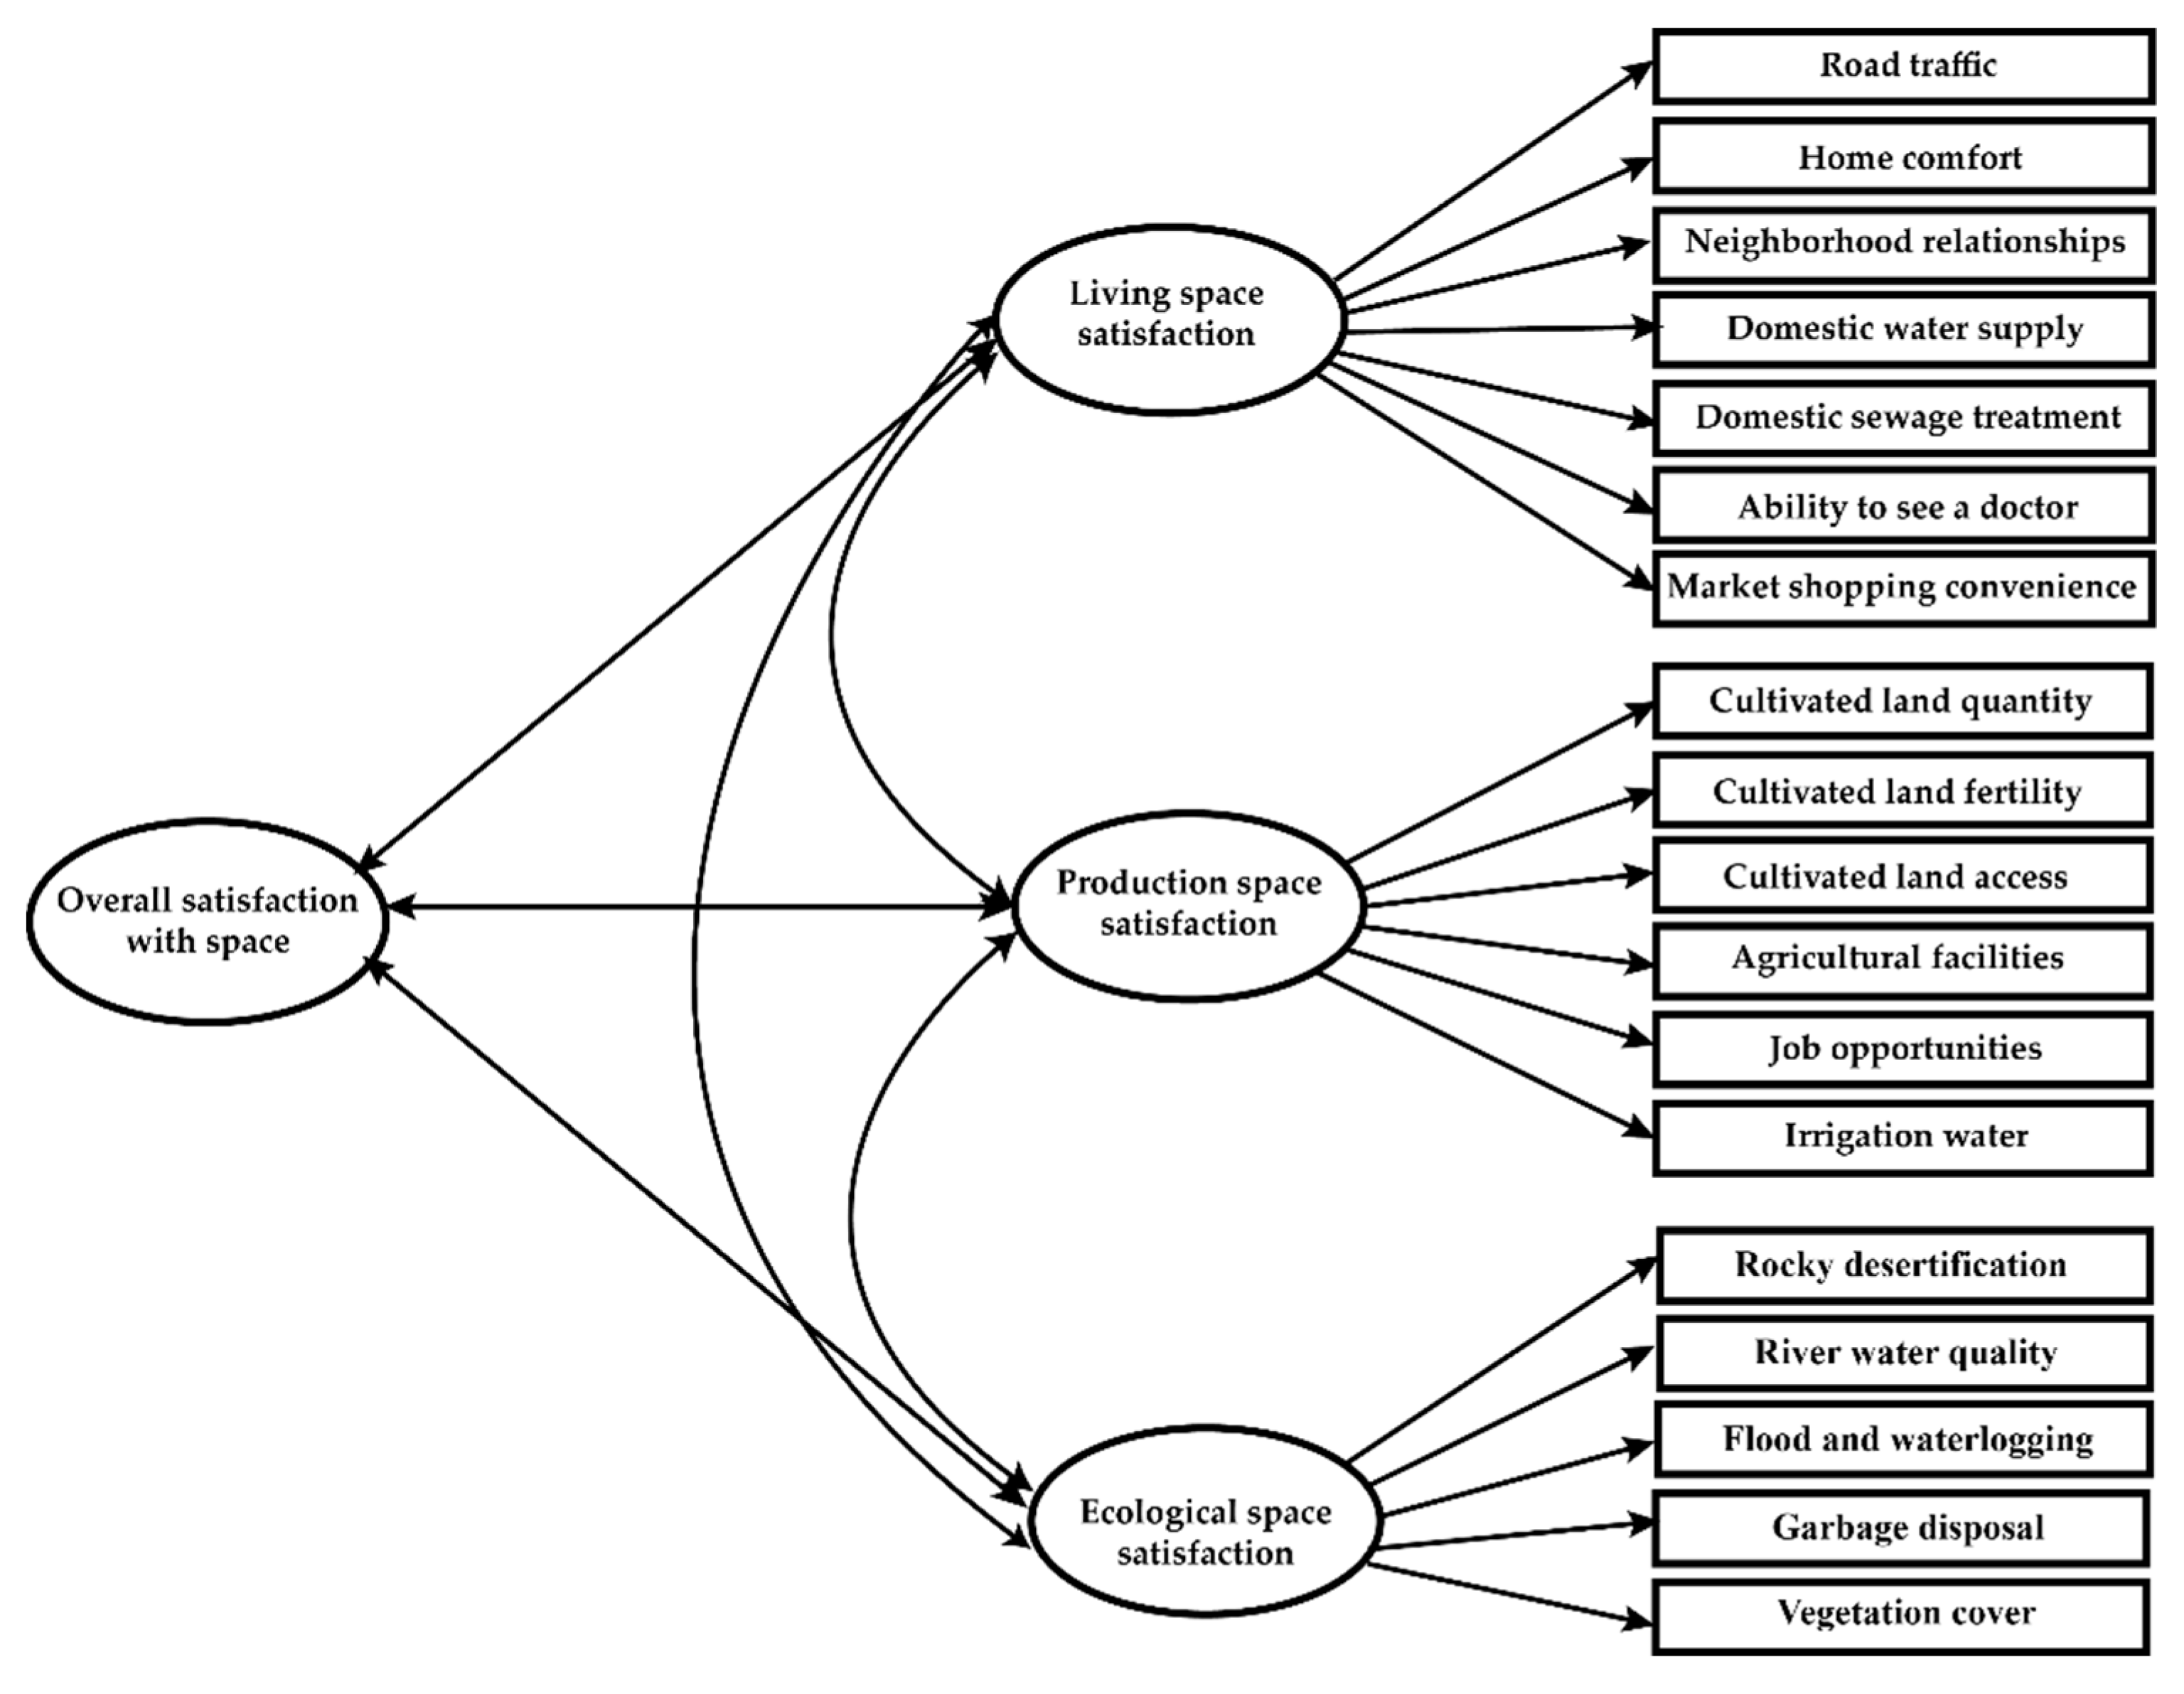
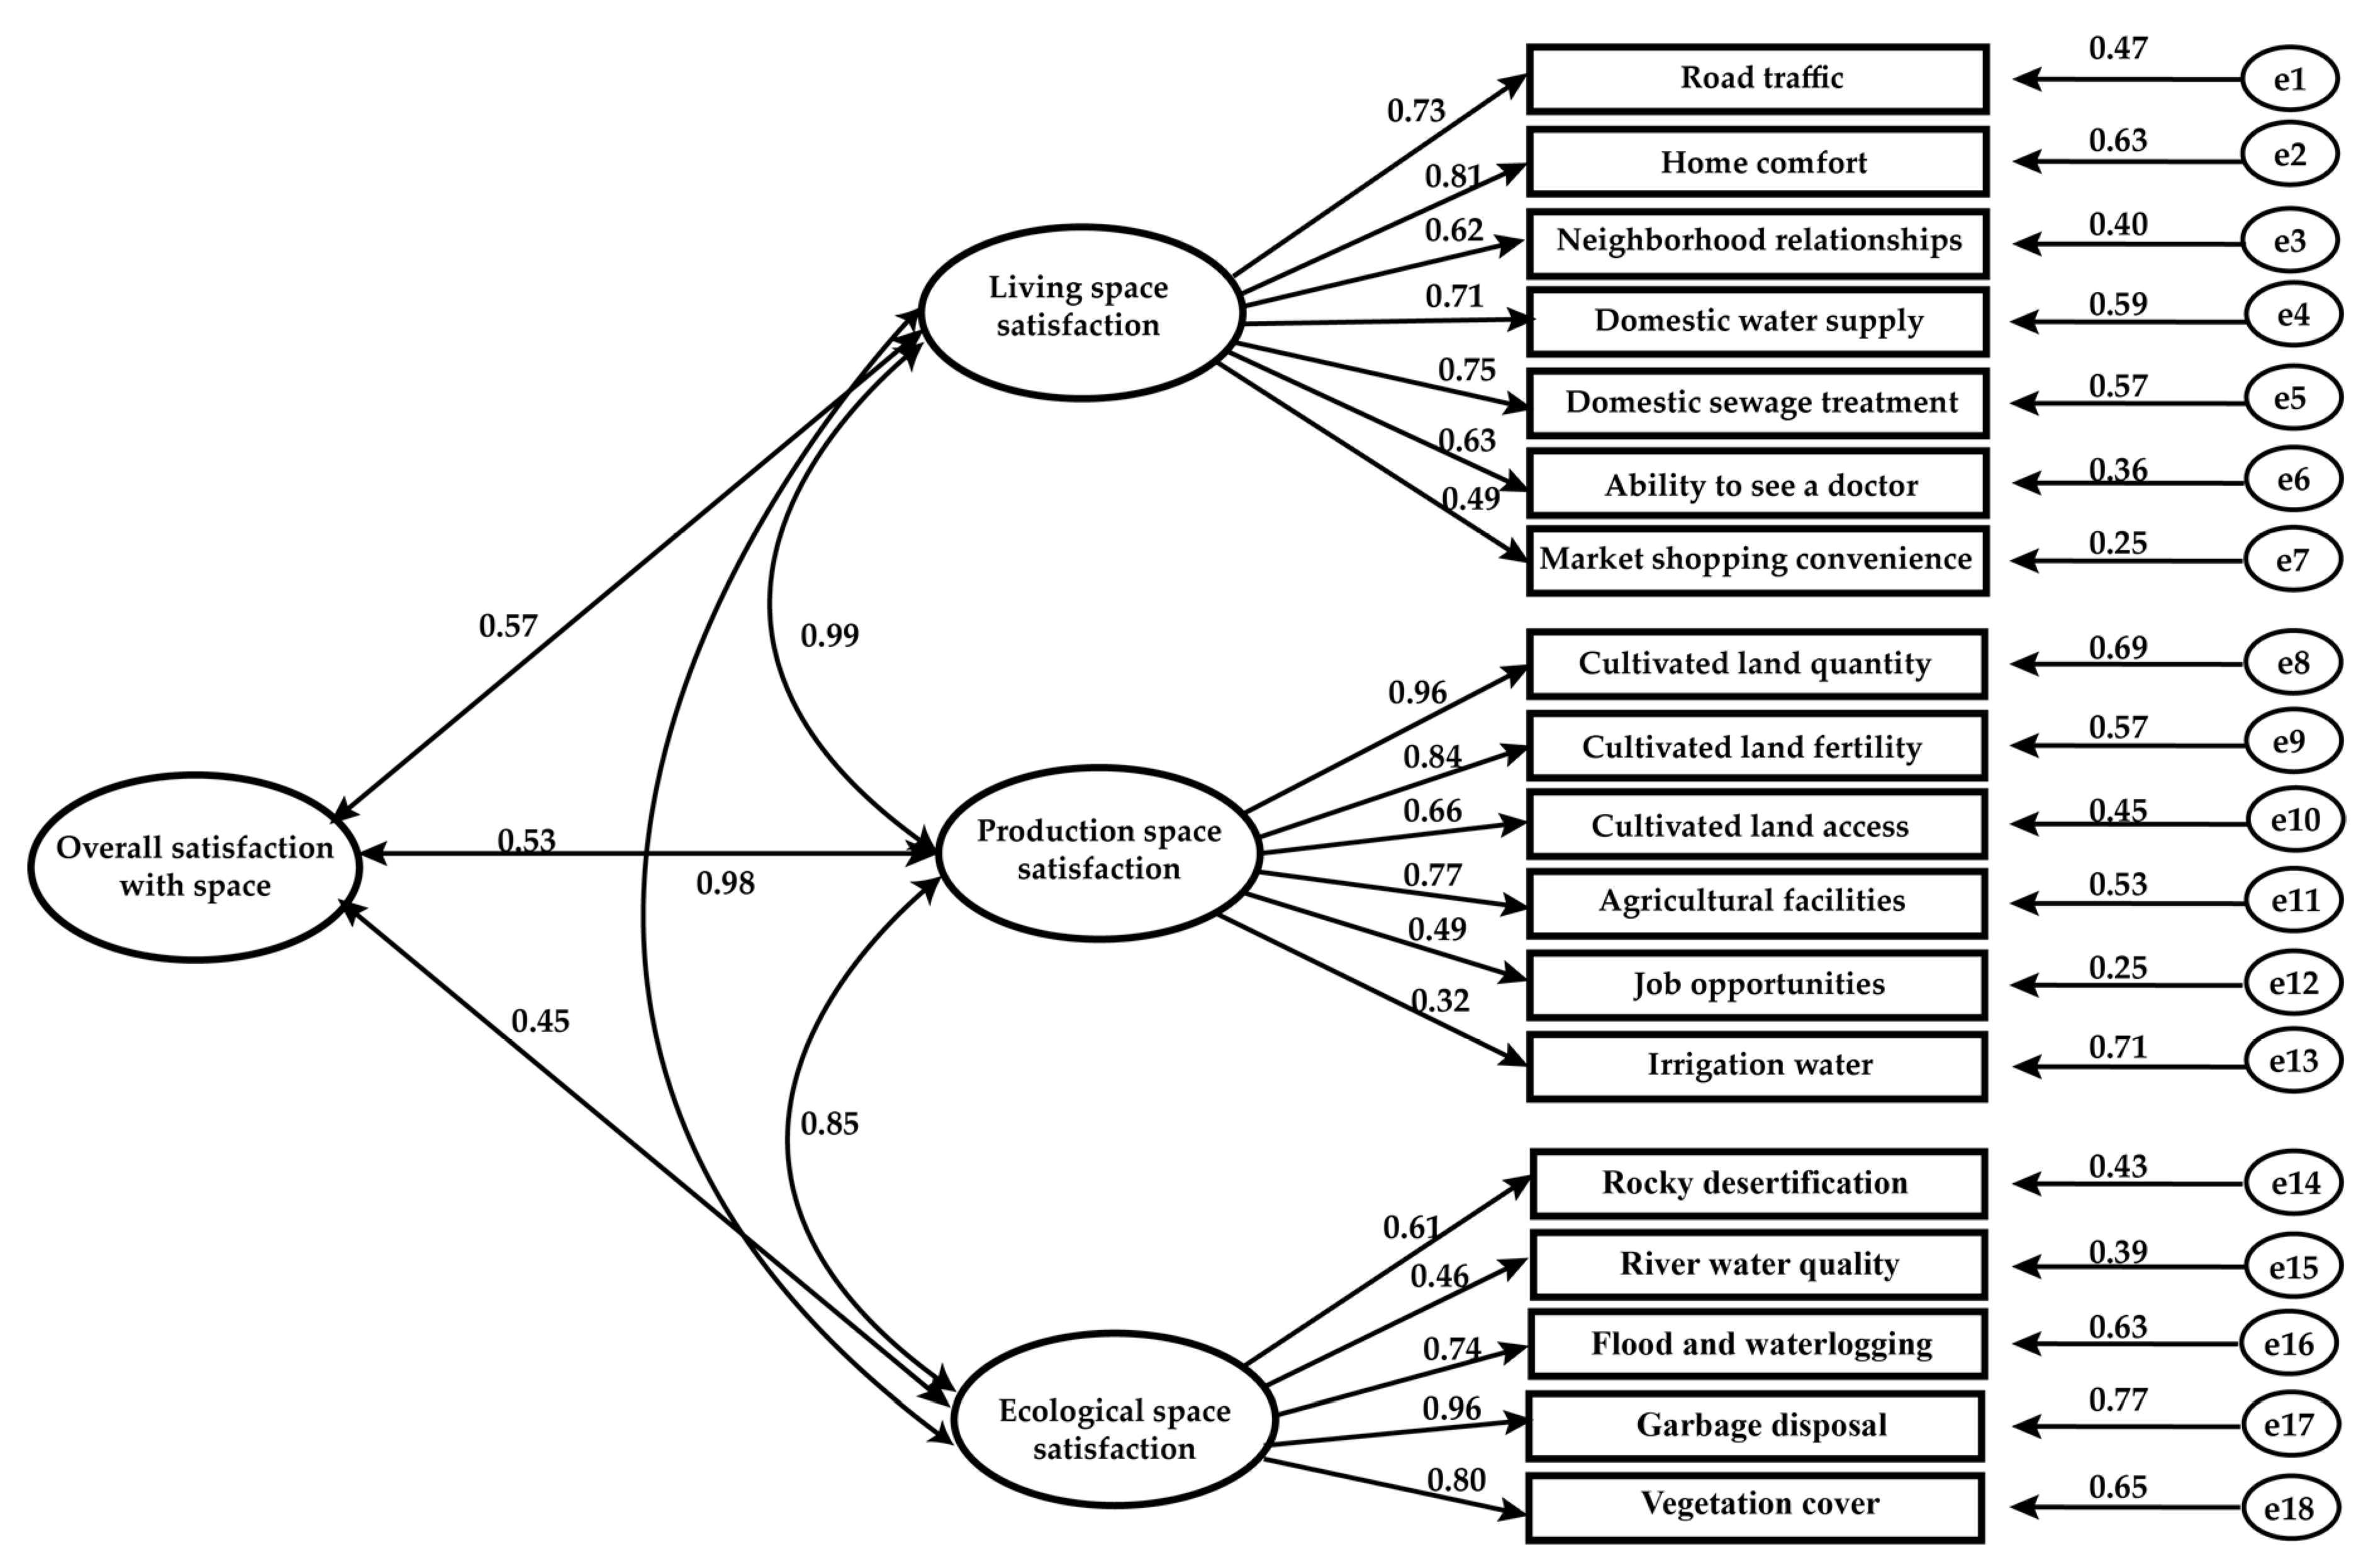
4.5. Modification of the Rural Households’ Ecological–Living–Productive Space Satisfaction Model

An initial model of Ecological–Living–Productive space satisfaction was established through analysis of the data. Then, the maximum likelihood estimation algorithm was used to estimate and modify it. The parameters of the Ecological–Living–Productive space equation were obtained through repeated experimentation and verification. The SEM of overall satisfaction, the detailed parameter estimates, and the standardized path coefficients are shown in Figure 4. The χ 2 test value of the rural households’ Ecological–Living–Productive space satisfaction model was 211.634. Combined with the degrees of freedom, the absolute fit index (137.354/69) was 1.991, which is within the specified range (1–3). The reduced index IFI (increasing fit index), relative fit index NFI (canonical fit index) and TLI (Tucker–Lewis index) were 0.976, 0.915, and 0.943, respectively, which are all greater than the reference standard of 0.9. The RMSEA (root-mean-square error of approximation) value was 0.074, which is less than the standard of 0.1. These findings indicate that the model generally fit the data well, indicating that it is reasonable to model the three latent variables in the household Ecological–Living–Productive space satisfaction model.

5. Discussion

According to the overall modeling results (Figure 4), the basic hypothesis—that the three latent variables underlie household Ecological–Living–Productive space satisfaction—is upheld. The three latent variables can be ranked according to the values of their coefficients as follows: living space satisfaction > production space satisfaction > ecological space satisfaction. This shows that most people in the rural areas of Huanjiang County are gradually becoming wealthier. Incomes have increased and living standards have gradually improved. While residents in these areas previously focused on production issues, they are now becoming increasingly concerned with improving their quality of life. This is also consistent with Maslow’s demand-level theory. The findings as they relate to the observed variables and their three corresponding exogenous latent variables are described below.

5.1. House Comfort, Domestic Water Supply, and Domestic Sewage Treatment Significantly Affect Farmers’ Perceived Satisfaction with Their Living Space

The standardized path map of exogenous observed variables that affect living space satisfaction indicates that there are clear differences in their strength of effect. These can be ordered according to their coefficient values as house comfort > domestic water supply > domestic sewage treatment > road traffic > neighborhood relationships > ability to see a doctor > market shopping convenience, with corresponding values of 0.63, 0.59, 0.57, 0.47, 0.40, 0.36, and 0.25, respectively.
Among them, the exogenous observed variable with the highest coefficient value was comfort of the house, which relates to the residential area and housing conditions. This finding indicates that rural housing areas and housing conditions are the primary factors influencing farmers’ satisfaction with their living spaces. This is consistent with studies that have reported that the condition of the house has a significant impact on farmers’ rural housing satisfaction [55]. Huanjiang County has a large variation in per capita housing area ownership, and there is an uneven spatial distribution in housing space areas. In our survey, the largest households were 150 m2 per capita, while the smallest households were only 37 m2 per capita. Therefore, vast differences in housing conditions likely led to significant differences in farmers’ satisfaction with their living spaces.
The second strongest exogenous observed variable was domestic water supply. Similar to the results of Yang (2016), we found that reduced water resources in this karst area have had adverse effects on the lives of farmers [56]. Due to the influence of eroded landforms, surface precipitation in this area rapidly moves deep underground [57], which makes it difficult for farmers in the area to access water. The third strongest observed variable was domestic sewage treatment. Consistent with the results of Zhong (2009) [58], we found that the treatment of rural garbage and sewage is an important influence on farmers’ evaluations of their living spaces. In recent years, local townships and villages have developed extensively; however, sewerage treatment in this area has not kept up. For example, a survey of farmers from a village in Luoyang Township indicated that the entire river became fouled after the construction of a breeding farm in the upper reaches of the village. As a result, the whole village smelled bad in the summer. Although some rural areas have begun to set up centralized garbage collection and treatment stations, there are generally few installations and the rural population is generally less conscious of environmental protection, which makes it difficult for rural wastewater to be effectively treated. The results of this study indicate that the above three factors have a significant influence on the degree of perceived satisfaction that farmers have in relation to their living spaces.

5.2. Irrigation Water Conditions and the Quantity and Quality of Cultivated Land Significantly Affects Farmers’ Satisfaction with Production Spaces

The standardized path map of exogenous observed variables that affect farmers’ satisfaction with production spaces indicates that the observed variables can be ranked as follows: irrigation water > cultivated land quantity > agricultural land fertility > agricultural facilities > cultivated land access > job opportunities; the corresponding coefficient values are 0.71, 0.69, 0.57, 0.53, 0.45, and 0.25, respectively.
The strongest exogenous observed variable was irrigation water. Our results are similar to those of Wu (2009), indicating that the limited irrigation water in karst rural areas is a primary factor affecting farmers’ agricultural production [59]. Our investigation also found that although precipitation in Huanjiang County was sufficient, it primarily occurred from May to September, which is also the season with the most severe waterlogging. The uneven seasonal distribution of precipitation, combined with the shortcomings of the karst geological environment discussed above, cause seasonal water shortages in rural areas that impact farmers’ agricultural production. The second strongest observed variable that affected satisfaction with production spaces was cultivated land quantity. A previous survey found spatial imbalance and substantial variation in per capita cultivated land in Huanjiang County. The lack of cultivated land resulted in a shortage of basic resources required for farmers’ livelihoods, leading to dissatisfaction with their own agricultural production spaces. The third strongest observed variable affecting farmers’ satisfaction with their production spaces was cultivated land fertility. Due to variation in the geographical location of farmers, the conditions on the land they own also vary [60]. The long-standing local system of land distribution has divided the land that is within the jurisdiction of the village to village farmers, with little cross-regional land distribution between villages. The village location, therefore, determines the quality of land resources available to farmers to a large extent. Compared with farmers living in low-lying land or the Middle Mountain region, farmers in valleys have more paddy fields and less dry land. Generally speaking, paddy fields are dominated by partial loam soil, while dry land is mainly dominated by clay and sandy soils. Loamy soil is highly fertile, followed by clay, with sandy soil exhibiting the poorest fertility [61]. Thus, paddy field farmers tend to exhibit the highest levels of satisfaction. It is clear that differences in cultivated land fertility have an important impact on farmers’ perceptions of production spaces.

5.3. Garbage Disposal, Vegetation Cover, and Flood and Waterlogging Significantly Affect Farmers’ Satisfaction with Ecological Spaces

The standardized path coefficients for the exogenous observed variables affecting satisfaction with ecological spaces can be ranked as follows: garbage disposal > vegetation cover > flood and waterlogging > rocky desertification > river water quality, with corresponding coefficients of 0.77, 0.65, 0.63, 0.43, and 0.39, respectively. The strongest path coefficient was for garbage disposal. The status of garbage disposal around farmers has become an important factor impacting their local ecological spaces. China is currently implementing a policy of habitat management in rural areas throughout the country, and the government of the study area has allocated funds to construct several centralized garbage collection points. However, some farmers do not have a strong awareness of environmental protection which, coupled with a lack of publicity of centralized waste disposal sites by some village leaders, sometimes results in garbage being dumped elsewhere. In rural areas where garbage disposal systems are better, the satisfaction of farmers is very high. The second strongest path coefficient was for vegetation coverage. Farmers with better vegetation coverage had a higher degree of satisfaction with it. Generally speaking, most farmers were positive about recent improvements in vegetation coverage in their region. The third strongest influential factor was rocky desertification, which can cause serious damage to the ecological functioning of the land [62]. Rocky desertification in karst areas slows the recovery rate of soil formation, seriously affecting farmers’ satisfaction with ecological spaces [63].

5.4. Household Education, Income, and Location Significantly Affect Farmers’ Satisfaction with Ecological–Living–Productive Spaces

In the results presented in Section 4.3, it was shown that farmers with higher levels of education had higher satisfaction with land spaces. This is in contrast to previous studies, where residents with higher education also had higher expectations of their living spaces, resulting in generally low satisfaction [64]. In our work, the more educated farmers in the areas we studied typically had more opportunities and resources (e.g., money) to choose a superior space to live in, and so were typically more satisfied with their land spaces. This also corroborates the conclusion that farmers with higher income levels have higher satisfaction with the overall local spatial environment. Our field research found that farming households with higher income levels also, typically, had more abundant farmland resources or more nonfarm income channels and, therefore, had higher overall satisfaction with the local subsistence environment. Geographical location is a cause of farmer inequity. Our study area was in a karst mountain area and farmer locations were of three broad categories: middle mountains, low-lying land, and valleys. Farmers in the valley area had more high-quality land resources such as water fields than farmers in other locations. They also had better access to transportation, so they had more opportunity to access a better life, and their overall satisfaction with local land spaces was higher. Therefore, differences and imbalances in resource endowments are important factors contributing to differences in farmers’ ratings of spatial satisfaction.

6. Conclusions and Implications

In this study, SEM was used to simulate and analyze data on the perceptions of farmers with respect to Ecological–Living–Productive spaces. The findings indicate that karst landforms, lack of irrigation water, and land quality and quantity issues are key factors affecting perceptions of production spaces. These problems may become more influential at certain times, especially during the dry season (from December to March). The current findings, together with the available literature, clearly indicate that rural production spaces have become a highly significant problem for farmers. This finding is supported by their low satisfaction with production spaces, which included the lowest scores in the study. Domestic water was one of the most significant factors affecting living space satisfaction. Farmers’ living space and ecological space satisfaction were relatively high, which can be closely linked to the Chinese government’s recent implementation of a rural construction and revitalization strategy. This also suggests that, in terms of the governance of rural space in karst areas, issues related to living spaces and ecological spaces are no longer the primary issues. An important question for the future is: How can we increase the quality of karst rural production spaces? Based on our results, we propose that spatial governance of rural karst areas be strengthened in relation to the following aspects.
(1) Strengthening of water management. Underground water leakage has always been a key factor causing water shortages in karst areas. Therefore, increasing water use and storage infrastructure would help deal with rural irrigation and domestic water use problems.
(2) Improvements in land quality and redistribution of cultivated land resources should become a focus of governance in karst areas. Land management in the karst mountains, especially in relation to the prevention of soil erosion, remains a difficult problem. Due to China’s traditional land distribution system, the reallocation and balancing of land resources among farmers will become an important future direction for land consolidation in the karst mountains.
(3) Continuous improvement in garbage treatment in rural areas is important for increasing rural space quality in karst mountains. With the current promotion of China’s garbage classification system, the treatment of rural garbage and sewage will become a new priority for rural space management.
(4) Finally, ways of relocating farmers, especially those living in the middle mountains and low-lying land to valleys, should be the focus of government policy so that poorly-endowed farmers get access to better resources. Actively improving farmers’ skillsets so they can obtain nonagricultural income could also be an important policy direction.
This study had some shortcomings that affected the results. We did not incorporate the socioeconomic characteristics of farmers into our econometric analysis. Instead, we only used descriptive statistical analyses to illustrate the possible causes of different land space satisfaction evaluations among farmers with different socioeconomic attributes. Therefore, in future research, we will focus on the impacts of farmers’ socioeconomic characteristics on land space satisfaction and their implications for land consolidation. We also need to further investigate the role of rural governance.

Author Contributions

Conceptualization, J.W., Y.S., and W.D.; data curation, J.W., Y.S., and S.Z.; formal analysis, J.W. and H.Z.; investigation, J.W., L.Z., and W.D.; supervision, W.D.; visualization, Y.S. and Y.Z.; writing—original draft, J.W. and H.Z.; writing—review and editing, X.D., J.W., Y.Z., and W.D. All authors have read and approved the final manuscript.

Funding

We would like to acknowledge support from the National Social Science Fund, grant number 18CJL018, the Key project of National Natural Science Found of China, grant number 41930651, the Sichuan Provincial Research Center for Philosophy and Social Sciences—Sichuan Rural Development Research Center, grant number CR1908, and the Chengdu Science and Technology Bureau Soft Science Project, grant number 2019-RK00-00319-ZF.

Acknowledgments

We wish to thank the instructors and students of Sichuan Academy of Social Science who participated in the survey and the kind local villagers who were willing to be interviewed. We would like to thank four anonymous reviewers for constructive comments that significantly improved this article.

Conflicts of Interest

The authors declare no conflict of interest.

References

  1. Mertz, O.; Mbow, C.; Reenberg, A.; Diouf, A. Farmers’ perceptions of climate change and agricultural adaptation strategies in rural Sahel. Environ. Manag. 2009, 43, 804–816. [Google Scholar] [CrossRef] [PubMed]
  2. Sourabh, S. Quality of life and its correlates in Central India. Int. J. Res. Dev. Health 2013, 1, 13–25. [Google Scholar]
  3. Ikutegbe, V.; Gill, N.; Klepeis, P. Same but different: Sources of natural resource management advice for lifestyle oriented rural landholders. J. Environ. Plan. Manag. 2014, 58, 1530–1543. [Google Scholar] [CrossRef] [Green Version]
  4. Brereton, F.; Bullock, C.; Clinch, J.P.; Scott, M. Rural Change and Individual Well-Being: The Case of Ireland and Rural Quality of Life. Eur. Urban. Reg. Stud. 2011, 18, 203–227. [Google Scholar] [CrossRef] [Green Version]
  5. Zasada, I. Multifunctional peri-urban agriculture—A review of societal demands and the provision of goods and services by farming. Land Use Policy 2011, 28, 639–648. [Google Scholar] [CrossRef]
  6. Renting, H.; Rossing, W.; Jeroen, J.G.; Van Der Ploeg, J.; Laurent, C.; Perraud, D.; Stobbelaar, D.; Van Ittersum, M.; Van Ittersum, M. Exploring multifunctional agriculture. A review of conceptual approaches and prospects for an integrative transitional framework. J. Environ. Manag. 2009, 90, S112–S123. [Google Scholar] [CrossRef]
  7. Kristensen, S.; Busck, A.G.; Van Der Sluis, T.; Gaube, V. Patterns and drivers of farm-level land use change in selected European rural landscapes. Land Use Policy 2016, 57, 786–799. [Google Scholar] [CrossRef]
  8. Gascoigne, W.R.; Hoag, D.L.; Koontz, L.; Tangen, B.; Shaffer, T.L.; Gleason, R.A. Valuing ecosystem and economic services across land-use scenarios in the Prairie Pothole Region of the Dakotas, USA. Ecol. Econ. 2011, 70, 1715–1725. [Google Scholar] [CrossRef]
  9. Tscherning, K.; Helming, K.; Krippner, B.; Sieber, S.; Paloma, S.G.Y. Does research applying the DPSIR framework support decision making? Land Use Policy 2012, 29, 102–110. [Google Scholar] [CrossRef]
  10. Karrasch, L.; Klenke, T.; Woltjer, J. Linking the ecosystem services approach to social preferences and needs in integrated coastal land use management–A planning approach. Land Use Policy 2014, 38, 522–532. [Google Scholar] [CrossRef]
  11. Schulte, R.; Creamer, R.; Donnellan, T.; Farrelly, N.; Fealy, R.; O’Donoghue, C.; O’Huallachain, D. Functional land management: A framework for managing soil-based ecosystem services for the sustainable intensification of agriculture. Environ. Sci. Policy 2014, 38, 45–58. [Google Scholar] [CrossRef] [Green Version]
  12. Li, Y.; Lu, C.; Deng, O.; Chen, P. Ecological Characteristics of China’s Key Ecological Function Areas. J. Res. Ecol. 2015, 6, 427–433. [Google Scholar]
  13. Shaohong, W.; Qinye, Y.; Du, Z. Delineation of eco-geographic regional system of China. J. Geogr. Sci. 2003, 13, 309. [Google Scholar] [CrossRef]
  14. Ren, J.Z.; Hu, Z.Z.; Zhao, J.; Zhang, D.G.; Hou, F.J.; Lin, H.L.; Mu, X.D. A grassland classification system and its application in China. Rangel. J. 2008, 30, 199–209. [Google Scholar] [CrossRef]
  15. Shi, Z.; Deng, W.; Zhang, S. Spatio-temporal pattern changes of land space in Hengduan Mountains during 1990–2015. J. Geogr. Sci. 2018, 28, 529–542. [Google Scholar] [CrossRef] [Green Version]
  16. Kabisch, N.; Strohbach, M.; Haase, D.; Kronenberg, J. Urban green space availability in European cities. Ecol. Indic. 2016, 70, 586–596. [Google Scholar] [CrossRef]
  17. Zhu, Y.Y.; Yu, B.; Zeng, J.X. Spatial optimization from three spaces of production, living and ecology in national restricted zones: A case study of Wufeng County in Hubei Province. Econ. Geogr. 2015, 35, 26–32. (In Chinese) [Google Scholar]
  18. De Groot, R. Function-analysis and valuation as a tool to assess land use conflicts in planning for sustainable, multi-functional landscapes. Landsc. Urban Plan. 2006, 75, 175–186. [Google Scholar] [CrossRef]
  19. Marondedze, A.K.; Schütt, B. Dynamics of Land Use and Land Cover Changes in Harare, Zimbabwe: A Case Study on the Linkage between Drivers and the Axis of Urban Expansion. Land 2019, 8, 155. [Google Scholar] [CrossRef] [Green Version]
  20. Feurer, M.; Heinimann, A.; Schneider, F.; Jurt, C.; Myint, W.; Zaehringer, J.G. Local perspectives on ecosystem service trade-offs in a forest frontier landscape in Myanmar. Land 2019, 8, 45. [Google Scholar] [CrossRef] [Green Version]
  21. Firestone, C.; Scholl, B.J. Cognition does not affect perception: Evaluating the evidence for “top-down” effects. Behav. Brain Sci. 2016, 39, e229. [Google Scholar] [CrossRef] [PubMed]
  22. Bartz, J.; Zaki, J.; Bolger, N.; Ochsner, K.N. Social effects of oxytocin in humans: Context and person matter. Trends Cogn. Sci. 2011, 15, 301–309. [Google Scholar] [CrossRef] [PubMed]
  23. Klöckner, C.A.; Blöbaum, A. A comprehensive action determination model: Toward a broader understanding of ecological behaviour using the example of travel mode choice. J. Environ. Psychol. 2010, 30, 574–586. [Google Scholar] [CrossRef] [Green Version]
  24. Young, A.W.; Hellawell, D.; Hay, D.C. Configurational information in face perception. Perception 2013, 42, 1166–1178. [Google Scholar] [CrossRef]
  25. Koubi, V.; Spilker, G.; Schaffer, L.; Böhmelt, T. The role of environmental perceptions in migration decision-making: Evidence from both migrants and non-migrants in five developing countries. Popul. Env. 2016, 38, 134–163. [Google Scholar] [CrossRef]
  26. Wang, B.Z.; Cheng, Z. Environmental perceptions, happiness and pro-environmental actions in China. Soc. Indic. Res. 2017, 132, 357–375. [Google Scholar] [CrossRef]
  27. Kyle, G.; Graefe, A.; Manning, R.; Bacon, J. Effects of place attachment on users’ perceptions of social and environmental conditions in a natural setting. J. Environ. Psychol. 2004, 24, 213–225. [Google Scholar] [CrossRef]
  28. Ndamani, F.; Watanabe, T. Determinants of farmers’ climate risk perceptions in agriculture—A rural Ghana perspective. Water 2017, 9, 210. [Google Scholar] [CrossRef]
  29. Kim, D.J.; Ferrin, D.L.; Rao, H.R. A trust-based consumer decision-making model in electronic commerce: The role of trust, perceived risk, and their antecedents. Decis. Support Syst. 2008, 44, 544–564. [Google Scholar] [CrossRef]
  30. Gandure, S.; Walker, S.; Botha, J.J. Farmers’ perceptions of adaptation to climate change and water stress in a South African rural community. Environ. Dev. 2013, 5, 39–53. [Google Scholar] [CrossRef]
  31. Teshome, A.; De Graaff, J.; Ritsema, C.; Kassie, M. Farmers’ perceptions about the influence of land quality, land fragmentation and tenure systems on sustainable land management in the north western Ethiopian highlands. Land Degrad. Dev. 2016, 27, 884–898. [Google Scholar] [CrossRef]
  32. Bunce, M.; Rosendo, S.; Brown, K. Perceptions of climate change, multiple stressors and livelihoods on marginal African coasts. Environ. Dev. Sustain. 2010, 12, 407–440. [Google Scholar] [CrossRef]
  33. Chavanne, H.; Consortium, A.; Janssen, K.; Hofherr, J.; Contini, F.; Haffray, P.; Komen, H.; Nielsen, E.E.; Bargelloni, L. A comprehensive survey on selective breeding programs and seed market in the European aquaculture fish industry. Aquac. Int. 2016, 24, 1287–1307. [Google Scholar] [CrossRef]
  34. Greiner, R.; Patterson, L.; Miller, O. Motivations, risk perceptions and adoption of conservation practices by farmers. Agric. Syst. 2009, 99, 86–104. [Google Scholar] [CrossRef]
  35. Niles, M.T.; Lubell, M.; Haden, V.R. Perceptions and responses to climate policy risks among California farmers. Glob. Environ. Chang. 2013, 23, 1752–1760. [Google Scholar] [CrossRef] [Green Version]
  36. Smith, J.R.; Louis, W.R. Group norms and the attitude–behaviour relationship. Soc. Pers. Psychol. Comp. 2009, 3, 19–35. [Google Scholar] [CrossRef] [Green Version]
  37. Silvia, S.; Bryan, E.; Ringler, C.; Herrero, M.; Okoba, B. Climate change perception and adaptation of agro-pastoral communities in Kenya. Reg. Envir. Chang. 2012, 12, 791–802. [Google Scholar]
  38. Acosta-Michlik, L.; Espaldon, V. Assessing vulnerability of selected farming communities in the Philippines based on a behavioural model of agent’s adaptation to global environmental change. Reg. Envir. Chang. 2008, 18, 554–563. [Google Scholar] [CrossRef]
  39. Kährik, A.; Leetmaa, K.; Tammaru, T. Residential decision-making and satisfaction among new suburbanites in the Tallinn urban region, Estonia. Cities 2012, 29, 49–58. [Google Scholar] [CrossRef]
  40. Conway, T.M.; Vander Vecht, J. Growing a diverse urban forest: Species selection decisions by practitioners planting and supplying trees. Landsc. Urban Plan. 2015, 138, 1–10. [Google Scholar] [CrossRef]
  41. Chen, C.; Chou, S.Y.; Thornton, R.J. The effect of household technology on weight and health outcomes among Chinese adults: Evidence from China’s “Home Appliances Going to the Countryside” policy. J. Hum. Cap. 2015, 9, 364–401. [Google Scholar] [CrossRef]
  42. Below, T.B.; Mutabazi, K.D.; Kirschke, D.; Franke, C.; Sieber, S.; Siebert, R.; Tscherning, K. Can farmers’ adaptation to climate change be explained by socio-economic household-level variables? Glob. Environ. Chang. 2012, 22, 223–235. [Google Scholar] [CrossRef]
  43. Manandhar, S.; Vogt, D.S.; Perret, S.R.; Kazama, F. Adapting cropping systems to climate change in Nepal: A cross-regional study of farmers’ perception and practices. Reg. Envir. Chang. 2011, 11, 335–348. [Google Scholar] [CrossRef]
  44. Slegers, M.F.W. “If only it would rain”: Farmers’ perceptions of rainfall and drought in semi-arid central Tanzania. J. Arid. Environ. 2008, 72, 2106–2123. [Google Scholar] [CrossRef]
  45. Hammad, A.A.; Børresen, T. Socioeconomic factors affecting farmers’ perceptions of land degradation and stonewall terraces in Central Palestine. Environ. Manag. 2006, 37, 380–394. [Google Scholar] [CrossRef]
  46. Wan, J.; Song, X.; Su, Y.; Peng, L.; Khatiwada, S.P.; Zhou, Y.; Deng, W. Water Resource Utilization and Livelihood Adaptations under the Background of Climate Change: A Case Study of Rural Households in the Koshi River Basin. Sustainability 2019, 11, 5064. [Google Scholar] [CrossRef] [Green Version]
  47. Cheng, L.; Liu, Y.; Brown, G.; Searle, G. Factors affecting farmers’ satisfaction with contemporary China’s land allocation policy–The Link Policy: Based on the empirical research of Ezhou. Habitat Int. 2018, 75, 38–49. [Google Scholar] [CrossRef]
  48. Brown, J.D. Likert items and scales of measurement. Statistics 2011, 15, 10–14. [Google Scholar]
  49. Solomon, T.B.; Snyman, H.A.; Smit, G.N. Cattle-rangeland management practices and perceptions of pastoralists towards rangeland degradation in the Borana zone of southern Ethiopia. J. Environ. Manag. 2007, 82, 481–494. [Google Scholar] [CrossRef]
  50. Subramanian, N.; Gunasekaran, A.; Yu, J.; Cheng, J.; Ning, K. Customer satisfaction and competitiveness in the Chinese E-retailing: Structural equation modeling (SEM) approach to identify the role of quality factors. Expert Syst. Appl. 2014, 41, 69–80. [Google Scholar] [CrossRef]
  51. Nusair, K.; Hua, N. Comparative assessment of structural equation modeling and multiple regression research methodologies: E-commerce context. Tour. Manag. 2010, 31, 314–324. [Google Scholar] [CrossRef]
  52. Yang, C.; Nay, S.; Hoyle, R.H. Three approaches to using lengthy ordinal scales in structural equation models: Parceling, latent scoring, and shortening scales. Appl. Psychol. Meas. 2010, 34, 122–142. [Google Scholar] [CrossRef] [PubMed] [Green Version]
  53. Agbo, A.A. Cronbach’s alpha: Review of limitations and associated recommendations. J. Psychol. Afr. 2010, 20, 233–239. [Google Scholar] [CrossRef]
  54. Sun, W.; Chou, C.-P.; Stacy, A.W.; Ma, H.; Unger, J.B.; Gallaher, P. SAS and SPSS macros to calculate standardized Cronbach’s alpha using the upper bound of the phi coefficient for dichotomous items. Behav. Res. 2007, 39, 71–81. [Google Scholar] [CrossRef] [Green Version]
  55. Ferdous, L.; Kafy, A.A.; Gafur, A.M.R.; Wakil, M.A. An analysis on influencing factors of rural housing and settlement pattern in Rajshahi, Bangladesh. LARP 2017, 2, 99–109. [Google Scholar]
  56. Yang, Q.; Zhang, F.; Jiang, Z.; Yuan, D.; Jiang, Y. Assessment of water resource carrying capacity in karst area of Southwest China. Environ Earth Sci. 2016, 37, 1–8. [Google Scholar] [CrossRef]
  57. Afrasiabian, A. The importance of protection and management of Karst water as drinking water resources in Iran. Environ. Geol. 2007, 52, 673–677. [Google Scholar] [CrossRef]
  58. Zhong, G.M.; Tang, Z.Z. Drinking water quality in rural areas in Guangxi Province, China. J. Environ. Health 2009, 26, 28–30. [Google Scholar]
  59. Gu, X.; Ma, T.; Wu, Y.; Wu, X. Hydrogeochemical characteristics of groundwater in the Karst region, southwest China. Proc. Earth. Planet. Sci. 2017, 17, 245–248. [Google Scholar] [CrossRef]
  60. Peng, J.; Xu, Y.; Cai, Y.; Xiao, H. Climatic and anthropogenic drivers of land use/cover change in fragile karst areas of southwest China since the early 1970s: A case study on the Maotiaohe watershed. Environ. Earth Sci. 2011, 64, 2107–2118. [Google Scholar] [CrossRef]
  61. Manzeke, G.M.; Mapfumo, P.; Mtambanengwe, F.; Chikowo, R.; Tendayi, T.; Cakmak, I. Soil fertility management effects on maize productivity and grain zinc content in smallholder farming systems of Zimbabwe. Plant Soil 2012, 361, 57–69. [Google Scholar] [CrossRef]
  62. Lin, D.; Yu, H.; Lian, F.; Wang, J.-A.; Zhu, A.-X.; Yue, Y. Quantifying the hazardous impacts of human-induced land degradation on terrestrial ecosystems: A case study of karst areas of south China. Environ. Earth Sci. 2016, 75, 1127. [Google Scholar] [CrossRef]
  63. Zhang, Z.; Paudel, K.P. Policy improvements and farmers’ willingness to participate: Insights from the new round of China’s Sloping Land Conversion Program. Ecol. Econ. 2019, 162, 121–132. [Google Scholar] [CrossRef]
  64. Junfeng, L.I.; Lingyu, G.; Zuoxing, M.A. Residential satisfaction and its influencing factors of the residents choosing to live trans-Yangtze River. Geogr. Res. 2017, 36, 2383–2392. [Google Scholar]
Figure 1. Map of Huanjiang County and its townships.
Land 09 00134 g001
Figure 2. Model of the relationships between farmers’ satisfaction and their Ecological–Living–Productive spaces.
Land 09 00134 g002
Figure 3. Overall evaluation of satisfaction with Ecological–Living–Productive spaces.
Land 09 00134 g003
Figure 4. Estimated standardized path parameters of the Ecological–Living–Productive space satisfaction model.
Land 09 00134 g004
Table 1. Area and number of administrative villages in Huanjiang County townships in 2018.
Town NameSien TownDacai XiangShuiyuan TownLuoyang TownChuanshan TownXia’nan XiangDa’an XiangChangmei XiangMinglun TownDongxing TownLongyan XiangXunle Xiang
Number of administrative villages148131620117616111314
Area (km2)27,799.112,838.935,498.246,759.266,440.325,386.522,087.023,816.845,774.649,513.640,998.558,359.4
Table 2. Reliability and validity analysis.
Latent VariableObservation Variableα CoefficientKMO ValueBartlett
Approximate Χ2dfSignificance (p)
Living space satisfactionX1–X70.7240.769363.2581630.000
Production space satisfactionX8–X130.8210.742763.4981740.000
Ecological space satisfactionX14–X180.7730.809641.3472360.000
OverallX1–X140.7620.8441498.2455610.000
KMO: Kaiser–Meyer–Olkin; df: degree of freedom.
Table 3. Satisfaction scores for land spaces based on farmers’ attributes.
ItemsFarmer Household AttributesPercentage (%)Overall Satisfaction Living Space Satisfaction Ecological Space Satisfaction Production Space Satisfaction
Household income level (CNY/Year)20,000 and less23.32.9023.0463.2292.431
20,000–50,00040.33.2943.5733.1973.112
50,000–100,00028.93.2643.4683.3512.973
100,000 and more7.53.4713.6633.6813.069
GenderMale59.43.2683.5033.2143.087
Female40.63.1983.4963.0913.007
Education levelElementary school and below14.93.1023.4823.2332.591
Junior high school47.32.9763.1432.8912.894
Senior middle school31.53.475 3.6733.6913.061
University and above6.33.379 3.5643.4953.078
Age25 and below8.63.2813.4853.5612.797
26–4025.33.1613.507 3.4752.501
41–6036.83.2873.6953.1772.989
60 and above29.33.2033.4153.1693.025
Household size(person)3 and below21.43.1963.2193.3353.034
4–557.93.2733.5573.4912.771
6–813.13.1873.2693.2272.765
9 and more7.63.2763.3053.2723.251
Household locationMiddle Mountain19.43.0763.3833.5662.279
Low-lying land37.93.0913.678 3.5982.297
Valley42.73.5323.7063.4393.453
Table 4. Exploratory factor analysis of Ecological–Living–Productive spaces.
Latent VariableObservation VariableStandardized Coefficient LoadError VariationComposite ReliabilityAverage Variance Decimation
(AVE)
Living space satisfactionRoad traffic0.5890.4380.7270.307
Home comfort 0.3580.361
Neighborhood relationships0.7500.476
Domestic water supply0.5020.298
Domestic sewage treatment0.5230.705
Ability to see a doctor0.6130.813
Market shopping convenience0.7020.472
Production space satisfactionCultivated land quantity0.6540.3170.6990.287
Cultivated land fertility0.4760.461
Cultivated land access0.4420.607
Agricultural facilities0.5320.578
Job opportunities0.4710.441
Irrigation water0.5640.392
Ecological space satisfactionRocky desertification0.7110.4390.6210.364
River water quality0.4330.573
Flood and waterlogging0.3910.641
Garbage disposal0.5350.324
Vegetation cover0.6260.517
Table 5. Combined test of survey validity.
Observed Variables Factor Loadings
Component 1Component 2Component 3
Road traffic0.7360.0130.160
Home comfort 0.8150.1490.043
Neighborhood relationships0.5120.2140.081
Domestic water supply0.8070.1210.112
Domestic sewage treatment0.7780.2350.217
Ability to see a doctor0.4490.0420.141
Market shopping convenience0.7220.193 0.217
Cultivated land quantity0.235 0.7570.037
Cultivated land fertility0.1880.5320.128
Cultivated land access0.1810.7610.052
Agricultural facilities0.0730.8110.034
Job opportunities0.2140.4230.120
Irrigation water0.3690.7970.201
Rocky desertification0.2160.0780.765
River water quality0.1240.0230.496
Flood and waterlogging0.1030.0720.658
Garbage disposal0.2410.1650.798
Vegetation cover0.2070.2530.590
Eigenvalue17.2685.6974.021
Variance (%)39.45213.7618.957
Cumulative variance(%)39.45253.21362.170
Extraction method: principal component analysis

