Modeling the Impact of Urbanization on Land-Use Change in Bahir Dar City, Ethiopia: An Integrated Cellular Automata–Markov Chain Approach

 ,
,  ,
,  and
and
Abstract
1. Introduction
2. Materials and Methods
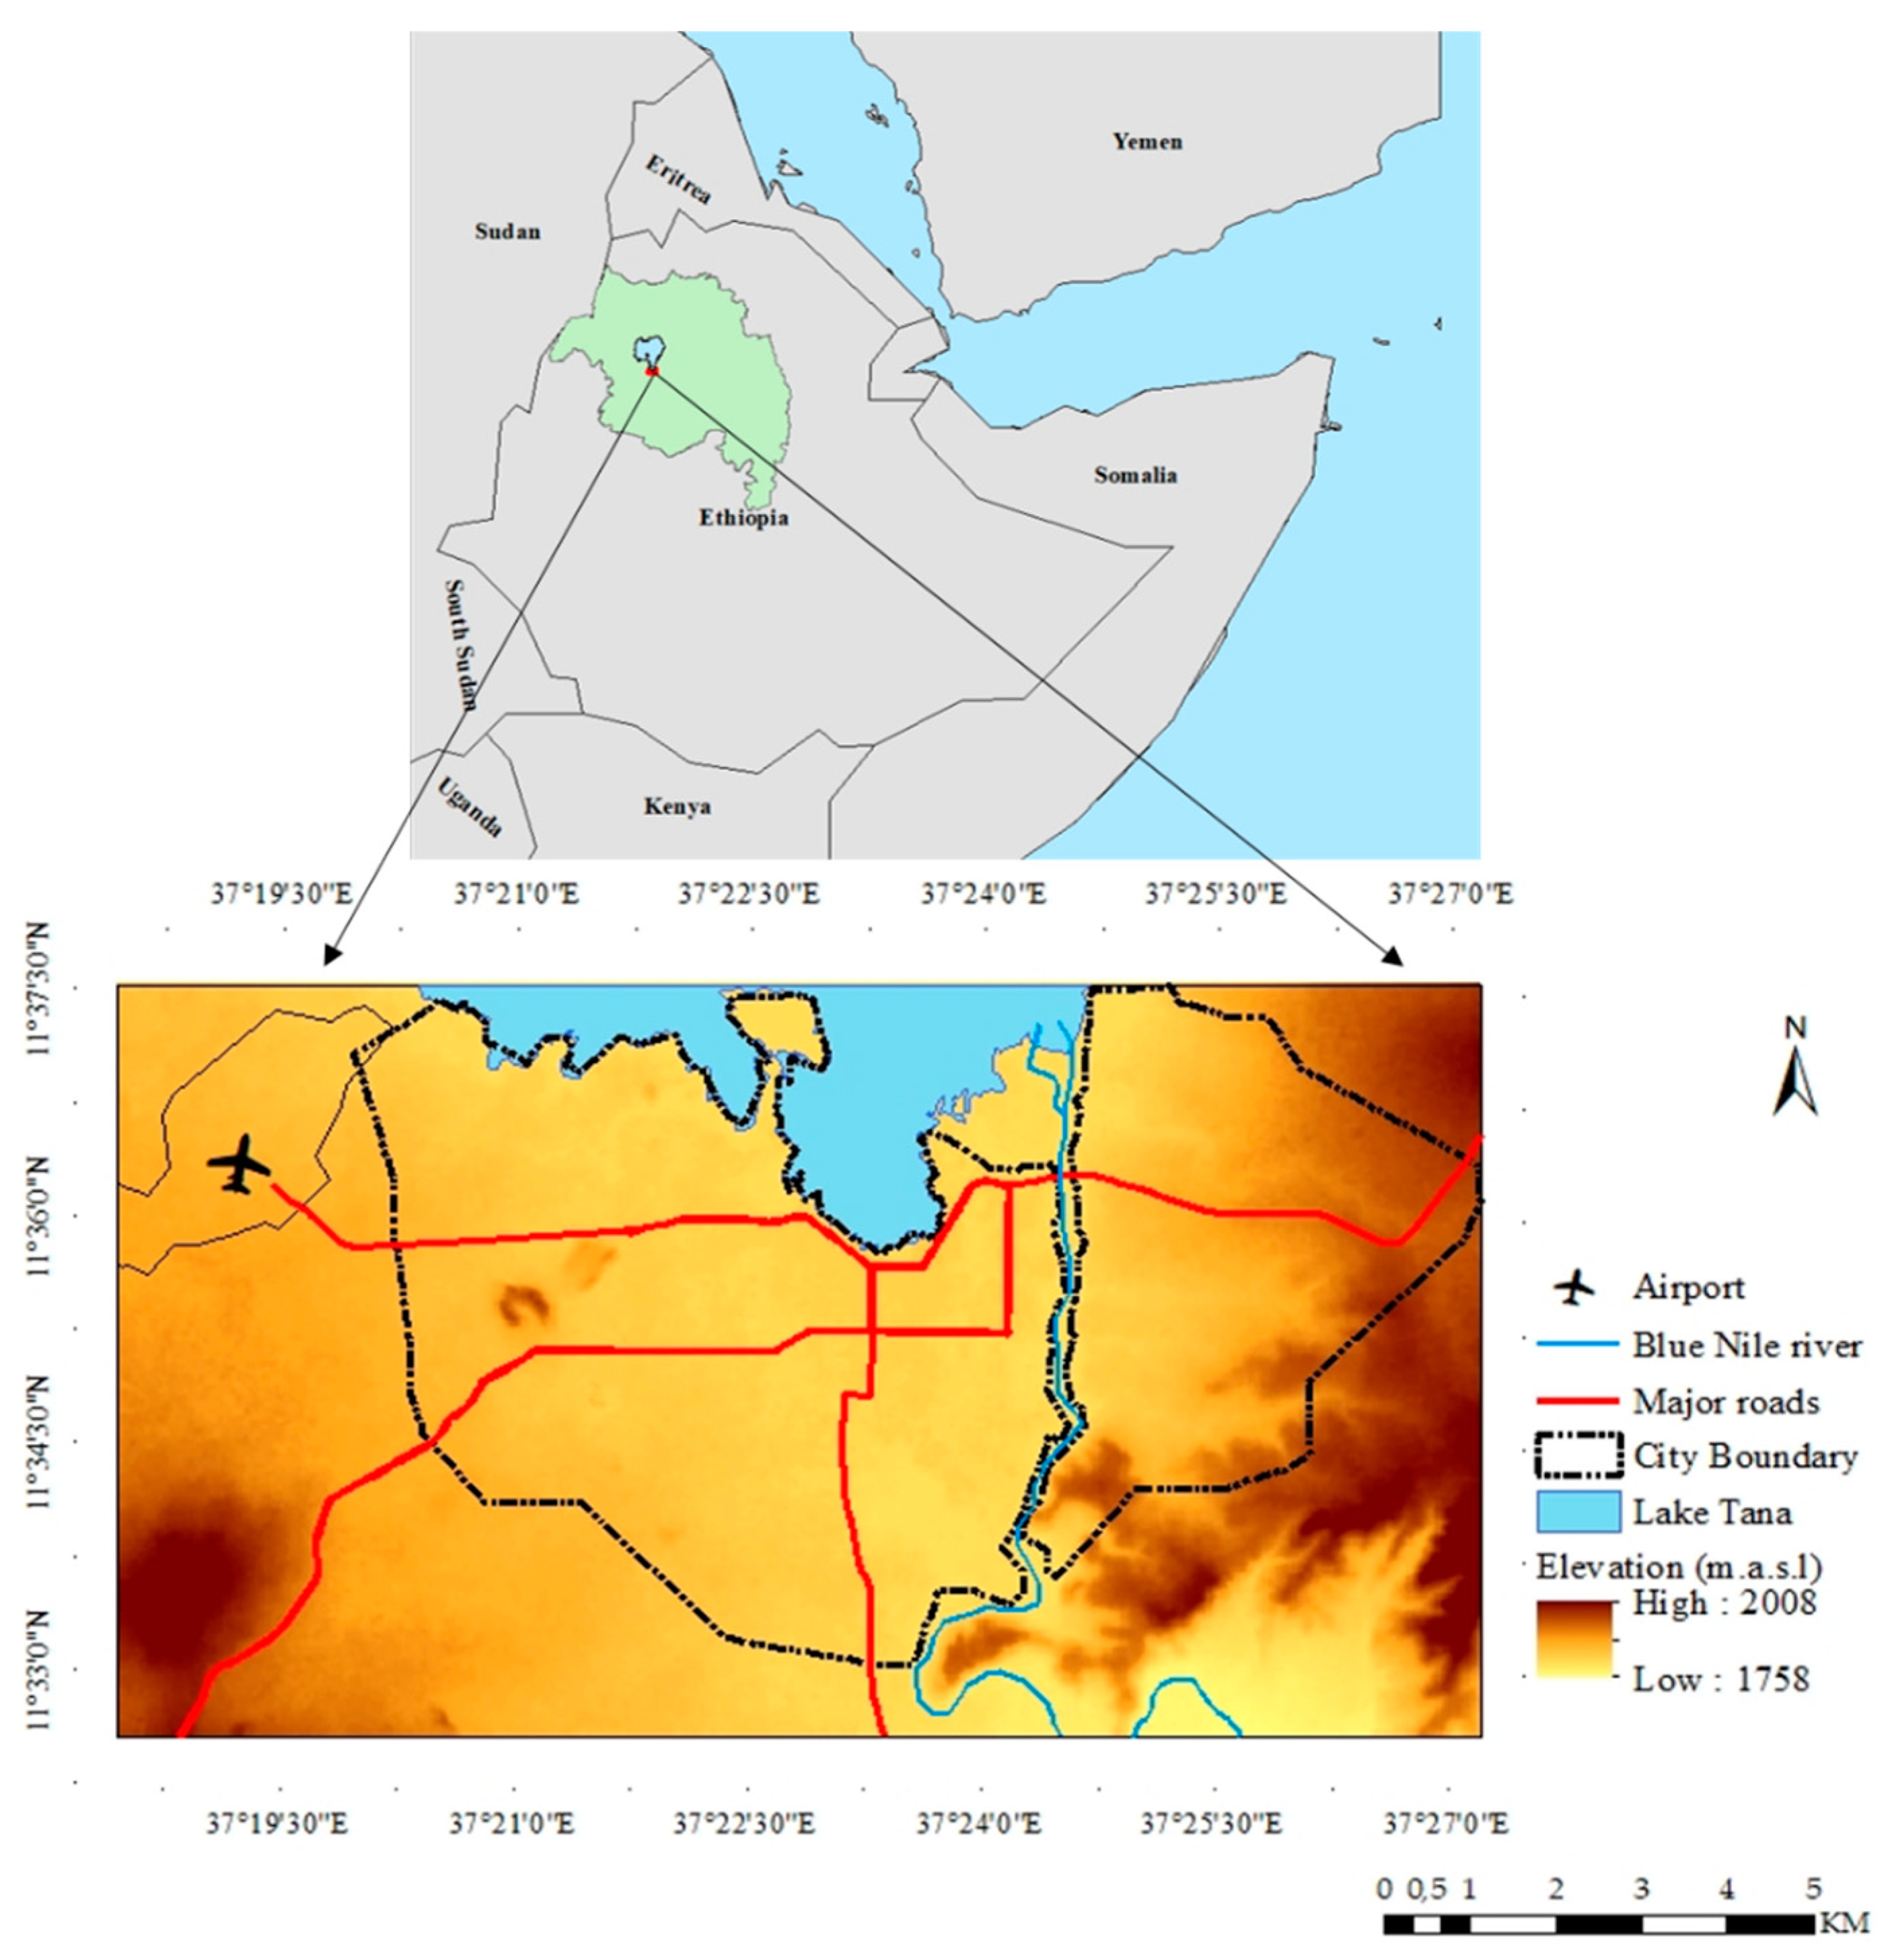
2.1. Study Area
2.2. Data Sources
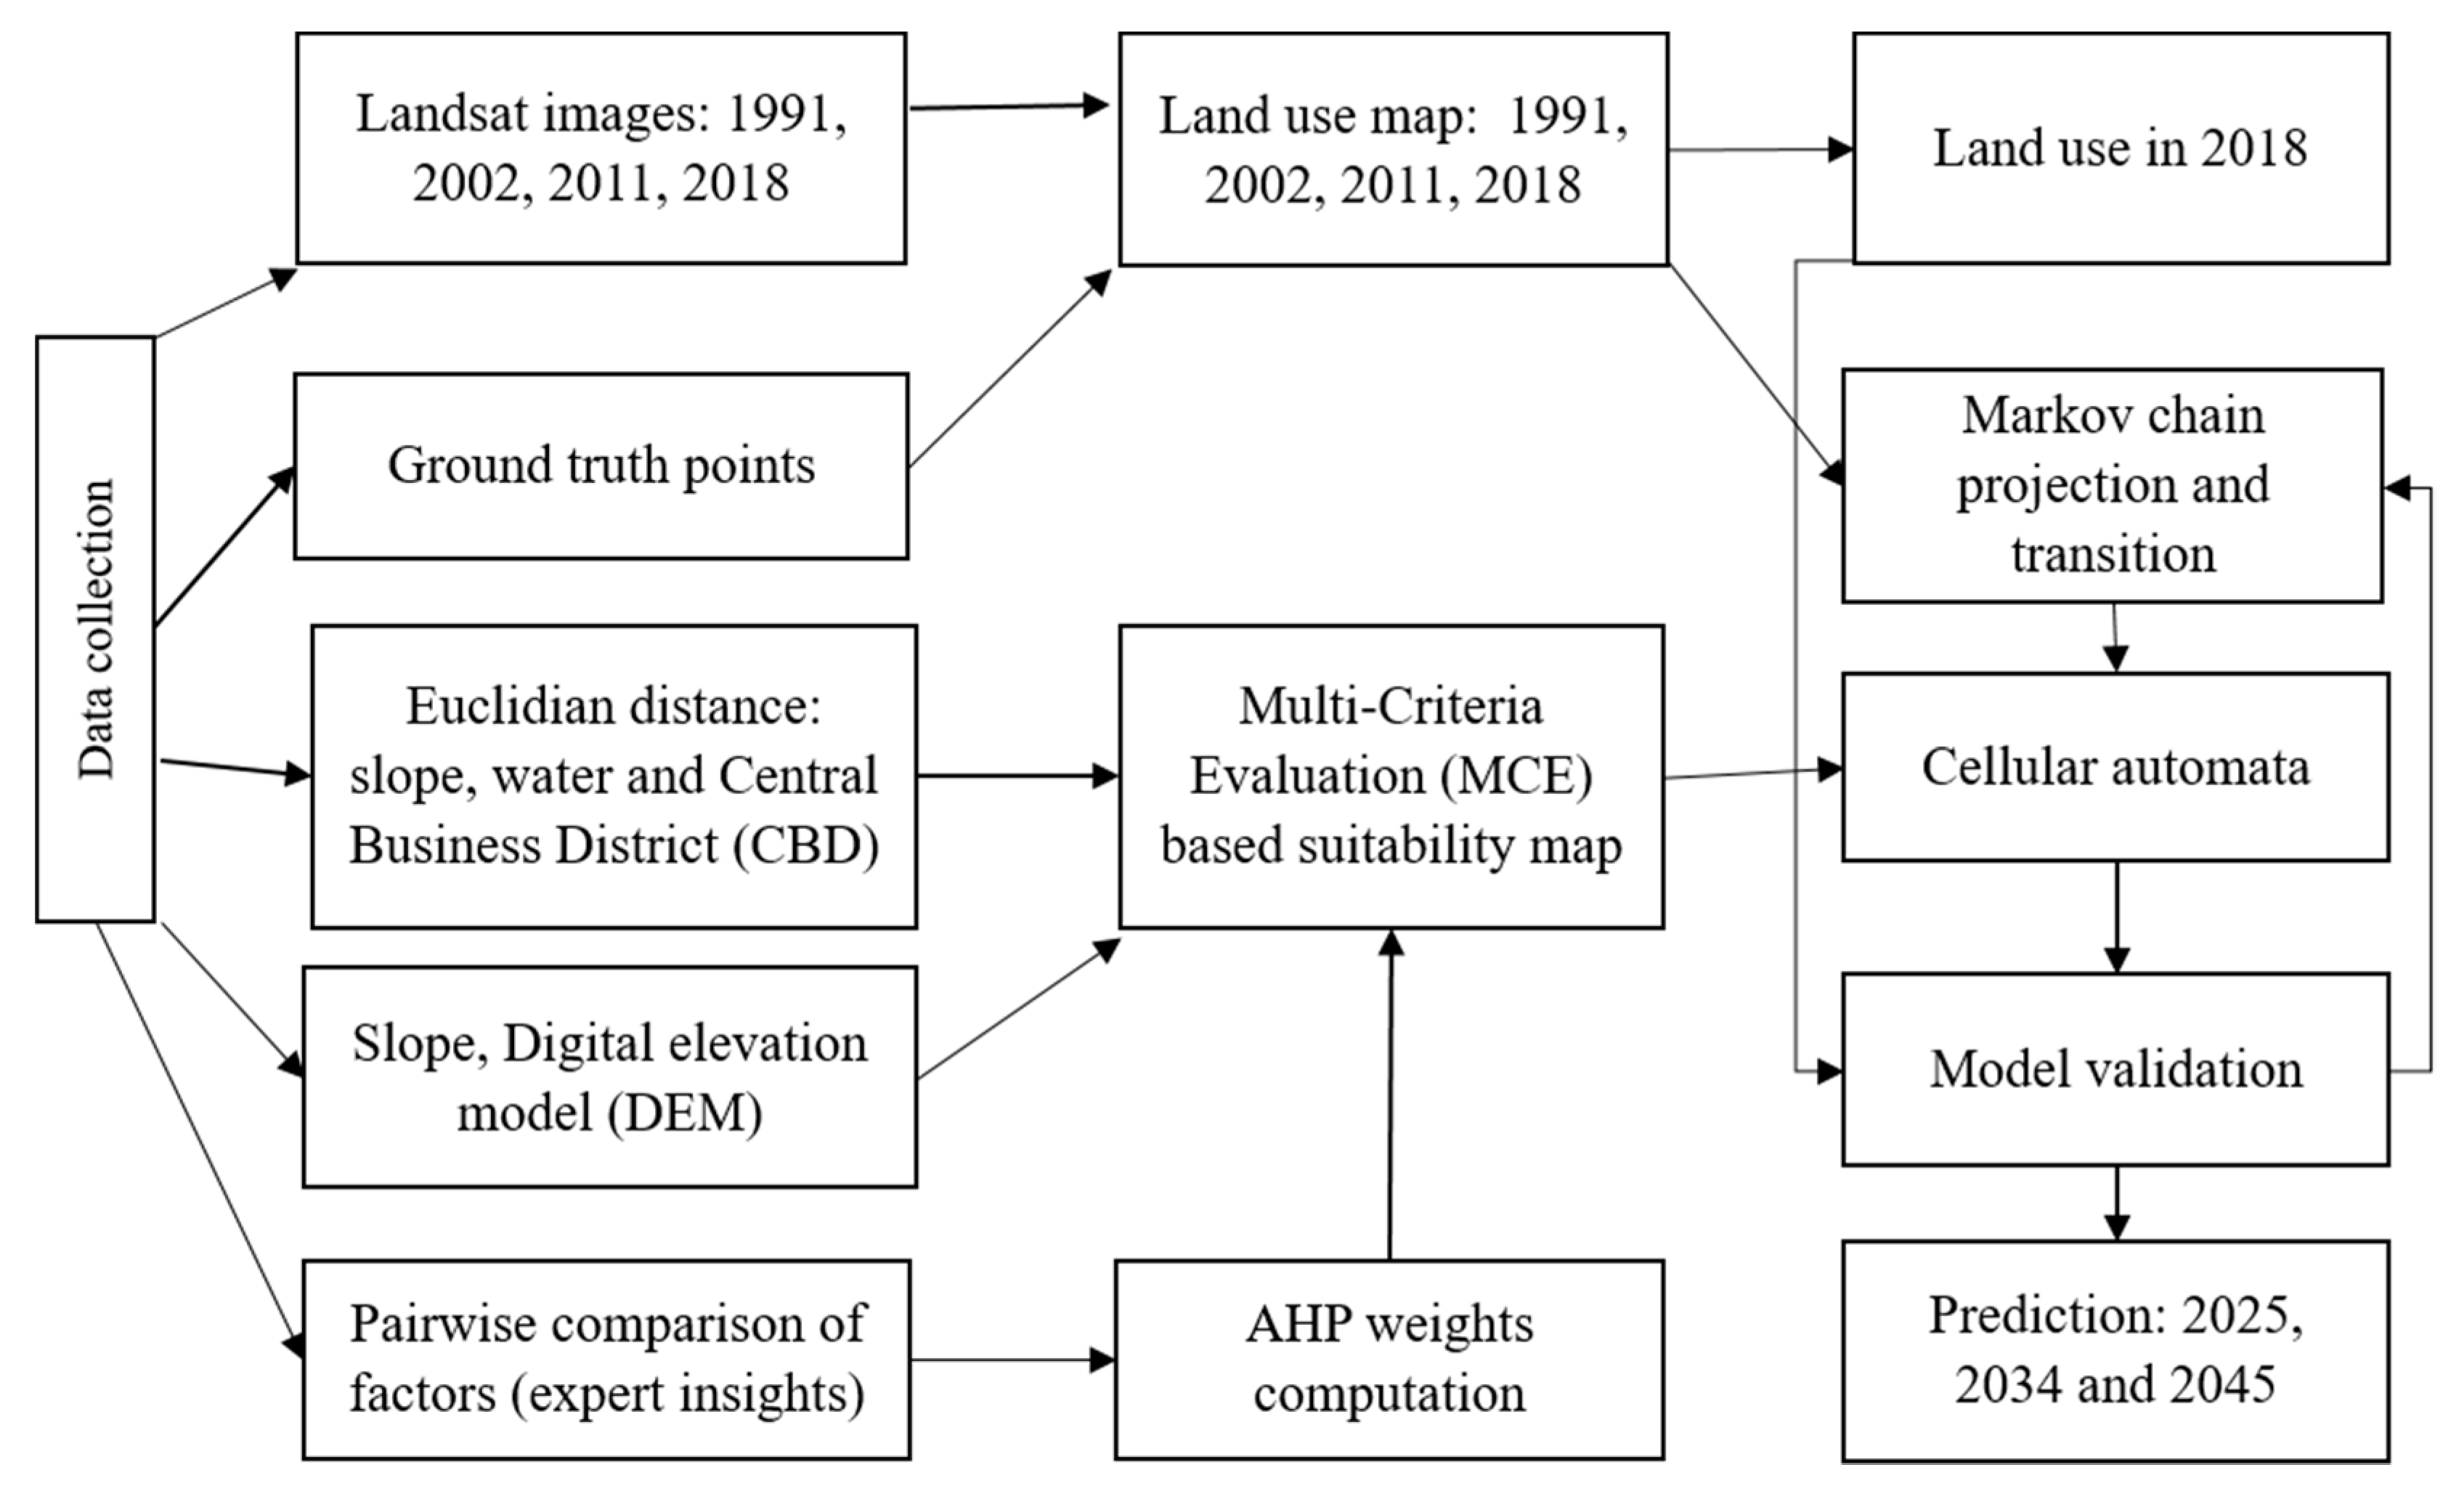
2.3. Methods
2.4. Land Use Classification
2.5. Urban Growth Model
2.5.1. Cellular Automata (CA) Model
2.5.2. Markov Chain (MC) Model
2.5.3. Integrated CA–MC Urban Growth Model
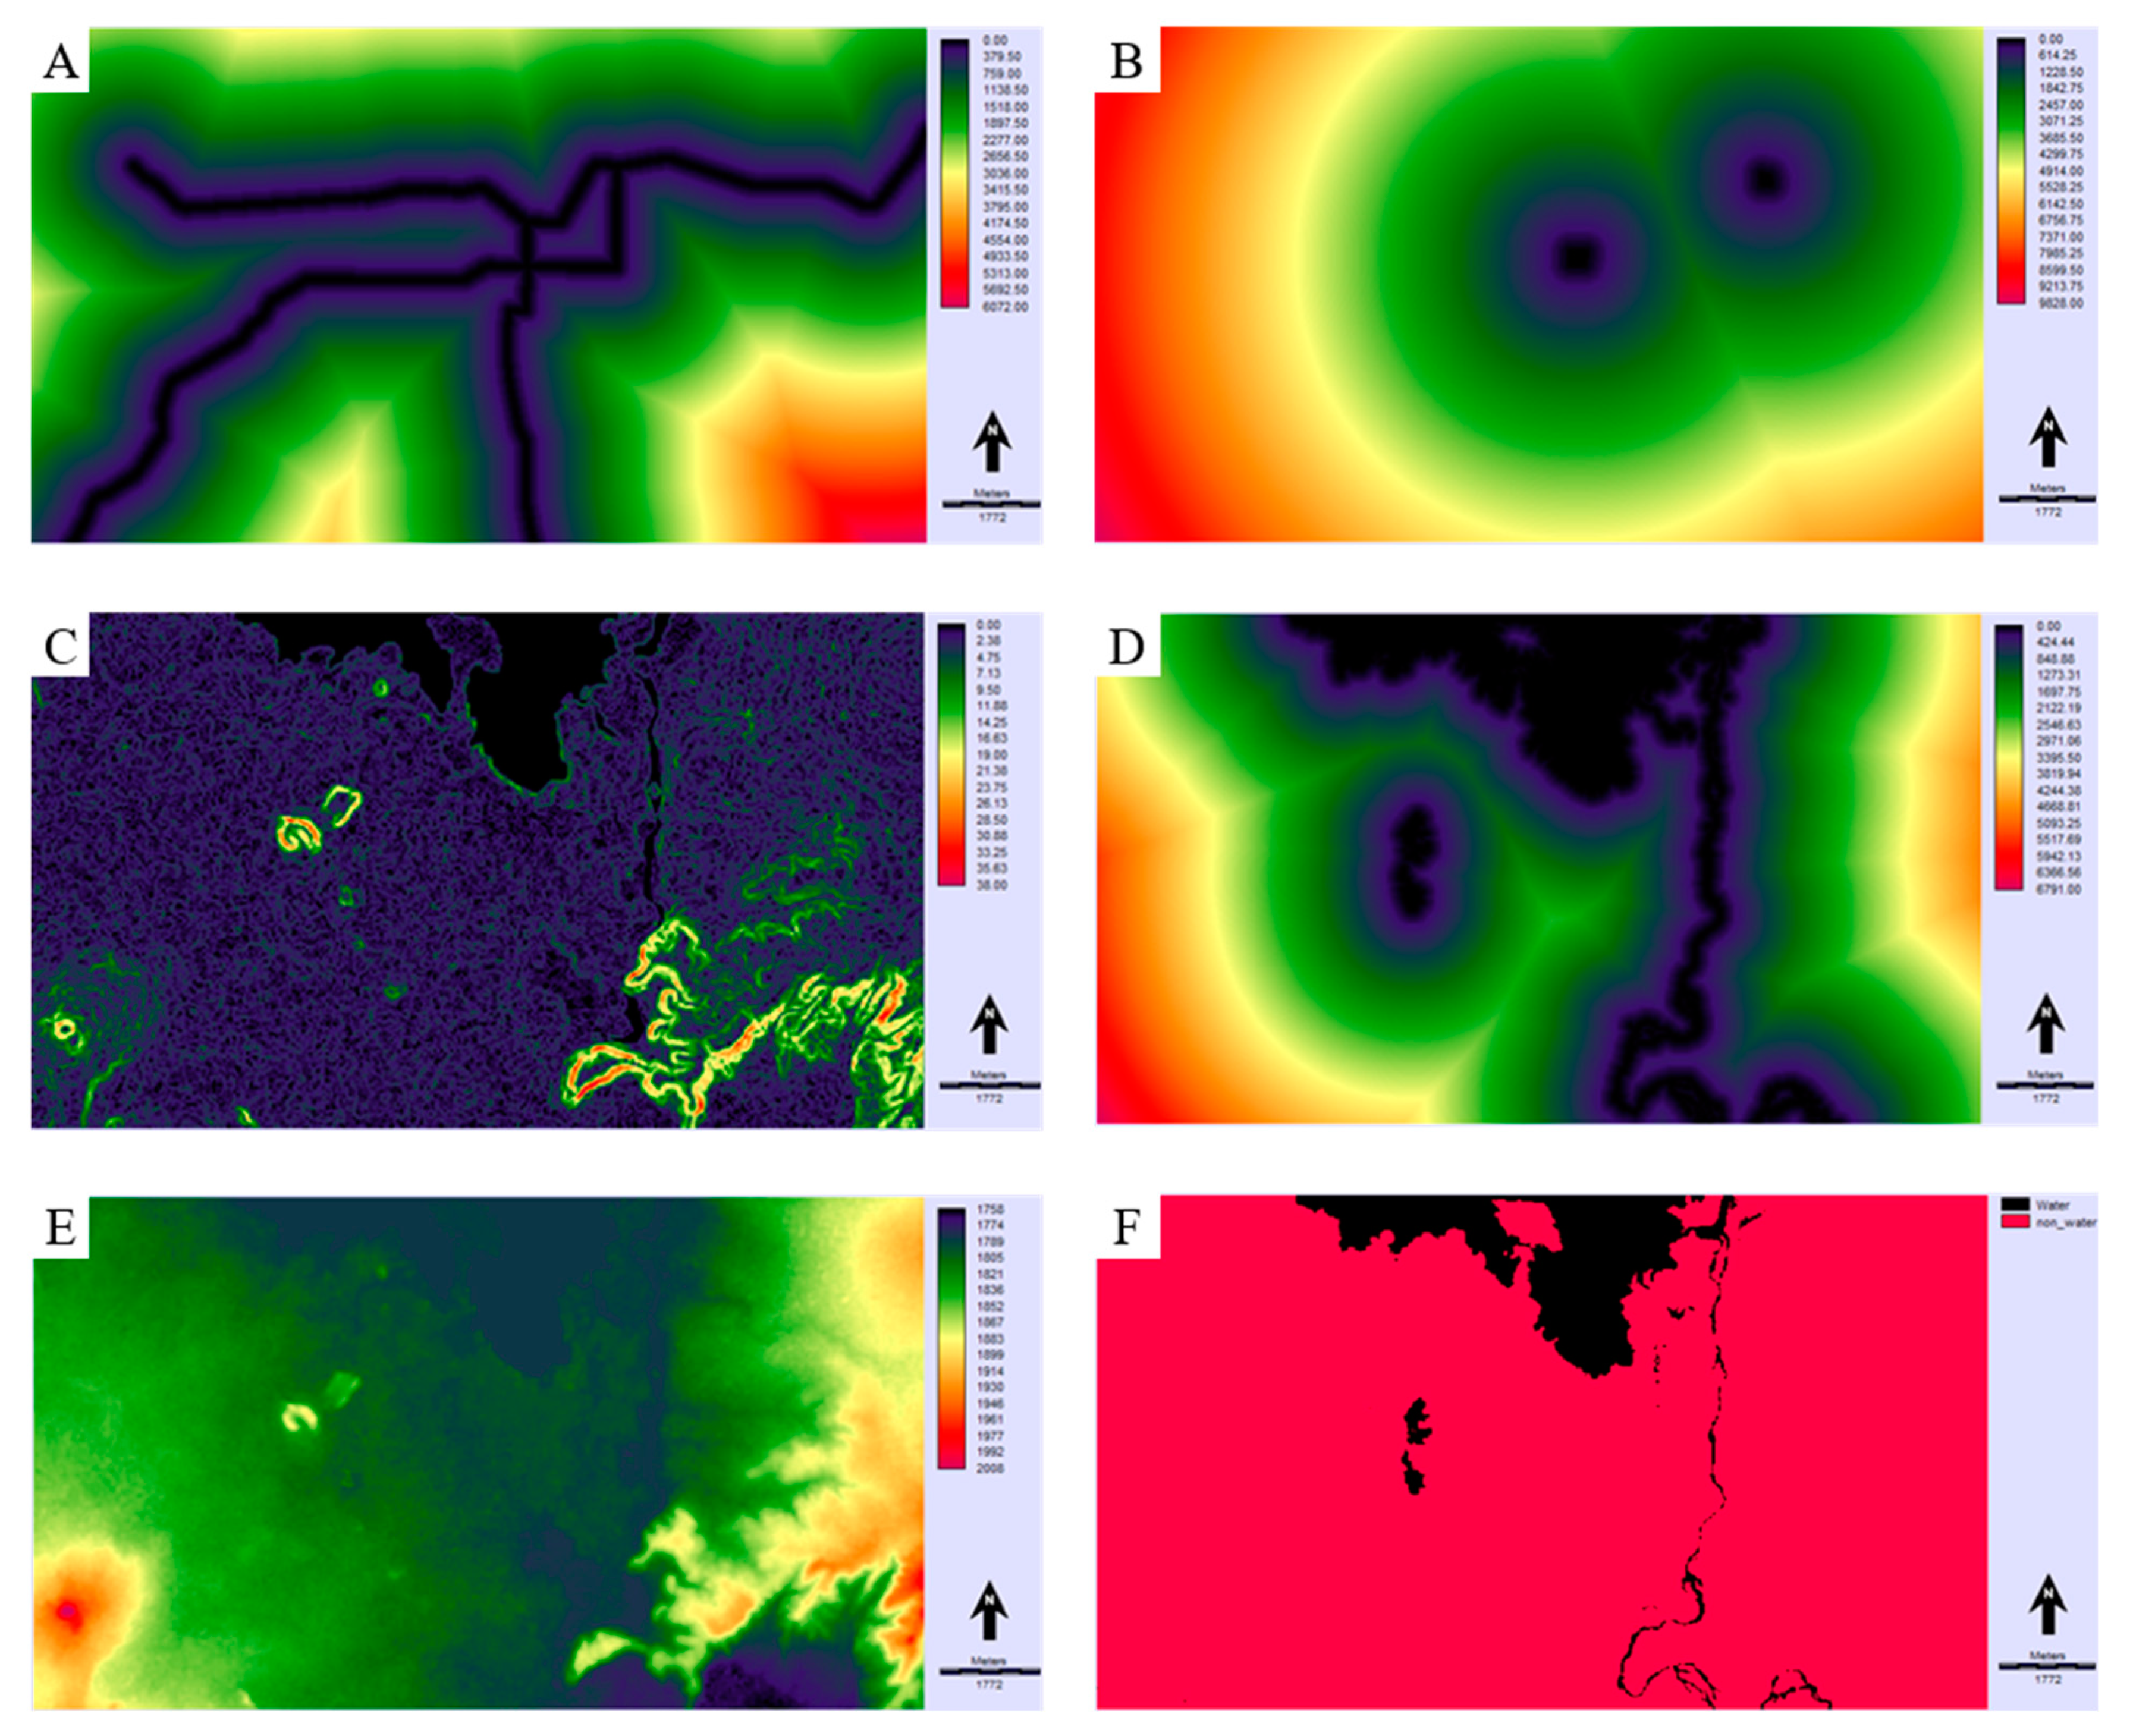
2.5.4. Analytical Hierarchy Process
2.6. Model Calibration and Validation
3. Results
3.1. Classification Accuracy
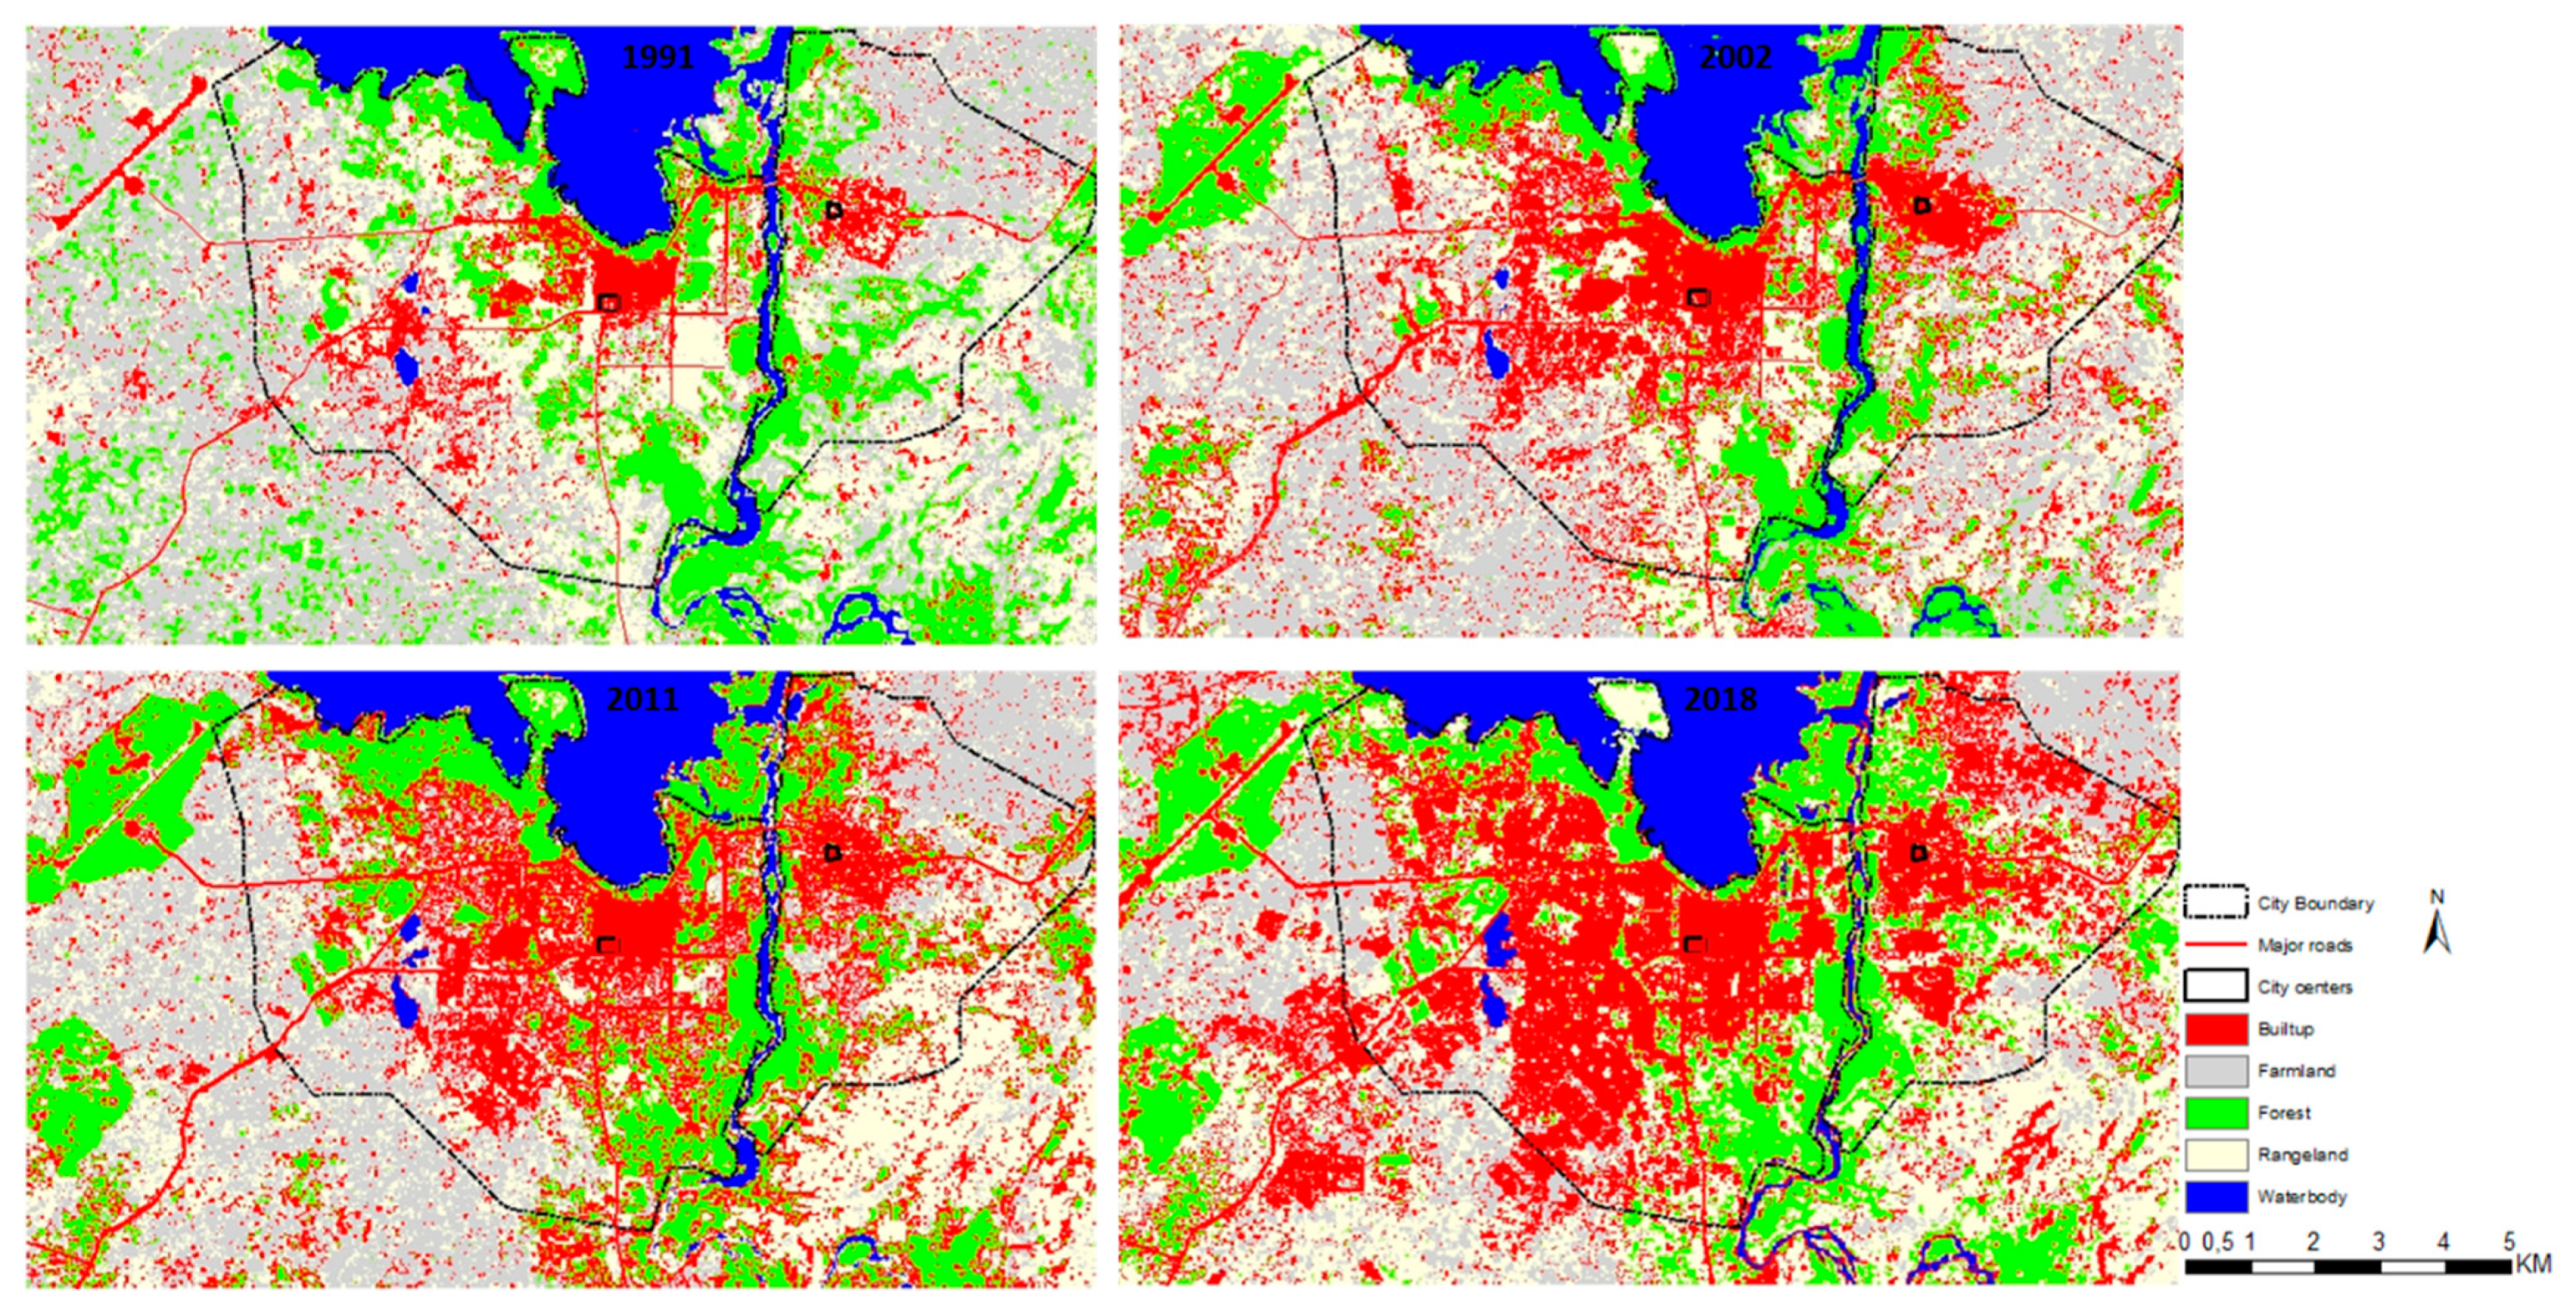
3.2. Temporal Land-Use Changes
3.3. Factors of Urban Expansion
3.4. Markov Chain Transition Probabilities
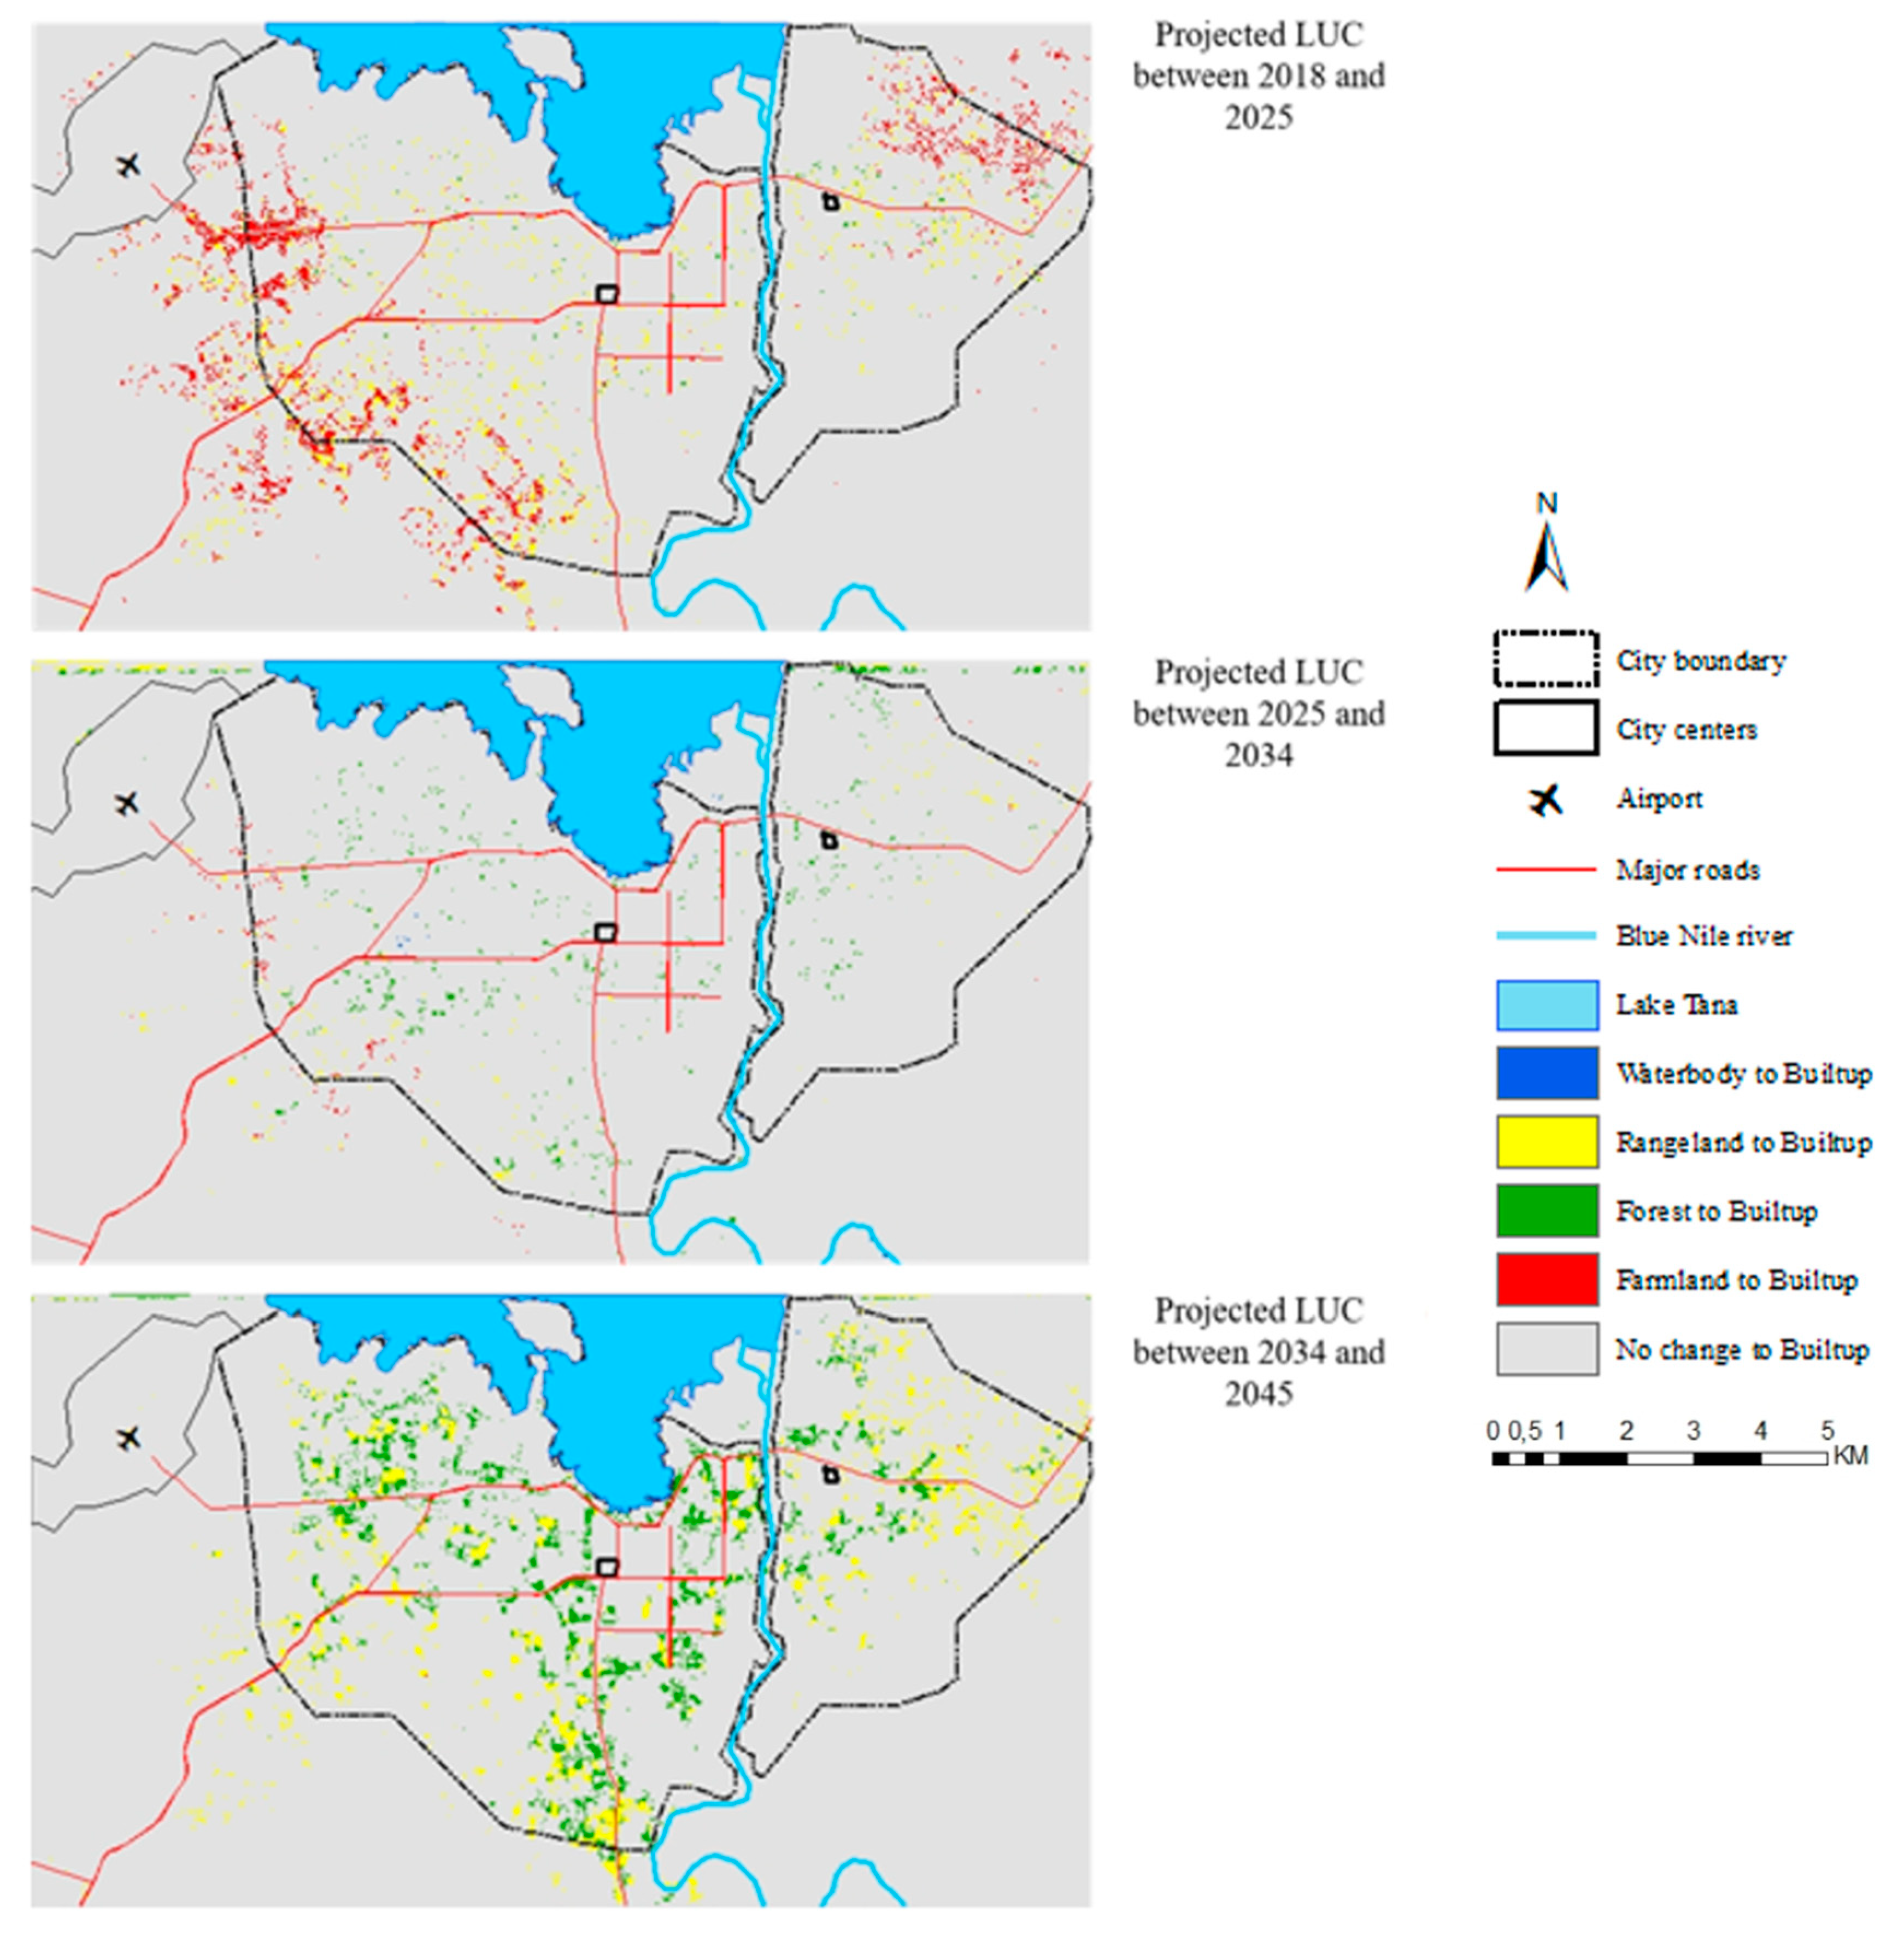
3.5. Integrated CA–MC Model Implementation and Validation
4. Discussion
5. Conclusions
Author Contributions
Funding
Acknowledgments
Conflicts of Interest
References
- Deep, S.; Saklani, A. Urban sprawl modeling using cellular automata. Egypt. J. Remote Sens. Space Sci. 2014, 17, 179–187. [Google Scholar] [CrossRef]
- Tang, J.; Di, L. Past and Future Trajectories of Farmland Loss Due to Rapid Urbanization Using Landsat Imagery and the Markov-CA Model: A Case Study of Delhi, India. Remote Sens. 2019, 11, 180. [Google Scholar] [CrossRef]
- Xu, G.; Dong, T.; Cobbinah, P.B.; Jiao, L.; Sumari, N.S.; Chai, B.; Liu, Y. Urban expansion and form changes across African cities with a global outlook: Spatiotemporal analysis of urban land densities. J. Clean. Prod. 2019, 224, 802–810. [Google Scholar] [CrossRef]
- Arsanjani, J.J.; Helbich, M.; Kainz, W.; Boloorani, A.D. Integration of logistic regression, Markov chain and cellular automata models to simulate urban expansion. Int. J. Appl. Earth Obs. Geoinf. 2012, 21, 265–275. [Google Scholar] [CrossRef]
- Bren d’Amour, C.; Reitsma, F.; Baiocchi, G.; Barthel, S.; Güneralp, B.; Erb, K.-H.; Haberl, H.; Creutzig, F.; Seto, K.C. Future urban land expansion and implications for global croplands. Proc. Natl. Acad. Sci. USA 2017, 114, 8939–8944. [Google Scholar] [CrossRef]
- United Nations World Urbanization Prospects: The 2011 Revision; Desa: New York, NY, USA, 2012; p. 318.
- Güneralp, B.; Lwasa, S.; Masundire, H.; Parnell, S.; Seto, K.C.; Parnell, S.; Masundire, H.; Güneralp, B.; Lwasa, S. Urbanization in Africa: Challenges and opportunities for conservation. Environ. Res. Lett. 2017, 13, 015002. [Google Scholar] [CrossRef]
- Alqurashi, A.F.; Kumar, L.; Sinha, P. Urban land cover change modelling using time-series satellite images: A case study of urban growth in five cities of Saudi Arabia. Remote Sens. 2016, 8, 838. [Google Scholar] [CrossRef]
- Schweitzer, F. A growing urban problem. Nature 2006, 441, 815. [Google Scholar] [CrossRef]
- Barredo, J.I.; Demicheli, L. Urban sustainability in developing countries’ megacities: Modelling and predicting future urban growth in Lagos. Cities 2003, 20, 297–310. [Google Scholar] [CrossRef]
- Myers, G. African Cities: Alternative Visions of Urban Theory and Practice; Zed Books Ltd.: London, UK, 2011; ISBN 1780321333. [Google Scholar]
- Bisello, A.; Vettorato, D.; Stephens, R.; Elisei, P. Smart and Sustainable Planning for Cities and Regions; Springer Nature: Heidelberg, Germany, 2017; ISBN 9783319448992. [Google Scholar]
- Mosammam, H.M.; Nia, J.T.; Khani, H.; Teymouri, A.; Kazemi, M. Monitoring land use change and measuring urban sprawl based on its spatial forms: The case of Qom city. Egypt. J. Remote Sens. Space Sci. 2017, 20, 103–116. [Google Scholar]
- Rimal, B.; Zhang, L.; Keshtkar, H.; Wang, N.; Lin, Y. Monitoring and Modeling of Spatiotemporal Urban Expansion and Land-Use/Land-Cover Change Using Integrated Markov Chain Cellular Automata Model. ISPRS Int. J. Geo-Inf. 2017, 6, 288. [Google Scholar] [CrossRef]
- Gharbia, S.S.; Alfatah, S.A.; Gill, L.; Johnston, P.; Pilla, F. Land use scenarios and projections simulation using an integrated GIS cellular automata algorithms. Model. Earth Syst. Environ. 2016, 2, 151. [Google Scholar] [CrossRef]
- Halmy, M.W.A.; Gessler, P.E.; Hicke, J.A.; Salem, B.B. Land use/land cover change detection and prediction in the north-western coastal desert of Egypt using Markov-CA. Appl. Geogr. 2015, 63, 101–112. [Google Scholar] [CrossRef]
- Naghibi, F.; Delavar, M.R.; Pijanowski, B. Urban growth modeling using cellular automata with multi-temporal remote sensing images calibrated by the artificial bee colony optimization algorithm. Sensors (Switzerland) 2016, 16, 2122. [Google Scholar] [CrossRef]
- Nguyen, T.A.; Le, P.M.T.; Pham, T.M.; Hoang, H.T.T.; Nguyen, M.Q.; Ta, H.Q.; Phung, H.T.M.; Le, H.T.T.; Hens, L. Toward a sustainable city of tomorrow: A hybrid Markov–Cellular Automata modeling for urban landscape evolution in the Hanoi city (Vietnam) during 1990–2030. Environ. Dev. Sustain. 2019, 21, 429–446. [Google Scholar] [CrossRef]
- Berberoğlu, S.; Akin, A.; Clarke, K.C. Cellular automata modeling approaches to forecast urban growth for adana, Turkey: A comparative approach. Landsc. Urban Plan. 2016, 153, 11–27. [Google Scholar] [CrossRef]
- Haregeweyn, N.; Fikadu, G.; Tsunekawa, A.; Tsubo, M.; Meshesha, D.T. The dynamics of urban expansion and its impacts on land use/land cover change and small-scale farmers living near the urban fringe: A case study of Bahir Dar, Ethiopia. Landsc. Urban Plan. 2012, 106, 149–157. [Google Scholar] [CrossRef]
- Singh, S.K.; Laari, P.B.; Mustak, S.; Srivastava, P.K.; Szabó, S. Modelling of land use land cover change using earth observation data-sets of Tons River Basin, Madhya Pradesh, India. Geocarto Int. 2017, 6049, 1–21. [Google Scholar] [CrossRef]
- Jafari, M.; Majedi, H.; Monavari, S.; Alesheikh, A.; Kheirkhah Zarkesh, M. Dynamic Simulation of Urban Expansion Based on Cellular Automata and Logistic Regression Model: Case Study of the Hyrcanian Region of Iran. Sustainability 2016, 8, 810. [Google Scholar] [CrossRef]
- Amini Parsa, V.; Salehi, E. Spatio-temporal analysis and simulation pattern of land use/cover changes, case study: Naghadeh, Iran. J. Urban Manag. 2016, 5, 43–51. [Google Scholar] [CrossRef]
- Shafizadeh Moghadam, H.; Helbich, M. Spatiotemporal urbanization processes in the megacity of Mumbai, India: A Markov chains-cellular automata urban growth model. Appl. Geogr. 2013, 40, 140–149. [Google Scholar] [CrossRef]
- Jokar Arsanjani, J.; Fibæk, C.S.; Vaz, E. Development of a cellular automata model using open source technologies for monitoring urbanisation in the global south: The case of Maputo, Mozambique. Habitat Int. 2018, 71, 38–48. [Google Scholar] [CrossRef]
- Kamusoko, C.; Aniya, M.; Adi, B.; Manjoro, M. Rural sustainability under threat in Zimbabwe—Simulation of future land use/cover changes in the Bindura district based on the Markov-cellular automata model. Appl. Geogr. 2009, 29, 435–447. [Google Scholar] [CrossRef]
- Fu, X.; Wang, X.; Yang, Y.J. Deriving suitability factors for CA-Markov land use simulation model based on local historical data. J. Environ. Manag. 2018, 206, 10–19. [Google Scholar] [CrossRef] [PubMed]
- Zhang, Q.; Ban, Y.; Liu, J.; Hu, Y. Simulation and analysis of urban growth scenarios for the Greater Shanghai Area, China. Comput. Environ. Urban Syst. 2011, 35, 126–139. [Google Scholar] [CrossRef]
- Guan, D.; Li, H.; Inohae, T.; Su, W.; Nagaie, T.; Hokao, K. Modeling urban land use change by the integration of cellular automaton and Markov model. Ecol. Model. 2011, 222, 3761–3772. [Google Scholar] [CrossRef]
- Lu, Q.; Chang, N.B.; Joyce, J.; Chen, A.S.; Savic, D.A.; Djordjevic, S.; Fu, G. Exploring the potential climate change impact on urban growth in London by a cellular automata-based Markov chain model. Comput. Environ. Urban Syst. 2018, 68, 121–132. [Google Scholar] [CrossRef]
- Aburas, M.M.; Ho, Y.M.; Ramli, M.F.; Ash’aari, Z.H. The simulation and prediction of spatio-temporal urban growth trends using cellular automata models: A review. Int. J. Appl. Earth Obs. Geoinf. 2016, 52, 380–389. [Google Scholar] [CrossRef]
- Mundia, C.N.; Murayama, Y. Modeling Spatial Processes of Urban Growth in African Cities: A Case Study of Nairobi City. Urban Geogr. 2010, 31, 259–272. [Google Scholar] [CrossRef]
- Agyemang, F.S.K.K.; Silva, E. Simulating the urban growth of a predominantly informal Ghanaian city-region with a cellular automata model: Implications for urban planning and policy. Appl. Geogr. 2019, 105, 15–24. [Google Scholar] [CrossRef]
- UN-Habitat. Urbanization and Development: Emerging Futures; UN-Habitat: Nairobi, Kenya, 2016; ISBN 9789211333954. [Google Scholar]
- United Nations. World Population Prospects: The 2012 Revision. Econ. Soc. Aff. 2013, 27, 800–812. [Google Scholar]
- Lambin, E.F.; Meyfroidt, P. Global land use change, economic globalization, and the looming land scarcity. Proc. Natl. Acad. Sci. USA 2011, 108, 3465–3472. [Google Scholar] [CrossRef] [PubMed]
- Central Statistical Agency. Population Projection of Ethiopia for All Regions At Wereda Level from 2014–2017. J. Ethnobiol. Ethnomed. 2013, 3, 28. [Google Scholar]
- Anderson, J.R. A Land Use and Land Cover Classification System for Use with Remote Sensor Data; USGS: Reston, VA, USA, 1978; p. 37.
- Fathizad, H.; Rostami, N.; Faramarzi, M. Detection and prediction of land cover changes using Markov chain model in semi-arid rangeland in western Iran. Environ. Monit. Assess. 2015, 187, 629. [Google Scholar] [CrossRef] [PubMed]
- Cobbinah, P.B.; Erdiaw-Kwasie, M.O.; Amoateng, P. Africa’s urbanisation: Implications for sustainable development. Cities 2015, 47, 62–72. [Google Scholar] [CrossRef]
- Batty, M. Cities and Complexity: Understanding Cities with Cellular Automata, Agent-Based Models, and Fractals; The MIT Press: Cambridge, MA, USA, 2007; ISBN 0262524791. [Google Scholar]
- Hu, Z.; Lo, C.P. Modeling urban growth in Atlanta using logistic regression. Comput. Environ. Urban Syst. 2007, 31, 667–688. [Google Scholar] [CrossRef]
- Santé, I.; García, A.M.; Miranda, D.; Crecente, R. Cellular automata models for the simulation of real-world urban processes: A review and analysis. Landsc. Urban Plan. 2010, 96, 108–122. [Google Scholar] [CrossRef]
- Wahyudi, A.; Liu, Y. Cellular automata for urban growth modelling. Int. Rev. Spat. Plan. Sustain. Dev. 2016, 4, 60–75. [Google Scholar] [CrossRef]
- Benenson, I.; Torrens, P.M. Geographic Automata Systems: A New Paradigm for Integrating GIS and Geographic Simulation. GeoComputation 2003, 2003, 24–30. [Google Scholar]
- White, R.; Engelen, G. Cellular Automata and Fractal Urban Form: A Cellular Modelling Approach to the Evolution of Urban Land-Use Patterns. Environ. Plan. A Econ. Space 1993, 25, 1175–1199. [Google Scholar] [CrossRef]
- Ghosh, P.; Mukhopadhyay, A.; Chanda, A.; Mondal, P.; Akhand, A.; Mukherjee, S.; Nayak, S.K.K.; Ghosh, S.; Mitra, D.; Ghosh, T.; et al. Application of Cellular automata and Markov-chain model in geospatial environmental modeling—A review. Remote Sens. Appl. Soc. Environ. 2017, 5, 64–77. [Google Scholar] [CrossRef]
- White, R.; Engelen, G.; Uljee, I. The use of constrained cellular automata for high-resolution modelling of urban land-use dynamics. Environ. Plan. B Plan. Des. 1997, 24, 323–343. [Google Scholar] [CrossRef]
- White, R.; Engelen, G. High-resolution integrated modelling of the spatial dynamics of urban and regional systems. Comput. Environ. Urban Syst. 2000, 24, 383–400. [Google Scholar] [CrossRef]
- Batty, M.; Couclelis, H.; Eichen, M. Urban Systems as Cellular Automata. Environ. Plan. B Plan. Des. 1997, 24, 159–164. [Google Scholar] [CrossRef]
- Mondal, M.S.; Sharma, N.; Kappas, M.; Garg, P.K. Modeling of spatio-temporal dynamics of land use and land cover in a part of Brahmaputra River basin using Geoinformatic techniques. Geocarto Int. 2013, 28, 632–656. [Google Scholar] [CrossRef]
- Hamdy, O.; Zhao, S.; Osman, T.; Salheen, M.; Eid, Y. Applying a Hybrid Model of Markov Chain and Logistic Regression to Identify Future Urban Sprawl in Abouelreesh, Aswan: A Case Study. Geosciences 2016, 6, 43. [Google Scholar] [CrossRef]
- Liu, Y.; He, Q.; Tan, R.; Liu, Y.; Yin, C. Modeling different urban growth patterns based on the evolution of urban form: A case study from Huangpi, Central China. Appl. Geogr. 2016, 66, 109–118. [Google Scholar] [CrossRef]
- Park, S.; Jeon, S.; Kim, S.; Choi, C. Landscape and Urban Planning Prediction and comparison of urban growth by land suitability index mapping using GIS and RS in South Korea. Landsc. Urban Plan. 2011, 99, 104–114. [Google Scholar] [CrossRef]
- Aburas, M.M.; Ho, Y.M.; Ramli, M.F.; Ash’aari, Z.H. Improving the capability of an integrated CA-Markov model to simulate spatio-temporal urban growth trends using an Analytical Hierarchy Process and Frequency Ratio. Int. J. Appl. Earth Obs. Geoinf. 2017, 59, 65–78. [Google Scholar] [CrossRef]
- Saaty, T.L. A scaling method for priorities in hierarchical structures. J. Math. Psychol. 1977, 15, 234–281. [Google Scholar] [CrossRef]
- Barredo, J.I.; Demicheli, L.; Lavalle, C.; Kasanko, M.; McCormick, N. Modelling future urban scenarios in developing countries: An application case study in Lagos, Nigeria. Environ. Plan. B Plan. Des. 2004, 31, 65–84. [Google Scholar] [CrossRef]
- Ozturk, D. Urban growth simulation of Atakum (Samsun, Turkey) using cellular automata-Markov chain and Multi-layer Perceptron-Markov chain models. Remote Sens. 2015, 7, 5918–5950. [Google Scholar] [CrossRef]
- Eastman, J.R. IDRISI Kilimanjaro: Guide to GIS and Image Processing; Clark University: Worcester, MA, USA, 2003; Volume 1, pp. 87–131. [Google Scholar]
- Feng, Y.; Tong, X. Dynamic land use change simulation using cellular automata with spatially nonstationary transition rules. GIScience Remote Sens. 2018, 55, 678–698. [Google Scholar] [CrossRef]
- Han, Y.; Jia, H. Simulating the spatial dynamics of urban growth with an integrated modeling approach: A case study of Foshan, China. Ecol. Model. 2017, 353, 107–116. [Google Scholar] [CrossRef]
- Akın, A.; Sunar, F.; Berberoğlu, S.; Akin, A.; Sunar, F.; Berberoğlu, S.; Akın, A.; Sunar, F.; Berberoğlu, S. Urban change analysis and future growth of Istanbul. Environ. Monit. Assess. 2015, 187, 506. [Google Scholar] [CrossRef] [PubMed]
- McHugh, M.L. Lessons in biostatistics Interrater reliability: The kappa statistic. Biochem. Med. 2012, 22, 276–282. [Google Scholar] [CrossRef]
- Omar, N.Q.; Sanusi, S.A.M.; Hussin, W.M.W.; Samat, N.; Mohammed, K.S. Markov-CA model using analytical hierarchy process and multiregression technique. In Proceedings of the IOP Conference Series: Earth and Environmental Science, Kuala Lumpur, Malaysia, 22–23 April 2014; Volume 20. [Google Scholar]
- Pontius, R.G.; Millones, M. Death to Kappa: Birth of quantity disagreement and allocation disagreement for accuracy assessment. Int. J. Remote Sens. 2011, 32, 4407–4429. [Google Scholar] [CrossRef]
- Memarian, H.; Kumar Balasundram, S.; Bin Talib, J.; Teh Boon Sung, C.; Mohd Sood, A.; Abbaspour, K.; Balasundram, S.K.; Talib, J.B.; Teh, C.; Sung, B.; et al. Validation of CA-Markov for Simulation of Land Use and Cover Change in the Langat Basin, Malaysia. J. Geogr. Inf. Syst. 2012, 04, 542–554. [Google Scholar] [CrossRef]
- Foody, G.M. Status of land cover classification accuracy assessment. Remote Sens. Environ. 2002, 80, 185–201. [Google Scholar] [CrossRef]
- Gashaw, T.; Tulu, T.; Argaw, M.; Worqlul, A.W. Evaluation and prediction of land use/land cover changes in the Andassa watershed, Blue Nile Basin, Ethiopia. Environ. Syst. Res. 2017, 6, 17. [Google Scholar] [CrossRef]
- Adam, A.G.; Gashu, A. Informal settlements in the peri-urban areas of Bahir Dar, Ethiopia: An institutional analysis. Habitat Int. 2014, 43, 90–97. [Google Scholar] [CrossRef]
- Alemu, B.Y. Expropriation, valuation and compensation practice in Ethiopia: The case of Bahir Dar city and surrounding. Prop. Manag. 2013, 31, 132–158. [Google Scholar]
- Adam, A.G. Land Tenure in the Changing Peri-Urban Areas of Ethiopia: The Case of Bahir Dar City. Int. J. Urban Reg. Res. 2014, 38, 1970–1984. [Google Scholar] [CrossRef]
- Angel, S.; Sheppard, S.C.; Civco, D.L. The Dynamics of Global Urban Expansion; World Bank: Washington, DC, USA, 2005; p. 205. [Google Scholar]
- Seto, K.C.; Shepherd, J.M. Global urban land-use trends and climate impacts. Curr. Opin. Environ. Sustain. 2009, 1, 89–95. [Google Scholar] [CrossRef]
- Mundia, C.N.; Aniya, M. Analysis of land use/cover changes and urban expansion of Nairobi city using remote sensing and GIS. Int. J. Remote Sens. 2005, 26, 2831–2849. [Google Scholar] [CrossRef]
- Schneider, A.; Woodcock, C.E. Compact, dispersed, fragmented, extensive? A comparison of urban growth in twenty-five global cities using remotely sensed data, pattern metrics and census information. Urban Stud. 2008, 45, 659–692. [Google Scholar] [CrossRef]
- Seto, K.C.; Dhakal, S.; Bigio, A.; Blanco, H.; Delgado, G.C.; Dewar, D.; Huang, L.; Inaba, A.; Kansal, A.; Lwasa, S. Human Settlements, Infrastructure and Spatial Planning; Cambridge University Press: Cambridge, UK, 2014. [Google Scholar]
- Liu, Z.; Yang, Y.; He, C.; Tu, M. Climate change will constrain the rapid urban expansion in drylands: A scenario analysis with the zoned Land Use Scenario Dynamics-urban model. Sci. Total Environ. 2019, 651, 2772–2786. [Google Scholar] [CrossRef]
- Liu, X.; Derudder, B.; Wu, K. Measuring Polycentric Urban Development in China: An Intercity Transportation Network Perspective. Reg. Stud. 2016, 50, 1302–1315. [Google Scholar] [CrossRef]
- Liu, X.; Derudder, B.; Wang, M. Polycentric urban development in China: A multi-scale analysis. Environ. Plan. B Urban Anal. City Sci. 2018, 45, 953–972. [Google Scholar] [CrossRef]
- Meyfroidt, P.; Lambin, E.F.; Erb, K.H.; Hertel, T.W. Globalization of land use: Distant drivers of land change and geographic displacement of land use. Curr. Opin. Environ. Sustain. 2013, 5, 438–444. [Google Scholar] [CrossRef]
- Feuillet, T.; Charreire, H.; Menai, M.; Salze, P.; Simon, C.; Dugas, J.; Hercberg, S.; Andreeva, V.A.; Enaux, C.; Weber, C.; et al. Spatial heterogeneity of the relationships between environmental characteristics and active commuting: Towards a locally varying social ecological model. Int. J. Health Geogr. 2015, 14, 12. [Google Scholar] [CrossRef] [PubMed]
- Vermeiren, K.; Vanmaercke, M.; Beckers, J.; Van Rompaey, A. ASSURE: A model for the simulation of urban expansion and intra-urban social segregation. Int. J. Geogr. Inf. Sci. 2016, 30, 2377–2400. [Google Scholar] [CrossRef]


| Dataset | Date | Source | Resolution |
|---|---|---|---|
| Landsat 5 (Thematic Mapper) | 1991, 2011 | U.S. Geological Survey | 30 m |
| Landsat 7 (Enhanced Thematic Mapper Plus) | 2002 | ||
| Landsat 8 (Operational Land Imager) | 2018 | ||
| Digital Elevation Model (DEM), Slope | 2009 | ASTER (NASA) | 30 m |
| Road | 2013 | OpenStreetMap | vector |
| Land Use Classes | Description |
|---|---|
| Waterbodies | Lakes, stream courses, reservoirs, and waterbodies |
| Farmland | Arable croplands and other agricultural lands |
| Built-up areas (urban) | Commercial and residential areas, road, and continuous built environment |
| Rangeland | Mixed or grass-covered open areas, barren land, shrubs, and wetlands |
| Forest (vegetation) | Trees, shrubs, semi-natural vegetation, and deciduous forest |
| Value | Definition | Explanation |
|---|---|---|
| 1 | Equally preferred | Two factors are equally affecting the objective |
| 3 | Weak preference | One of the two factors is slightly favored |
| 5 | Strong preference | One of the two factors is strongly favored |
| 7 | Very strong preference | One of the two factors is very strongly favored |
| 9 | Absolute preference | One of the two factors is absolutely favored |
| 2, 4, 6, 8 | Intermediate preferences between the two neighboring values | The experts’ transitional judgments of between adjacent preferences. |
| Category | Year | |||
|---|---|---|---|---|
| 1991 | 2002 | 2011 | 2018 | |
| Waterbody | 1139 | 1059 | 1032 | 1079 |
| Farmland | 5695 | 5092 | 3888 | 2290 |
| Built-up | 1246 | 2708 | 3202 | 4343 |
| Rangeland | 3567 | 3385 | 3462 | 4024 |
| Forest (vegetation) | 2948 | 2350 | 3010 | 2858 |
| Period | Category | Waterbody | Farmland | Built-up | Rangeland | Forest |
|---|---|---|---|---|---|---|
| 2002–2011 for 2018 | Waterbody | 0.8054 | 0 | 0.0257 | 0.1463 | 0.0225 |
| Farmland | 0.0008 | 0.4197 | 0.1731 | 0.3415 | 0.0649 | |
| Built-up | 0 | 0.2018 | 0.4283 | 0.2216 | 0.1483 | |
| Rangeland | 0.0017 | 0.3267 | 0.1994 | 0.331 | 0.1411 | |
| Forest | 0.0155 | 0.0095 | 0.2516 | 0.0709 | 0.6525 | |
| 2011–2018 for 2025 | Waterbody | 0.7935 | 0 | 0.0945 | 0.043 | 0.069 |
| Farmland | 0.0004 | 0.3198 | 0.3635 | 0.2947 | 0.0216 | |
| Built-up | 0.0075 | 0.0559 | 0.4502 | 0.2918 | 0.1945 | |
| Rangeland | 0.0198 | 0.2186 | 0.3215 | 0.3957 | 0.0443 | |
| Forest | 0.0147 | 0.0021 | 0.149 | 0.2441 | 0.5901 | |
| 2002–2018 for 2034 | Waterbody | 0.7737 | 0 | 0.0974 | 0.0394 | 0.0895 |
| Farmland | 0.0034 | 0.2486 | 0.3273 | 0.3291 | 0.0917 | |
| Built-up | 0.0018 | 0.0822 | 0.4592 | 0.2857 | 0.1711 | |
| Rangeland | 0.003 | 0.1971 | 0.302 | 0.3443 | 0.1536 | |
| Forest | 0.0459 | 0.0032 | 0.1855 | 0.2172 | 0.5482 | |
| 1991–2018 for 2045 | Waterbody | 0.7454 | 0 | 0.0992 | 0.0423 | 0.1131 |
| Farmland | 0.0006 | 0.2319 | 0.3032 | 0.3149 | 0.1497 | |
| Built-up | 0.0155 | 0.1544 | 0.5034 | 0.2132 | 0.1135 | |
| Rangeland | 0.0073 | 0.1545 | 0.3839 | 0.2951 | 0.1592 | |
| Forest | 0.0142 | 0.0257 | 0.2474 | 0.3242 | 0.3884 |
| Land-Use Type | Predicted 2025 | Predicted 2034 | Predicted 2045 | |||
|---|---|---|---|---|---|---|
| Area (ha) | % | Area (ha) | % | Area (ha) | % | |
| Waterbody | 1034 | 7 | 1064 | 7 | 1072 | 7 |
| Farmland | 1739 | 12 | 1675 | 11 | 1869 | 12 |
| Built-up | 4846 | 33 | 4670 | 32 | 5276 | 36 |
| Rangeland | 4226 | 29 | 4009 | 27 | 3772 | 26 |
| Forest | 2752 | 19 | 3178 | 23 | 2608 | 19 |
© 2020 by the authors. Licensee MDPI, Basel, Switzerland. This article is an open access article distributed under the terms and conditions of the Creative Commons Attribution (CC BY) license (http://creativecommons.org/licenses/by/4.0/).
Share and Cite
Fitawok, M.B.; Derudder, B.; Minale, A.S.; Van Passel, S.; Adgo, E.; Nyssen, J. Modeling the Impact of Urbanization on Land-Use Change in Bahir Dar City, Ethiopia: An Integrated Cellular Automata–Markov Chain Approach. Land 2020, 9, 115. https://doi.org/10.3390/land9040115
Fitawok MB, Derudder B, Minale AS, Van Passel S, Adgo E, Nyssen J. Modeling the Impact of Urbanization on Land-Use Change in Bahir Dar City, Ethiopia: An Integrated Cellular Automata–Markov Chain Approach. Land. 2020; 9(4):115. https://doi.org/10.3390/land9040115
Chicago/Turabian StyleFitawok, Melaku Bogale, Ben Derudder, Amare Sewnet Minale, Steven Van Passel, Enyew Adgo, and Jan Nyssen. 2020. "Modeling the Impact of Urbanization on Land-Use Change in Bahir Dar City, Ethiopia: An Integrated Cellular Automata–Markov Chain Approach" Land 9, no. 4: 115. https://doi.org/10.3390/land9040115
APA StyleFitawok, M. B., Derudder, B., Minale, A. S., Van Passel, S., Adgo, E., & Nyssen, J. (2020). Modeling the Impact of Urbanization on Land-Use Change in Bahir Dar City, Ethiopia: An Integrated Cellular Automata–Markov Chain Approach. Land, 9(4), 115. https://doi.org/10.3390/land9040115